maintaining skeletal muscle through eccentric exercise
TRANSCRIPT
Brigham Young University Brigham Young University
BYU ScholarsArchive BYU ScholarsArchive
Theses and Dissertations
2019-12-01
Maintaining Skeletal Muscle Through Eccentric Exercise after Maintaining Skeletal Muscle Through Eccentric Exercise after
Bariatric Surgery: A Randomized Controlled Trial Bariatric Surgery: A Randomized Controlled Trial
Joshua Jed Kelley Brigham Young University
Follow this and additional works at: https://scholarsarchive.byu.edu/etd
Part of the Life Sciences Commons
BYU ScholarsArchive Citation BYU ScholarsArchive Citation Kelley, Joshua Jed, "Maintaining Skeletal Muscle Through Eccentric Exercise after Bariatric Surgery: A Randomized Controlled Trial" (2019). Theses and Dissertations. 7742. https://scholarsarchive.byu.edu/etd/7742
This Thesis is brought to you for free and open access by BYU ScholarsArchive. It has been accepted for inclusion in Theses and Dissertations by an authorized administrator of BYU ScholarsArchive. For more information, please contact [email protected], [email protected].
Maintaining Skeletal Muscle Through Eccentric Exercise After Bariatric Surgery:
A Randomized Controlled Trial
Joshua Jed Kelley
A thesis submitted to the faculty of Brigham Young University
in partial fulfillment of the requirements for the degree of
Master of Science
Lance E. Davidson, Chair James D. LeCheminant
James D. George
Department of Exercise Sciences
Brigham Young University
Copyright © 2019 Joshua Jed Kelley
All Rights Reserved
ABSTRACT
Maintaining Skeletal Muscle Through Eccentric Exercise After Bariatric Surgery: A Randomized Controlled Trial
Joshua Jed Kelley Department of Exercise Sciences, BYU
Master of Science
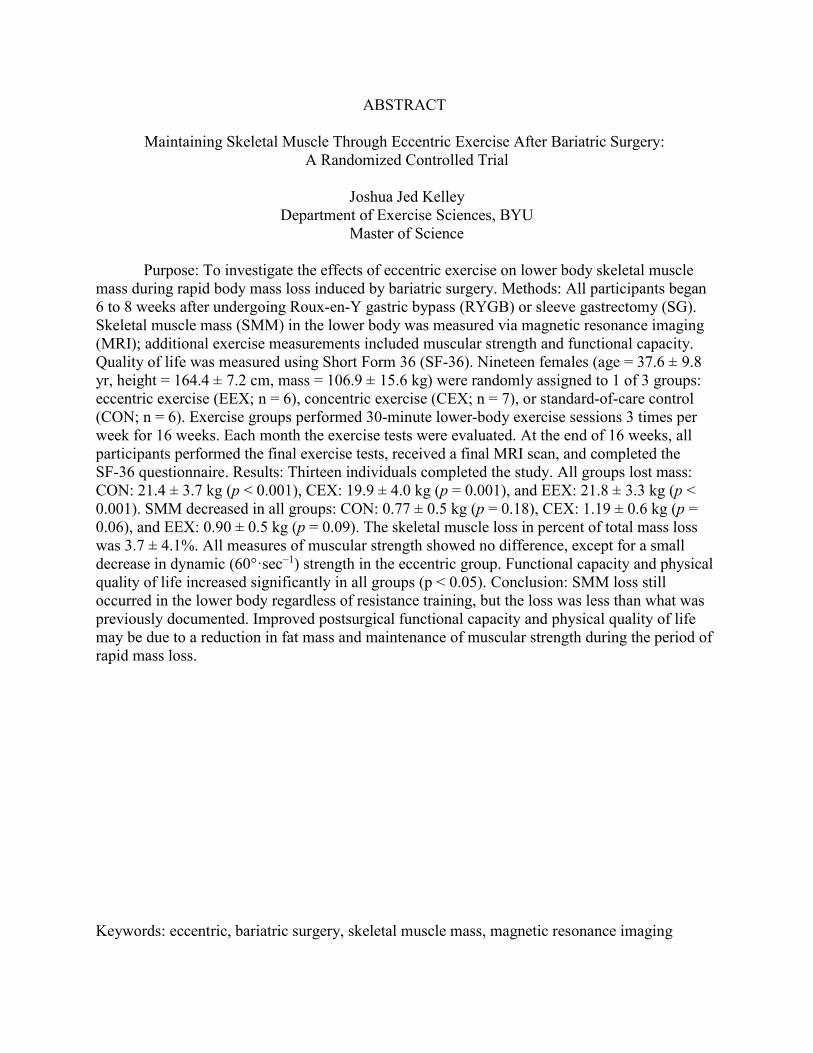
Purpose: To investigate the effects of eccentric exercise on lower body skeletal muscle mass during rapid body mass loss induced by bariatric surgery. Methods: All participants began 6 to 8 weeks after undergoing Roux-en-Y gastric bypass (RYGB) or sleeve gastrectomy (SG). Skeletal muscle mass (SMM) in the lower body was measured via magnetic resonance imaging (MRI); additional exercise measurements included muscular strength and functional capacity. Quality of life was measured using Short Form 36 (SF-36). Nineteen females (age = 37.6 ± 9.8 yr, height = 164.4 ± 7.2 cm, mass = 106.9 ± 15.6 kg) were randomly assigned to 1 of 3 groups: eccentric exercise (EEX; n = 6), concentric exercise (CEX; n = 7), or standard-of-care control (CON; n = 6). Exercise groups performed 30-minute lower-body exercise sessions 3 times per week for 16 weeks. Each month the exercise tests were evaluated. At the end of 16 weeks, all participants performed the final exercise tests, received a final MRI scan, and completed the SF-36 questionnaire. Results: Thirteen individuals completed the study. All groups lost mass: CON: 21.4 ± 3.7 kg (p < 0.001), CEX: 19.9 ± 4.0 kg (p = 0.001), and EEX: 21.8 ± 3.3 kg (p < 0.001). SMM decreased in all groups: CON: 0.77 ± 0.5 kg (p = 0.18), CEX: 1.19 ± 0.6 kg (p = 0.06), and EEX: 0.90 ± 0.5 kg (p = 0.09). The skeletal muscle loss in percent of total mass loss was 3.7 ± 4.1%. All measures of muscular strength showed no difference, except for a small decrease in dynamic (60°·sec−1) strength in the eccentric group. Functional capacity and physical quality of life increased significantly in all groups (p < 0.05). Conclusion: SMM loss still occurred in the lower body regardless of resistance training, but the loss was less than what was previously documented. Improved postsurgical functional capacity and physical quality of life may be due to a reduction in fat mass and maintenance of muscular strength during the period of rapid mass loss.
Keywords: eccentric, bariatric surgery, skeletal muscle mass, magnetic resonance imaging
ACKNOWLEDGMENTS
From faculty and students to family and friends, thanks to the many people who have
shaped my experience in this program and who have helped me along the way. First, I want to
thank my wife, Allissa, for her patience, her sacrifice, and her support. Her love and
encouragement have been a powerful force throughout my master’s degree. I am extremely
grateful for my thesis chair, Dr. Lance Davidson, who provided me with a life-changing research
opportunity during my undergraduate education, his readiness to be a mentor to me through my
master’s degree. He is kind, patient, hard-working, and has impacted my life more than he
knows. I also want to thank my committee members, Dr. James LeCheminant and Dr. James
George, for their invaluable input and their support throughout this process. Thank you to my
fellow graduate students for the friendships and memories. Lastly, I want to thank my parents for
supporting me in my academic and personal pursuits.
iv
Table of Contents
Title Page ......................................................................................................................................... i
ABSTRACT .................................................................................................................................... ii
ACKNOWLEDGMENTS ............................................................................................................. iii
Table of Contents ........................................................................................................................... iv
List of Tables ................................................................................................................................. vi
List of Figures ............................................................................................................................... vii
INTRODUCTION .......................................................................................................................... 1
METHODS ..................................................................................................................................... 3
Subjects ........................................................................................................................................... 3
Procedures ....................................................................................................................................... 4
Exercise Intervention .............................................................................................................. 4
Muscular Strength ................................................................................................................... 5
Magnetic Resonance Imaging ................................................................................................. 6
Functional Capacity ................................................................................................................ 7
Quality of Life ......................................................................................................................... 8
Statistical Analysis .......................................................................................................................... 8
RESULTS ....................................................................................................................................... 9
Anthropometrics ........................................................................................................................... 10
Skeletal Muscle Mass ................................................................................................................... 10
Muscular Strength ......................................................................................................................... 11
Functional Capacity ...................................................................................................................... 11
Quality of Life............................................................................................................................... 12
v
DISCUSSION ............................................................................................................................... 12
Skeletal Muscle ............................................................................................................................. 13
Muscular Strength ......................................................................................................................... 15
Functional Capacity ...................................................................................................................... 16
Six-Minute Walk Test ........................................................................................................... 16
Stand–Sit Test ....................................................................................................................... 17
Quality of Life............................................................................................................................... 18
Limitations .................................................................................................................................... 18
CONCLUSION ............................................................................................................................. 19
REFERENCES ............................................................................................................................. 21

vi
List of Tables
Table 1 Descriptive Characteristics of Subjects at Baseline ......................................................... 32
Table 2 Changes in Anthropometric, MRI, Strength, Functional Capacity, and Quality of Life . 33
Table 3 Functional Capacity ......................................................................................................... 34
vii
List of Figures
Figure 1 Flow Chart of Participant Selection. .............................................................................. 35
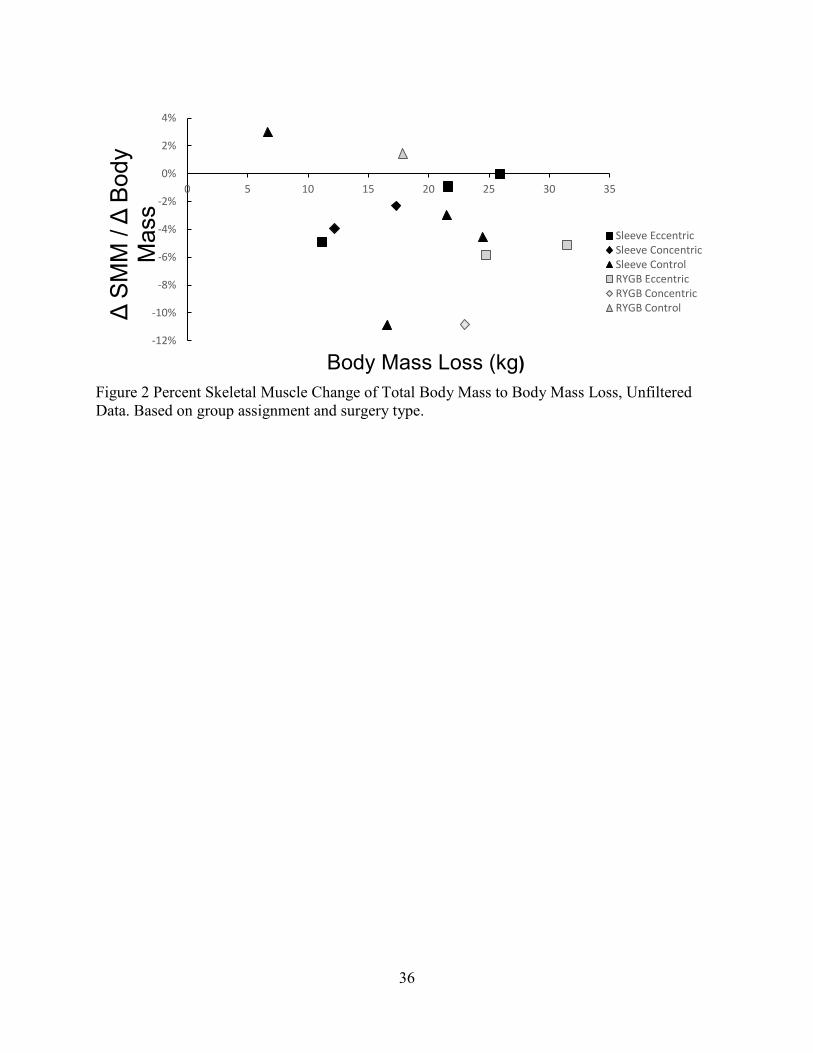
Figure 2 Percent Skeletal Muscle Change of Total Body Mass to Body Mass Loss, Unfiltered
Data. Based on group assignment and surgery type. ............................................................ 36
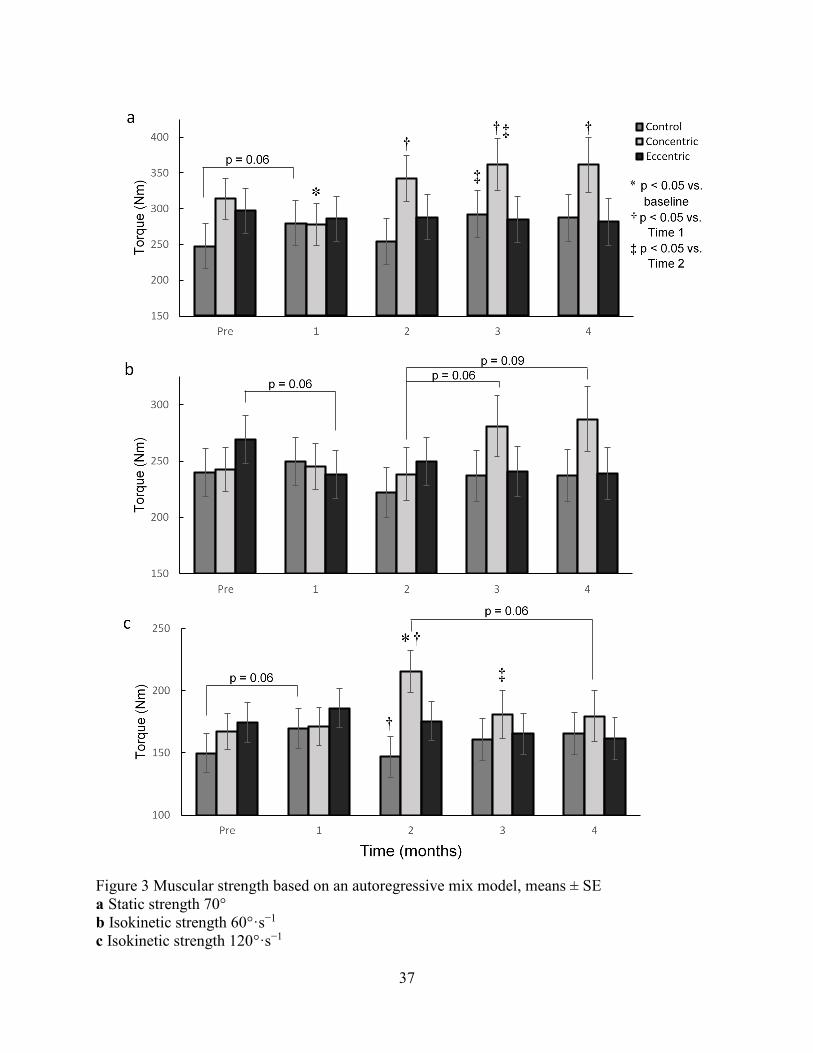
Figure 3 Muscular strength based on an autoregressive mix model, means ± SE ........................ 37
1
INTRODUCTION
Over the past decade in the United States, rates of obesity (body mass index (BMI) > 30
kg·m−2) and severe obesity (BMI > 40 kg·m−2) have continued to trend upwards. From 2007 to
2015, overall rates of obesity have increased from 33.7% to 39.6%, while rates of severe obesity
have increased even faster from 5.7% to 7.7%—a 35% increase [1]. Severe obesity has been
linked with a low quality of life and a variety of comorbidities: hypertension, diabetes,
osteoarthritis, sleep apnea, and depression [2,3]. Long-term treatments for severe obesity are a
major concern due to the high economic cost to the United States healthcare system [4].
One of the most successful long-term treatments for severe obesity is bariatric surgery
[5,6]. The number of weight-loss surgeries has dramatically increased with the rates of severe
obesity. Weight loss surgery provides better long-term mass reduction and greater reductions in
comorbidities than standard diet and exercise [5]. A majority of these health benefits are seen
within the first 6 months [7]. Roux-en-Y gastric bypass (RYGB) and sleeve gastrectomy (SG)
surgeries are 2 of the leading procedures performed. RYGB and SG surgeries significantly
reduce mass and often restore metabolic health—including remission of type 2 diabetes mellitus,
improved insulin response, and significant reductions in hypertension and dyslipidemia [6,8].
As a result of the reduction of body mass and improved health conditions, both functional
capacity and quality of life are improved [9-11]. However, with a large reduction in body mass,
approximately 24 to 41% of the total body mass loss can be attributed to fat-free mass (FFM)
[7,12-14]. Along with this loss of FFM, muscular strength decreases from 4 to 40%, depending
on the muscle groups, with a greater decrease in the upper extremities [15-17]. Although
guidelines for the loss of FFM during body mass loss are not well established, a loss of less than
22% has been deemed acceptable [18]. However, a loss of FFM greater than 22% of the total
2
mass loss could harm the resting metabolic rate, the maintenance of functional capacity as one
ages, thermoregulation, and weight management [18]. Of the FFM loss after bariatric surgery,
about 90% is considered skeletal muscle mass (SMM) [19]. Longer-term data suggest that the
SMM continues to be lost up to 5 years after surgery, even when individuals start to regain body
mass [19]. Therefore, the continued loss of SMM may negatively affect long-term muscular
strength and functional capacity. This concern increases in aging populations where sarcopenia is
a common problem.
In healthy populations, both resistance and aerobic exercise training result in increased
SMM, muscular strength, and functional capacity [20-22]. During rapid body mass loss using
caloric restriction, resistance training has been shown to attenuate the loss of SMM and FFM,
improve strength, and improve functional capacity [23-27]. However, exercise interventions
during the rapid body mass loss following RYGB and SG have failed to suggest that exercise
attenuates the loss of FFM; most studies have suggested that the prevention of some of the FFM
loss after surgery is not possible [15,16,28,29]. Although standard resistance training or aerobic
training has been used, no study has examined the effects of eccentric exercise to attenuate the
loss of SMM. Eccentric exercise has shown to induce muscular hypertrophy greater than
standard concentric resistance training, assuming the eccentric overload threshold is exceeded
[30,31]. This threshold is a specific intensity that the eccentric resistance must achieve to provide
a large enough volume to adequately stimulate skeletal muscle cells for hypertrophy [30]. Since
exercise-induced fatigue is a common side effect for postbariatric surgery patients [32], eccentric
exercise may be a superior form of exercise due to its low energy cost. Eccentric contractions use
only a fraction (1/7 to 1/6) of the energy cost to produce the same force as concentric
contractions [33-35]. Furthermore, eccentric contractions can produce 2 to 3 times the amount of
3
force compared to a standard concentric contraction [30,35]. Therefore, the combination of low
energy cost and high force production may be factors that stimulate skeletal muscle hypertrophy
greater than standard resistance training [36]. We hypothesis that all groups will have a
significant reduction in SMM; however, the EEX will lose less SMM. Thus, the EEX will have
greater improvement of muscular strength than the CEX, while CON will have a significant
decrease in muscular strength [16]. We also anticipate that all groups will improve in functional
capacity and physical quality of life. However, we expect that CEX will have a greater
improvement than the CON, and EEX will have the greatest improvement.
METHODS
Subjects
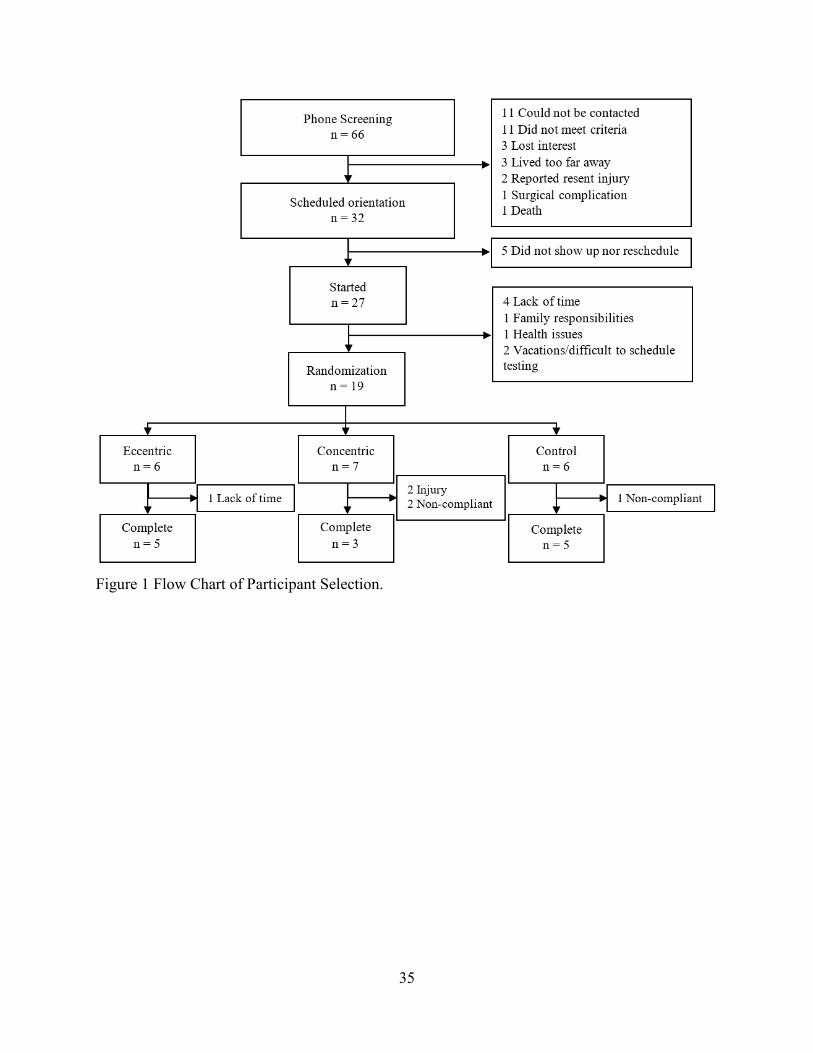
Twenty-seven women (ages 21 to 65 years) were recruited through Utah Valley Surgical
Center one month before having either RYGB or SG surgery. Participants were free of
cardiovascular diseases and metabolic diseases and were able to participate in a 16-week
supervised leg exercise training program at the start of the study. At the commencement of the
study, all participants were 6 to 8 weeks postoperation. Eight participants dropped out before
completing the initial testing and randomization (Figure 1). Following initial testing, 19
participants (age = 37.6 ± 9.8 yr, height = 164.4 ± 7.2 cm, mass = 106.9 ± 15.6 kg) were
randomly assigned into 1 of 3 groups: standard-of-care control (CON; n = 6), concentric (CEX; n
= 7), and eccentric (EEX; n = 6). Randomization was done by using a stratified randomization
approach on Microsoft Excel. The group assignments were then revealed to both researchs and
participants of the group assignment after completion of the initial testing. At baseline there was
no statistically significant difference between groups in BMI, SMM, age, height, and mass.
4
Procedures
A week prior to starting the intervention, participants attended an individual orientation
meeting to go over the study and sign the consent form. Within that first week following the
orientation, all participants received a magnetic resonance imaging (MRI) scan to measure cross-
sectional muscle mass. Each MRI scan was performed at the university’s MRI facility.
Following the MRI scan, participants performed a series of exercise tests: (1) a single-leg 1-
repetition maximum (1-RM) leg press, performed bilaterally; (2) a series of 1 maximal strength
single-leg contractions, performed bilaterally: 1 isometric knee extension set at 70°, and 2
isokinetic knee extensions at 60°·s−1 and 120°·s−1 (BIODEX); (3) a 6-minute walk test (6MWT);
(4) a 30-second stand-sit test (30STS). Participants also filled out a quality of life questionnaire,
SF-36. Following randomization, each group repeated the series of exercise tests each month
until the end of the study. Prior to the final exercise assessment, at the completion of week 16, all
participants underwent a final MRI scan and completed the SF-36 questionnaire.
Exercise Intervention
Both EEX and CEX intervention groups participated in time-matched supervised exercise
sessions, 3 times per week for 16 weeks. Subjects were required to meet a compliance threshold
of 75% of all exercise sessions. The eccentric group performed eccentric exercise on the
Eccentron (BTE, Hanover, MD), an isokinetic machine that facilitates alternating, single-leg
muscle-lengthening (eccentric) contractions. The eccentric resistance was set greater than 138%
of the measured single-leg press 1-repetition maximum [30], The duration of the first exercise
session started at 5 minutes and gradually increased to 30 minutes over the first 4 weeks, with the
isokinetic speed set at 23 repetitions per minute. The duration of 30 minutes was maintained
throughout the remainder of the study; however, the exercise load increased each month based
5
upon their new measured 1-RM. The concentric group followed a similar progression pattern for
time increments and increased resistance each month. However, the concentric group performed
single-leg presses as their mode of exercise. The resistance was set at 70 to 80% of their 1-RM,
as measured during each exercise test. The concentric group performed a series of single-leg
presses of 10 repetitions with the right leg, then 10 repetitions with the left. Upon completion of
this set, participants were given a 1-minute rest. This was repeated until the end of the exercise
session. Following each exercise session, the intensity and exercise volumes were recorded. Each
subject reported their perceived level of exertion based upon a self-reported rating of perceived
exertion (RPE) scale from 0 to 10. These reported values were used to assess that each
participant’s exercise session was an adequate intensity (at least an RPE of 7). The total exercise
volume was not matched between groups due to the eccentric force being greater than the 1-RM
concentric force and the greater number of repetitions as a result of the low energy cost, which
allows more repetitions to be performed without requiring a rest period. All groups were
instructed to follow the same standard-of-care physical activity recommendation from their
operating physician of 150 minutes of moderate physical activity and 2 days of resistance
training per week, regardless of group assignment.
Muscular Strength
Single-leg 1-repetition maximums (1-RM) were performed on a leg press machine. Each
leg started at a 90° knee angle, which was measured using a goniometer. After a light-weight
bilateral leg-press as a warm-up, the starting 1-RM load was estimated. Participants then
attempted to complete the predicted 1-RM with one leg, and then the other; participants were
given at least a 1-minute rest before attempting a higher weight. The procedure continued until a
1-RM was completed with proper form. During this procedure, participants performed no more
6
than 5 attempts to reach their single-leg 1-RM. The 1-RM was measured to the nearest 5-pound
increment. The BIODEX system 4 Pro was then used to assess peak knee extension torque
through 3 series of single-leg contractions on each leg: 1 isometric contraction at a 70° of
flexion, and 2 isokinetic contractions set at 60°·s−1 and 120°·s−1 isokinetic knee extension. All 3
BIODEX measurements were performed in 1 leg starting with the isokinetic 120°·s−1, then
60°·s−1, and ending with the 70° isometric contraction. Then researchers adjusted the machine to
measure peak torque values for the second leg, in that same order. Each test required a series of 3
repetitions; the average difference between repetitions was required to be less than 15% to be
considered maximal effort. If the series did not meet these requirements, participants were given
a 1-minute rest prior to repeating that series.
Magnetic Resonance Imaging
Lower body SMM was measured using a multislice magnetic resonance imaging (MRI)
protocol. All MRI scans were performed by trained magnetic resonance (MR) staff at the BYU
MRI research facility using a Siemens TIM-Trio 3.0T MRI scanner. Participants were positioned
supine on the MRI table and entered the magnet feet first. The scans assessed the cross-sectional
area of the trunk and lower limbs using axial images every 5 centimeters. The first set of 7
images was centered at the L4 to L5 intervertebral space and required a 20-second breath-hold to
minimize abdominal movement during acquisition. All images acquired were a 10 mm thickness
with an interslice gap of 40 mm. The next sets of 7 images began at the femoral head and
continued inferiorly, usually requiring 3 sets of 7 images (hip, knees, and feet) to complete the
scan. The total time required to obtain all MR data (27 images) for each subject was less than 30
minutes. Prior to performing each scan, participants completed a screening form as required by
7
the university’s MRI facility. This screening form was to ensure that the participant had low risk
of possible complications associated with MR.
Following MRI collection, each image was analyzed by trained image analysts using
specialized software (sliceOmatic, TomoVision, QC, Canada). Randomized group assignments
were blinded to the image analyst. Lean tissue, intramuscular adipose tissue, visceral adipose
tissue, subcutaneous adipose tissue, and skeletal muscle volumes were quantified by visually
tagging these tissues on each image. Lower body muscle volume was calculated by using the
tagged tissue areas within each image and a truncated cone approach to calculate estimates of
tissue volumes for the 40 mm gaps between images. Skeletal muscle volumes were converted to
masses using assumed tissue density constants of 1.04 g/mL [37].
Functional Capacity
The 6MWT was performed in a rectangular corridor within the Human Performance
Research Center in the Richards Building. The corridor length was measured 1 foot from the
inside wall along the participants’ route, creating a 1-lap distance of 330 feet. The lap distance
was measured with the Trumeter 5505 measuring wheel. Each lap was recorded by a trained
research assistant, and, upon completion of the sixth minute, the remaining distance was
measured from the initial starting point to the front of the participant’s foot. The total distance
was recorded to the nearest foot. After the measurement, all distances were converted to meters.
The 6MWT not only represents functional capacity, but is also correlated with cardiorespiratory
fitness and quadriceps muscle strength [38] and can be used to predict the peak VO2 and
maximal oxygen uptake (VO2max) [39-41]. The 30-second stand-sit test (30STS) was performed
using a 20-inch wide bariatric chair, without armrests, rated for 1000 pounds. Participants were
instructed to start seated, stand up, then return to a seated position while keeping their arms
8
folded in front of them. One full repetition included going from a seated to a standing position,
and then returning to a seated position. Participants were instructed to perform as many
repetitions as possible within a 30-second period. The number of repetitions was recorded to the
last half repetition.
Quality of Life
The SF-36 is a generic assessment of quality of life. The questionnaire contains 36
questions divided into 8 sections to assess different aspects of life: vitality, physical function,
bodily pain, general health perceptions, physical role, emotional role, social role, and mental
health. These 8 sections were clustered into 2 categories—the physical component and the
mental component. The physical component includes scales to measure physical function, bodily
pain, physical role, and general health. While the mental component scales the vitality, emotional
role, social role, and mental health. The scales are converted to a numerical score ranging from 0
to 100 [42]. The general purpose of the SF-36 is to assess an individual’s health status cost
effectively [43], and is a commonly used assessment of quality of life in obese and postbariatric
individuals [44].
Statistical Analysis
Descriptive statistics were calculated for all collected variables on the whole sample and
by randomly assigned groups. For continuous variables, mean and standard deviation were
calculated. The dependent variables, muscle mass, muscle strength (1-RM leg press and
BIODEX slow, fast, and isometric forces), functional capacity (30-second stand-sit and 6-minute
walk), and quality of life (mental and physical component scores) were analyzed using an
ANCOVA model. The ANCOVA was then verified with a mixed-model analysis of variance
which utilized all available data in the analysis and allowed for subjects with missing data to be
9
included in the analysis. The SAS procedure ANCOVA was used to measures changes between
premeasurements and postmeasurements of all dependent variables based upon group
assignment. Covariance factors included surgery type and baseline 6MWT—the 6MWT not only
represents functional capacity, but it is also correlated with cardiorespiratory fitness, BMI, and
quadriceps muscle strength [38]. The baseline 6MWT was controlled for in the ANCOVA
because it was lower at baseline in EEX than in both the CEX and CON.
A second model, PROC MIXED, was used to verify the ANCOVA results and to include
all participants regardless of missing data. Subjects were indicated as a random effect with an
autoregressive covariance matrix. The mixed-model included adjustment for surgery type,
observation (time), and the interaction between surgery type and time as fixed effects. The
LSMEANS option was used to estimate the mean and standard error of the mean at each
observation for each randomized group and were reported as adjusted means and standard errors
of the mean. The ESTIMATE statement was used to estimate the change between observations
in the dependent variable for each randomized group, and to compare the changes between the
randomized group and surgery type. To assess the effect of age or time-since-surgery on these
relationships, all models were repeated with either baseline age or time-since-surgery included as
a covariate. All statistical calculations were performed using the SAS statistical software
procedure (version 9.4). The level of significance for all statistical tests was taken as 0.05.
RESULTS
Nineteen participants (RYGB n = 8, and SG n = 11; age = 37.6 ± 9.8 yr, height = 164.4 ±
7.2 cm, mass = 107.1 ± 15.6 kg, BMI = 39.6 ± 5.3 kg·m−2) finished baseline testing. Six
participants dropped out during the intervention, and 13 participants completed the study (Figure
1). When factoring out the noncompleters, the completers baseline means were higher for age,
10
37.9 ± 8 yr; height, 165.9 ± 7.3 cm; and mass, 108.4 ± 16.0 kg; while BMI was less, 39.3 ± 4.3
kg·m−2. Additionally, muscle mass, skeletal muscle percent, and all strength measurements were
higher, but functional measurements and quality of life were lower. However, none of these
differences was statistically significant (Table 1). The total dropout rate was 31.6%; between
surgery types, there was a 50.0% dropout rate of RYGB and an 18.2% dropout rate of SG. All
dropouts were due to either injury and health, time constraints, or changes in personal lives. The
concentric exercise group had the highest dropout rate of all the groups at 50.0%, compared to
16.6% in both EEX and CON. The CEX and EEX groups had a compliance of 84.1% and 93.6%,
respectively, and an average RPE of 7.6 and 7.2, respectively.
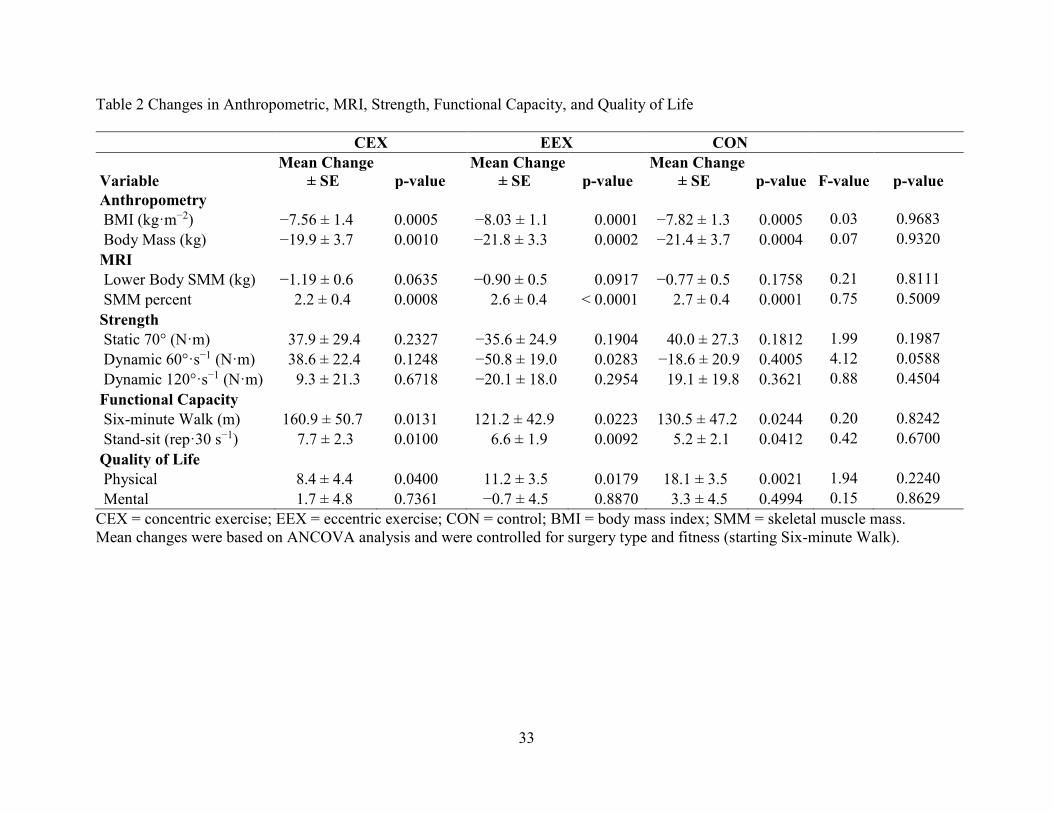
Anthropometrics
All groups significantly decreased in body mass and BMI (Table 2). The CON had an
overall decrease in BMI of 7.8 ± 1.3 kg·m−2 (p < 0.01), the CEX of 7.6 ± 1.4 kg·m−2 (p < 0.01),
and the EEX of 8.0 ± 1.1 kg·m−2 (p < 0.01). The amount of mass loss was not different between
groups. The CON decreased by 21.4 ± 3.7 kg (p < 0.01), the CEX by 19.9 ± 4.0 kg (p < 0.01),
and the EEX by 21.8 ± 3.3 kg (p < 0.01). The mixed-model adjusted values showed no
significant difference between groups at any given period, and that all groups continued to lose
significant body mass each month. Surgery type was a significant covariate for BMI change;
those who had RYGB decreased by 9.3 ± 2.6 compared to SG, who decreased by 6.2 ± 2.1.
Skeletal Muscle Mass
Lower-limb SMM decreased in all groups: the CON by 0.77 ± 0.5 kg (p = 0.18); the CEX
by 1.19 ± 0.6 kg (p = 0.06); and the EEX by 0.90 ± 0.5 kg (p = 0.09) (Table 2). While the percent
SMM loss of the total mass loss, Δ SMM (kg)/Δ mass (kg), was 5.7 ± 4.5%, 3.8 ± 2.7%, and 2.8
± 5.5% for the CEX, EEX and CON (Figure 2). The overall percent of SMM of the lower body
11
relative to total body mass increased in all groups: the CON by 2.7 ± 0.4% (p < 0.01); the CEX
by 2.2 ± 0.4% (p < 0.01); and the EEX by 2.6 ± 0.4% (p < 0.01).
Muscular Strength
Muscular strength did not significantly change in any group in any of the strength
measurements except a decrease in dynamic strength of 60°·s−1 in the EEX. Dynamic strength of
60°·s−1 increased in the CEX by 38.6 ± 22.4 Nm (p = 0.12), while EEX and CON both decreased
by 50.8 ± 19.0 Nm (p = 0.03) and 18.6 ± 20.9 (p = 0.40), respectively. No significant changes
were elicited in dynamic strength of 120°·s−1, or static strength (Table 2). Mixed-model adjusted
values of strength results are presented at each time point in Figure 3.
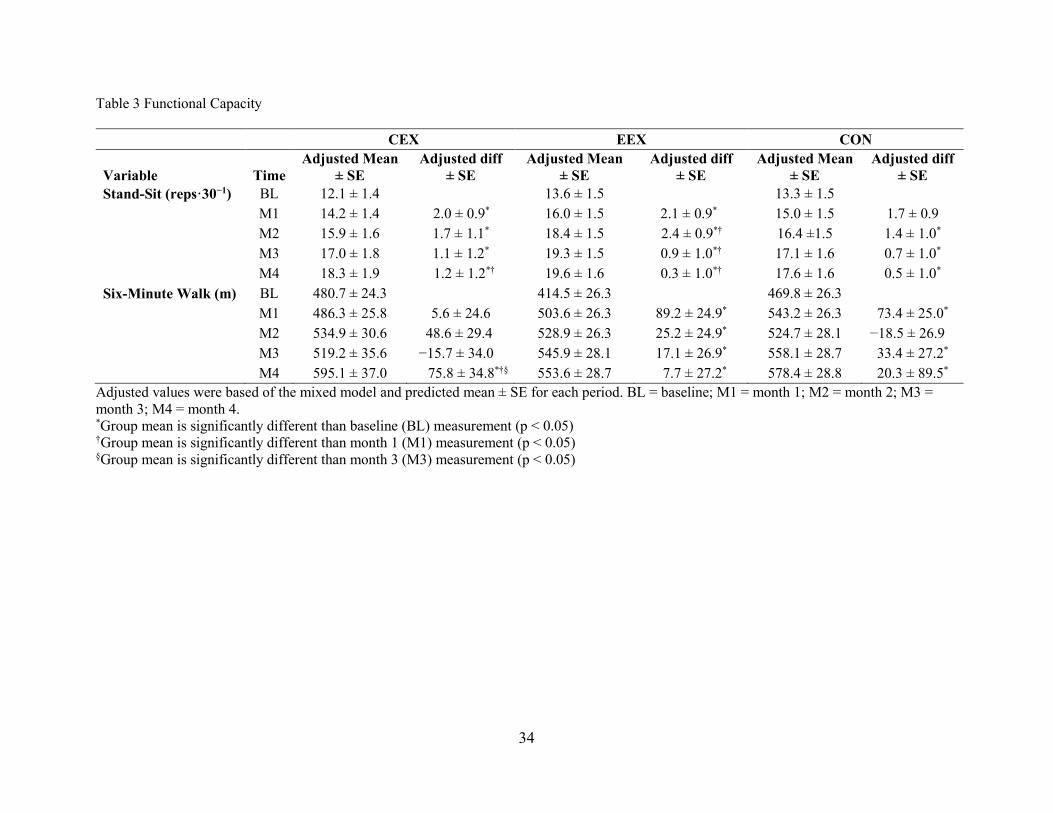
Functional Capacity
Functional capacity significantly increased in all groups from preintervention to
postintervention for both the 6MWT and 30STS (Table 2). At baseline, differences between
groups in the 6MWT approached significance; the CEX walked farther than the EEX by 66.2 ±
35.8 m (p = 0.07), and the CON farther than EEX by 55.3 ± 37.2 m (p = 0.14). However, across
each specific month no significant differences were observed between groups. According to the
mixed-model adjusted values, the significant change in the 30STS occurred between baseline
and month 1 in the EEX and CEX, while CON approached significance (p = 0.06). The CON did
significantly increase from baseline to the second month and then experienced a nonsignificant
upward trend. The EEX also improved significantly from the first to the second month and
continued a nonsignificant trend upwards. The CEX increased gradually from month 2, but it
was not significantly higher until the fourth month (Table 3). In the 6MWT, both EEX and CON
increased significantly within the first month, while the CEX didn’t reach significance until the
12
fourth month. However, all 3 groups exhibited an upward trend each month in functional
capacity.
Quality of Life
At baseline, the CEX group scored significantly higher than the EEX in the physical
component of the quality of life questionnaire (SF-36, score 0–100) by a score of 9.8 ± 3.9 (p =
0.02). However, there were no other significant differences between groups in both the mental
and physical components of the SF-36. The physical component increased significantly in all
groups: EEX 11.2 ± 3.5 (p = 0.02); CON 18.1 ± 3.5 (p < 0.01); and CEX 9.7 ± 3.7 (p = 0.04).
The mental component of quality of life did not change significantly. At the end of the study,
there were no statistical differences between groups for either the mental or physical components
of the SF-36.
DISCUSSION
Our primary hypothesis was to determine if eccentric exercise would attenuate low body
SMM loss during the rapid body mass loss following bariatric surgery. Although previous
studies have examined FFM changes, this is the first randomized controlled study to use MRI to
measure lower body SMM following bariatric surgery. Only 2 previous studies have used MRI
to measure skeletal muscle. One of these studies was a longitudinal study that examined the
long-term loss of SMM following RYGB surgery [19], and the other examined the skeletal
muscle cross-sectional area in the thigh following resistance training [15]. From the present
study, there was no significant difference in SMM between groups. During the duration of the
intervention, all 3 groups lost significant body mass. All groups lost some lower body SMM,
averaging 3.7 ± 4.1% of the total body mass loss. Along with the loss of SMM, there was no
significant change in muscular strength or the mental component of quality of life. However, all
13
groups increased in the physical component of quality of life and both measures of function
capacity—6MWT and 30STS.
Skeletal Muscle
Previous studies have estimated that full-body FFM loss ranged from 24 to 41% of the
total body mass loss, with no difference between exercise and standard-of-care control groups
[7,12-16,28,45,46]. Although the findings from the present study support these previous
findings, the differences in values may be a result of differences in research design, measurement
instrumentation, and the loss of mass from other fat-free tissue. The present study reported an
average lower-limb SMM loss of 3.7% of total weight loss—with 3 participants reporting no
change or an increase in lower limb SMM. Only 1 study to date has reported full-body SMM
following bariatric surgery, which documented a percent SMM loss of 15% in women and 19%
in males during the first year [19]. Since limited research has examined the changes in SMM via
MRI, a discrepancy between FFM loss measured in previous studies and SMM loss via MRI may
exist. The relatively higher loss of FFM compared to SMM may partially explain the
overestimation of percent FFM loss from measurement instruments. Dual-energy X-ray
absorptiometry (DXA) may initially overestimate FFM in an obese population [47], thus
overestimating FFM loss with total body mass loss. Additionally, the reduction in organs such as
the spleen, kidney, and liver, along with blood plasma reduction during body mass loss [48,49],
can be contributing factors to greater levels of FFM loss. Since the present study only examined
SMM in the lower body from 2 to 6 months after surgery, regional variations and the time of the
intervention may have been factors. The upper body and lower body SMM respond differently to
exercise as well as atrophy. During bed rest, lower body SMM is lost more rapidly than upper
body SMM [50]; however, no research has examined regional SMM loss after bariatric surgery.
14
Stegen et al reported greater decreases in upper body strength after bariatric surgery than in the
lower body, which may allude to a difference in regional SMM loss [16]. Additionally, the
present study examined SMM starting 2 months postoperation. During the first 2 months, body
mass loss is more rapid and may consist of a higher percent of FFM and SMM loss.
The load placed on the muscle from exercise is 1 pathway that stimulates skeletal muscle
protein synthesis [51]. However, the role that exercise plays in SMM preservation after bariatric
surgery remains unclear since most studies, including the present study, may have been
underpowered to detect hypertrophic changes in SMM due to the complex nature of changing
catabolic and anabolic stimuli following bariatric surgery. Mechanical forces caused by exercise
stimulate the various anabolic pathways, resulting in transcription of structural genes, changes in
protein synthesis, and metabolism [52]. The dynamic rates of synthesis and degradation response
to exercise vary depending on age, nutrition and sex [53]. In a fasted state, protein degradation is
greater than synthesis; in a fed state, protein synthesis is greater than degradation. The positive
energy state increases amino acid and glucose availability, both inhibiting protein degradation
via insulin [53,54], and stimulating protein synthesis via the amino acid leucine [54]. Therefore,
low caloric intake mixed with malabsorptive properties of bariatric surgery may dramatically
influence protein synthesis. Despite the emphasis on high protein consumption following RYGB
and SG, recommended protein intake is not typically met by patients for up to 1 year after
surgery [55-57]. Additionally, resting hormonal concentrations of insulin-like growth factors (ie,
IGF-1), cortisol, and testosterone change after bariatric surgery and may impact SMM loss.
Obesity is shown to be associated with low levels of IGF-1 and high levels of cortisol and
testosterone in females [58-60]. Following bariatric surgery, the already low levels of IGF-1
remain low for up to 6 months postoperation [61], elevated testosterone concentrations decrease

15
to normal ranges within 3 months after bariatric surgery [59,62], and cortisol levels remain
elevated [63]. Therefore, the combination of high cortisol, decreasing testosterone, and low IGF-
1 levels, in combination with severe dietary restriction may inhibit protein synthesis and
stimulate protein degradations during the rapid body mass loss after bariatric surgery.
The current study supports the general loss of FFM and SMM following bariatric
surgery; however, the magnitude of SMM loss was less than anticipated. However, this may be
explained by variations in instrumentation, methods, and time after surgery. The balance
between protein synthesis and degradation is a complex dynamic event that is multifactorial.
Mechanical force production by skeletal muscle is considered a major stimulator of SMM
hypertrophy; however, the hypertrophic effect of exercise may not be enough to overcome the
catabolic effects of an extreme energy deficit or hormonal changes observed after bariatric
surgery. Due to the combination of stimuli present following bariatric surgery, higher-powered
studies are needed to adequately determine the effect of exercise on SMM following bariatric
surgery.
Muscular Strength
The CON in the present study may be congruent with that of previous studies, which
showed no change in muscular strength from 2 to 6 months postoperation. While some previous
studies have shown a reduction in muscular strength, these measurements have used preoperative
values as their baseline measurement. Stegen et al showed a decrease in quadriceps muscular
strength by 16% from preoperation to 5 months postsurgery, with a greater decrease in upper
body mass [16], while Miller et al showed a 12% reduction in isometric knee extension strength
from presurgery to 6 months postsurgery [64]. The results illustrated an incremental decrease
over time, but no significant difference was seen between 3 weeks and 6 months postoperation
16
[64]. Additionally, Daniels et al showed no change in muscular strength from 2 to 5 months
postoperation [15], and Campanha et al showed an increase in muscular strength from 3 to 9
months postoperation [65]. Thus, the muscular strength loss seen in previous studies may be seen
within the first few weeks after operation and may remain constant during the first 6 months.
Two major components of strength change are neurological adaptations and skeletal
muscle hypertrophy. Although variation between the 2 types of exercise may be partially due to
training specificity, those who train regularly in eccentric, concentric, or isometric muscle
contractions will naturally perform better on strength tests that feature those types of contractions
[66]. Since all groups lost SMM, neurological adaptations may be a key player in strength gains
and strength preservation. In previous postbariatric surgery resistance training studies, exercise
has led to significant improvements in muscular strength. Stegen’s study demonstrated a 72%
increase in quadriceps strength, and Daniels et al showed a 36% increase in knee extension, even
though FFM and SMM were lost [15,16]. In a normal population, initial strength changes are due
to increased neurological adaptations and motor unit synchronizations [67], and Abe et al
suggested that strength increases are seen in as little as 2 weeks [68].
Functional Capacity
All groups exhibited a significant increase in both measurements of functional capacity
pretraining to posttraining; however, no significant difference was found between the groups.
Six-Minute Walk Test
Previous studies have shown that functional capacity measured via 6MWT has increased
as a result of body mass loss following bariatric surgery [16,69,70]. Compared to an age-
matched healthy populations’ normative values, as measured by Casanova et al, the average
initial walking distances for all groups in the present study was less than the 10th percentile [71].
17
By the completion of the present study, the average distance walked for all groups had increased
comparative to the distances reported of the 25 to 50th percentiles of Casanova’s normative
values. Since body mass is one factor that affects the 6MWT, the increase in distance walked is
likely attributed to the body mass loss following bariatric surgery [72]. However, exercise
interventions following RYGB or SG have shown to increase distance walked and walking speed
more than the controls [16,73,74]. Since muscular strength is an additional factor that affects the
6MWT [75], exercise may cause weight-bearing and functional exercises to become easier by
possibly maintaining SMM, increasing strength, and increasing fat loss [20]. The findings in the
current study showed a significant increase in distance walked within the first month for both
EEX and CON, but not until the final month for the CEX. However, a nonsignificant trend did
continue to increase throughout the study, which suggests improvements in walking distance
happen in as little as 1 month and may continue to improve each month.
Stand–Sit Test
In the current study, no statistical difference was measured between groups for the
30STS. All groups increased significantly throughout the study; however, most of the change
was seen within the first month. The increase of the exercise groups from the present study is
consistent with previous research [16,76]. However, Stegen et al reported different findings,
showing that only the exercise group had significant increase in the 30STS, with no change in
the control group [16]. However, Bohannon et al showed that the 30STS is positively correlated
with knee extension strength and negatively correlated with body mass [77,78]. Since all groups
exhibited a similar change in mass with no statistically significant change in muscular strength,
the increase in 30STS is mostly likely attributed to the loss of body mass. The findings in the
present study are consistent with Bohannon’s theory that the 30STS is correlated with muscular

18
strength and inversely correlated with body mass. The body mass loss in conjunction with
preservation of strength shown within the first month may be contributing factors of the
significant improvements in the 30STS during the first month. Although 30STS did not
statistically increase each month to the next, the 30STS continued to trend upwards. This trend
may be a result of the continued body mass loss from month to month and the preservation of
muscular strength.
Quality of Life
All groups increased in the physical component of quality of life as measured with the
SF-36 questionnaire, with no differences between groups. Tompkins et al and Josbeno et al
showed that both the mental and physical components improved from before surgery to 6 months
after surgery [70,79]. Tompkins also concluded that the 6MWT was correlated with the physical
component of the SF-36. Accordingly, 6MWT distance increased with body mass loss, and the
physical component of SF-36 also improved. Kolotkin et al reported that the improved functional
component was correlated with total body mass loss [80]. Additionally, the present study did not
show a significant change in the mental component within 4 months. Although the mental
component may increase after surgery [70,79], Kolotkin’s findings showed that the mental
component is not as responsive as the physical component [81].
Limitations
The primary weaknesses of this study were the small number of participants, high
dropout rate, additional physical activity, and dietary intake. Although a mixed-model helped
strengthen the power of the study, the model was not adequately powered to determine if a
difference existed between groups in all dependent variables. Also, those who completed the
study may have been more motivated to exercise and thus skewed the results. Additionally, both
19
participants who gained SMM were in the CON. The reasoning why remains unknown; however,
since both participants responded differently to average postoperative patients, their results may
be a major contributor to why no difference was seen between groups. Additional factors that
could have influenced SMM, as measured in the present study, include physical activity levels
outside of the supervised exercise program and dietary intake. During body mass loss, dietary
protein and total caloric intake are inversely correlated with FFM loss [23,56], thus both may
contribute to some variation in SMM loss. Additionally, total physical activity levels are
inversely correlated with FFM loss [23]. Since no additional physical activity requirements were
given, beyond the recommendations given by the surgical center, and since physical activity was
not measured outside of the supervised sessions, there may have been a large variation in daily
physical activity patterns between participants. Although some studies support the fact that
resistance exercise increases leisure-time physical activity [82]; the effect that resistance training
plays on leisure-time physical activity is unknown for this specific population. Additionally,
muscle soreness from resistance training and increased fatigue following surgery may be factors
that cause a decrease in physical activity levels. Furthermore, muscular strength was measured
through isometric and isokinetic knee extension forces; since neither exercise group performed
knee extension exercises, the strength increases may not have been represented with the current
exercise tests. To detect a difference between different strength training programs, strength
assessments should match the specific exercise routines performed by the exercise groups.
CONCLUSION
In conclusion, the present study supported a loss in SMM; however, the loss was less
than what was expected based on previously reported levels of FFM loss. Although no statistical
difference was detected from the present study between eccentric exercise, concentric exercise
20
and nonexercise groups, the role that exercise plays following bariatric surgery as an anabolic
stimulus remains unknown. Currently, prolonged nutrient deficiency, as seen after bariatric
surgery, inhibits protein synthesis resulting in a sustained imbalance between protein synthesis
and degradation. Although exercise is a stimulus for protein synthesis in healthy populations, the
anabolic properties of exercise as a stimulus has not fully been explored during the rapid body-
mass-loss phase after bariatric surgery. Although SMM continues to decrease between 2 to 6
months postbariatric surgery, functional capacity and physical components of quality of life
increase, while muscular strength does not appear to change, regardless of resistance training.
21
REFERENCES
1. Hales CM, Fryar CD, Carroll MD, Freedman DS, Ogden CL. Trends in obesity and
severe obesity prevalence in US youth and adults by sex and age, 2007-2008 to 2015-
2016. JAMA. 2018;319(16):1723-1725.
2. Taylor VH, Forhan M, Vigod SN, McIntyre RS, Morrison KM. The impact of obesity on
quality of life. Best Pract Res Clin Endocrinol Metab. 2013;27(2):139-146.
3. Barcones-Molero MF, Sanchez-Villegas A, Martinez-Gonzalez MA, Bes-Rastrollo M,
Martinez-Urbistondo M, Santabarbara J, et al. The influence of obesity and weight gain
on quality of life according to the SF-36 for individuals of the dynamic follow-up cohort
of the University of Navarra. Rev Clin Esp. 2018.
4. Wee CC, Phillips RS, Legedza AT, Davis RB, Soukup JR, Colditz GA, et al. Health care
expenditures associated with overweight and obesity among US adults: importance of age
and race. Am J Public Health. 2005;95(1):159-165.
5. Sjostrom L, Lindroos AK, Peltonen M, Torgerson J, Bouchard C, Carlsson B, et al.
Lifestyle, diabetes, and cardiovascular risk factors 10 years after bariatric surgery. N Engl
J Med. 2004;351(26):2683-2693.
6. Adams TD, Davidson LE, Litwin SE, Kim J, Kolotkin RL, Nanjee MN, et al. Weight and
metabolic outcomes 12 years after gastric bypass. N Engl J Med. 2017;377(12):1143-
1155.
7. Carey DG, Pliego GJ, Raymond RL, Skau KB. Body composition and metabolic changes
following bariatric surgery: effects on fat mass, lean mass and basal metabolic rate. Obes
Surg. 2006;16(4):469-477.
22
8. Bradley D, Magkos F, Eagon JC, Varela JE, Gastaldelli A, Okunade AL, et al. Matched
weight loss induced by sleeve gastrectomy or gastric bypass similarly improves
metabolic function in obese subjects. Obesity (Silver Spring). 2014;22(9):2026-2031.
9. Jassil FC, Manning S, Lewis N, Steinmo S, Kingett H, Lough F, et al. Feasibility and
impact of a combined supervised exercise and nutritional-behavioral intervention
following bariatric Surgery: A pilot study. J Obes. 2015;2015:693829.
10. Vargas CB, Picolli F, Dani C, Padoin AV, Mottin CC. Functioning of obese individuals
in pre- and postoperative periods of bariatric surgery. Obes Surg. 2013;23(10):1590-
1595.
11. Mohos E, Schmaldienst E, Prager M. Quality of life parameters, weight change and
improvement of co-morbidities after laparoscopic Roux Y gastric bypass and
laparoscopic gastric sleeve resection—comparative study. Obes Surg. 2011;21(3):288-
294.
12. Vaurs C, Dimeglio C, Charras L, Anduze Y, Chalret du Rieu M, Ritz P. Determinants of
changes in muscle mass after bariatric surgery. Diabetes Metab. 2015;41(5):416-421.
13. Levitt DG, Beckman LM, Mager JR, Valentine B, Sibley SD, Beckman TR, et al.
Comparison of DXA and water measurements of body fat following gastric bypass
surgery and a physiological model of body water, fat, and muscle composition. J Appl
Physiol (1985). 2010;109(3):786-795.
14. Liu X, Lagoy A, Discenza I, Papineau G, Lewis E, Braden G, et al. Metabolic and
neuroendocrine responses to Roux-en-Y gastric bypass. I: energy balance, metabolic
changes, and fat loss. J Clin Endocrinol Metab. 2012;97(8):E1440-1450.
23
15. Daniels P, Burns RD, Brusseau TA, Hall MS, Davidson L, Adams TD, et al. Effect of a
randomised 12-week resistance training programme on muscular strength, cross-sectional
area and muscle quality in women having undergone Roux-en-Y gastric bypass. J Sports
Sci. 2018;36(5):529-535.
16. Stegen S, Derave W, Calders P, Van Laethem C, Pattyn P. Physical fitness in morbidly
obese patients: effect of gastric bypass surgery and exercise training. Obes Surg.
2011;21(1):61-70.
17. Hue O, Berrigan F, Simoneau M, Marcotte J, Marceau P, Marceau S, et al. Muscle force
and force control after weight loss in obese and morbidly obese men. Obes Surg.
2008;18(9):1112-1118.
18. Webster JD, Hesp R, Garrow JS. The composition of excess weight in obese women
estimated by body density, total body water and total body potassium. Hum Nutr Clin
Nutr. 1984;38(4):299-306.
19. Davidson LE, Yu W, Goodpaster BH, DeLany JP, Widen E, Lemos T, et al. Fat-Free
mass and skeletal muscle mass five years after bariatric surgery. Obesity (Silver Spring).
2018;26(7):1130-1136.
20. Erskine RM, Fletcher G, Folland JP. The contribution of muscle hypertrophy to strength
changes following resistance training. Eur J Appl Physiol. 2014;114(6):1239-1249.
21. Steele J, Raubold K, Kemmler W, Fisher J, Gentil P, Giessing J. The effects of 6 months
of progressive high effort resistance training methods upon strength, body composition,
function, and wellbeing of elderly adults. Biomed Res Int. 2017;2017:2541090.
24
22. Schoenfeld BJ, Ogborn DI, Vigotsky AD, Franchi MV, Krieger JW. Hypertrophic effects
of concentric vs. eccentric muscle actions: A systematic review and meta-analysis. J
Strength Cond Res. 2017;31(9):2599-2608.
23. Chaston TB, Dixon JB, O'Brien PE. Changes in fat-free mass during significant weight
loss: a systematic review. Int J Obes (Lond). 2007;31(5):743-750.
24. Donnelly JE, Pronk NP, Jacobsen DJ, Pronk SJ, Jakicic JM. Effects of a very-low-calorie
diet and physical-training regimens on body composition and resting metabolic rate in
obese females. Am J Clin Nutr. 1991;54(1):56-61.
25. Janssen I, Fortier A, Hudson R, Ross R. Effects of an energy-restrictive diet with or
without exercise on abdominal fat, intermuscular fat, and metabolic risk factors in obese
women. Diabetes Care. 2002;25(3):431-438.
26. Sardeli AV, Komatsu TR, Mori MA, Gaspari AF, Chacon-Mikahil MPT. Resistance
training prevents muscle loss induced by caloric restriction in obese elderly individuals:
A systematic review and meta-analysis. Nutrients. 2018;10(4).
27. Pavlou KN, Steffee WP, Lerman RH, Burrows BA. Effects of dieting and exercise on
lean body mass, oxygen uptake, and strength. Med Sci Sports Exerc. 1985;17(4):466-471.
28. Huck CJ. Effects of supervised resistance training on fitness and functional strength in
patients succeeding bariatric surgery. J Strength Cond Res. 2015;29(3):589-595.
29. Hassannejad A, Khalaj A, Mansournia MA, Rajabian Tabesh M, Alizadeh Z. The effect
of aerobic or aerobic-strength exercise on body composition and functional capacity in
patients with BMI ≥35 after bariatric surgery: a randomized control trial. Obes Surg.
2017;27(11):2792-2801.
25
30. English KL, Loehr JA, Lee SM, Smith SM. Early-phase musculoskeletal adaptations to
different levels of eccentric resistance after 8 weeks of lower body training. Eur J Appl
Physiol. 2014;114(11):2263-2280.
31. Schoenfeld BJ. Does exercise-induced muscle damage play a role in skeletal muscle
hypertrophy? J Strength Cond Res. 2012;26(5):1441-1453.
32. McMahon MM, Sarr MG, Clark MM, Gall MM, Knoetgen J, 3rd, Service FJ, et al.
Clinical management after bariatric surgery: value of a multidisciplinary approach. Mayo
Clin Proc. 2006;81(10 Suppl):S34-45.
33. Franchi MV, Wilkinson DJ, Quinlan JI, Mitchell WK, Lund JN, Williams JP, et al. Early
structural remodeling and deuterium oxide-derived protein metabolic responses to
eccentric and concentric loading in human skeletal muscle. Physiol Rep. 2015;3(11).
34. Bigland-Ritchie B, Woods JJ. Integrated electromyogram and oxygen uptake during
positive and negative work. J Physiol. 1976;260(2):267-277.
35. LaStayo P, Marcus R, Dibble L, Frajacomo F, Lindstedt S. Eccentric exercise in
rehabilitation: safety, feasibility, and application. J Appl Physiol (1985).
2014;116(11):1426-1434.
36. Schoenfeld BJ, Ogborn D, Krieger JW. Dose-response relationship between weekly
resistance training volume and increases in muscle mass: A systematic review and meta-
analysis. J Sports Sci. 2017;35(11):1073-1082.
37. Snyder WS, Cook MJ, Nasset ES, Karhausen LR, Parry Howells G, Tipton IH. Report of
the task group on reference man. New York: Pergamon Press; 1975.
26
38. Hulens M, Vansant G, Claessens AL, Lysens R, Muls E. Predictors of 6-minute walk test
results in lean, obese and morbidly obese women. Scand J Med Sci Sports.
2003;13(2):98-105.
39. Cahalin LP, Mathier MA, Semigran MJ, Dec GW, DiSalvo TG. The six-minute walk test
predicts peak oxygen uptake and survival in patients with advanced heart failure. Chest.
1996;110(2):325-332.
40. Ross RM, Murthy JN, Wollak ID, Jackson AS. The six minute walk test accurately
estimates mean peak oxygen uptake. BMC Pulm Med. 2010;10:31.
41. Jalili M, Nazem F, Sazvar A, Ranjbar K. Prediction of maximal oxygen uptake by six-
minute walk test and body mass index in healthy boys. J Pediatr. 2018;200:155-159.
42. Ware JE. SF-36 physical and mental health summary scales: A user's manual. in:
Kosinski M, ed. 5 ed. Boston, MA: Health Assessment Lab, New England Medical
Center; 1994:190.
43. Brazier JE, Harper R, Jones NM, O'Cathain A, Thomas KJ, Usherwood T, et al.
Validating the SF-36 health survey questionnaire: new outcome measure for primary
care. BMJ. 1992;305(6846):160-164.
44. Karlsen TI, Tveita EK, Natvig GK, Tonstad S, Hjelmesaeth J. Validity of the SF-36 in
patients with morbid obesity. Obes Facts. 2011;4(5):346-351.
45. Livhits M, Mercado C, Yermilov I, Parikh JA, Dutson E, Mehran A, et al. Exercise
following bariatric surgery: systematic review. Obes Surg. 2010;20(5):657-665.
46. Shah M, Snell PG, Rao S, Adams-Huet B, Quittner C, Livingston EH, et al. High-volume
exercise program in obese bariatric surgery patients: a randomized, controlled trial.
Obesity (Silver Spring). 2011;19(9):1826-1834.
27
47. Valentine RJ, Misic MM, Kessinger RB, Mojtahedi MC, Evans EM. Location of body fat
and body size impacts DXA soft tissue measures: a simulation study. Eur J Clin Nutr.
2008;62(4):553-559.
48. Gallagher D, Kelley DE, Thornton J, Boxt L, Pi-Sunyer X, Lipkin E, et al. Changes in
skeletal muscle and organ size after a weight-loss intervention in overweight and obese
type 2 diabetic patients. Am J Clin Nutr. 2017;105(1):78-84.
49. Alexander JK, Peterson KL. Cardiovascular effects of weight reduction. Circulation.
1972;45(2):310-318.
50. Paddon-Jones D, Sheffield-Moore M, Cree MG, Hewlings SJ, Aarsland A, Wolfe RR, et
al. Atrophy and impaired muscle protein synthesis during prolonged inactivity and stress.
J Clin Endocrinol Metab. 2006;91(12):4836-4841.
51. Schoenfeld BJ, Contreras B, Krieger J, Grgic J, Delcastillo K, Belliard R, et al.
Resistance training volume enhances muscle hypertrophy. Med Sci Sports Exerc. 2018.
52. Matsakas A, Patel K. Intracellular signalling pathways regulating the adaptation of
skeletal muscle to exercise and nutritional changes. Histol Histopathol. 2009;24(2):209-
222.
53. Kumar V, Atherton P, Smith K, Rennie MJ. Human muscle protein synthesis and
breakdown during and after exercise. J Appl Physiol (1985). 2009;106(6):2026-2039.
54. Stark M, Lukaszuk J, Prawitz A, Salacinski A. Protein timing and its effects on muscular
hypertrophy and strength in individuals engaged in weight-training. J Int Soc Sports Nutr.
2012;9(1):54.
28
55. Katsanos CS, Madura JA, 2nd, Roust LR. Essential amino acid ingestion as an efficient
nutritional strategy for the preservation of muscle mass following gastric bypass surgery.
Nutrition. 2016;32(1):9-13.
56. Moize V, Geliebter A, Gluck ME, Yahav E, Lorence M, Colarusso T, et al. Obese
patients have inadequate protein intake related to protein intolerance up to 1 year
following Roux-en-Y gastric bypass. Obes Surg. 2003;13(1):23-28.
57. Jeffreys RM, Hrovat K, Woo JG, Schmidt M, Inge TH, Xanthakos SA. Dietary
assessment of adolescents undergoing laparoscopic Roux-en-Y gastric bypass surgery:
macro- and micronutrient, fiber, and supplement intake. Surg Obes Relat Dis.
2012;8(3):331-336.
58. Rasmussen MH, Juul A, Hilsted J. Effect of weight loss on free insulin-like growth
factor-I in obese women with hyposomatotropism. Obesity (Silver Spring).
2007;15(4):879-886.
59. Sarwer DB, Spitzer JC, Wadden TA, Mitchell JE, Lancaster K, Courcoulas A, et al.
Changes in sexual functioning and sex hormone levels in women following bariatric
surgery. JAMA Surg. 2014;149(1):26-33.
60. van Rossum EF. Obesity and cortisol: New perspectives on an old theme. Obesity (Silver
Spring). 2017;25(3):500-501.
61. Pardina E, Ferrer R, Baena-Fustegueras JA, Lecube A, Fort JM, Vargas V, et al. The
relationships between IGF-1 and CRP, NO, leptin, and adiponectin during weight loss in
the morbidly obese. Obes Surg. 2010;20(5):623-632.
29
62. Legro RS, Dodson WC, Gnatuk CL, Estes SJ, Kunselman AR, Meadows JW, et al.
Effects of gastric bypass surgery on female reproductive function. J Clin Endocrinol
Metab. 2012;97(12):4540-4548.
63. Valentine AR, Raff H, Liu H, Ballesteros M, Rose JM, Jossart GH, et al. Salivary cortisol
increases after bariatric surgery in women. Horm Metab Res. 2011;43(8):587-590.
64. Miller GD, Nicklas BJ, You T, Fernandez A. Physical function improvements after
laparoscopic Roux-en-Y gastric bypass surgery. Surg Obes Relat Dis. 2009;5(5):530-537.
65. Campanha-Versiani L, Pereira DAG, Ribeiro-Samora GA, Ramos AV, de Sander Diniz
MFH, De Marco LA, et al. The effect of a muscle weight-bearing and aerobic exercise
program on the body composition, muscular strength, biochemical markers, and bone
mass of obese patients who have undergone gastric bypass surgery. Obes Surg.
2017;27(8):2129-2137.
66. Higbie EJ, Cureton KJ, Warren GL, 3rd, Prior BM. Effects of concentric and eccentric
training on muscle strength, cross-sectional area, and neural activation. J Appl Physiol
(1985). 1996;81(5):2173-2181.
67. Chilibeck PD, Calder AW, Sale DG, Webber CE. A comparison of strength and muscle
mass increases during resistance training in young women. Eur J Appl Physiol Occup
Physiol. 1998;77(1-2):170-175.
68. Abe T, DeHoyos DV, Pollock ML, Garzarella L. Time course for strength and muscle
thickness changes following upper and lower body resistance training in men and
women. Eur J Appl Physiol. 2000;81(3):174-180.
30
69. Maniscalco M, Zedda A, Giardiello C, Faraone S, Cerbone MR, Cristiano S, et al. Effect
of bariatric surgery on the six-minute walk test in severe uncomplicated obesity. Obes
Surg. 2006;16(7):836-841.
70. Tompkins J, Bosch PR, Chenowith R, Tiede JL, Swain JM. Changes in functional
walking distance and health-related quality of life after gastric bypass surgery. Phys Ther.
2008;88(8):928-935.
71. Casanova C, Celli BR, Barria P, Casas A, Cote C, de Torres JP, et al. The 6-min walk
distance in healthy subjects: reference standards from seven countries. Eur Respir J.
2011;37(1):150-156.
72. Enright PL. The six-minute walk test. Respir Care. 2003;48(8):783-785.
73. Oliveira JJ, Freitas AC, Almeida AA. Postoperative effect of physical therapy related to
functional capacity and respiratory muscle strength in patients submitted to bariatric
surgery. Arq Bras Cir Dig. 2016;29Suppl 1(Suppl 1):43-47.
74. Santos L, Ribeiro AS, Schoenfeld BJ, Nascimento MA, Tomeleri CM, Souza MF, et al.
The improvement in walking speed induced by resistance training is associated with
increased muscular strength but not skeletal muscle mass in older women. Eur J Sport
Sci. 2017;17(4):488-494.
75. de Souza SA, Faintuch J, Fabris SM, Nampo FK, Luz C, Fabio TL, et al. Six-minute
walk test: functional capacity of severely obese before and after bariatric surgery. Surg
Obes Relat Dis. 2009;5(5):540-543.
76. Morana C, Collignon M, Nocca D. Effectiveness of a functional rehabilitation program
after bariatric surgery: a Pilot Study. Obes Surg. 2018.
31
77. Bohannon RW. Knee extension strength and body weight determine sit-to-stand
independence after stroke. Physiother Theory Pract. 2007;23(5):291-297.
78. Bohannon RW. Body weight-normalized knee extension strength explains sit-to-stand
independence: a validation study. J Strength Cond Res. 2009;23(1):309-311.
79. Josbeno DA, Jakicic JM, Hergenroeder A, Eid GM. Physical activity and physical
function changes in obese individuals after gastric bypass surgery. Surg Obes Relat Dis.
2010;6(4):361-366.
80. Kolotkin RL, Davidson LE, Crosby RD, Hunt SC, Adams TD. Six-year changes in
health-related quality of life in gastric bypass patients versus obese comparison groups.
Surg Obes Relat Dis. 2012;8(5):625-633.
81. Kolotkin RL, Kim J, Davidson LE, Crosby RD, Hunt SC, Adams TD. 12-year trajectory
of health-related quality of life in gastric bypass patients versus comparison groups. Surg
Obes Relat Dis. 2018;14(9):1359-1365.
82. Hunter GR, Wetzstein CJ, Fields DA, Brown A, Bamman MM. Resistance training
increases total energy expenditure and free-living physical activity in older adults. J Appl
Physiol (1985). 2000;89(3):977-984.
32
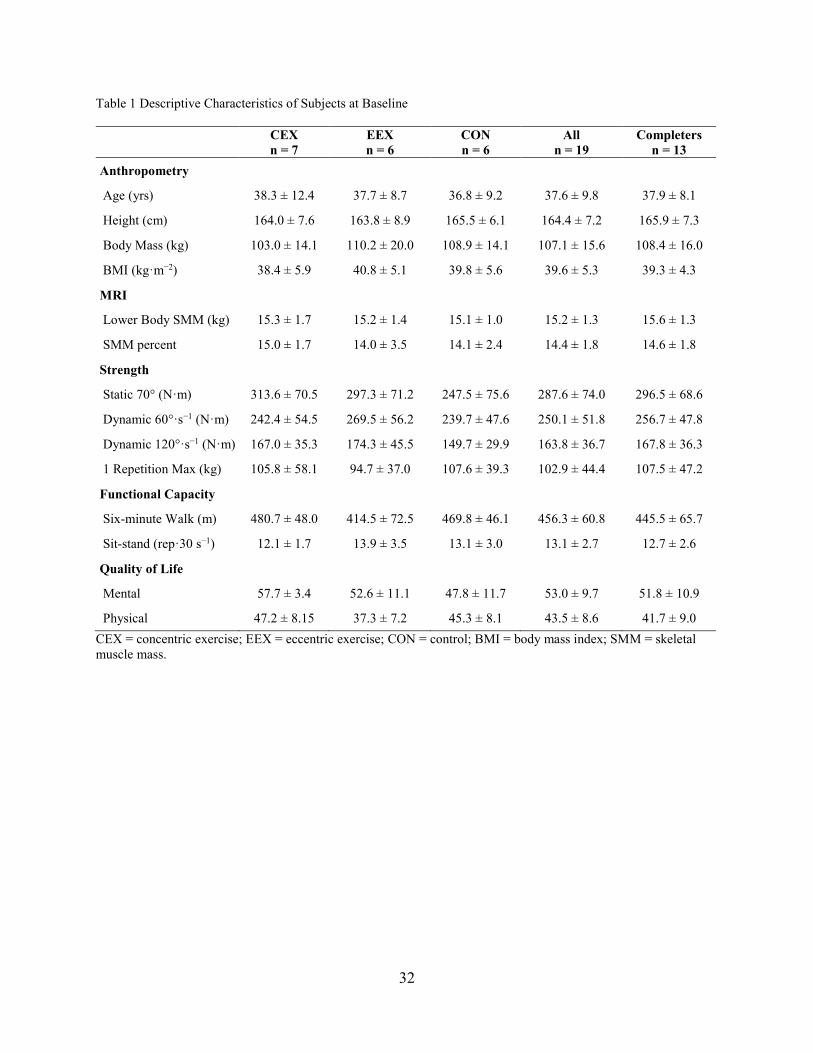
Table 1 Descriptive Characteristics of Subjects at Baseline CEX
n = 7 EEX n = 6
CON n = 6
All n = 19
Completers n = 13
Anthropometry
Age (yrs) 38.3 ± 12.4 37.7 ± 8.7 36.8 ± 9.2 37.6 ± 9.8 37.9 ± 8.1
Height (cm) 164.0 ± 7.6 163.8 ± 8.9 165.5 ± 6.1 164.4 ± 7.2 165.9 ± 7.3
Body Mass (kg) 103.0 ± 14.1 110.2 ± 20.0 108.9 ± 14.1 107.1 ± 15.6 108.4 ± 16.0
BMI (kg·m−2) 38.4 ± 5.9 40.8 ± 5.1 39.8 ± 5.6 39.6 ± 5.3 39.3 ± 4.3
MRI
Lower Body SMM (kg) 15.3 ± 1.7 15.2 ± 1.4 15.1 ± 1.0 15.2 ± 1.3 15.6 ± 1.3
SMM percent 15.0 ± 1.7 14.0 ± 3.5 14.1 ± 2.4 14.4 ± 1.8 14.6 ± 1.8
Strength
Static 70° (N·m) 313.6 ± 70.5 297.3 ± 71.2 247.5 ± 75.6 287.6 ± 74.0 296.5 ± 68.6
Dynamic 60°·s−1 (N·m) 242.4 ± 54.5 269.5 ± 56.2 239.7 ± 47.6 250.1 ± 51.8 256.7 ± 47.8
Dynamic 120°·s−1 (N·m) 167.0 ± 35.3 174.3 ± 45.5 149.7 ± 29.9 163.8 ± 36.7 167.8 ± 36.3
1 Repetition Max (kg) 105.8 ± 58.1 94.7 ± 37.0 107.6 ± 39.3 102.9 ± 44.4 107.5 ± 47.2
Functional Capacity
Six-minute Walk (m) 480.7 ± 48.0 414.5 ± 72.5 469.8 ± 46.1 456.3 ± 60.8 445.5 ± 65.7
Sit-stand (rep·30 s−1) 12.1 ± 1.7 13.9 ± 3.5 13.1 ± 3.0 13.1 ± 2.7 12.7 ± 2.6
Quality of Life Mental 57.7 ± 3.4 52.6 ± 11.1 47.8 ± 11.7 53.0 ± 9.7 51.8 ± 10.9
Physical 47.2 ± 8.15 37.3 ± 7.2 45.3 ± 8.1 43.5 ± 8.6 41.7 ± 9.0 CEX = concentric exercise; EEX = eccentric exercise; CON = control; BMI = body mass index; SMM = skeletal muscle mass.
33
Table 2 Changes in Anthropometric, MRI, Strength, Functional Capacity, and Quality of Life CEX EEX CON
Variable Mean Change
± SE p-value Mean Change
± SE p-value Mean Change
± SE p-value F-value p-value Anthropometry BMI (kg·m−2) −7.56 ± 1.4 0.0005 −8.03 ± 1.1 0.0001 −7.82 ± 1.3 0.0005 0.03 0.9683 Body Mass (kg) −19.9 ± 3.7 0.0010 −21.8 ± 3.3 0.0002 −21.4 ± 3.7 0.0004 0.07 0.9320 MRI Lower Body SMM (kg) −1.19 ± 0.6 0.0635 −0.90 ± 0.5 0.0917 −0.77 ± 0.5 0.1758 0.21 0.8111 SMM percent 2.2 ± 0.4 0.0008 2.6 ± 0.4 < 0.0001 2.7 ± 0.4 0.0001 0.75 0.5009 Strength Static 70° (N·m) 37.9 ± 29.4 0.2327 −35.6 ± 24.9 0.1904 40.0 ± 27.3 0.1812 1.99 0.1987 Dynamic 60°·s−1 (N·m) 38.6 ± 22.4 0.1248 −50.8 ± 19.0 0.0283 −18.6 ± 20.9 0.4005 4.12 0.0588 Dynamic 120°·s−1 (N·m) 9.3 ± 21.3 0.6718 −20.1 ± 18.0 0.2954 19.1 ± 19.8 0.3621 0.88 0.4504 Functional Capacity Six-minute Walk (m) 160.9 ± 50.7 0.0131 121.2 ± 42.9 0.0223 130.5 ± 47.2 0.0244 0.20 0.8242 Stand-sit (rep·30 s−1) 7.7 ± 2.3 0.0100 6.6 ± 1.9 0.0092 5.2 ± 2.1 0.0412 0.42 0.6700 Quality of Life Physical 8.4 ± 4.4 0.0400 11.2 ± 3.5 0.0179 18.1 ± 3.5 0.0021 1.94 0.2240 Mental 1.7 ± 4.8 0.7361 −0.7 ± 4.5 0.8870 3.3 ± 4.5 0.4994 0.15 0.8629 CEX = concentric exercise; EEX = eccentric exercise; CON = control; BMI = body mass index; SMM = skeletal muscle mass. Mean changes were based on ANCOVA analysis and were controlled for surgery type and fitness (starting Six-minute Walk).
34
Table 3 Functional Capacity CEX EEX CON
Variable Time Adjusted Mean
± SE Adjusted diff
± SE Adjusted Mean
± SE Adjusted diff
± SE Adjusted Mean
± SE Adjusted diff
± SE Stand-Sit (reps·30−1) BL 12.1 ± 1.4 13.6 ± 1.5 13.3 ± 1.5 M1 14.2 ± 1.4 2.0 ± 0.9* 16.0 ± 1.5 2.1 ± 0.9* 15.0 ± 1.5 1.7 ± 0.9 M2 15.9 ± 1.6 1.7 ± 1.1* 18.4 ± 1.5 2.4 ± 0.9*† 16.4 ±1.5 1.4 ± 1.0* M3 17.0 ± 1.8 1.1 ± 1.2* 19.3 ± 1.5 0.9 ± 1.0*† 17.1 ± 1.6 0.7 ± 1.0* M4 18.3 ± 1.9 1.2 ± 1.2*† 19.6 ± 1.6 0.3 ± 1.0*† 17.6 ± 1.6 0.5 ± 1.0* Six-Minute Walk (m) BL 480.7 ± 24.3 414.5 ± 26.3 469.8 ± 26.3 M1 486.3 ± 25.8 5.6 ± 24.6 503.6 ± 26.3 89.2 ± 24.9* 543.2 ± 26.3 73.4 ± 25.0* M2 534.9 ± 30.6 48.6 ± 29.4 528.9 ± 26.3 25.2 ± 24.9* 524.7 ± 28.1 −18.5 ± 26.9 M3 519.2 ± 35.6 −15.7 ± 34.0 545.9 ± 28.1 17.1 ± 26.9* 558.1 ± 28.7 33.4 ± 27.2* M4 595.1 ± 37.0 75.8 ± 34.8*†§ 553.6 ± 28.7 7.7 ± 27.2* 578.4 ± 28.8 20.3 ± 89.5*
Adjusted values were based of the mixed model and predicted mean ± SE for each period. BL = baseline; M1 = month 1; M2 = month 2; M3 = month 3; M4 = month 4. *Group mean is significantly different than baseline (BL) measurement (p < 0.05) †Group mean is significantly different than month 1 (M1) measurement (p < 0.05) §Group mean is significantly different than month 3 (M3) measurement (p < 0.05)
35
Figure 1 Flow Chart of Participant Selection.
36
Figure 2 Percent Skeletal Muscle Change of Total Body Mass to Body Mass Loss, Unfiltered Data. Based on group assignment and surgery type.
-12%
-10%
-8%
-6%
-4%
-2%
0%
2%
4%
0 5 10 15 20 25 30 35
Δ SM
M /
ΔBo
dy
Mas
s
Body Mass Loss (kg)
Sleeve EccentricSleeve ConcentricSleeve ControlRYGB EccentricRYGB ConcentricRYGB Control
37
Figure 3 Muscular strength based on an autoregressive mix model, means ± SE a Static strength 70° b Isokinetic strength 60°·s−1
c Isokinetic strength 120°·s−1