mainstreaming of conspiracy theories and misinformation
TRANSCRIPT
Mainstreaming of conspiracy theories andmisinformationNeil Johnson ( [email protected] )
George Washington UniversityNicolas Velasquez
George Washington UniversityNicholas Johnson Restrepo
George Washington UniversityRhys Leahy
George Washington UniversityRichard Sear
The George Washington UniversityNick Gabriel
George Washington UniversityYonatan Lupu
Los Alamos National LaboratoryHeidi Larson
London School of Hygiene and Tropical Medicine https://orcid.org/0000-0002-8477-7583
Biological Sciences - Article
Keywords: Social Media, Malignant Online In�uences, Online Communities, Alternative HealthCommunities, Inter-community Bonds, Mathematical Models
Posted Date: March 9th, 2021
DOI: https://doi.org/10.21203/rs.3.rs-203638/v1
License: This work is licensed under a Creative Commons Attribution 4.0 International License. Read Full License
1
Mainstreaming of conspiracy theories and misinformation
N.F. Johnson1,2,+,*, N. Velásquez1,+, N. Johnson Restrepo1,3, R. Leahy1,3, R. Sear4, N. Gabriel2, H. Larson5, Y. Lupu6 1Institute for Data, Democracy and Politics, George Washington University, Washington D.C. 20052 2Physics Department, George Washington University, Washington D.C. 20052 3ClustrX LLC, Washington D.C. 4Department of Computer Science, George Washington University, Washington D.C. 20052 5London School of Hygiene and Tropical Medicine, London WC1 7HT, U.K. 6Department of Political Science, George Washington University, Washington D.C. 20052
+ These authors contributed equally to this paper
Parents - particularly moms - increasingly consult social media for support when taking decisions about
their young children, and likely also when advising other family members such as elderly relatives1,2,3.
Minimizing malignant online influences4,5,6,7,8 is therefore crucial to securing their assent for policies
ranging from vaccinations, masks and social distancing against the pandemic, to household best practices
against climate change, to acceptance of future 5G towers nearby. Here we show how a strengthening of
bonds across online communities during the pandemic, has led to non-Covid-19 conspiracy theories (e.g.
fluoride, chemtrails, 5G) attaining heightened access to mainstream parent communities. Alternative health
communities act as the critical conduits between conspiracy theorists and parents, and make the narratives
more palatable to the latter. We demonstrate experimentally that these inter-community bonds can
perpetually generate new misinformation, irrespective of any changes in factual information. Our findings
show explicitly why Facebook's current policies have failed to stop the mainstreaming of non-Covid-19 and
Covid-19 conspiracy theories and misinformation9,10,11,12,13, and why targeting the largest communities will
not work. A simple yet exactly solvable and empirically grounded mathematical model, shows how modest
tailoring of mainstream communities' couplings could prevent them from tipping against establishment
guidance. Our conclusions should also apply to other social media platforms and topics.
Facebook, the richest and largest social media platform, is struggling to prevent conspiracy theories and
misinformation from moving into the mainstream on its own platform. Facebook is intervening more, and has a huge volume of material and users to moderate. But Fig. 1 suggests that the answer lies less in the amount of
intervention to date, and more in where that intervention is -- and most importantly isn't -- targeted. Extended Data
Fig. 1a shows the visible Facebook intervention, while Fig. 1 shows where these were targeted during 2020. Each node is a community (Facebook Page, see Extended Data Fig. 1) that has become enmeshed in the online health
debate that in 2019 was focused around vaccinations14 and now includes Covid-19's origin, severity and mitigation
including vaccines. A directional link appears when community (node) A provides an explicit link at the Page
level into community (node) B, hence opening up content feed from B and directing its users to look at B. Our data collection follows our published methodology14 (see Methods and Supplementary Information (SI)).
Parents are turning increasingly to such in-built communities on Facebook to share concerns and seek advice from other community members on issues such as family health1,2,3. Mainstream parenting communities include those
focused on children's wellbeing, education, discipline, breastfeeding, best milk choices, pregnancy, parental
rights, homeschooling, home birthing, and special needs. Their average size is 57,895 users, but they range from
1,336,790 down to 25. Most focus on motherhood and most users appear to be women. While these Pages are publicly available, they often connect into private Groups and encrypted chats as shown in Extended Data Fig.
1b. Hence Fig. 1 is the visible skeleton behind which riskier follow-up discussions can take place, e.g. using non-
approved treatments.
2
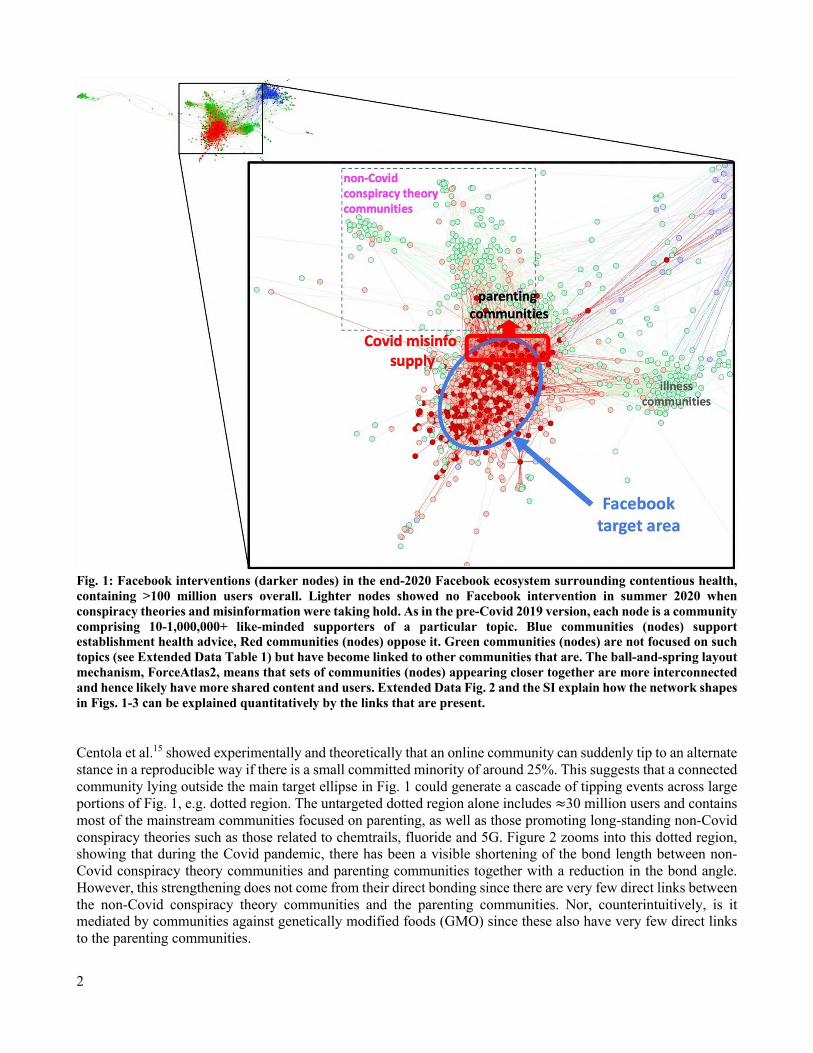
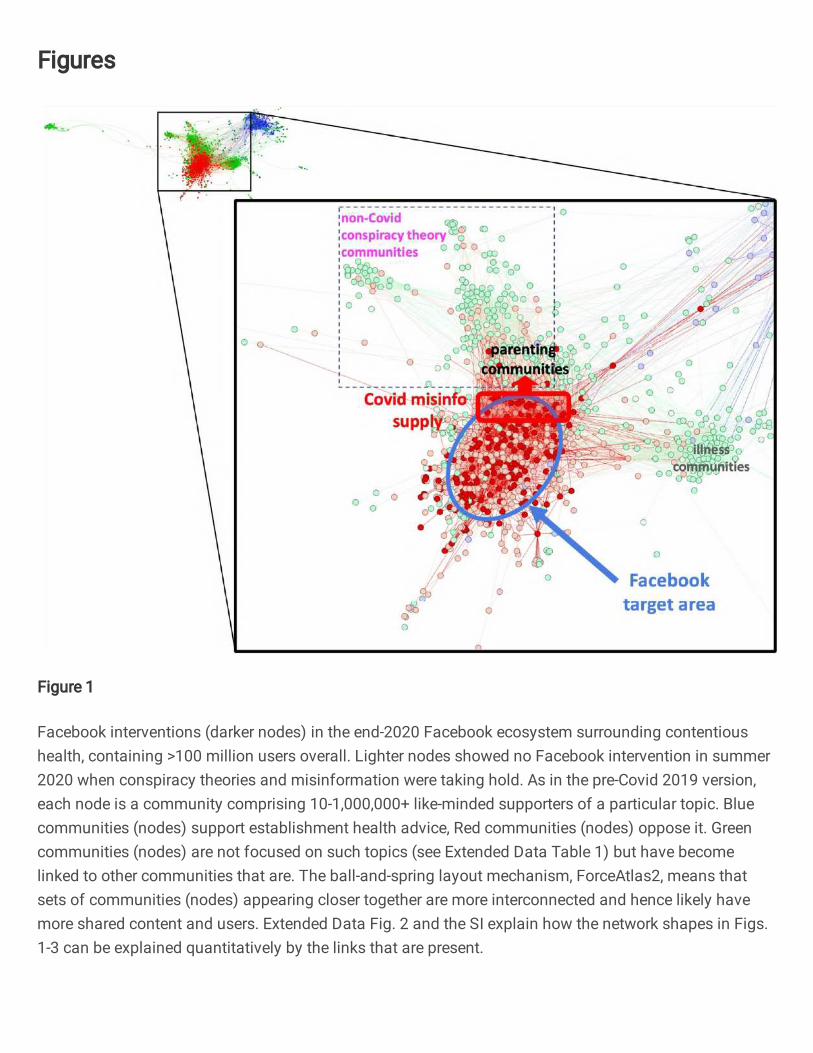
Fig. 1: Facebook interventions (darker nodes) in the end-2020 Facebook ecosystem surrounding contentious health,
containing >100 million users overall. Lighter nodes showed no Facebook intervention in summer 2020 when
conspiracy theories and misinformation were taking hold. As in the pre-Covid 2019 version, each node is a community
comprising 10-1,000,000+ like-minded supporters of a particular topic. Blue communities (nodes) support
establishment health advice, Red communities (nodes) oppose it. Green communities (nodes) are not focused on such
topics (see Extended Data Table 1) but have become linked to other communities that are. The ball-and-spring layout
mechanism, ForceAtlas2, means that sets of communities (nodes) appearing closer together are more interconnected
and hence likely have more shared content and users. Extended Data Fig. 2 and the SI explain how the network shapes
in Figs. 1-3 can be explained quantitatively by the links that are present.
Centola et al.15 showed experimentally and theoretically that an online community can suddenly tip to an alternate
stance in a reproducible way if there is a small committed minority of around 25%. This suggests that a connected
community lying outside the main target ellipse in Fig. 1 could generate a cascade of tipping events across large
portions of Fig. 1, e.g. dotted region. The untargeted dotted region alone includes ≈30 million users and contains
most of the mainstream communities focused on parenting, as well as those promoting long-standing non-Covid
conspiracy theories such as those related to chemtrails, fluoride and 5G. Figure 2 zooms into this dotted region, showing that during the Covid pandemic, there has been a visible shortening of the bond length between non-
Covid conspiracy theory communities and parenting communities together with a reduction in the bond angle.
However, this strengthening does not come from their direct bonding since there are very few direct links between
the non-Covid conspiracy theory communities and the parenting communities. Nor, counterintuitively, is it mediated by communities against genetically modified foods (GMO) since these also have very few direct links
to the parenting communities.
3
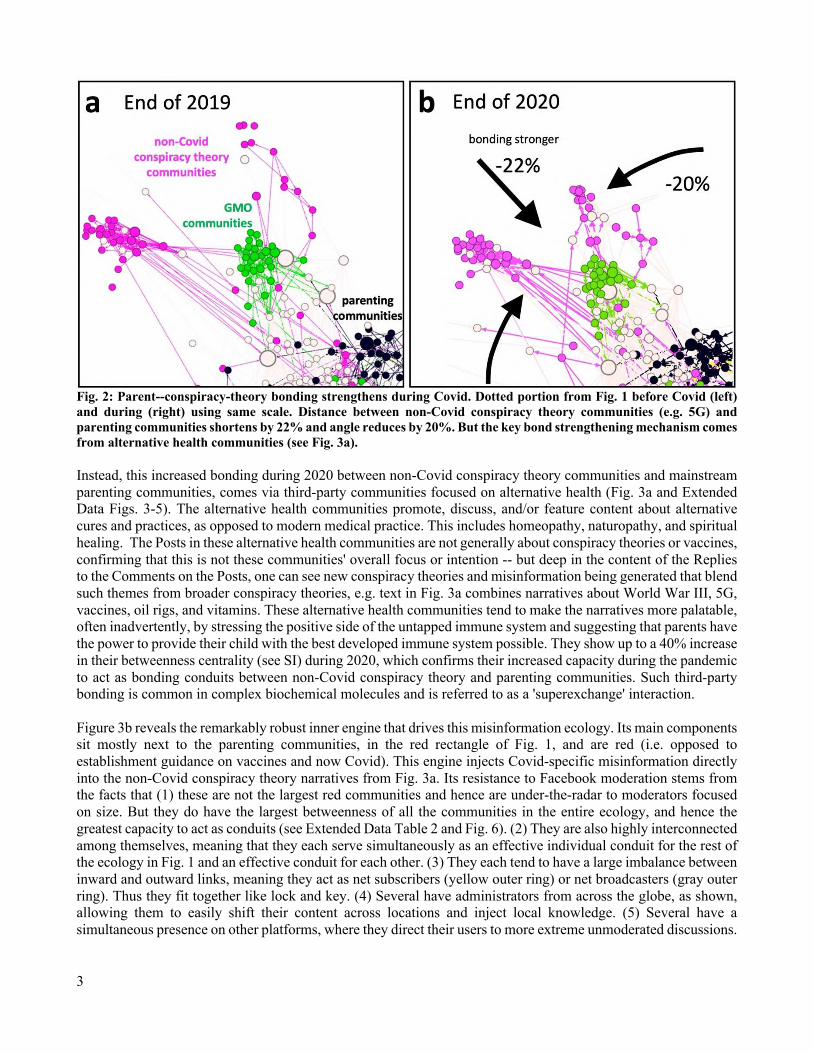
Fig. 2: Parent--conspiracy-theory bonding strengthens during Covid. Dotted portion from Fig. 1 before Covid (left)
and during (right) using same scale. Distance between non-Covid conspiracy theory communities (e.g. 5G) and
parenting communities shortens by 22% and angle reduces by 20%. But the key bond strengthening mechanism comes
from alternative health communities (see Fig. 3a).
Instead, this increased bonding during 2020 between non-Covid conspiracy theory communities and mainstream
parenting communities, comes via third-party communities focused on alternative health (Fig. 3a and Extended Data Figs. 3-5). The alternative health communities promote, discuss, and/or feature content about alternative
cures and practices, as opposed to modern medical practice. This includes homeopathy, naturopathy, and spiritual
healing. The Posts in these alternative health communities are not generally about conspiracy theories or vaccines,
confirming that this is not these communities' overall focus or intention -- but deep in the content of the Replies to the Comments on the Posts, one can see new conspiracy theories and misinformation being generated that blend
such themes from broader conspiracy theories, e.g. text in Fig. 3a combines narratives about World War III, 5G,
vaccines, oil rigs, and vitamins. These alternative health communities tend to make the narratives more palatable, often inadvertently, by stressing the positive side of the untapped immune system and suggesting that parents have
the power to provide their child with the best developed immune system possible. They show up to a 40% increase
in their betweenness centrality (see SI) during 2020, which confirms their increased capacity during the pandemic
to act as bonding conduits between non-Covid conspiracy theory and parenting communities. Such third-party bonding is common in complex biochemical molecules and is referred to as a 'superexchange' interaction.
Figure 3b reveals the remarkably robust inner engine that drives this misinformation ecology. Its main components sit mostly next to the parenting communities, in the red rectangle of Fig. 1, and are red (i.e. opposed to
establishment guidance on vaccines and now Covid). This engine injects Covid-specific misinformation directly
into the non-Covid conspiracy theory narratives from Fig. 3a. Its resistance to Facebook moderation stems from the facts that (1) these are not the largest red communities and hence are under-the-radar to moderators focused
on size. But they do have the largest betweenness of all the communities in the entire ecology, and hence the
greatest capacity to act as conduits (see Extended Data Table 2 and Fig. 6). (2) They are also highly interconnected
among themselves, meaning that they each serve simultaneously as an effective individual conduit for the rest of the ecology in Fig. 1 and an effective conduit for each other. (3) They each tend to have a large imbalance between
inward and outward links, meaning they act as net subscribers (yellow outer ring) or net broadcasters (gray outer
ring). Thus they fit together like lock and key. (4) Several have administrators from across the globe, as shown, allowing them to easily shift their content across locations and inject local knowledge. (5) Several have a
simultaneous presence on other platforms, where they direct their users to more extreme unmoderated discussions.
4
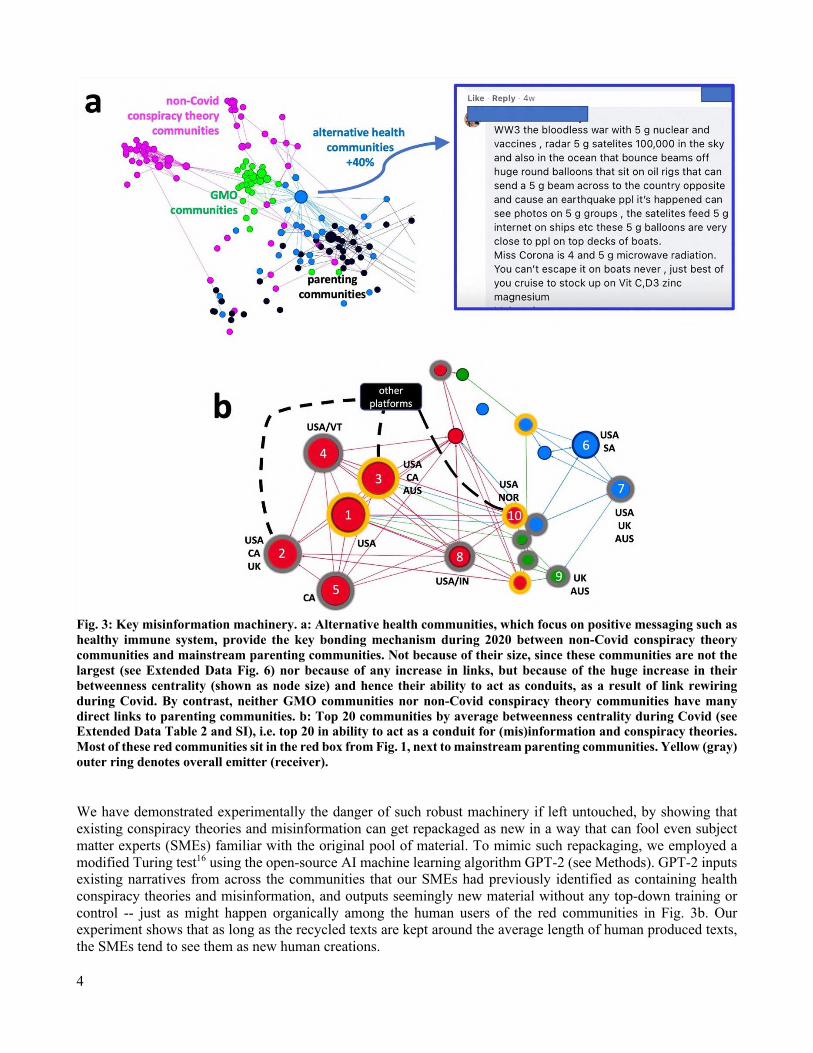
Fig. 3: Key misinformation machinery. a: Alternative health communities, which focus on positive messaging such as
healthy immune system, provide the key bonding mechanism during 2020 between non-Covid conspiracy theory
communities and mainstream parenting communities. Not because of their size, since these communities are not the
largest (see Extended Data Fig. 6) nor because of any increase in links, but because of the huge increase in their
betweenness centrality (shown as node size) and hence their ability to act as conduits, as a result of link rewiring
during Covid. By contrast, neither GMO communities nor non-Covid conspiracy theory communities have many
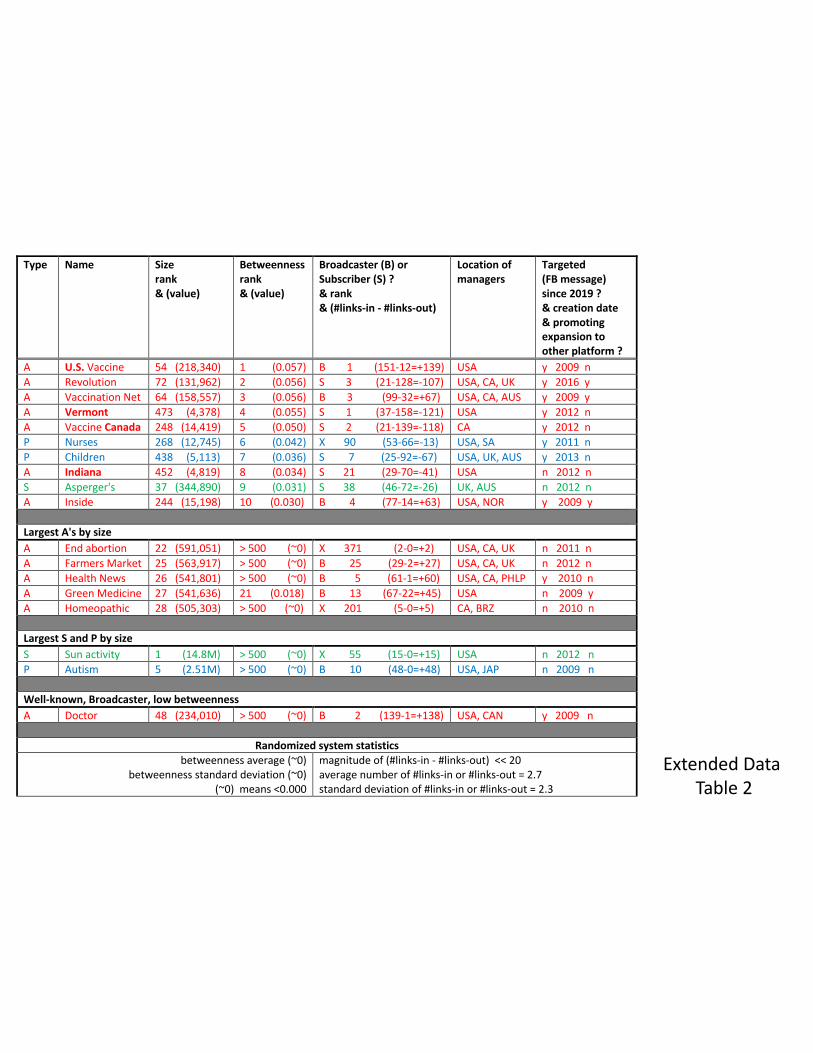
direct links to parenting communities. b: Top 20 communities by average betweenness centrality during Covid (see
Extended Data Table 2 and SI), i.e. top 20 in ability to act as a conduit for (mis)information and conspiracy theories.
Most of these red communities sit in the red box from Fig. 1, next to mainstream parenting communities. Yellow (gray)
outer ring denotes overall emitter (receiver).
We have demonstrated experimentally the danger of such robust machinery if left untouched, by showing that
existing conspiracy theories and misinformation can get repackaged as new in a way that can fool even subject
matter experts (SMEs) familiar with the original pool of material. To mimic such repackaging, we employed a
modified Turing test16 using the open-source AI machine learning algorithm GPT-2 (see Methods). GPT-2 inputs existing narratives from across the communities that our SMEs had previously identified as containing health
conspiracy theories and misinformation, and outputs seemingly new material without any top-down training or
control -- just as might happen organically among the human users of the red communities in Fig. 3b. Our experiment shows that as long as the recycled texts are kept around the average length of human produced texts,
the SMEs tend to see them as new human creations.
5
Our findings indicate that effectively combating online conspiracy theories and misinformation requires the
identification of both their sources and conduits, and these may not be the largest or most prominent communities.
The alternative-health-mediated bonding between conspiracy theory communities and mainstream parenting
communities is outside Facebook's main intervention target area (Fig. 3a). The adjacent machinery (Fig. 3b) of the non-largest red (i.e., anti-vaccination) communities is highly resilient. Taken together, these phenomena
explain why Facebook's current policies have failed to stop the mainstreaming of conspiracy theories and
misinformation, and why targeting the largest communities will not work since they are not the major conduits of misinformation. Mainstream parenting communities are connected into conspiracy theories not primarily through
vaccine safety, but by the control they feel they can have over the immune system of their children. Our findings
complement the many valuable studies that focus on individual pieces of misinformation, individual communities, individual user accounts and news sources4,5,6,7,8,9,10,11,12,13,17,18,19,20,21,22,23. They also align with Ward et al.'s
emphasis that effective messaging and intervention must account for the granular details, such as inequalities and
differentiations between the actual communities to which people belong24,25.
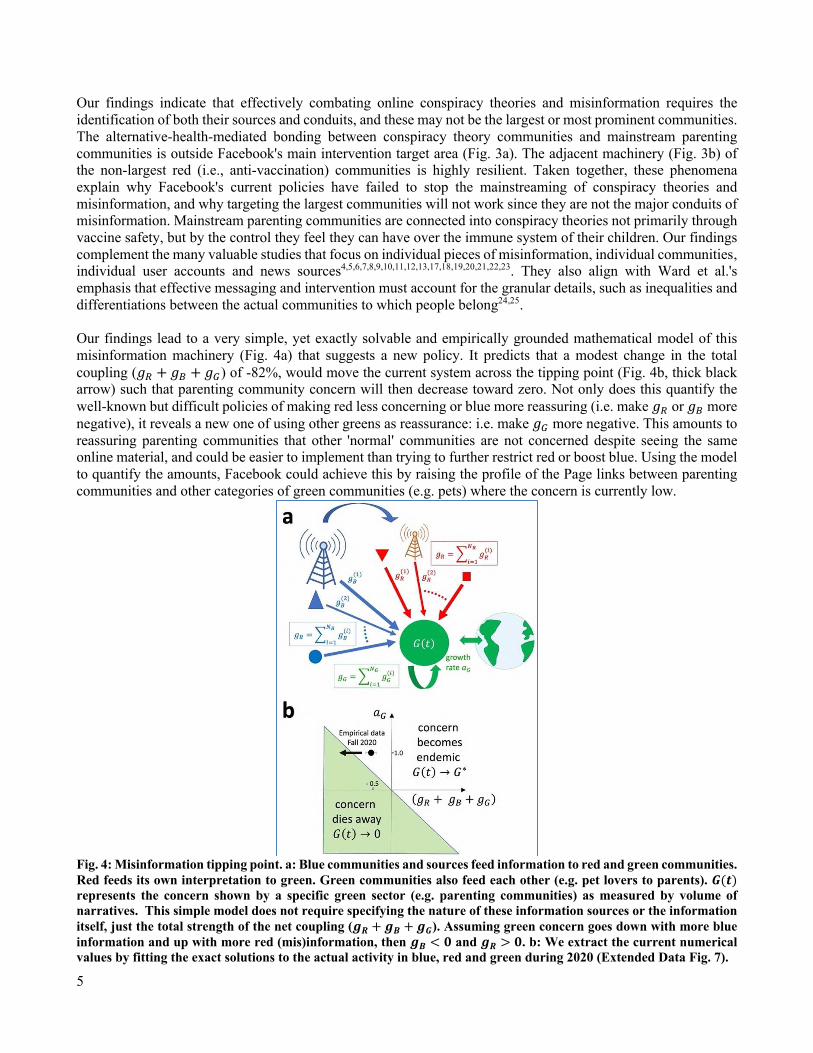
Our findings lead to a very simple, yet exactly solvable and empirically grounded mathematical model of this
misinformation machinery (Fig. 4a) that suggests a new policy. It predicts that a modest change in the total
coupling ("! + "" + "#) of -82%, would move the current system across the tipping point (Fig. 4b, thick black arrow) such that parenting community concern will then decrease toward zero. Not only does this quantify the
well-known but difficult policies of making red less concerning or blue more reassuring (i.e. make "! or "" more
negative), it reveals a new one of using other greens as reassurance: i.e. make "# more negative. This amounts to
reassuring parenting communities that other 'normal' communities are not concerned despite seeing the same online material, and could be easier to implement than trying to further restrict red or boost blue. Using the model
to quantify the amounts, Facebook could achieve this by raising the profile of the Page links between parenting
communities and other categories of green communities (e.g. pets) where the concern is currently low.
Fig. 4: Misinformation tipping point. a: Blue communities and sources feed information to red and green communities.
Red feeds its own interpretation to green. Green communities also feed each other (e.g. pet lovers to parents). !(#) represents the concern shown by a specific green sector (e.g. parenting communities) as measured by volume of
narratives. This simple model does not require specifying the nature of these information sources or the information
itself, just the total strength of the net coupling (%! + %" + %#). Assuming green concern goes down with more blue
information and up with more red (mis)information, then %" < ( and %! > (. b: We extract the current numerical
values by fitting the exact solutions to the actual activity in blue, red and green during 2020 (Extended Data Fig. 7).
6
Limitations of our study include the fact that our approach to achieving understanding at scale necessarily washes
over details of specific narratives. Also, online behavior does not automatically translate to offline behavior --
however it tends to be so for parents in these communities, since they regularly report back on prior advice they have implemented. Real-world impact of online conspiracy theories and misinformation can also be inferred from
the civil engagement, activities and even protests parents report back on. In a non-health context, recent evidence
of online-to-offline influence comes from the 2021 U.S. Department of Homeland Security national terrorism advisory26; recent online activity within a community of traders that produced huge movements in real-world stock
and commodities27; and the use of Facebook to “foment division and incite offline violence” in Myanmar28.
There are many very valuable existing approaches to managing online conspiracy theories and misinformation
based on tracking, counteracting or correcting specific content, and inoculation20. However, scaling to the
population level will still require knowledge of the system-level machinery in Figs. 1-3. Confronting specific
narratives faces additional challenges: for example, the popular conspiracy theory that Covid vaccines feature hidden tracking devices, allowing personal information to be read from individuals' foreheads, derives from a
false interpretation of a published article in a highly respected journal29 that provides a proof-of-concept for this
quantum dot technology. Efforts to label this as wrong science can hence exacerbate the level of concern (i.e.
increasing $(&) in Fig. 4). Also, our simulation in Extended Data Fig. 3c suggests that while inoculating against
GMO narratives, for example, can result in many of the non-Covid conspiracy theory communities ending up
farther from the mainstream parenting communities, a few may end up far closer. This brings to mind the phrase
of behavioral psychologists30 that the messenger (i.e. machinery of delivery) may matter more than the message.
Methods Statistical analyses and details are given in the SI. While not perfect, our definition of nodes and links avoids the
need for individual-level information, and makes the definition of each community unique. It also yields a visually
manageable and interpretable network that is scalable to the population level, since each community contains of
order 100,000+ users, and so the networks that we uncover of ≈1000 nodes (communities) account for 100+
million individuals. We focus on Pages of supporters of a given topic because they tend to foster a true sense of
community among themselves. An AB link generally yields correlated activity (volume of narratives, see SI) between communities A and B. Though most communities are in English, users come from a wide range of
countries. Since each community is self-policed, bot activity tends to be negligible. The exactly solvable model
in Fig. 4, is of the form $̇ = *#($$ − $) + ∑ "!!(-%∗ − $)% + ∑ ""!(.%
∗ − $)% where $ is the amount of concern
in a particular parenting community, or a set, as measured by the volume of their narratives. -%∗ and .%
∗ are fixed
point values for red and blue. Taking /# as the deviation of $ from its possible fixed point $∗, the exact solution
/#(&) = /#(0)1'()"*+#*+$*+")- using the definitions in Fig. 4a. Since $ has not reached its potential peak, then
/#(0) < 0 and so *# > "! + "" + "# means $ increases over time toward $∗, while *# < "! + "" + "# means
$ decreases over time and becomes zero. Hence Fig. 4b follows. In the misinformation recycling experiment, the
SMEs were told nothing to suggest that the narratives produced were not new. Yet they were all a machine generated blend of existing narratives using two versions of GPT-2 with two data preprocessing pipelines. All
data contained only root posts and 10% of each dataset was held out for validation and perplexity calculation. One
model (“antivax_gen1”) was created with minimal preprocessing: anti-vax Facebook data collected through CrowdTangle, concatenating text attributes such as “title”, “link text”, “message”, etc. The second model
(“antivax_gen2”) was created with a more targeted approach: anti-vax Facebook data from CrowdTangle, using
only the “message” attribute. Additionally, we applied a regex before training to remove most URLs from the
text. We used 15 different short text prompts (6 generic ones made of stopwords from NLP Python libraries, 9 incorporating topic keywords discovered by an LDA analysis used for previous research). For each prompt, we
generated text with 3 different temperatures: 1, 1.1, and 1.2, so each GPT-2 model generated 45 text strings, for a
total of 90 strings of generated text. Each string consisted of 500 tokens (words). For the survey, we bundled all 90 strings together into a dataset. From this dataset, we randomly selected strings such that no string’s prompt
7
appeared more than twice. We selected 15 strings with temperature 1, 3 with temperature 1.1, and 2 with temperature 1.2. 8 came from “antivax_gen1” and 12 came from “antivax_gen2”. We truncated these strings to
exactly 500 characters (approximately the average post length in authentic content) and placed them in an
anonymous Google Form. None of the SMEs successfully identified all text strings as being repackaged by GPT-
2, even though they all were. Four of the text strings proved very effective; two fooled 87.5% of participants, and two fooled 75%. Additionally, participants rating their confidence on the two most effective text strings (those
which fooled 87.5% of participants) ranked their confidence, on average, as 4.13/5. The library used to bootstrap
the GPT-2 models is available at https://github.com/huggingface/transformers#citation
References
1. Moon, Y.Y., Mathews, A., Oden, R., Carlin, R. Mothers’ Perceptions of the Internet and Social Media as
Sources of Parenting and Health Information: Qualitative Study. J Med Internet Res. 21(7): e14289 (2019)
2. Ammari, T., Schoenebeck, S. Thanks for your interest in our Facebook group, but it's only for dads: Social Roles of Stay-at-Home Dads. CSCW '16, Feb 27 – March 2, 2016, San Francisco, CA, USA
3. Laws, R., Walsh, A.D., Hesketh, K.D., Downing, K.L., Kuswara, K., Campbell, K.J. Differences Between
Mothers and Fathers of Young Children in Their Use of the Internet to Support Healthy Family Lifestyle Behaviors: Cross-Sectional Study. J Med Internet Res 21(1): e11454 (2019)
4. Brown, R. et al. Counteracting Dangerous Narratives in the Time of COVID-19. Over Zero (2020).
https://projectoverzero.org/newsandpublications 5. Starbird, K., Spiro, E.S., Koltai, K. Misinformation, Crisis, and Public Health—Reviewing the Literature
V1.0. Social Science Research Council, MediaWell. June 25, 2020. https://mediawell.ssrc.org/literature-
reviews/misinformation-crisis-and-public-health. http://doi.org/10.35650/MD.2063.d.2020
6. Larson, H. A lack of information can become misinformation. Nature, 580, 306 (2020) 7. Pasquetto, I.V. et al. Tackling misinformation: What researchers could do with social media data. HKS
Misinformation Review, 2020. https://misinforeview.hks.harvard.edu/article/tackling-misinformation-what-
researchers-could-do-with-social-media-data/ 8. Broniatowski, D.A., Jamison, A.M., Johnson, N.F., Velasquez, N., Leahy, R., Johnson Restrepo, N., Dredze,
M., Quinn, S.C. Facebook Pages, the “Disneyland” Measles Outbreak, and Promotion of Vaccine Refusal as a
Civil Right, 2009–2019. American Journal of Public Health 110, S312-S318 (2020)
9. Miller-Idriss, C. Hate in the Homeland. Princeton University Press, 2020 10. DiResta, R. Of virality and viruses: the anti-vaccine movement and social media. NAPSNet Special Reports
https://nautilus.org/napsnet/napsnet-special-reports/of-virality-and- viruses-the-anti-vaccine-movement-and-
social-media/ (8 November 2018) 11. Bessi, A., Coletto, M., Davidescu, G. A., Scala, A., Caldarelli, G., Quattrociocchi, W. Science vs
conspiracy: Collective narratives in the age of misinformation. PloS one, 10(2) e0118093 (2015)
https://journals.plos.org/plosone/article%3Fid%3D10.1371/journal.pone.0118093 12. Lazer, D.M.J., Baum, M.A., Benkler, Y., Berinsky, A.J., Greenhill, K.M., Menczer, F., Metzger, M.J.,
Nyhan, B., Pennycook, G., Rothschild, D., Schudson, M., Sloman, S.A., Sunstein, C.R., Thorson, E.A., Watts,
D.J., Zittrain, J.L. The science of fake news. Science 359, 1094–1096 (2018)
doi:10.1126/science.aao2998pmid:29590025 13. Chen, E., Lerman, K., Ferrara, E. Tracking Social Media Discourse About the COVID-19 Pandemic:
Development of a Public Coronavirus Twitter Data Set. JMIR Public Health and Surveillance 6, e19273 (2020)
14. Johnson, N.F., N. Velasquez, N. Johnson Restrepo, R. Leahy, N. Gabriel, S. El Oud, M. Zheng, P. Manrique, S. Wuchty, Y. Lupu. The online competition between pro- and anti-vaccination
views. Nature 582, 230–233 (2020). https://doi.org/10.1038/s41586-020-2281-1
15. Centola, D., Becker, J., Brackbill, D., Baronchelli, D. Science 360, 1116–1119 (2018) 16. Kobis, N., Mossnik, L.D. Artificial intelligence versus Maya Angelou: Experimental evidence that people
cannot differentiate AI-generated from human-written poetry. Computers in Human Behavior. 114: 106553. 1
January 2021. doi:10.1016/j.chb.2020.106553
8
17. Smith, R., Cubbon, S., Wardle, C. (2020). Under the surface: Covid-19 vaccine narratives, misinformation &
data deficits on social media. First Draft. https://firstdraftnews.org/vaccine- narratives-report-summary-
november-2020
18. Gruzd, A., Mai, P. Inoculating Against an Infodemic: A Canada-Wide COVID-19 News, Social Media, and Misinformation Survey (May 11, 2020). Available at
https://ssrn.com/abstract=3597462 or http://dx.doi.org/10.2139/ssrn.3597462
19. Lewandowsky, S., Cook, J., Ecker, U. K. H., Albarracín, D., Amazeen, M. A., Kendeou, P., Lombardi, D., Newman, E. J., Pennycook, G., Porter, E. Rand, D. G., Rapp, D. N., Reifler, J., Roozenbeek, J., Schmid, P.,
Seifert, C. M., Sinatra, G. M., Swire-Thompson, B., van der Linden, S., Vraga, E. K., Wood, T. J., Zaragoza, M.
S. (2020). The Debunking Handbook 2020. Available at https://sks.to/db2020. DOI:10.17910/b7.1182 20. Donovan, J. Social-media companies must flatten the curve of misinformation. Nature 14 April, 2020.
https://www.nature.com/articles/d41586-020-01107-z
21. Dodds P.S., Harris K.D., Kloumann I.M., Bliss C.A., Danforth C.M. Temporal Patterns of Happiness and
Information in a Global Social Network: Hedonometrics and Twitter. PLoS ONE 6, e26752 (2011) 22. Onnela, J.P., Saramäki, J., Hyvönen, J., Szabó, G., Lazer, D., Kaski, K., Kertész, J., Barabási, A.L. Structure
and tie strengths in mobile communication networks. PNAS 104, 7332-7336 (2007)
https://doi.org/10.1073/pnas.0610245104 23. Bechmann, A. Tackling Disinformation and Infodemics Demands Media Policy Changes. Digital
Journalism, 1-13 (2020)
24. Maximizing the impact of HIV prevention technologies in sub‐Saharan Africa, Guest Editors: H. Ward, G.P. Garnett, K.H. Mayer, G.A. Dallabetta. Volume 22, Issue S4 Special Issue: July 2019
25. Ward, H. The UK has record death tolls, yet still the government has no clear Covid strategy, The Guardian,
21 Jan 2021
26. National Terrorism Advisory System Bulletin - January 27, 2021. https://www.dhs.gov/ntas/advisory/national-terrorism-advisory-system-bulletin-january-27-2021
27. GameStop investor battle moves on to silver as prices surge. https://www.bbc.com/news/business-55882758
28. An Independent Assessment of the Human Rights Impact of Facebook in Myanmar. https://about.fb.com/news/2018/11/myanmar-hria/
29. McHugh, K.J. et al. Biocompatible near-infrared quantum dots delivered to the skin by microneedle patches
record vaccination. Sci Transl Med 11, eaay7162. 10.1126/scitranslmed.aay7162 (2019)
30. Gelfand M.J., Harrington J.R., Jackson J.C. The Strength of Social Norms Across Human Groups. Perspectives On Psychological Science: Journal of the Association For Psychological Science. 12: 800-
809 PMID 28972845 DOI: 10.1177/1745691617708631 (2017)
Acknowledgments: We thank Rashmi Menon and Adwoa Brako for help with the diagram in Fig. 3b,
and Om Jha for joint research on a triad variant of the model in Fig. 4. We are grateful for our use of
CrowdTangle to access some of our data, through IDDP at George Washington University.
Author contributions All authors contributed to the research design and the manuscript. N.F.J. N.V.,
N.J.R., R.L., R.S., N.G., Y.L. performed the analysis. N.F.J. wrote the initial manuscript draft. All
authors reviewed the final manuscript version.
Competing interests The authors declare no competing interests.
Supplementary Information (SI)
1. Data
2. Network links
3. Network layout
4. Betweenness Centrality: ability to act as a conduit
9
Extended Data Captions
Extended Data Fig. 1: a: Facebook intervention in a community (Facebook Page). b: Private Group
attached directly to a public Page.
Extended Data Table 1: Composition of green communities (nodes).
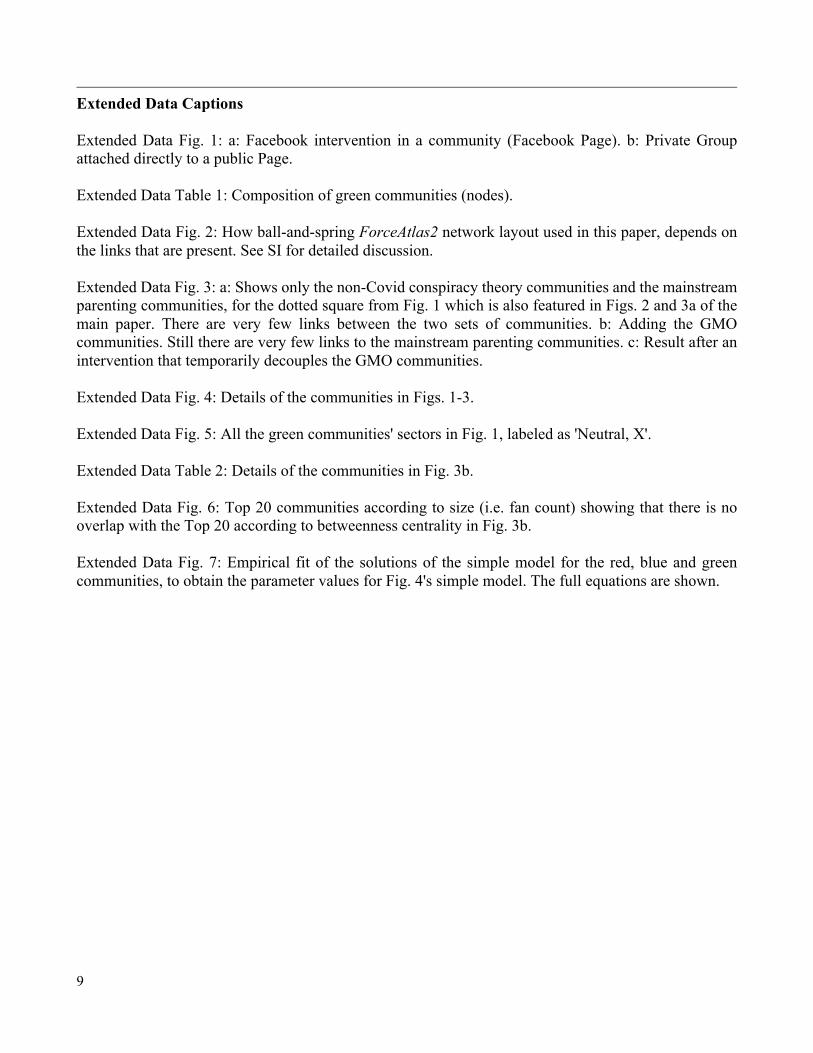
Extended Data Fig. 2: How ball-and-spring ForceAtlas2 network layout used in this paper, depends on
the links that are present. See SI for detailed discussion.
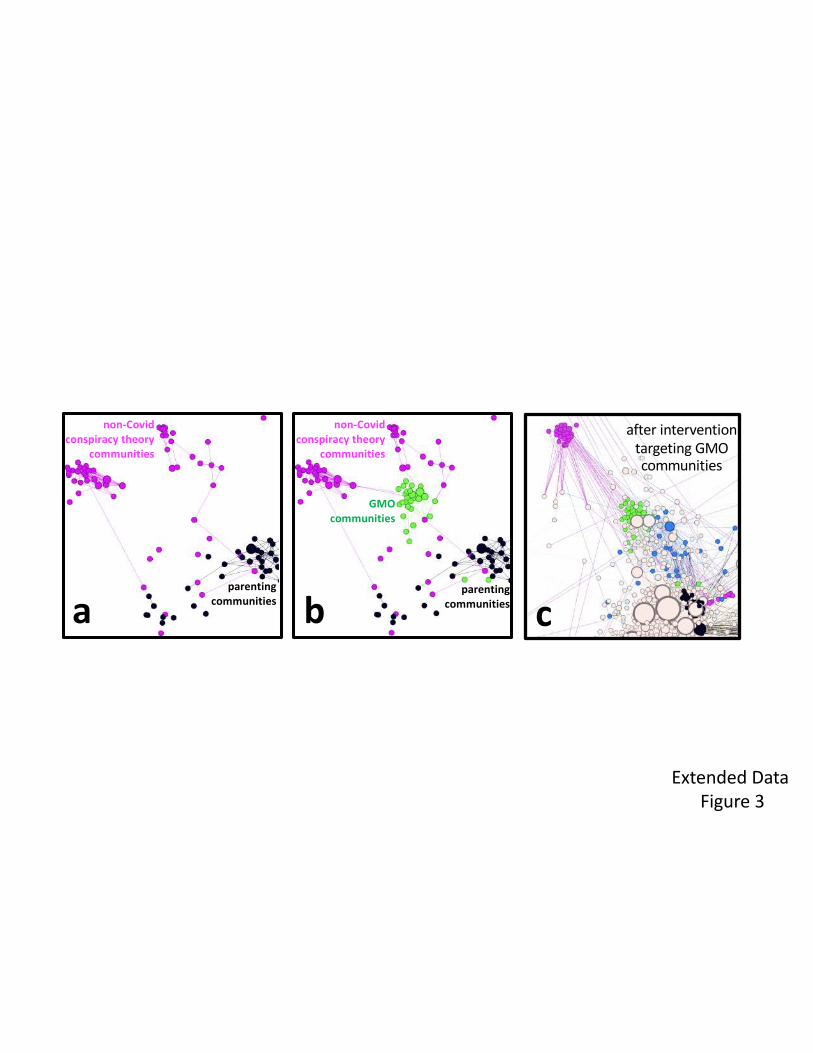
Extended Data Fig. 3: a: Shows only the non-Covid conspiracy theory communities and the mainstream
parenting communities, for the dotted square from Fig. 1 which is also featured in Figs. 2 and 3a of the
main paper. There are very few links between the two sets of communities. b: Adding the GMO
communities. Still there are very few links to the mainstream parenting communities. c: Result after an
intervention that temporarily decouples the GMO communities.
Extended Data Fig. 4: Details of the communities in Figs. 1-3.
Extended Data Fig. 5: All the green communities' sectors in Fig. 1, labeled as 'Neutral, X'.
Extended Data Table 2: Details of the communities in Fig. 3b.
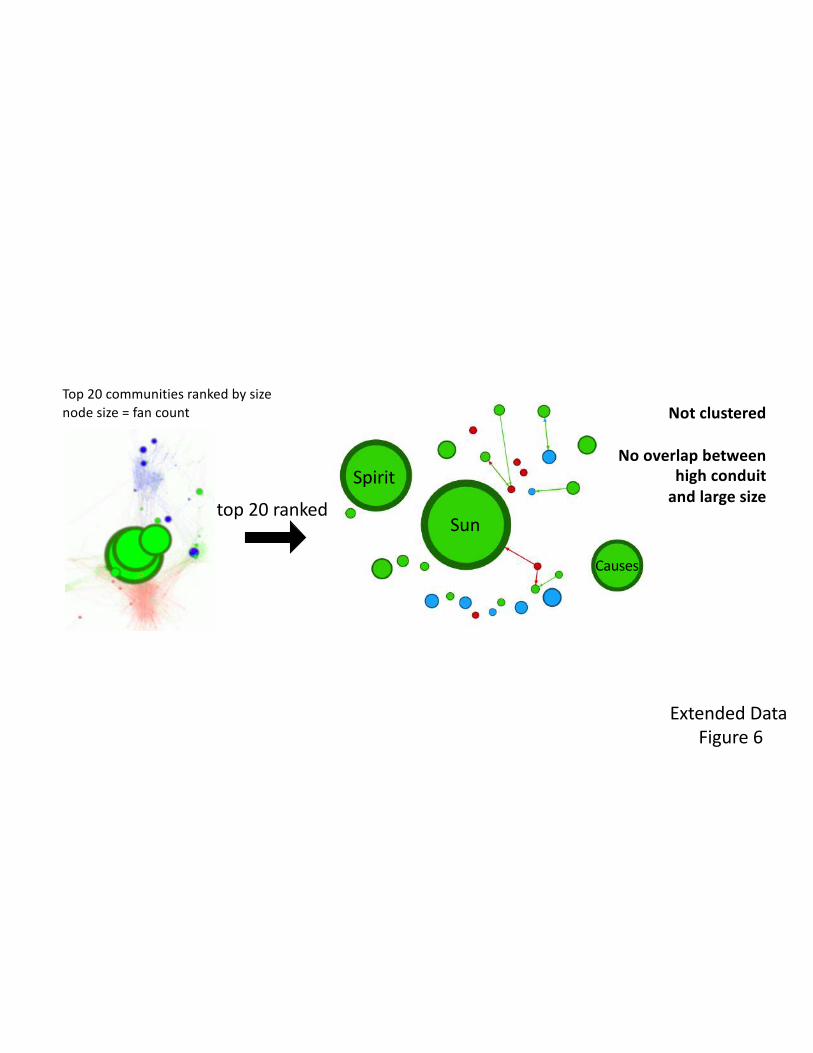
Extended Data Fig. 6: Top 20 communities according to size (i.e. fan count) showing that there is no
overlap with the Top 20 according to betweenness centrality in Fig. 3b.
Extended Data Fig. 7: Empirical fit of the solutions of the simple model for the red, blue and green
communities, to obtain the parameter values for Fig. 4's simple model. The full equations are shown.
Extended Data
Figure 1
a b

Extended Data
Table 1
1
1
2 2
3 3
a b c
Extended Data
Figure 2
a b c
after intervention
targeting GMO
communities
Extended Data
Figure 3
non-Covid
conspiracy theory
communities
GMO
communities
parenting
communitiesparenting
communities
non-Covid
conspiracy theory
communities
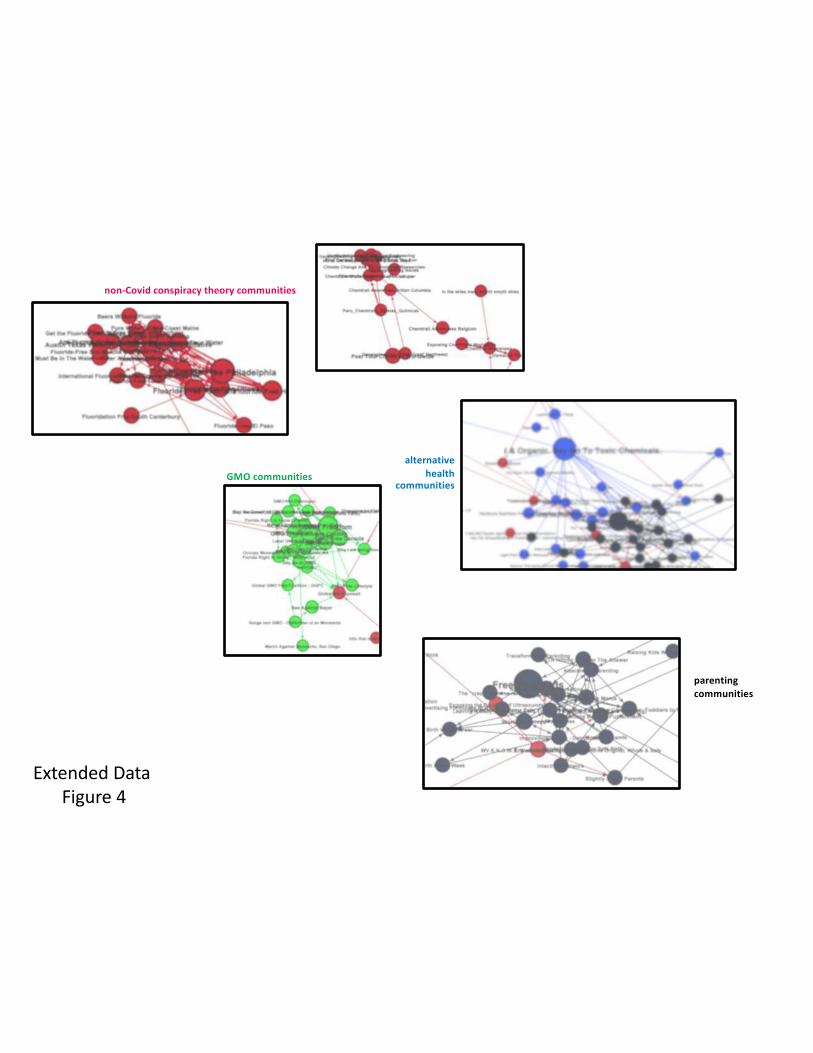
Extended Data
Figure 4
alternative
health
communities
non-Covid conspiracy theory communities
GMO communities
parenting
communities
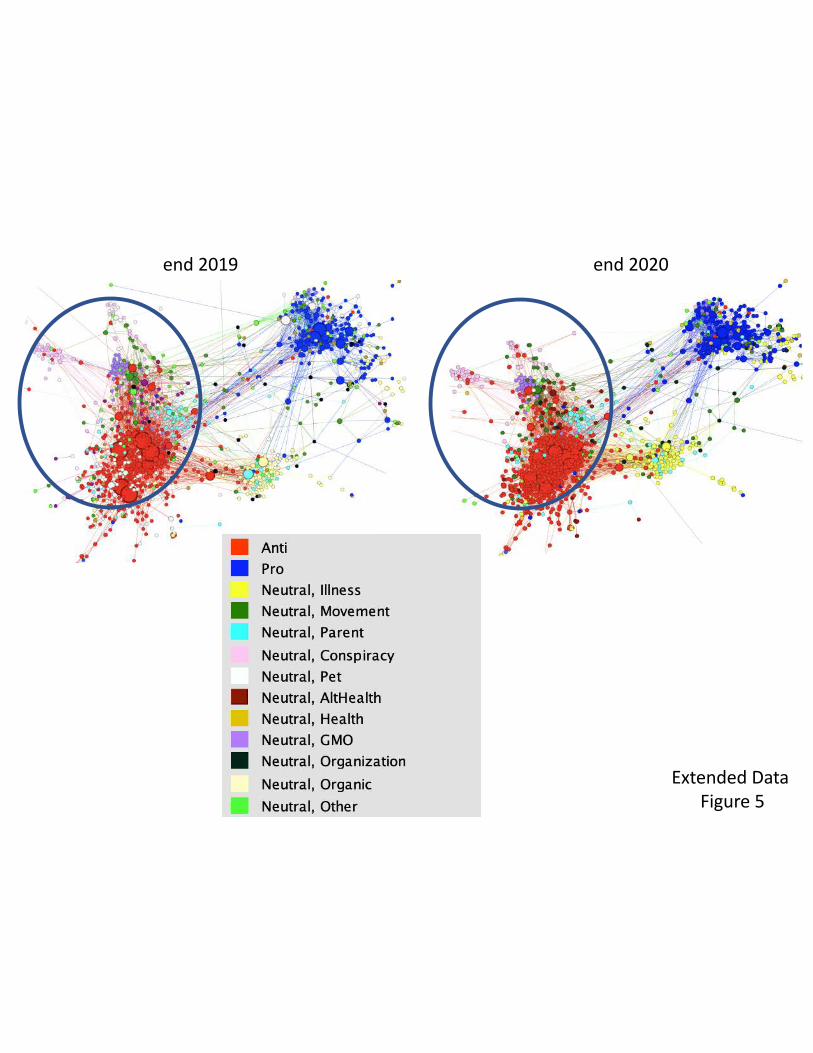
end 2020end 2019
Extended Data
Figure 5
Type Name Size
rank
& (value)
Betweenness
rank
& (value)
Broadcaster (B) or
Subscriber (S) ?
& rank
& (#links-in - #links-out)
Location of
managers
Targeted
(FB message)
since 2019 ?
& creation date
& promoting
expansion to
other platform ?
A U.S. Vaccine 54 (218,340) 1 (0.057) B 1 (151-12=+139) USA y 2009 n
A Revolution 72 (131,962) 2 (0.056) S 3 (21-128=-107) USA, CA, UK y 2016 y
A Vaccination Net 64 (158,557) 3 (0.056) B 3 (99-32=+67) USA, CA, AUS y 2009 y
A Vermont 473 (4,378) 4 (0.055) S 1 (37-158=-121) USA y 2012 n
A Vaccine Canada 248 (14,419) 5 (0.050) S 2 (21-139=-118) CA y 2012 n
P Nurses 268 (12,745) 6 (0.042) X 90 (53-66=-13) USA, SA y 2011 n
P Children 438 (5,113) 7 (0.036) S 7 (25-92=-67) USA, UK, AUS y 2013 n
A Indiana 452 (4,819) 8 (0.034) S 21 (29-70=-41) USA n 2012 n
S Asperger's 37 (344,890) 9 (0.031) S 38 (46-72=-26) UK, AUS n 2012 n
A Inside 244 (15,198) 10 (0.030) B 4 (77-14=+63) USA, NOR y 2009 y
Largest A's by size
A End abortion 22 (591,051) > 500 (~0) X 371 (2-0=+2) USA, CA, UK n 2011 n
A Farmers Market 25 (563,917) > 500 (~0) B 25 (29-2=+27) USA, CA, UK n 2012 n
A Health News 26 (541,801) > 500 (~0) B 5 (61-1=+60) USA, CA, PHLP y 2010 n
A Green Medicine 27 (541,636) 21 (0.018) B 13 (67-22=+45) USA n 2009 y
A Homeopathic 28 (505,303) > 500 (~0) X 201 (5-0=+5) CA, BRZ n 2010 n
Largest S and P by size
S Sun activity 1 (14.8M) > 500 (~0) X 55 (15-0=+15) USA n 2012 n
P Autism 5 (2.51M) > 500 (~0) B 10 (48-0=+48) USA, JAP n 2009 n
Well-known, Broadcaster, low betweenness
A Doctor 48 (234,010) > 500 (~0) B 2 (139-1=+138) USA, CAN y 2009 n
Randomized system statistics
betweenness average (~0)
betweenness standard deviation (~0)
(~0) means <0.000
magnitude of (#links-in - #links-out) << 20
average number of #links-in or #links-out = 2.7
standard deviation of #links-in or #links-out = 2.3
Extended Data
Table 2
Sun
Spirit
Causes
Top 20 communities ranked by size
node size = fan count
top 20 ranked
Not clustered
No overlap between
high conduit
and large size
Extended Data
Figure 6

Extended Data
Figure 7
"̇ = $! "" − " + '# ( − "
(̇ = $# (" − (
)̇ = $$ )" − ) + *! " − ) + *# ( − ) Initial conditions (" 0 ,% 0 , & 0 )
1
SI for "Mainstreaming of conspiracy theories and misinformation"
N.F. Johnson, N. Velásquez, N. Johnson Restrepo, R. Leahy, R. Sear, N. Gabriel, H. Larson, Y. Lupu
CONTENTS
1. Data
2. Network links
3. Network layout
4. Betweenness Centrality: ability to act as a conduit
1. Data
Our method of data collection is akin to the one we previously employed in Ref. 14 of the main paper. In Ref. 14, we had identified Facebook communities (specifically, Pages) that were either anti-vaccination (“red node”),
pro-vaccination (“blue node”), or interested in vaccines without taking a clear position (“green node”). In this
paper, we update that to post-Covid, noting that nearly all the communities active on the topic of vaccines now
include discussions of Covid vaccines and also Covid mitigation measures such as masks and lockdowns. The red communities also tend to promote narratives that downplay Covid as a disease, both the risk of catching it
and its severity. Hence the ecology in Fig. 1, though overall visually similar to that of the vaccines from 2019
pre-Covid in Ref. 14, can now be regarded as the ecology of contentious Covid discussions. Our approach does not require any private information about individuals. The ForceAtlas2 layout of Gephi simulates a physical
system in which nodes repel each other while links act as springs. It is color-agnostic, that is, the color
segregation emerges spontaneously and is not in-built. Nodes that appear closer to each other have local environments that are more highly interconnected, whereas nodes that are far apart do not. Our data collection
uses the same cluster snowballing methodology as described previously [see Ref. 14 and Johnson, N. F. et al.
Hidden resilience and adaptive dynamics of the global online hate ecology. Nature 573, 261–265 (2019)
and Johnson, N. F. et al. New online ecology of adversarial aggregates: ISIS and beyond. Science 352, 1459–1463 (2016)]: that is, a combination of automated processes and human subject-matter analysis. Each node
(Facebook page) directly receives the feed of narratives and other material from that page and all members
(fans) can engage in the discussions and posting activity. Analysis of the content shows that green communities have users who demonstrate positive sentiment toward new and non-traditional sources, while demonstrating
lower sentiment toward establishment and government sources, including established sources of health
information. The resulting ecology adapts and evolves in time across, local, national, and global scales. Each green node tends to focus on one of a relatively small set of themes. These range from illness support, pet
owners, parents, movements, alternative remedies, to conspiracy theories. The green nodes’ activity ranges from
a few posts per month to several per day, with user engagement dependent on the post and other community
dynamics. Alternative health communities (nodes) promote vitamins and essential oils as cures or preventative measures to ward off Covid. An alternative health node is a Facebook Page that promotes, discusses, or features
content about alternative cures and practices, as opposed to modern medical practice. This includes homeopathy,
naturopathy, and spiritual healing. These clusters focus on anything from more common conditions such as headaches, indigestion, and general wellness, up to serious illnesses/conditions such as cancer and genetic
disorders. A conspiracy theory node is a Facebook Page that promotes or discusses fringe or extreme theories
based on unfounded claims that covert actors are responsible for events or circumstances. This category is
dominated by two main conspiracy theories: fluoride in water and chemtrails. The fluoride conspiracy theory claims governments use it to control the population, lower individuals’ intelligence levels, affect fertility levels,
and cause health problems. The nomenclature tends to include terms such as “fluoride free” or “clean water”.
Chemtrail conspiracy theory nodes share the idea that planes/aircraft under the direction of the government and shadowy organizations are spraying chemicals in the sky to affect the health and mental capacity of the
population below. Although these are two different conspiracy theories, they share a similar theme of malign
actors controlling the population through chemical poisoning. While there are many conspiracy theory nodes, they tend to be small in terms of users. The names of these nodes tend to include geographical references, which
2
perhaps limit the potential user base. Nonetheless, these users tend to hold extreme views, which makes them susceptible to other conspiracy theories. These pages might also serve as a starting point for radicalizing users
toward more extreme views. Some of these nodes promote and market “remedies” such as essential oils, herbal
supplements, or unconventional medicines. They sometimes do this by addressing these products in their
posts/pictures and/or sharing links to websites where they can be purchased. Other nodes might share anecdotal remedies: this includes recommending alternative diets and practices such as eating “raw”. While not the largest
category in terms of number of nodes, it is the largest in terms of total user size. This can be attributed to the
large size of the top few nodes in this category, as shown in Extended Data Fig. 6. A GMO node is a Facebook page that debates or opposes the use of genetically modified organisms in food and medicines. Posts generally
attempt to raise awareness of products that contain GMOs and argue that these cause harmful effects. These
nodes often call for a boycott of certain brands or products and/or a requirement to label GMOs. Users often focus on Monsanto as the main antagonist; the company is often named in posts and the names of nodes. There
are relatively few GMO nodes, and they tend to be small in terms of users. The names of these nodes tend to
also include geographical references, which again perhaps limits the potential user base.
We now provide some additional statistical details and results:
First, we looked at whether the high fraction of red communities in the Top 10 or Top 20 lists in terms of
betweenness (Fig. 3b main paper), and separately the high fraction of green communities in the Top 10 or Top 20 lists in terms of size (i.e. number of fans, as in Extended Data Fig. 6), would occur out of chance. There are
465 red clusters, 696 green clusters and 195 blue clusters in the 2020 data.
• the Top 10 by betweenness has 7 reds, 2 blues, 1 green. The expected number if these were chosen
independent of color, is 3.43 reds, 1.44 blues, 5.13 greens. The chi-squared statistic and p-value are 7.26 and 0.027. This means that we can reject the hypothesis that they were chosen independent of color at
the p<0.1 significance level
• the Top 20 by betweenness has 10 reds, 6 blues, 4 greens. The expected number if these were chosen
independent of color, is 6.86 reds, 2.88 blues, 10.26 greens. The chi-squared statistic and p-value are
8.66 and 0.013. This means that we can reject the hypothesis that they were chosen independent of color at the p<0.1 significance level
• the Top 10 by size has 0 reds, 3 blues, 7 greens. The expected number if these were chosen independent
of color, is 3.43 reds, 1.44 blues, 5.13 greens. The chi-squared statistic and p-value are 5.80 and 0.055.
This means that we can reject the hypothesis that they were chosen independent of color at the p<0.1 significance level
• the Top 20 by size has 0 reds, 5 blues, 15 greens. The expected number if these were chosen
independent of color, is 6.86 reds, 2.88 blues, 10.26 greens. The chi-squared statistic and p-value are
10.62 and 0.0049. This means that we can reject the hypothesis that they were chosen independent of color at the p<0.1 significance level
These results show that the top-ranked lists in Fig. 3b and Extended Data Fig. 6, are not randomly generated in
terms of color.
Next, we looked at whether the Top 10 or Top 20 lists in terms of the difference between in and out links, would
occur out of chance.
• the Top 10 nodes by magnitude of out-links minus in-links, has 9 reds, 1 blue, 0 greens. The expected
number if these were chosen independent of color, is 3.43 reds, 1.44 blues, 5.13 greens. The chi-squared statistic and p-value are 14.31 and 0.00078. This means that we can reject the hypothesis that they were
chosen independent of color at the p<0.1 significance level
• the Top 20 nodes by magnitude of out-links minus in-links, has 16 reds, 1 blue, 3 greens. The expected
number if these were chosen independent of color, is 6.86 reds, 2.88 blues, 10.26 greens. The chi-
squared statistic and p-value are 18.54 and 0.00009. This means that we can reject the hypothesis that they were chosen independent of color at the p<0.1 significance level
These results show that the list of top-ranked nodes in terms magnitude of out-links minus magnitude of in-
links, is not randomly generated in terms of color.
3
Then we looked at whether the categories of green community in the Top 10 or Top 20 lists in terms of the
betweenness, would occur out of chance. We obtain p=0.021 which suggests that these results are not
independent of green category, i.e. green category matters.
To give an example of the alternative health community growth in betweenness during the 2020 Covid
pandemic, we note the example of one that was 35th in the list of all nodes ranked by betweenness at the end of
2019 with a value of 0.00891, and then moved up to 29th in the list at the end of 2020 with a value of 0.01255 and hence an increase of 41%. Neither its number of links nor its closeness centrality changed in any significant
way: in-links minus out-links was (12-59)=-47 at the end of 2019, and (11-58)=-47 at the end of 2020. The
closeness centrality was 0.2788 at the end of 2019 and went to 0.2709 at the end of 2020. Hence the change came from a rewiring of the links in its neighborhood. Also the entire ecology network going from the end of
2019 to the end of 2020, did not change significantly, with the number of links per node on average changing
from 5.96 to 6.02. In Fig. 3b of the main paper, we took an emitter (receiver) as having more than 20 in-links or
out-links and the number of in-links minus out-links (out-links minus in-links) of at least 20. Changing this
criterion does not change any of our conclusions. Finally, we note that our model's form !̇ = $!(!" − !) for
the growth of a node without coupling, gives a concave down curve shape that is surprisingly close to the empirical data for the growth in size of a Facebook community.
2. Network links
We now justify our statement that an AB link leads to correlated activity (volume of narratives) between
communities A and B. Consider two Pages, i and j, among a collection of N Facebook Pages, and suppose that
Page i likes Page j. In this situation, we say there is a link from Page i to Page j. There are two consequences to this action by Page i. First, Page j will appear in the sidebar of Page i, and second, followers of Page i may see
content from Page j on their feed. In this way, we see that content can spread backwards along links from Page j
to Page i. This link may then provide a mechanism for increasing post views beyond the followers of Page j,
which in turn may increase overall activity (likes, comments, and shares of posts) on that Page. Moreover, increasing viewership beyond a Pages' user base is likely a critical determinant of that Pages' ability to sustain
activity and growth of the Page. In this way, the presence of links may provide some indication of Pages' ability
to engage new followers. If Page i links to Page j, users of Page i may be presented with content from Page j. Given an overlap in beliefs, then we might expect that both Pages would concurrently benefit from posting
about a particular event in the news which are relevant to these overlapping beliefs. For this reason, we may
suspect that there will be correlation in the growth of Pages which have overlapping ideological beliefs, with the
correlation being some monotone increasing function of the overlap between the Pages. To test this, we use a collection of 67 Pages which post about extreme anti-government ideas in the U.S.. The number of unlinked
pairs of Pages (i.e. Pages that do not like one another) is 3136 and linked Pages (one Page likes another) is 76.
We calculate a measure of the correlation between Pages for linked and unlinked Pages, assigning 1 for a link and 0 for no link. The mean for the unlinked Pages is 0.115 and the mean of the linked Pages is 0.255. Since
these samples are relatively large, and their means relatively far apart, this gives an extremely small p-value of p
= 0.0000037 for a two sample unequal variance t-test. This result indicates that the probability that the samples have equal mean is vanishingly small. A broad interpretation of this result is that the presence of links has some
meaningful relation to the functional behavior of the Pages, particularly the mutual growth of linked Pages. In
other words, there is evidence for mutual growth between linked Pages. We then did the same specifically for
Pages in the vaccine ecology of Ref. 14. Again, the linked Pages show a small but significant excess relative to the unlinked Pages. The reason the correlation is small is probably that (1) the links are not fully utilized by
Facebook's algorithms to "forward" posts to the users feeds. e.g. all posts may not be shown from a linked Page
if they are not interesting, or historically they haven't had success sharing along a particular link. In that way the links may be present, and hence the feed read and understood by users of the other community, but not
necessarily responded to. (2) The parents read and digest the content, but do not then go and post new activity in
immediate response. In other words, the link had influence on the reader -- but this influence sits passive until a later time.
4
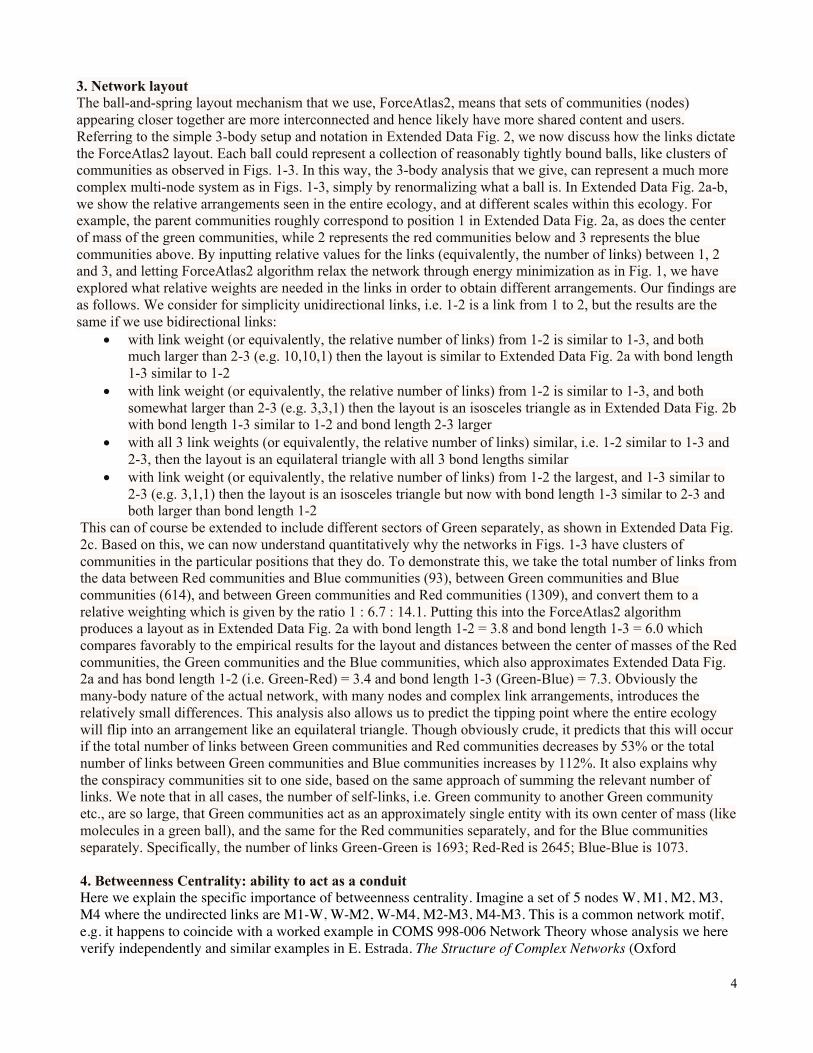
3. Network layout
The ball-and-spring layout mechanism that we use, ForceAtlas2, means that sets of communities (nodes)
appearing closer together are more interconnected and hence likely have more shared content and users.
Referring to the simple 3-body setup and notation in Extended Data Fig. 2, we now discuss how the links dictate
the ForceAtlas2 layout. Each ball could represent a collection of reasonably tightly bound balls, like clusters of communities as observed in Figs. 1-3. In this way, the 3-body analysis that we give, can represent a much more
complex multi-node system as in Figs. 1-3, simply by renormalizing what a ball is. In Extended Data Fig. 2a-b,
we show the relative arrangements seen in the entire ecology, and at different scales within this ecology. For example, the parent communities roughly correspond to position 1 in Extended Data Fig. 2a, as does the center
of mass of the green communities, while 2 represents the red communities below and 3 represents the blue
communities above. By inputting relative values for the links (equivalently, the number of links) between 1, 2 and 3, and letting ForceAtlas2 algorithm relax the network through energy minimization as in Fig. 1, we have
explored what relative weights are needed in the links in order to obtain different arrangements. Our findings are
as follows. We consider for simplicity unidirectional links, i.e. 1-2 is a link from 1 to 2, but the results are the
same if we use bidirectional links:
• with link weight (or equivalently, the relative number of links) from 1-2 is similar to 1-3, and both much larger than 2-3 (e.g. 10,10,1) then the layout is similar to Extended Data Fig. 2a with bond length
1-3 similar to 1-2
• with link weight (or equivalently, the relative number of links) from 1-2 is similar to 1-3, and both
somewhat larger than 2-3 (e.g. 3,3,1) then the layout is an isosceles triangle as in Extended Data Fig. 2b with bond length 1-3 similar to 1-2 and bond length 2-3 larger
• with all 3 link weights (or equivalently, the relative number of links) similar, i.e. 1-2 similar to 1-3 and
2-3, then the layout is an equilateral triangle with all 3 bond lengths similar
• with link weight (or equivalently, the relative number of links) from 1-2 the largest, and 1-3 similar to
2-3 (e.g. 3,1,1) then the layout is an isosceles triangle but now with bond length 1-3 similar to 2-3 and both larger than bond length 1-2
This can of course be extended to include different sectors of Green separately, as shown in Extended Data Fig.
2c. Based on this, we can now understand quantitatively why the networks in Figs. 1-3 have clusters of
communities in the particular positions that they do. To demonstrate this, we take the total number of links from the data between Red communities and Blue communities (93), between Green communities and Blue
communities (614), and between Green communities and Red communities (1309), and convert them to a
relative weighting which is given by the ratio 1 : 6.7 : 14.1. Putting this into the ForceAtlas2 algorithm produces a layout as in Extended Data Fig. 2a with bond length 1-2 = 3.8 and bond length 1-3 = 6.0 which
compares favorably to the empirical results for the layout and distances between the center of masses of the Red
communities, the Green communities and the Blue communities, which also approximates Extended Data Fig. 2a and has bond length 1-2 (i.e. Green-Red) = 3.4 and bond length 1-3 (Green-Blue) = 7.3. Obviously the
many-body nature of the actual network, with many nodes and complex link arrangements, introduces the
relatively small differences. This analysis also allows us to predict the tipping point where the entire ecology
will flip into an arrangement like an equilateral triangle. Though obviously crude, it predicts that this will occur if the total number of links between Green communities and Red communities decreases by 53% or the total
number of links between Green communities and Blue communities increases by 112%. It also explains why
the conspiracy communities sit to one side, based on the same approach of summing the relevant number of links. We note that in all cases, the number of self-links, i.e. Green community to another Green community
etc., are so large, that Green communities act as an approximately single entity with its own center of mass (like
molecules in a green ball), and the same for the Red communities separately, and for the Blue communities
separately. Specifically, the number of links Green-Green is 1693; Red-Red is 2645; Blue-Blue is 1073.
4. Betweenness Centrality: ability to act as a conduit
Here we explain the specific importance of betweenness centrality. Imagine a set of 5 nodes W, M1, M2, M3,
M4 where the undirected links are M1-W, W-M2, W-M4, M2-M3, M4-M3. This is a common network motif,
e.g. it happens to coincide with a worked example in COMS 998-006 Network Theory whose analysis we here
verify independently and similar examples in E. Estrada. The Structure of Complex Networks (Oxford

5
University Press, 2011). The following analysis shows explicitly that an individual cluster with high
betweenness participates in a disproportionally large number of pathways for communications and brokerage.
For each pair of nodes chosen from the matrix, it is easy to calculate the shortest paths. In particular, we find 20
paths out of 26 that involve W, 10 paths out of 26 that involve M1, 14 paths out of 26 that involve M2, 14 paths
out of 26 that involve M3 and 13 paths out of 26 that involve M4. As a consequence, more shortest paths are
available through W than through any other node. If all pathways are used randomly, W will be involved in the largest number making W the most ‘central’ for passing ideas, opinions, narratives and other material, and
brokerage of ideas, opinions, narratives and other material, between distant parts of the network. The same
holds for the choice of node that is key for the stability of the network. For example, the number of paths
between W and M3 is 2. If one node is removed, still another path between W and M3 exists. Even though M2
(or alternatively M4) is removed still a path would connect W and M3 through M4 (or M2), suggesting that
neither M2 nor M4 are individually that topologically important. However, M1 remains disconnected if we
remove W, making W’s central location important. Betweenness Centrality (BC) formally captures this feature
in a quantitative way. In particular, the BC of a node X measures the fraction of all shortest paths that pass
through node X, indicating that a node with high BC has a big impact on the transfer of items through the
network, under the assumption that efficient item transfer follows shortest paths. This feature is crucial for an
extreme network where items (e.g. misinformation) need to be passed quickly and efficiently since every extra
step represents extra risk and potential cost. These practical constraints imply that an optimal path is potentially
the shortest path. In short, BC(W) > BC(M1 or M2 or M3 or M4).
Figures
Figure 1
Facebook interventions (darker nodes) in the end-2020 Facebook ecosystem surrounding contentioushealth, containing >100 million users overall. Lighter nodes showed no Facebook intervention in summer2020 when conspiracy theories and misinformation were taking hold. As in the pre-Covid 2019 version,each node is a community comprising 10-1,000,000+ like-minded supporters of a particular topic. Bluecommunities (nodes) support establishment health advice, Red communities (nodes) oppose it. Greencommunities (nodes) are not focused on such topics (see Extended Data Table 1) but have becomelinked to other communities that are. The ball-and-spring layout mechanism, ForceAtlas2, means thatsets of communities (nodes) appearing closer together are more interconnected and hence likely havemore shared content and users. Extended Data Fig. 2 and the SI explain how the network shapes in Figs.1-3 can be explained quantitatively by the links that are present.

Figure 2
Parent--conspiracy-theory bonding strengthens during Covid. Dotted portion from Fig. 1 before Covid (left)and during (right) using same scale. Distance between non-Covid conspiracy theory communities (e.g.5G) and parenting communities shortens by 22% and angle reduces by 20%. But the key bondstrengthening mechanism comes from alternative health communities (see Fig. 3a).
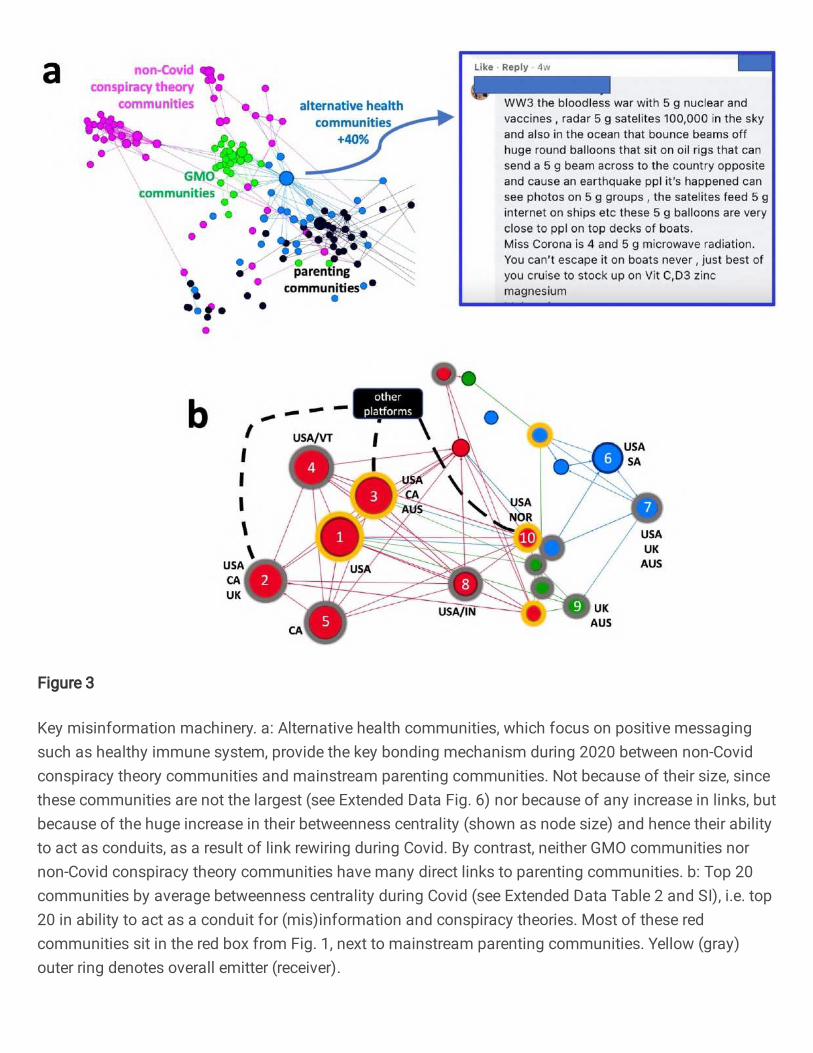
Figure 3
Key misinformation machinery. a: Alternative health communities, which focus on positive messagingsuch as healthy immune system, provide the key bonding mechanism during 2020 between non-Covidconspiracy theory communities and mainstream parenting communities. Not because of their size, sincethese communities are not the largest (see Extended Data Fig. 6) nor because of any increase in links, butbecause of the huge increase in their betweenness centrality (shown as node size) and hence their abilityto act as conduits, as a result of link rewiring during Covid. By contrast, neither GMO communities nornon-Covid conspiracy theory communities have many direct links to parenting communities. b: Top 20communities by average betweenness centrality during Covid (see Extended Data Table 2 and SI), i.e. top20 in ability to act as a conduit for (mis)information and conspiracy theories. Most of these redcommunities sit in the red box from Fig. 1, next to mainstream parenting communities. Yellow (gray)outer ring denotes overall emitter (receiver).
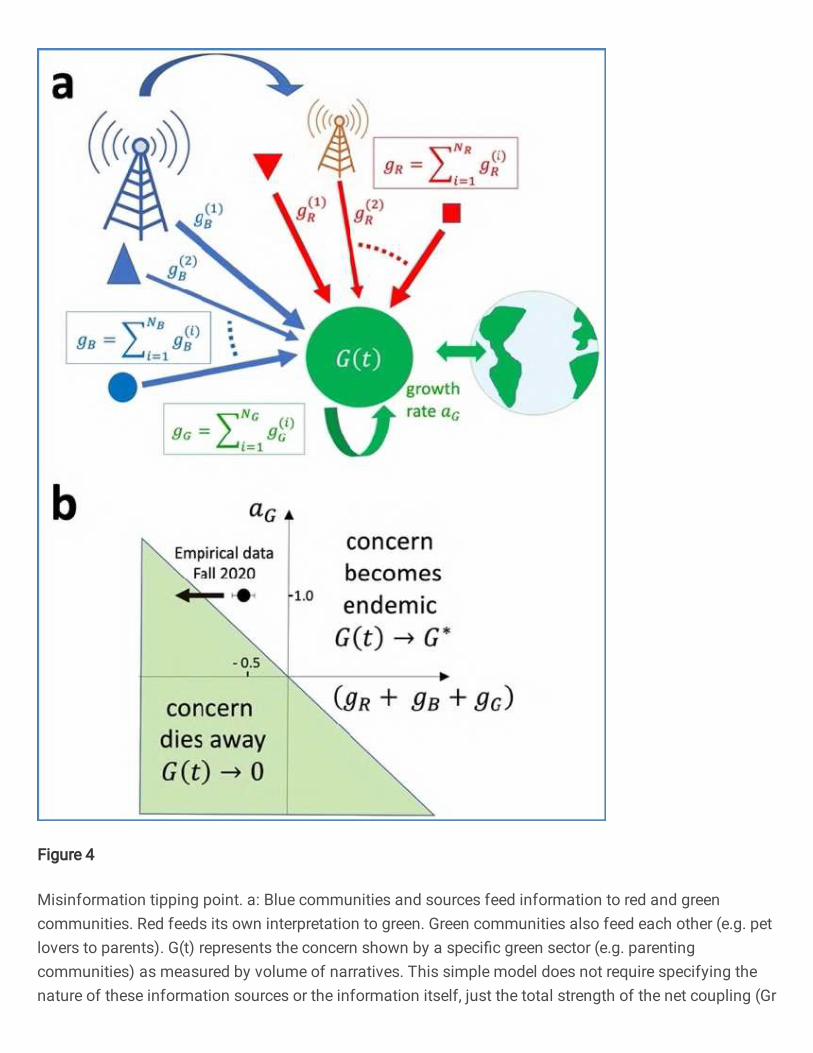
Figure 4
Misinformation tipping point. a: Blue communities and sources feed information to red and greencommunities. Red feeds its own interpretation to green. Green communities also feed each other (e.g. petlovers to parents). G(t) represents the concern shown by a speci�c green sector (e.g. parentingcommunities) as measured by volume of narratives. This simple model does not require specifying thenature of these information sources or the information itself, just the total strength of the net coupling (Gr

+ Gb + Gg). Assuming green concern goes down with more blue information and up with more red(mis)information, then Gb < 0 and Gr > 0. b: We extract the current numerical values by �tting the exactsolutions to the actual activity in blue, red and green during 2020 (Extended Data Fig. 7).