magnitude 8.3 offshore coquimbo, chile · earthquakes: japan 2011, chile 2010, and alaska 1964....
TRANSCRIPT

Magnitude 8.3 OFFSHORE COQUIMBO, CHILEWednesday, September 16, 2015 at 22:54:33 UTC
A great 8.3 magnitude earthquake struck offshore Chile late Wednesday. The
earthquake occurred 229km (142mi) north-northwest of the capital Santiago.
The earthquake shook buildings in Santiago and generated a tsunami that
caused flooding in some coastal areas. The coastal town of Coquimbo was hit
by waves of up to 4.5 meters (15 feet) high after the earthquake.
Tsunami advisories were issued for parts of South America and as far away as
Hawaii, California and French Polynesia.
Police patrol a debris strewn
street in Valparaiso, Chile, after
a tsunami, caused by an
earthquake in the area,
Wednesday, Sept. 16, 2015. A
magnitude-8.3 earthquake hit
off Chile's central coast, causing
buildings to sway in Santiago
and other cities and sending
people running into the streets.
Authorities reported one death
in a town north of the capital.
(Pablo Ovalle Isasmendi / AP)
USGS
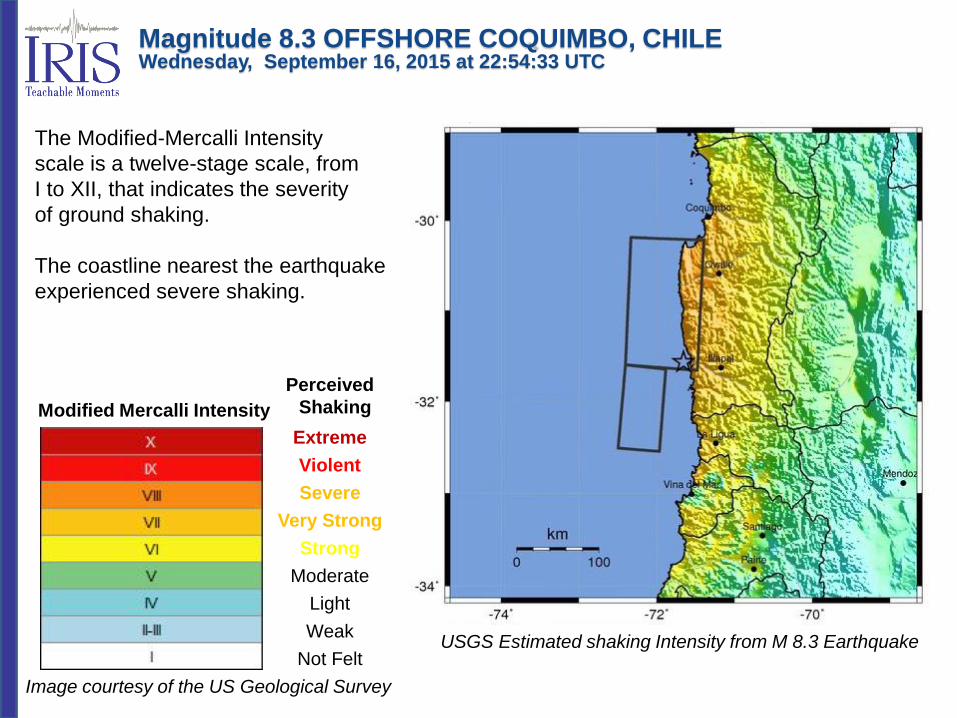
Modified Mercalli Intensity
Perceived
Shaking
Extreme
Violent
Severe
Very Strong
Strong
Moderate
Light
Weak
Not FeltUSGS Estimated shaking Intensity from M 8.3 Earthquake
The Modified-Mercalli Intensity
scale is a twelve-stage scale, from
I to XII, that indicates the severity
of ground shaking.
The coastline nearest the earthquake
experienced severe shaking.
Image courtesy of the US Geological Survey
Magnitude 8.3 OFFSHORE COQUIMBO, CHILEWednesday, September 16, 2015 at 22:54:33 UTC
USGS PAGER
Population Exposed to Earthquake Shaking
Image courtesy of the US Geological Survey
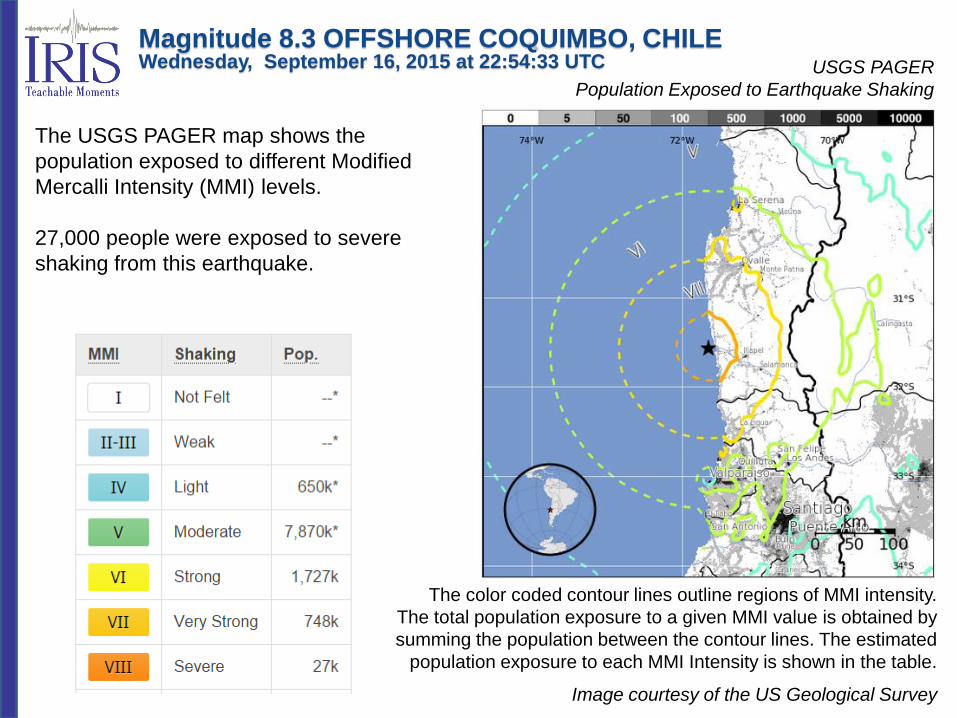
The color coded contour lines outline regions of MMI intensity.
The total population exposure to a given MMI value is obtained by
summing the population between the contour lines. The estimated
population exposure to each MMI Intensity is shown in the table.
The USGS PAGER map shows the
population exposed to different Modified
Mercalli Intensity (MMI) levels.
27,000 people were exposed to severe
shaking from this earthquake.
Magnitude 8.3 OFFSHORE COQUIMBO, CHILEWednesday, September 16, 2015 at 22:54:33 UTC
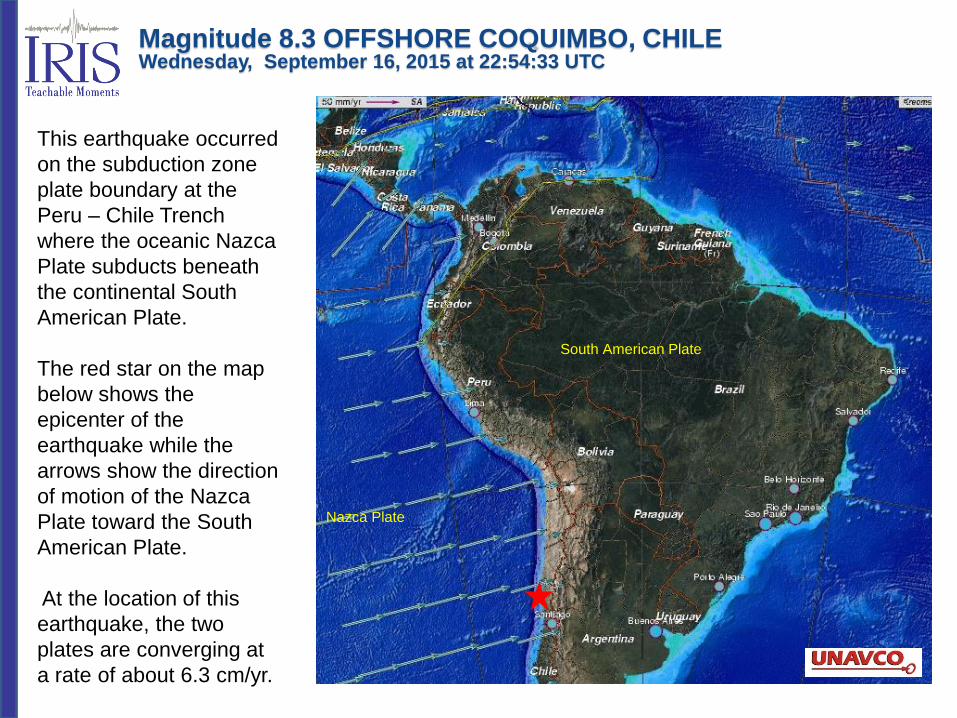
This earthquake occurred
on the subduction zone
plate boundary at the
Peru – Chile Trench
where the oceanic Nazca
Plate subducts beneath
the continental South
American Plate.
The red star on the map
below shows the
epicenter of the
earthquake while the
arrows show the direction
of motion of the Nazca
Plate toward the South
American Plate.
At the location of this
earthquake, the two
plates are converging at
a rate of about 6.3 cm/yr.
Nazca Plate
South American Plate
Magnitude 8.3 OFFSHORE COQUIMBO, CHILEWednesday, September 16, 2015 at 22:54:33 UTC
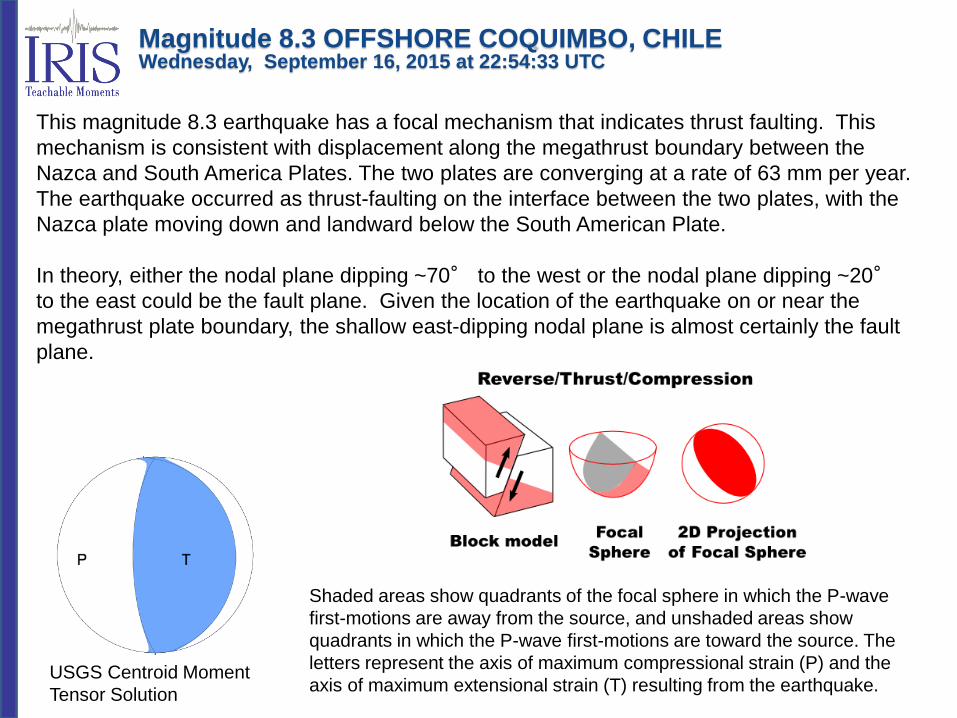
USGS Centroid Moment
Tensor Solution
Shaded areas show quadrants of the focal sphere in which the P-wave
first-motions are away from the source, and unshaded areas show
quadrants in which the P-wave first-motions are toward the source. The
letters represent the axis of maximum compressional strain (P) and the
axis of maximum extensional strain (T) resulting from the earthquake.
This magnitude 8.3 earthquake has a focal mechanism that indicates thrust faulting. This
mechanism is consistent with displacement along the megathrust boundary between the
Nazca and South America Plates. The two plates are converging at a rate of 63 mm per year.
The earthquake occurred as thrust-faulting on the interface between the two plates, with the
Nazca plate moving down and landward below the South American Plate.
In theory, either the nodal plane dipping ~70° to the west or the nodal plane dipping ~20°to the east could be the fault plane. Given the location of the earthquake on or near the
megathrust plate boundary, the shallow east-dipping nodal plane is almost certainly the fault
plane.
Magnitude 8.3 OFFSHORE COQUIMBO, CHILEWednesday, September 16, 2015 at 22:54:33 UTC
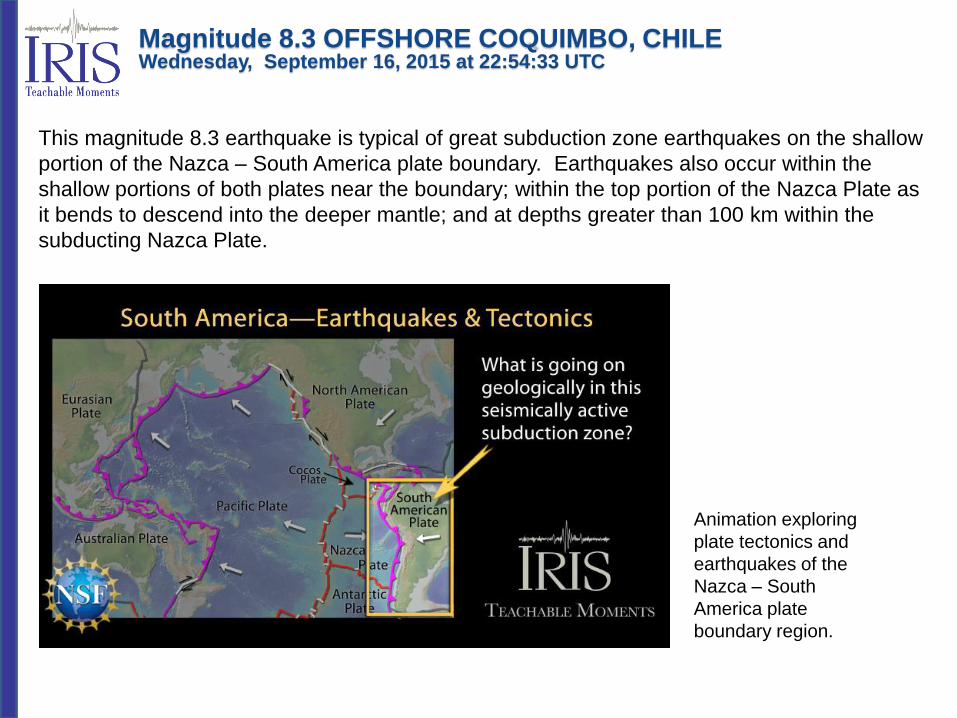
This magnitude 8.3 earthquake is typical of great subduction zone earthquakes on the shallow
portion of the Nazca – South America plate boundary. Earthquakes also occur within the
shallow portions of both plates near the boundary; within the top portion of the Nazca Plate as
it bends to descend into the deeper mantle; and at depths greater than 100 km within the
subducting Nazca Plate.
Animation exploring
plate tectonics and
earthquakes of the
Nazca – South
America plate
boundary region.
Magnitude 8.3 OFFSHORE COQUIMBO, CHILEWednesday, September 16, 2015 at 22:54:33 UTC
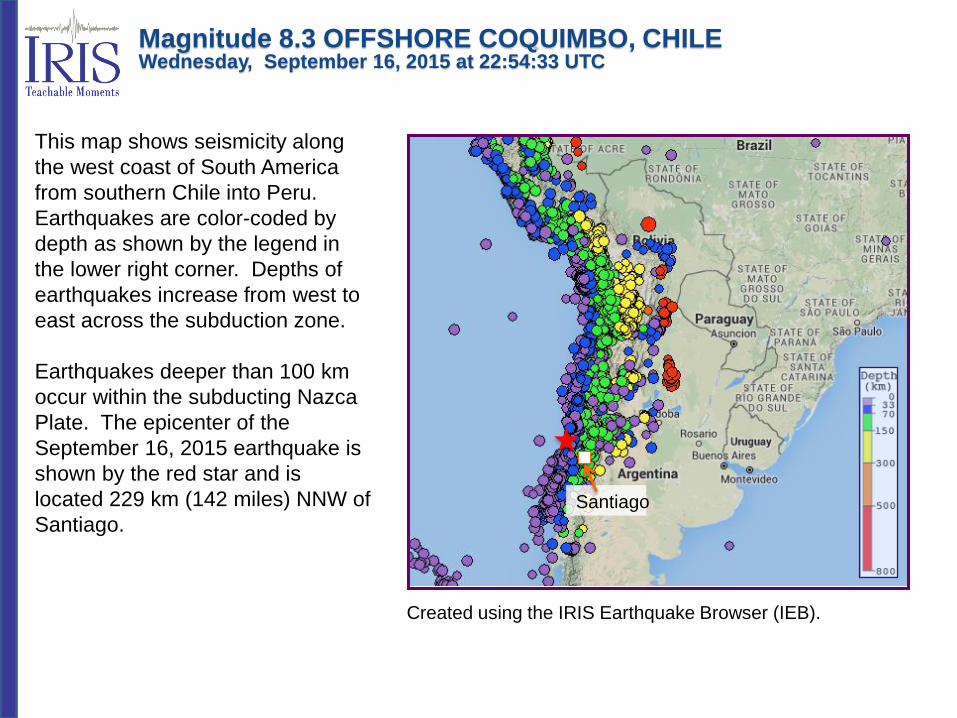
This map shows seismicity along
the west coast of South America
from southern Chile into Peru.
Earthquakes are color-coded by
depth as shown by the legend in
the lower right corner. Depths of
earthquakes increase from west to
east across the subduction zone.
Earthquakes deeper than 100 km
occur within the subducting Nazca
Plate. The epicenter of the
September 16, 2015 earthquake is
shown by the red star and is
located 229 km (142 miles) NNW of
Santiago.
Created using the IRIS Earthquake Browser (IEB).
Santiago
Magnitude 8.3 OFFSHORE COQUIMBO, CHILEWednesday, September 16, 2015 at 22:54:33 UTC
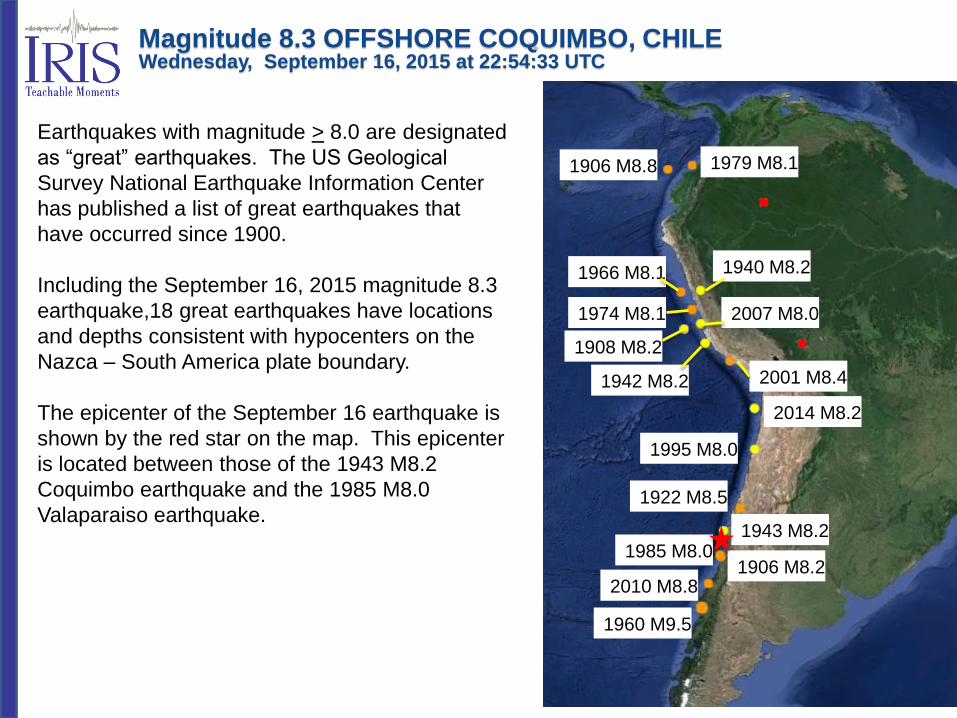
Earthquakes with magnitude > 8.0 are designated
as “great” earthquakes. The US Geological
Survey National Earthquake Information Center
has published a list of great earthquakes that
have occurred since 1900.
Including the September 16, 2015 magnitude 8.3
earthquake,18 great earthquakes have locations
and depths consistent with hypocenters on the
Nazca – South America plate boundary.
The epicenter of the September 16 earthquake is
shown by the red star on the map. This epicenter
is located between those of the 1943 M8.2
Coquimbo earthquake and the 1985 M8.0
Valaparaiso earthquake.
1979 M8.11906 M8.8
1966 M8.1 1940 M8.2
1974 M8.1 2007 M8.0
1908 M8.2
1942 M8.2 2001 M8.4
1995 M8.0
1922 M8.5
1943 M8.2
1906 M8.21985 M8.0
2010 M8.8
1960 M9.5
2014 M8.2
Magnitude 8.3 OFFSHORE COQUIMBO, CHILEWednesday, September 16, 2015 at 22:54:33 UTC
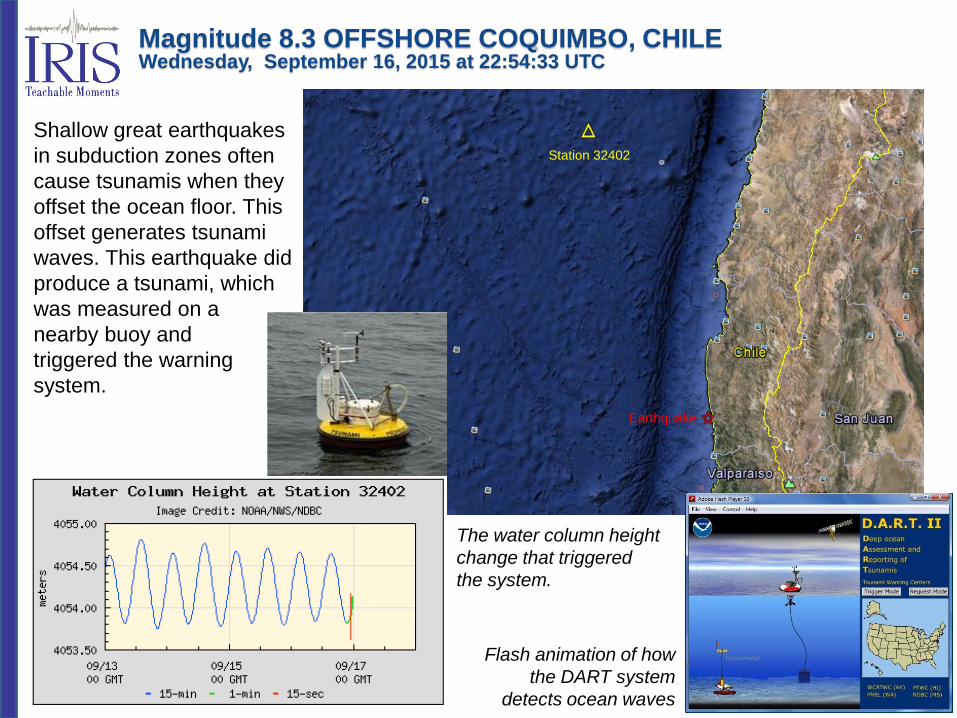
Station 32402
Earthquake
Shallow great earthquakes
in subduction zones often
cause tsunamis when they
offset the ocean floor. This
offset generates tsunami
waves. This earthquake did
produce a tsunami, which
was measured on a
nearby buoy and
triggered the warning
system.
Flash animation of how
the DART system
detects ocean waves
The water column height
change that triggered
the system.
Magnitude 8.3 OFFSHORE COQUIMBO, CHILEWednesday, September 16, 2015 at 22:54:33 UTC
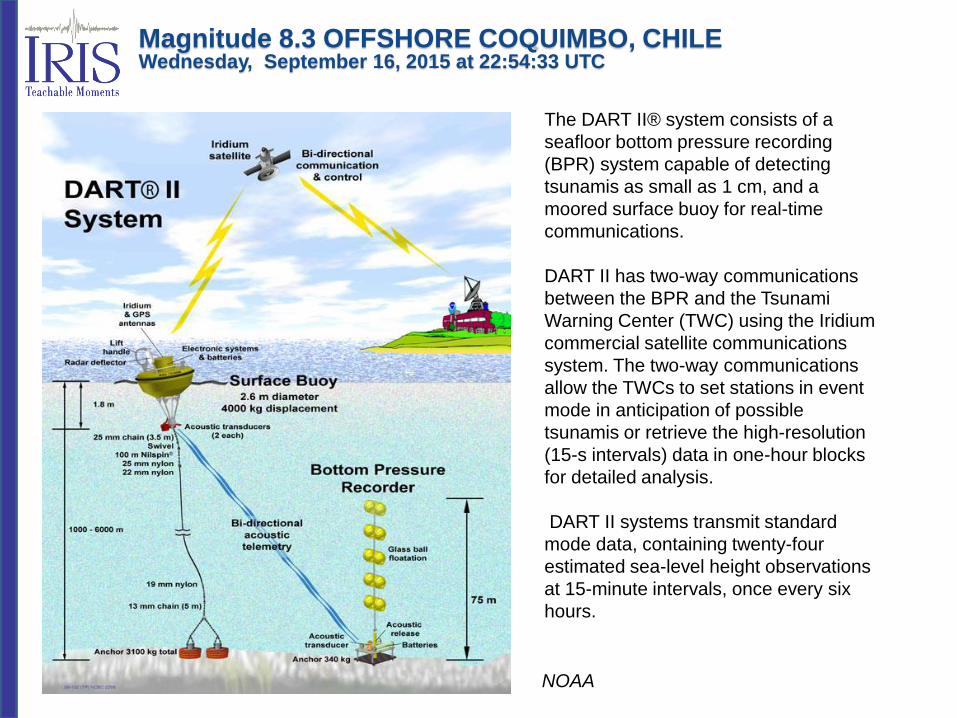
The DART II® system consists of a
seafloor bottom pressure recording
(BPR) system capable of detecting
tsunamis as small as 1 cm, and a
moored surface buoy for real-time
communications.
DART II has two-way communications
between the BPR and the Tsunami
Warning Center (TWC) using the Iridium
commercial satellite communications
system. The two-way communications
allow the TWCs to set stations in event
mode in anticipation of possible
tsunamis or retrieve the high-resolution
(15-s intervals) data in one-hour blocks
for detailed analysis.
DART II systems transmit standard
mode data, containing twenty-four
estimated sea-level height observations
at 15-minute intervals, once every six
hours.
NOAA
Magnitude 8.3 OFFSHORE COQUIMBO, CHILEWednesday, September 16, 2015 at 22:54:33 UTC

NOAA
In the open ocean, a tsunami travels at a speed of over 700 km/hr (~440 mph) and the wave
moves the ocean water all the way to the sea floor. This “shallow water” behavior means
that the velocity and projected wave heights of a tsunami can be calculated using a map of
ocean depth.
The map on the right is from
NOAA’s West Coast and
Alaskan Tsunami Warning
Center. This map shows the
predicted amplitudes of the
tsunami produced by the
M8.3 Chilean earthquake.
Since tsunamis have such
large wavelengths, they
“experience” the ocean as
shallow water. This makes
tsunamis nondispersive and
allows them to propagate
without dispersion or
significant loss of energy
across entire ocean basins.
Magnitude 8.3 OFFSHORE COQUIMBO, CHILEWednesday, September 16, 2015 at 22:54:33 UTC
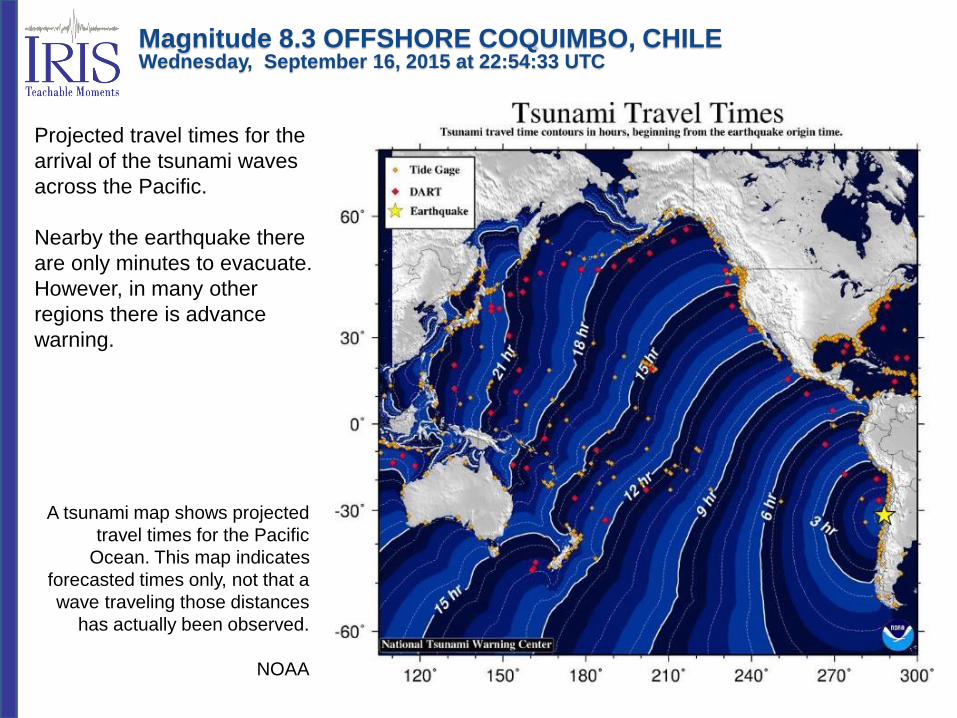
Projected travel times for the
arrival of the tsunami waves
across the Pacific.
Nearby the earthquake there
are only minutes to evacuate.
However, in many other
regions there is advance
warning.
A tsunami map shows projected
travel times for the Pacific
Ocean. This map indicates
forecasted times only, not that a
wave traveling those distances
has actually been observed.
NOAA
Magnitude 8.3 OFFSHORE COQUIMBO, CHILEWednesday, September 16, 2015 at 22:54:33 UTC
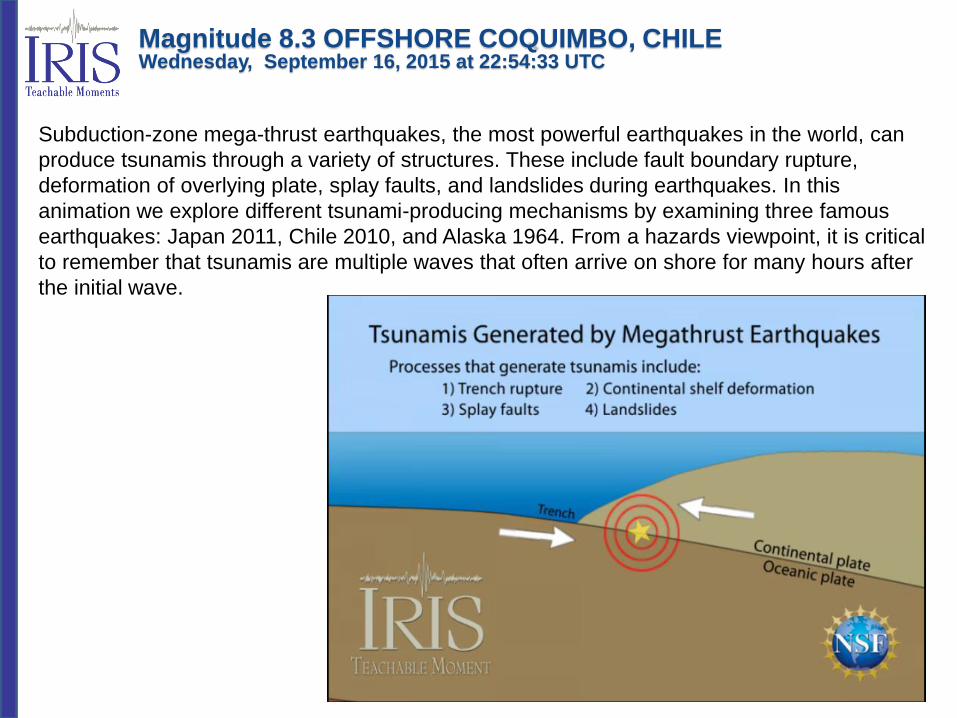
Subduction-zone mega-thrust earthquakes, the most powerful earthquakes in the world, can
produce tsunamis through a variety of structures. These include fault boundary rupture,
deformation of overlying plate, splay faults, and landslides during earthquakes. In this
animation we explore different tsunami-producing mechanisms by examining three famous
earthquakes: Japan 2011, Chile 2010, and Alaska 1964. From a hazards viewpoint, it is critical
to remember that tsunamis are multiple waves that often arrive on shore for many hours after
the initial wave.
Magnitude 8.3 OFFSHORE COQUIMBO, CHILEWednesday, September 16, 2015 at 22:54:33 UTC

In the first 5 hours after the M 8.3 earthquake
there have been 17 aftershocks including a
M 7.0. Aftershocks typically follow earthquakes,
as motion of the crust in one location puts
pressure on weak spots along earthquake fault
lines, triggering further motion. This figure was
created with the IRIS Earthquake Browser
(IEB).
An earthquake large enough to cause
damage will probably be followed by
several felt aftershocks within the first
hour. The rate of aftershocks decreases
quickly - the decrease is proportional to
the inverse of time since the main shock.
This means the second day has about
1/2 the number of aftershocks of the first
day and the tenth has about 1/10 the
number of the first day. These patterns
describe only the overall behavior of
aftershocks; the actual times, numbers
and locations of the aftershocks are
random.
Magnitude 8.3 OFFSHORE COQUIMBO, CHILEWednesday, September 16, 2015 at 22:54:33 UTC

Teachable Moments are a service of
IRIS Education & Public Outreach
and
The University of Portland
Magnitude 8.3 OFFSHORE COQUIMBO, CHILEWednesday, September 16, 2015 at 22:54:33 UTC