magnetically ordered relaxor ferroelectric lead...
TRANSCRIPT

MAGNETICALLY ORDERED RELAXOR FERROELECTRIC LEAD IRON TUNGSTATE AND
RELATED MATERIALS: SYNTHESIS, STRUCTURE & PROPERTIES
Li Feng
B. Sc., Sichuang University, 1982 M. Sc., CIAC, Chinese Academy of Sciences, 1989
M. Sc., New Orleans University, 1999
THESIS SUBMITTED IN PARTIAL FULFILLMENT OF THE REQUIREMENTS FOR THE DEGREE OF
DOCTOR OF PHILOSOPHY
In the Department of
Chemistry
O Li Feng 2007
SIMON FRASER UNIVERSITY
Spring, 2007
All rights reserved. This work may not be reproduced in whole or in part, by photocopy
or other means, without permission of the author.

APPROVAL
Name: Li Feng
Degree: Doctor of Philosophy
Title of Thesis: Magnetically Ordered Relaxor Fenoelectric Lead Iron Tungstate and Related Materials: Synthesis, Structure & Properties
Examining Committee: Dr. Vance E. Williams Chair Assistant Professor
Dr. Zuo-Guang Ye Senior Supervisor Professor, Department of Chemistry
Dr. Colin H. Jones Supervisor Professor, Department of Chemistry
Dr. Daniel B. Leznoff Supervisor Associate Professor, Department of Chemistry
Dr. Steven Holdcroft Internal Examiner Professor, Department of Chemistry
Dr. Arthur Mar External Examiner Professor, Department of Chemisty University of Alberta
Date Approved: March 20,2007
ABSTRACT
A complete ceramic solid solution between relaxor ferroelectric Pb(Fe2/3W113)03
(PFW) and normal ferroelectric PbTi03 (PT), [(I -x)PFW-xPT] has been synthesized by a
modified B-site precursor method and characterized by X-ray diffraction, differential
scanning calorin~etry, and dielectric measurements. It was found that, with the increase of
PT content, the perovskite structure gradually changes from the pseudo-cubic to a
tetragonal phase at room temperature, accompanied by the transformation from the
relaxor ferroelectric behaviour of PFW to a normal ferroelectric state in the binary
system. A phase diagram between PFW and PT has been established, which displays a
morphotropic phase boundary (MPB) within the composition interval 0.25 I x S0.35.
The electrical transport properties of the polycrystalline dielectric/ferroelectric
ceramics of (1-x)PFW-xPT have been studied with the help of complex ac impedance
spectroscopic measurements combined with electric modulus formalism analysis. In
particular, the resistivity, capacitance (or dielectric constant) and electric modulus at
different temperatures have been analysed, and the electric contributions from each
microstructural component (phase) have been assigned, which reveals that the
ferroelectric behaviour of the system is dominated by the bulk (grain) phase of the
ceramic materials.

Single crystals of the complex perovskite solid solution (1 -x)PFW-xPT have been
synthesized by the high temperature solution growth method using PbO as flux, and
characterized by X-ray diffraction, dielectric and magnetic measurements. The relaxor
ferroelectric behaviour of the crystals (x I 0.27) was fitted to the Vogel-Fulcher
relaxation model. The macroscopic polarization induced under an alternating electric
field was investigated and the influence of the PT component on the relaxor and
ferroelectric behaviour was revealed in the PFW-PT single crystals.
Two types of magnetic ordering have been observed in the temperature
dependence of magnetization in the crystals with x I 0.27. Weak low-temperature
ferromagnetism was found to be enhanced by the addition of ferroelectric PT up to x =
0.27. The intrinsic relations between the perovskite structure, composition, magnetic
ordering, and ferroelectric relaxation was discussed.
The 57~e-enriched PFW and 0.75PFW-0.25PT ceramic materials have been
further investigated by Mossbauer spectroscopy. The influences of temperature and PT
component on the spectra are discussed.

DEDICATION
To my dear parents, Xianke Feng and Zibi Zhao,
My brother, Ya Feng, and my sister, Yu Feng
And my nephews, Chi Feng, and Taiyi Xiang
To my beloved wife, Huaie Wang, and adorable daughter, Lucy (Yun) Feng
And to everyone who helped make this possible

ACKNOWLEDGEMENTS
I would like to thank my supervisor, Dr. Z.-G. Ye, for giving me the opportunity
to finish the PhD research work and thesis, and for his extremely helpful guidance and
continuous encouragement.
I would also like to thank the members of my supervisory committee, Dr. D. B.
Leznoff and Dr. C. H. Jones, for their valuable suggestions, advice, and encouragement
during my thesis work.
I would like to thank Dr. S. Holdcroft as the internal examiner of my thesis.
I would like to thank Dr. A. Mar as the external examiner of my thesis.
I would also like to thank the past and present members of our group for
providing me with help, support and friendship. Especially, I would like to thank Dr. H.
Guo and Dr. Simon Trudel for his great help and useful discussions on magnetic
measurements.
I am appreciative of the members of Department of Chemistry for their support.
Finally, I would like to thank Dr. Z.-G. Ye and Simon Fraser University for their
generous financial support.

Table of Contents
.. .............................................................................................. Approval 11 ... Abstract .............................................................................................. 111
Dedication ............................................................................................. v Acknowledgements ................................................................................. vi . . Table of Contents .................................................................................. vii List of Tables .......................................................................................... x List of Figures ..................................................................................... .xi List of Abbreviations .............................................................................. xv
Chapter 1 : 1.1 1.2 1.3 1.4
1.4.1 1.4.2
1.5
1.6 1.6.1
1.6.2 1.6.3
1.6.4 1.7 1.8
Chapter 2: 2.1 2.2
2.2.1 2.3
2.3.1 2.3.2
2.4 2.4.1
2.5
General Introduction Ferroelectrics ........................................................................ 1 Ferroelectric Perovskite Con~pounds ............................................. 3 Relaxor Ferroelectrics .............................................................. 5 Magnetic Properties ................................................................ 9
.............................................................. The Curie-Weiss Law 9 Magnetic Hysteresis Loop ...................................................... -12 Magnetically Ordered Relaxor Ferroelectric Perovskite Pb(Fe213W 1j3)O3 [PFW] and Pb(Fe21~W1/~)0~ - PbTi03 [PFW-PT] ........... 13 Previous Studies on the PFW and PFW-PT Systems ........................ 15 Synthesis and Characterization of the Pb(Fe2/3W1/3)03 [PFW] and the
........................................ Pb(FeZnW 1/3)03 - PbTi03 [PFW-PT] Ceramics 15 Relaxor Ferroelectric PFW Single Crystal .................................... 19 Magnetic Properties of Perovskite Compounds PFW and (1 -x)PFW-xPT ................................................................ 21 Magnetoelectric Effect in the Multiferroic PFW and PFW-PT System ... 23 Objectives and Plans of This Work ............................................. 25 References ......................................................................... -28
Principles and Experimental ......................................................................... Introduction 35
........... X-ray Diffraction (XRD) for Crystal Structure Characterization 35 ........................................... XRD Instruments Used in This Work 36
Dielectric Spectroscopy .......................................................... 37 ..................... Simple Principles of Dielectric Constant Measurements 37
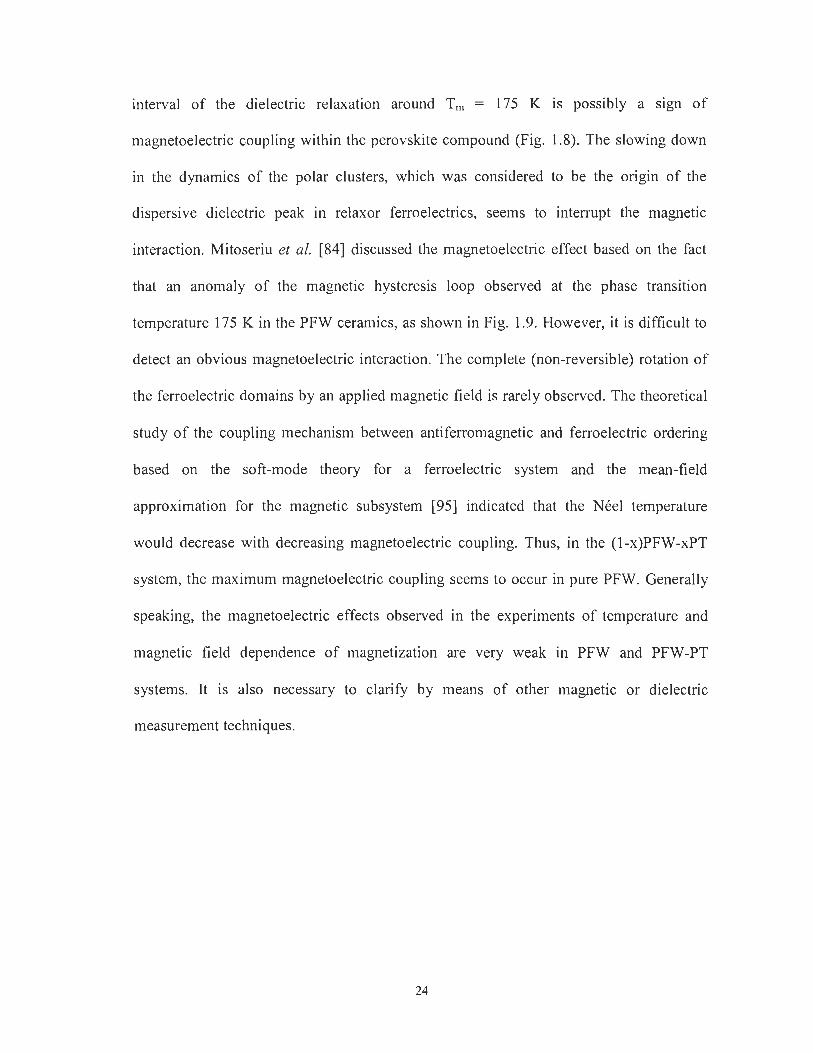
AC Impedance Analyzer and Broadband Dielectric Spectrometer ......... 38 Ferroelectric Hysteresis Loop Measurements .................................. 39 Sawyer-Tower Circuit for Ferroelectric Hysteresis Loop Measurements ...................................................................... 39 Differential Scanning Calorimetry (DSC) ..................................... 41
vii

2.6 2.6.1 2.6.2
2.7 2.7.1 2.7.2 2.7.3
2.8
Chapter 3:
Magnetic Measurements ......................................................... -43 ....................................... Basic Magnetic Measurement Principles 43
Magnetic Measurement by a Superconducting Quantum .................................................... Interference Device (SQUID) 43
......................................................... Mossbauer Spectroscopy 44 ......................... Principle of Mossbauer Spectroscopic Measurement 44
..................... Quadrupole Splitting and Magnetic Hyperfine Splitting 45 ........................................ Mossbauer Spectroscopic Experimental 47
.......................................................................... References 48
Synthesis. Structure and Properties of the ( 1 - ~ ) P b ( F e ~ ~ ~ W ~ ~ ~ ) 0 ~ - xPbTi03 [(I-x)PFW-xPT] Solid Solution Ceramics
3.1 Introduction ......................................................................... 50 3.2 Experimental ....................................................................... -52
..................................... 3.3 Phase Analysis and Structural Refinement 55 3.4 Differential Scanning Calorimetry (DSC) ...................................... 60 3.5 Dielectric Properties ............................................................... 61 3.6 Morphotropic Phase Diagram of the (1 -x)PFW-xPT Binary System ...... 64 3.7 Conclusions ....................................................................... -65 3.8 References .......................................................................... 67
Chapter 4: Electrical Microstructure and Properties of Relaxor Ferroelectric Pb(Fe2/3W113)03 . xPbTi03 Solid Solution System
4.1 Introduction ........................................................................ 69 4.2 Principles of Electric Analysis of Dielectric Ceramics ........................ 71
.................................. 4.2.1 Impedance and Electrical Modulus Principles 71 4.2.2 Microstructural Phase Model for Polycrystalline Ceramics .................. 74
4.3 Experimental ....................................................................... 76 ............................................................ 4.4 Results and Discussion 78
4.4.1 XRD Patterns ........................................................................ 78 4.4.2 Dielectric Properties ............................................................... 79 4.4.3 Impedance and Modulus Spectroscopic Analyses of the PFW-PT
Ceramics Systems ............................................................... ..80 4.5 Conclusions ....................................................................... -92 4.6 References ......................................................................... -93
Chapter 5: Growth and Electric Characterization of Relaxor Ferroelectric Pb(Fe213W113)03 . PbTi03 Single Crystals
......................................................................... 5.1 Introduction 95 5.2 Experimental ....................................................................... 96
5.2.1 Growth of the (1 -x)PFW-xPT Single Crystals ................................ 96 5.3 Results and Discussion .......................................................... 100
5.3.1 Morphology and XRD Characterization of the (1 -x)PFW-xPT Single Crystals .................................................................... 100
... Vll l

5.3.2 Dielectric Properties ............................................................. 102 5.3.3 Vogel-Fulcher relationship ..................................................... 106
.......... 5.3.4 Induced Electric Polarization and Ferroelectric Hysteresis Loop I09 5.4 Conclusions ....................................................................... 112 5.5 References ........................................................................ 113
Chapter 6: 6.1 6.2 6.3 6.4
6.4.1 6.4.2
6.5 6.6
Magnetic Properties of the (1-x)PFW-xPT Single Crystals ....................................................................... Introduction 115
Experimental ..................................................................... 117 XRD of the Single Crystrals .................................................... 119 Results and Discussion ......................................................... 120 Magnetic Properties ............................................................. 120 Magnetic Hysteresis Loops ..................................................... 129 Conclusions ....................................................................... 135 References ....................................................................... -138
Chapter 7: Mossbauer Spectroscopic Studies of the PFW and 0.75PFW-0.25PT Ceramics
7.1 Introduction ....................................................................... 140 7.2 Experimental Section ............................................................ 142
............................................................... 7.3 X-ray Diffraction 143 ......................... 7.4 Mossbauer Spectra of PFW and 0.75PFW-0.25PT 144
7.4.1 Mossbauer Spectroscopy of PFW ............................................. 144 .............................. 7.4.2 Mossbauer Spectroscopy of 0.75PFW-0.25PT 150
7.5 Conclusions ...................................................................... 153 7.6 References ....................................................................... 155
Chapter 8: General Summary 8.1 Extended Summary of the This Work ........................................ 156
8.1.1 Synthesis, Structure and Properties of the (1 - X ) P ~ ( F ~ ~ / ~ W ~ / ~ ) O ~ -xPbTiO3 [(I-x)PFW-xPT] Solid Solution Ceramics ....................... 157
8.1.2 Electric Microstructure and Properties of the (1 -x)PFW- xPT Ceramics .......................................................................... 158
8.1.3 Growth and Electric Characterization of Relaxor Ferroelectric ................................... Pb(Fe2/3 W1/3)O3 - PbTiO3 Single Crystals 160
8.1.4 Magnetic Properties of the (1-x) Pb(Fez13Wl13)03 -xPbTi03 Single Crystals ........... ... ........................................................ ,161
8.1.5 Mossbauer Spectroscopic Studies of PFW and 0.75PFW-0.25PT ........ 164

List of Tables
Table 5.1 :
Table 5.2.
Table 5.3:
Table 7.1 :
Table 7.2:
Melting points of Pb(FeznW1/3)03, PbTi03 and PbO.. ........................ .97
Dielectric dissipation factor (loss tangent) of the (1 -x)PFW-xPT
single crystals (SC) measured at 10 and 100 H z at room temperature,
compared to the ceramics.. ......................................................... 106
Vogel-Fucher law fitting parameters for the (1-x)PFW-xPT
crystals.. .............................................................................. 109
Mossbauer perameters: isomer shifts 6 (mm-') and magnetic
hyperfine fields [Hhf (kOe)] for PFW ............................................. 148
Isomer shifts 6 (mm-I), quadrupole splitting (mm-I), and magnetic
hyperfine fields [Hhf (kOe)] for 0.75PFW-0.25PT.. .......................... ,155

LIST OF FIGURES
Figure 1.1 : Figure 1.2:
Figure 1.3: Figure 1.4:
Figure 1.5:
Figure 1.6:
Figure 1.7: Figure 1.8:
Figure 1.9:
Figure 2.1 :
Figure 2.2:
Figure 2.3:
Figure 2.4: Figure 2.5: Figure 2.6:
Figure 3.1 :
Figure 3.2:
Typical electric field hysteresis loop displayed by ferroelectrics.. ......... .2 One dimensional free energy diagram, in terns of free energy (G) vs. polarization (P). A potential energy barrier (AE) has to be
................................ overcome from polarization states +P to -Pa.. .3 ...... Perovskite AB03 unit cell, illustrating 180 " polarization reversals.. .4
Typical temperature and frequency dependences of dielectric constant for the relaxor ferroelectric compound Pb(Fe213W113)03 [PFW] [37]. ....... 6 Schematic of magnetic phenomena in a one-dimensional crystal: (a) paramagnetism; (b) ferromagnetism; and ( c ) antiferromagnetism.. ...... 10 Reciprocal magnetic susceptibility vs. temperature for substances that show various magnetic features at different temperatures.. ............ 1 1 Magnetic hysteresis loop.. ...................................................... .13 Temperature dependence of the magnetic susceptibility (X) of the PFW single crystal measured by SQUID at H = 10 kOe after field cooling [14]. ................................................................ -22 The magnetic hysteresis loops of the PFW ceramics at different temperatures [84]. ............................................................... ..25 Characteristic X-ray spectrum for (a) the Cubic (prototype) and (a)Tetragonal structure. The corresponding splitting is shown as the crystal structure changes from the cubic to tetragonal phase.. ............ .36 Alpha high-resolution broadband dielectriclimpedance spectrometer (NovoControl). ................................................... .39 (a) RT66A standard ferroelectric testing system (Radiant Tech.), (b) A modified Sawyer-Tower circuit for the measurement of ferroelectric hysteresis loops [5]. ............................................... 41
DSC Measurement setup.. ...................................................... .42 MPMS XL magnetic measurement system.. ................................. .44 Energy level diagram for ' ' ~ e showing the origins of the isomer shift, quadrupole hyperfine splitting and magnetic hyperfine splitting. Each of the vertical arrows on the right side between ground and excited states represents a possible absorption line. HFS stands for hyperfine splitting.. .............................................................. .47 Schematic diagram of the set-up for the preparation of the (1 -x)PFW-xPT ceramics.. ...................................................... ..54 X-ray diffraction patterns of (a) Fe2W06 before firing; (b) FezWo6 after firing at 1000 "C for 2 h; (c) ZnTaz06 of tri-aPb02 structure; and (d) M@Jb206 of columbite structure [17].. ............................. ..55

Figure 3.3:
Figure 3.4:
Figure 3.5:
Figure 3.6:
Figure 3.7:
Figure 3.8:
Figure 3.9:
Figure 4.1 :
Figure 4.2:
Figure 4.3:
Figure 4.4:
Figure 4.5:
Figure 4.6:
Figure 4.7:
Figure 4.8:
X-ray diffraction pattems of (a) PFW powder after calcining at 800 "C and (b) PFW ceramics after sintering at 890 "C, both showing the perovskite phase.. ................................................ .56 X-ray diffractograms for various compositions of the (I-x)PFW-xPT system at room temperature, showing a tetragonal splitting
....................................................................... for x 2 0.25 ..57 Variation of the pseudocubic (a) and tetragonal (a and c) lattice parameters with x for (1 -x)PFW-xPT at room temperature. Solid lines indicate the data trend for visual reference only .............. ..58 Variation of the pseudocubic and tetragonal unit cell volume and the tetragonality c/a as a function of Ti content in (1-x)PFW-xPT. Solid lines indicate the data trend for visual reference only ............... .59 DSC scanning curves upon heating for (a) 0.75PFW-0.25PT, (b) 0.70PFW-0.30PT, and (c) 0.65PFW-0.35PT.. ............................ 60 Temperature dependences of the real part of dielectric permittivity at frequencies f = 1, 10, and 100 kHz for various compositions: (a) PFW, (b) 0.90PFW-O.1OPT; (c) 0.75PFW-0.25PT; (d) 0.70PFW-0.30PT; (e) 0.65PFW-0.35PT; and (f) 0.40PFW-0.60PT.. .62 Phase diagram of the (I-x)PFW-xPT system delimiting the high- temperature cubic phase and the low-temperature ferroelectric rhombohedra1 (pseudocubic) and tetragonal phases. A morphotropic phase boundary (MPB) is located at 0.25 I x 10.35. Up and down triangles represent the transition temperatures measured by DSC analysis; filled and open circles correspond to the phase transition temperatures detected by dielectric measurements.. ........................ .65 (a) Parallel RC circuit and (b) the corresponding ac impedance spectrum. Arrow indicates the direction of increasing frequency.. ...... ..72 Various models for the ceramics with two-phase components. (a) Series model and the corresponding equivalent electrical circuit; (b) Parallel layer model and the associated equivalent circuit; and (c) Brick layer model.. ............................................................................. .76 X-ray diffraction pattems for various compositions of the (1 -x)PFW-xPT system at room temperature.. ................................ .78 Dielectric constant vs. temperature at various frequencies for the 0.90PFW-0.1 OPT ceramics. ............................................. .79 Complex impedance spectrum of the 0.90PFW-0. IOPT ceramics at 293 K. Arrow indicates the direction of increasing frequency.. ....... ..80 Electric modulus spectrum of the 0.90PFW-0.1 OPT ceramics at 293 K.. ......................................................................... ,.82 Imaginary modulus, M", plotted against frequency for the 0.90PFW-O.1OPT ceramics at 293 K.. ................................ .82 An equivalent circuit that describes the electrical response of the 0.90PFW-0.1 OPT ceramics. R, and C, stand for resistance and capacitance of the minor phase, respectively; Rg and C, for those of the bulk (grain) phase, Rgb and Cgb for those of the grain boundary phase, &, and Cdl for those of charge transfer, and
xii
Figure 4.9:
Figure 4.10:
Figure 4.1 1 :
Figure 4.12:
Figure 4.13:
Figure 5.1 :
Figure 5.2:
Figure 5.3:
Figure 5.4:
Figure 5.5:
Figure 5.6:
Figure 5.7:
Figure 5.8:
Figure 5.9:
Figure 5.10:
Figure 5.1 1 :
Figure 6.1 :
............................... Z , is for the Warburg diffusion impedance.. ..85 Frequency dependence of the real part of resistivity for
................................... the 0.90PFW-0.1 OPT ceramics at 293 K.. ..86 Frequency dependence of the imaginary part of electric modulus for (a) 0.90PFW-O.1OPT at 293 K (Tc = 226 K), (b) 0.80PFW-0.20PT
at 296 K (Tc = 275 K), (c) 0.75PFW-0.25PT at 363 K (Tc = 288 K), and (d) 0.675PFW-0.325PT at 363 K (Tc=350 K) ............................ 87 Frequency dependence of the modulus M" for the 0.75PFW- 0.25PT ceramics at (a) 258 K, (b) 303 K, and (c)
............................................................. 363 K, respectively.. .88 Frequency dependence of the modulus for the 0.675PFW-0.325PT
............................. ceramics at (a) 298 K, (b) 323 K, and (c) 373 K .89 Frequency dependence of the dielectric permittivity and loss factor of the 0.90PFW-0.1 OPT ceramics at (a) 293 K and (b)
............................................................... 128 K, respectively.. 9 1 (a) Schematic of an alumina sagger for the PFW-PT crystal growth from high temperature solution and (b) The temperature profile for the crystal growth.. ............................................................... 98 Photograph of a PFW-PT crystal with the electrode, showing the silver paste and Au wires on the surface of the crystal.. ............................ 99 Photographs of the single crystals of (a) PFW, (b) & ( c ) 0.73PFW-0.27PT, and (d) & (e) 0.25PFW-0.75PT.. ........................ 100 (a) X-ray diffraction of the (1-x)PFW-xPT, x = 0,O. 13,0.27, and 0.75, single crystals at room temperature, (b) a part of XRD pattern of 0.73PFW-0.27PT in (a). ............................................ ,102 Temperature dependence of the real part of the dielectric permittivity (E',) at different frequencies for the PFW-PT crystals with various compositions (a) PFW; (b) 0.87PFW-0.13PT; ( c ) 0.83PFW-0.17PT; (a) 0.73PFW- 0.27PT; and (e) 0.25PFW-0.75PT.. ...... .... ............ 104 Variation of the frequency dispersion of T, described in terms of the temperature difference AT =Tm(loo kHz) - Tm ( I k ~ ~ ) of the crystal (1-x)PFW-xPT as a function of PT content x.. .............................. 105 Reciprocal of dielectric constant as a function of temperature for the PFW single crystal at various frequencies.. ................................. 107 l/(Tm(loo kHz) -TJ) VS. Ln(n for the (1-x)PFW-xPT crystals, x = 0,0.07, 0.13, 0.17, and 0.27, crystals. Solid lines show a linear fitting to the Vogel-Fucher relationship (5.4). ........................................ .I08
Dielectric hysteresis loops of the PFW crystal at 223 K and 298 K, respectively, and (a) is the enlarged curve at 298 K.. ..................... -11 1 Dielectric hysteresis loops of the 0.87PFW-0.13PT crystal displayed at 253 K and 27 1 K, respectively.. .............................. .I11 Induced dielectric polarization of the (1 -x)PFW-xPT crystals, with x = 0, 0.13, and 0.27, at room temperature.. .......................... 112 X-ray powder diffraction patterns of the (I-x)PFW-xPT single crystals. indicating a rhombohedra1 (pseudocubic) phase for low PT contents, and a tetragonal splitting for x > 0.27.. ..................................... .,I20
... X l l l

Figure 6.2:
Figure 6.3:
Figure 6.4:
Figure 6.5:
Figure 6.6:
Figure 6.7:
Figure 6.8:
Figure 6.9:
Figure 6.10:
Figure 6.11 :
Figure 7.1 :
Figure 7.2: Figure 7.3:
Figure 7.4:
Figure 7.5:
Figure 7.6:
Figure 7.7:
Temperature dependence of (a) the magnetization and (b, c) reciprocal susceptibility (11~) of the (I -x)PFW-xPT crystal, with x = 0, 0.07, 0.27,
......................... and 0.75, upon FH (50 Oe ( 1 4 OO>c,b)) after ZFC 122 Temperature dependence of (a) the magnetization and (b) reciprocal susceptibility (11~) of the (1-x)PFW-xPT crystal, with x = 0, 0.07, 0.27,
....................... and 0.75, upon FH (1000 Oe (//<lOO>c,,~)) after ZFC 125 Partial magnetic phase diagram of the (1 -x)PFW-xPT system, which delimits the paramagnetic, antiferromagnetic and weak ferromagnetic phases.. ............................................................................ 125 AC magnetization of (a) PFW and (b) 0.93PFW-0.07PT crystals as a function of temperature at field of 5 Oe with the frequencies of 10 Hz and 1 kHz, respectively.. ........................................... ,129 Field dependence of the magnetization for the PFW crystal at (a) 1.9 K, (b) 150 K, (c) 185 K, (d) 300 K, and (e) 390 K, respectively ...... 130 Field dependence of the magnetization for the 0.93PFW-0.07PT crystal at (a) 1.9 K, (b) 150 K, (c) 185 K, (d) 300 K, and (e) 390 K, respectively ................................................... .13 1 Field dependence of the magnetization for the 0.73PFW-0.27PT crystal at (a) 1.9 K, (b) 150 K, (c) 1 85 K, (d) 300 K, and (e) 390 K, respectively ................................................... .I32 Field dependence of the magnetization of the 0.25PFW-0.75PT crystal at (a) 2 K, (b) 10 K, (c) 200 K, and (d) 300 K, respectively.. ..... 133 Magnetic hysteresis loops for the crystals (1 -x)PFW-xPT with various PT contents at 1.9 K.. ........................................... ,134 Variation of the remnant magnetization at 1.9 K as a function of ferroelectric PT-content for the (1 -x)PFW-xPT crystals.. ................ .I35 X-ray diffraction patterns of the 57~e-containing PFW and 0.75PFW- 0.25PT ceramics at room temperature.. ..................................... .I44 Mossbauer spectra of PFW at (a) 373 K and (b) 353 K.. ................... 145 PFW perovskite structure showing the octahedral B-site positions occupied by ~ e ~ ' and W('+ ions at random, which forms two different
3+ sublattices of Fe ion.. ........................................................... 146 Mdssbauer spectra of the PFW sample at 295 K, 77 K and 4.4 K, respectively. The solid lines represent the fit results.. .................... ..I47 Hyperfine field distribution of PFW at (a) 295 K, (b) 77 K and (c) 4.4 K, respectively. The site 1 and 2 correspond to the fitted results.. .... 149 Mossbauer spectra of the 0.75PFW-0.25PT sample at 295 K. 77 K and 4.4 K, respectively. Solid line represents the fitting results.. ................................................................ 150 Hyperfine field distribution of 0.75PFW-0.25PT at 4.4 K ........................................................................... .I53
xiv
List of Abbreviations
BT
DSC
Ea
Ec.
EDX
Hh f
J
LFD
LRO
ME
MPB
MPMS
M*
PBN
PFW
PFT
PIN
PLZT
PMN
PSN
PST
PT
PZN
RC
SQUID
SRO
T c
Td
TEM
BaTi03
differential scanning calorimetry
activation energy
coercive field
energy-dispersive x-ray spectroscopy
magnetic hyperfine field
imaginary number [(-
low-frequency dispersion
long range order
magnetoelectric
morphotropic phase boundary
Magnetic Properties Measurement System
complex electric modulus
(Pb l-xBax)Nb206
Pb(Fe213W113)03
Pb(Fe112Ta112)03
Pb(In112Nb,n)O3
(Pb1-3~12La,)(Zr,Ti1-,)03
Pb(Mg113Nbzn)O3
Pb(Sc112Nb113)03
Pb(Sc 11zTaliz)O3
PbTi03
Pb(Zn113Nb213)03
time constant (products of resistance and capacitance)
Superconducting Quantum Interference Device
short range order
Curie temperature
dipole temperature
transmission electron microscopy

TMPU
TN
V-F
XRD
the temperature of dynamic freezing of the polar clusters
the temperature of the maximum dielectric constant
the temperature corresponding the MPB phase transition
NCel temperature
Vogel-Fulcher
X-ray diffraction
complex impedance
the permittivity of free space
real permittivity
imaginary permittivity
quadrupole splitting
conductivity
resistivity
isomer shift
wavelength
gamma ray
magnetic susceptibility
xvi

Chapter 1: General Introduction
1.1 Ferroelectrics
A ferroelectric crystal is defined as a crystal that belongs to the pyroelectric
family and exhibits a spontaneous polarization that can be switched by an electric field
from one ground orientation state to the other [ I ] . Ferroelectric materials are a special
type of dielectric having extremely large pernlittivity and the possibility of retaining
some residual electrical polarization after an applied field is switched off.
Ferroelectrics can be characterized by the ferroelectric hysteresis loop, as shown
in Fig. 1.1. When an electric field applied across a ferroelectric substance is increased,
the induced polarization increases nonlinearly up to the saturation value Ps (if the electric
field is high enough) because all of the ferroelectric domains align in the direction of the
field. The Ps represents the spontaneous polarization [2]. As the electric field is reversed
and removed completely, the polarization at zero field is called the remnant polarization,
P,.. In this case, some of the domains remain aligned. With the applied field increasing to
some extent in the opposite direction, the remnant polarization decreases to zero. The
reverse electric field required to reduce the polarization to zero is called the coercive
field, Ec. A saturation polarization in the reverse direction can be obtained if the opposite
field applied is large enough. Consequently, the hysteresis loop of a ferroelectric can be
established after the electric field cycle is applied on the ferroelectric sample.

Figure 1.1: Typical electric field hysteresis loop displayed by ferroelectrics.
The spontaneous polarization usually decreases with increasing temperature and
becomes zero at temperature Tc. This phase transition temperature, Tc, is called the Curie
point. Ferroelectric phases can exist only below this temperature. Above Tc, a
paraelectric phase appears, and the dielectric constant (E) as a function of temperature, T,
is given by the Curie-Weiss law:
E = [C/(T-O)] + E~ , (1.1)
where C is the Curie-Weiss constant, 0 is the Curie-Weiss temperature and Em is the part
of the dielectric constant independent of temperature. E, can be neglected at temperatures
near Tc. [I].
Spontaneous polarization is always accompanied by crystal lattice deformation. A
structural requirement for a crystal to have spontaneous polarization and to be
ferroelectric is that its space group must be non-centrosyrnmetric. In order to change the
polarization direction by reversing an applied field, an energy barrier between the two

polarization states ( fP) has to be overcome. A one-dimensional free energy (G) plot
against polarization (P) is presented in Fig 1.2 [3]. The potential energy barrier AE is
temperature dependent [3]. As the temperature increases to Tc, the AE decreases to zero
and spontaneous polarization disappears.
Figure 1.2: One dimensional free energy diagram, in terms of free energy (G) vs. polarization (P). A potential energy barrier (AE) has to be overcome from polarization states +P to -P.
1.2 Ferroelectric Perovskite Compounds
Many Pb-based perovskite compounds (general formula ABO,) display
ferroelectric behaviour because of their specific structure, as shown in Fig. 1.3. It has a
primitive cubic structure, with A atoms at the cube comers, B atom at the body centre,
and the oxygen atoms at the face centres. The perovskite structure can also be composed
of a set of B o o octahedra arranged in a simple cubic pattern and linked together by shared
oxygen

Pcktrization Up Po!arrzstion Down
Figure 1.3: Perovskite A B 0 3 unit cell, illustrating 180 " polarization reversals.
atoms, with the A atoms occupying the spaces between them. Cations A (pb2', ~ a " ,
ca2+, etc.) with lower charge and larger size occupy twelve coordinate cavities within this
framework. Cation B ( ~ i " , sc3+, z$+, sn4+, etc.) in octahedral site usually has smaller
size with higher charge. There are minimum-energy positions off-center from the original
octahedron that can be occupied by the B atom. Therefore, it is possible for the structure
to be distorted and to demonstrate non-centric and polar symmetry, which results in the
formation of dipoles even without an electric field being applied (Fig. 1.3b). The first
ferroelectric perovskite compound discovered was BaTi03 [4, 5, 61. It behaves as a

normal dielectric above Tc = 120 OC. However, below that temperature, Ti is displaced
from its central position towards one of the apical oxygen atoms, which gives rise to a
spontaneous polarization, as shown in Fig. 1.3b. It has been confirmed by X-ray
diffraction that Ti is displaced by - 0.1 from the center of its octahedron in the
direction of one of the oxygen atoms. Another example is complex perovskite PbTi03
[PT], which undergoes a first-order transition at Tc = 490 OC from cubic perovskite to a
tetragonal ferroelectric one upon cooling and exhibits a significant displacement of small
cation ~ i " in octahedral B-site below the Curie temperature Tc [7, 81. It is a typical
ferroelectric with a sharp maximum of dielectric constant at the Curie temperature.
1.3 Relaxor Ferroelectrics
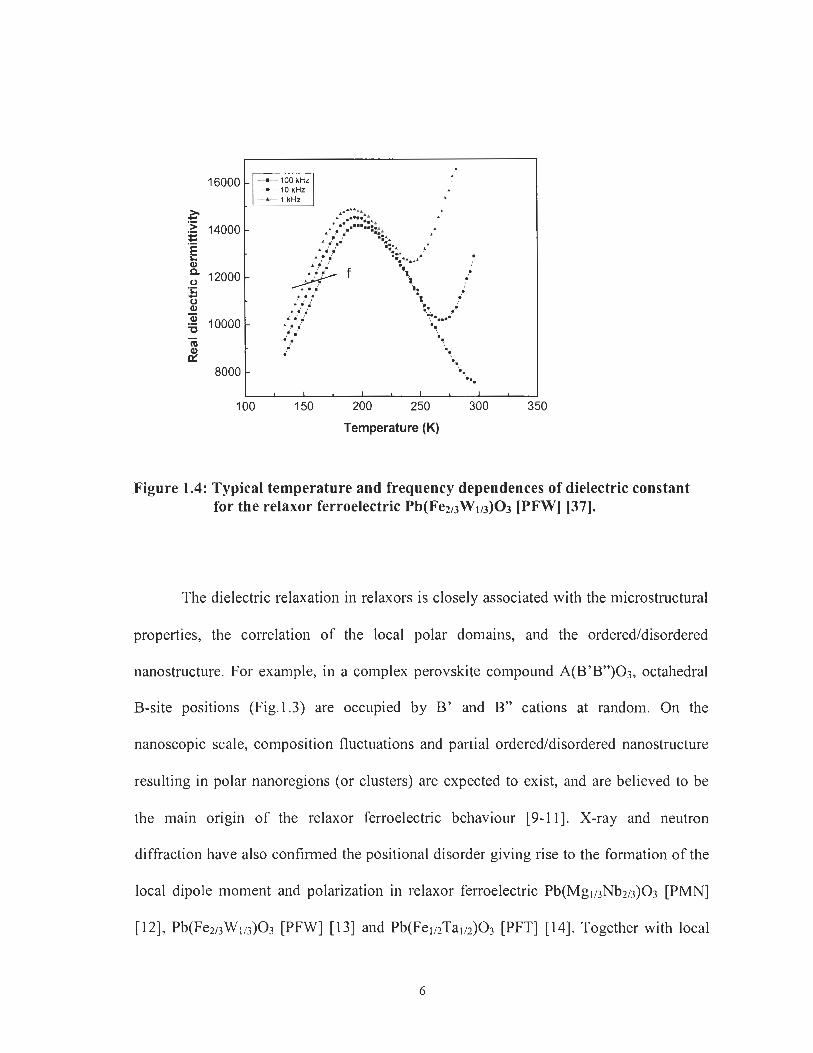
Differing from normal ferroelectrics, relaxor ferroelectrics exhibit a broad and
diffuse maximum of dielectric permittivity around the temperature T, with strong
frequency dispersion [9], as shown in Fig. 1.4. The magnitude of the maximal dielectric
constant decreases with the increasing frequency, while the corresponding T, shifts
toward higher temperature. There is no macroscopic phase transition into a ferroelectric
state around T,, not even a "diffuse" one. Neither birefringence nor macropolarization
can develop without the application of an external electric field, the materials remaining
isotropic to long coherent probing radiation, like polarized light, X-ray and neutron
beams [lo]. In addition, the local polarization and polar nano domains occur below a
dipole temperature Td far above the temperature of the maximal dielectric permittivity
T,,, while the (induced) macro polarization vanishes at a temperature well below T,.
100 1 50 200 250 300 350
Temperature (K)
Figure 1.4: Typical temperature and frequency dependences of dielectric constant for the relaxor ferroelectric Pb(FeznWlI3)O3 [PFW] [37].
The dielectric relaxation in relaxors is closely associated with the microstructural
properties, the correlation of the local polar domains, and the orderedldisordered
nanostructure. For example, in a complex perovskite compound A(B'BW)O3, octahedral
B-site positions (Fig.l.3) are occupied by B' and B" cations at random. On the
nanoscopic scale, composition fluctuations and partial orderedldisordered nanostructure
resulting in polar nanoregions (or clusters) are expected to exist, and are believed to be
the main origin of the relaxor ferroelectric behaviour [9-111. X-ray and neutron
diffraction have also confirmed the positional disorder giving rise to the formation of the
local dipole moment and polarization in relaxor ferroelectric Pb(MglnNbzn)03 [PMN]
[12], Pb(Fe213W113)03 [PFW] [13] and Pb(Fel,2Tallz)O3 [PFT] [14]. Together with local
polar structure, the positional disorder and the related lattice distortion exhibit some
structural factors essential to the relaxor behaviour.
The local distortions due to ionic displacements are in fact not totally random, but
correlated. The correlation increases upon cooling, which is also the origin of the relaxor
behaviour. The degree of order I disorder in the perovskite structure and the coherent
length of the ordered nanodomains have a great influence on the relaxor ferroelectric
properties [15, 161. With increasing degree of order, the coherence length increases,
causing the relaxor ferroelectric phase transition into a normal ferroelectric phase.
In order to explain the possible mechanism of the dispersive dielectric relaxation
and the polarization behaviour, various models have been proposed. Among them, the
diffuse phase transition model [17, 181, the superparaelectric model [19], the dipolar
glassy-like model [20], and the random field-stabilized domain model [21, 221 have
received the most attention.
The diffuse phase transition and polar regions were proposed by Smolenskii et al.
[17, 181 for the explanation of the broadened dielectric peak at T,. It was believed that
the compositional fluctuations on the B-sites with disordered B' and B" occupation in
A(B'BW)O3 cause the chemical inhomogeneity, which gives rise to various polar
microregions with a distribution of the local Curie temperatures. The temperature T,
represents the mean Curie temperature. Therefore, a broadened phase transition occurs at
Cross [ l 11 proposed the superparaelectric model for the relaxor ferroelectrics by
analogy with the superparamagnetic state. It describes the nature of the micropolarization
at high temperatures, in the region above T,, where the micro polar regions are

considered to be dynamically disordered by thermal motion. Such a disordered state is
not totally random, but shows some preferential orientation along one of the possible
polar directions for a cluster of dipoles, leading to a net polarization in a micro domain.
In the lower temperature region, the slowing down of the dynamics of polar clusters and
their correlation obviously affect or attenuate the dielectric response and the polarization
behaviour, giving rise to characteristic relaxor ferroelectric behaviour.
In the dipole glassy-like model, it is pointed out that the size of the polar regions
and the potential barrier increase upon cooling. The dynamics of the polar regions will
slow down, leading to a freezing of the dipoles, as in the case of the spin glasses in the
dipole glass system [lo]. The temperature dependence of the dielectric constant shows a
broad maximum near the paraelectric to dipole glass transition due to a dynamic freezing.
The dielectric relaxation can be described by the Vogel-Fulcher (V-F) equation, in terms
of the AC frequency o and the temperature T,, of the maximal dielectric constant:
o = oo'exp[-E, / k(T,-TI)], (1.2)
where ooY is a fitting constant, E, is the activation energy and Tf is the temperature of
dynamic freezing of the polar clusters due to interactions. Satisfying the V-F equation is
considered as a sign of freezing of the dipole system at Tf [20].
In the random field-stabilized domain model, proposed by Westphal and
Kleemann [21, 221, it is stressed that the relaxor ferroelectricity in PMN can be attributed
to the strong contribution of a quenched random electric field, arising from the charged
nanodomains and the compositional fluctuations and chemical textures [23]. The random-
fields are believed to be at the origin of the critical slowing-down, and freezing into

nanometric ferroelectric domains and the slow relaxation of the polarization below the
Curie temperature.
Recently, Bokov and Ye [24, 25, 261 have discovered the "universal" relaxor
dispersion in the perovskite PMN and related materials in the dielectric spectroscopic
studies. The universal relaxor polarization can be described by a microscopic model of
'soft' polar nanoregions with unit cells that can freely choose several different directions,
while the direction of the total moment of the nanoregion remains the same [26]. Hence,
it is possible to apply a standard spherical model to relaxor ferroelectrics, which predicts
the experimentally observed quadratic divergence of the universal part of the
susceptibility above the critical temperature. The model is complementary to the so-
called spherical random bond-random field model proposed by Blinc et d. [27].
1.4 Magnetic Properties
1.4.1 The Curie-Weiss Law
Because there are strong analogies between magnetic properties and the
corresponding electrical properties, e.g. ferromagnetism vs. ferroelectricity, it is
necessary to review some magnetic concepts here.
Generally speaking, any inorganic solid compound that has magnetic effects
(interactions) must have unpaired d or f electrons on metal cations [28, 291. The magnetic
moments of unpaired electrons arise from electron spin and electron orbital motion
around the nucleus. How the unpaired electrons are oriented depends on the magnitude of
magnetic interaction energy between adjacent unpaired electrons or adjacent spins, which
bring about different magnetic interaction behavior. If the atomic moment is oriented at
random, the whole material is paramagnetic, as shown in Fig. 1.5a. When the interaction
energy is strong enough, the atomic moments are aligned parallel. The system is then said
to be ferromagnetic (Fig. 1.5b). In some cases, the atomic moments form two sublattices.
The magnetic moment on one sublattice is equal in magnitude, but aligned antiparallel to
the other (Fig. 1 .5~) . The net magnetic moment is zero at very low temperature (0 K in
theory). The system is said to be antiferromagnetic [28].
Figure 1.5: Schematic of magnetic phenomena in a one-dimensional crystal: (a) paramagnetism; (b) ferromagnetism; and ( c ) antiferromagnetism.
When a substance is placed in a magnetic field, all atomic moments will interact
with the applied field and be reoriented, resulting in the magnetization of the substance.
The ratio of the magnetization of the substance to the field is defined as the magnetic
susceptibility X,
x = M I H , (1.3)
where M is the specific magnetic moment (emulg) and H is the magnetic field (Oe). The
magnetization curve of M vs. H can often indicate different magnetic interaction

behaviour. The magnetic susceptibility is inversely proportional to temperature for a
paramagnetic material. Within a paramagnetic substance, some spontaneous interactions
between adjacent spins take place, which may develop into ferro- or anti-ferromagnetism
at low temperatures. The high temperature magnetic behaviour of paramagnetic region is
often described by the Curie-Weiss law 1291:
x = C l (T-8), (1.4)
where C is the Curie constant and 8 is the Weiss constant. The different sign of 8
indicates the different magnetic interaction in the range of temperature, as shown in Fig.
1.6.
Curie-Weiss law (Antiferrornagnetism)
Curie law
Curie-Weiss law (Ferrornagnetisrn)
/ /
/ F 8 0 8 T (K)
Figure 1.6: Reciprocal magnetic susceptibility vs. temperature for substances that show various magnetic features at different temperatures.
(a) For paramagnetic substances that show no tendency to magnetic order, the Weiss
constant is zero.

(b) In the paramagnetic substances that show a tendency to ferromagnetic order, there
is already some local alignment of spins. Hence, the Weiss constant has a positive value.
The temperature that equals to the absolute value of 0 is called the ferromagnetic Curie
temperature Tc, below which the substance is ferromagnetic and does not obey the Curie-
Weiss relationship.
( c ) For the paramagnetic substances that show a tendency to antiferromagnetic order,
the Weiss constant has a negative value. The temperature that equals the absolute value
of 0 is called the Nee1 temperature, TN, below which the sample is antiferromagnetic.
When the temperature is below TN, the tendency toward antiparallelism becomes
stronger. The antiparallel alignment will be perfect at 0 K. Thus, antiferromagnetic
substances have a small positive susceptibility at all temperatures.
1.4.2 Magnetic Hysteresis Loop
Similar to the ferroelectric materials, ferromagnetic materials also have a domain
structure. Within each domain, the spins align parallel. Different domains have different
spin orientations and can be aligned parallel to an applied magnetic field on them. A
magnetic hysteresis loop occurs in the plot of magnetization M against magnetic field H,
as shown in Fig. 1.7. Similar to the definition in a dielectric hysteresis loop, at large
enough magnetic field (H), a saturated magnetization (Ms) can be obtained. M, is the
remnant magnetization as H decreases to zero, and Hc is the coercive force for removing
all induced magnetization from the magnetic substance. The area in the hysteresis loop is
expressed as hysteresis loss or loss energy when a cyclic magnetic field is applied to a
ferromagnetic substance [28].

Figure 1.7: Magnetic hysteresis loop.
1.5 Magnetically Ordered Relaxor Ferroelectric Perovskite Pb(Fe213W113)03
[PFW] and Pb(Fe213Wl13)03 -PbTi03 [PFW-PT] Systems
Over the past 20 years, lead-based perovskite Pb(B'B7')03 relaxor has gained
considerable interest and found many applications, such as high-capacitance multilayered
capacitors, electrostrictive devices, etc, [30]. This is mainly due to the low sintering
temperature, high diffuse dielectric permittivity peak and the possibility to modify these
physical and chemical properties [30,3 11.
As mentioned previously, the perovskites with relaxor ferroelectric behaviour, like
the family of con~plex composition A(B'BW)O3, where cations B' and B" on the B-site
have different valence but a fixed ratio, are characterized by chemical order-disorder on
the B-site, giving rise to polar nanostructures. The following are some typical Pb-based
relaxor ferroelectric complex perovskite compounds: Pb(Mg113Nb213)03 [PMN],

Among them above, PFW is of particular interest, because it exhibits not only
relaxor ferroelectric but also magnetic ordering. In PFW perovskite structure with P ~ % Z
symmetry, the A-sites are occupied by pbZf ions and the octahedral B-site positions are
filled by ~e~~ and w6+ ions at random. On the microscopic scale, polar nanoregions (or
clusters) are expected to exist due to composition fluctuations and partial orderldisorder,
which is believed to be the origin of the relaxor ferroelectric behaviour [9-11, 361.
Compared with other relaxors, PFW contains paramagnetic ~ e ~ + (3d5) ions on the B-site
with an occupancy of 66.7%, which possibly involves in some magnetic ordering
activities upon cooling while the polar nanodomains develop. The magnetic and dipolar
interactions in PFW possibly give rise to some peculiar properties in this relaxor.
PFW-containing multicomponent systems may demonstrate superior
dielectric/ferroelectric properties compared to the single component PFW system due to
significant structural improvements. The binary Pb(Fe213W1/3)03 -PbTi03 [PFW-PT]
system is of particular interest [37-421. PFW is a relaxor ferroelectric and
antiferromagnet, while PT is a typical ferroelectric with a sharp maximum of dielectric
constant at Tc = 763 K. It is possible to move the Curie temperature to around room
temperature and modify the relaxor ferroelectric and magnetic properties by adding an
appropriate amount of PT component to the PFW system. Hence, there are relationships
among the ferroelectric relaxation, magnetic ordering, perovskite structure, and
composition in the (1 -x)PFW-xPT systems.

1.6 Previous Studies on the PFW and PFW - PT Systems
1.6.1 Synthesis and Characterization of the Pb(Fe2/3W113)03 [PFW] and the
Pb(FeZ13Wl13)03 -PbTi03 [PFW-PT] Ceramics
Many studies have been perfonned to improve relaxor ferroelectric properties of
PFW for potential applications. These include the preparation of the PFW ceramics with
high purity and high density, element-doped PFW, thermal annealing treatment
conditions, and forming solid solutions.
Two kinds of high temperature reaction routes were often used for the preparation
of PFW ceramics [43-451. Some other soft chemistry-based routes such as co-
precipitation [46] and sol-gel [47] were also tried to synthesize the PFW compound. In a
conventional solid state reaction of mixed oxide where all chemicals are directly reacted
at high temperature, it is difficult to prepare a monophased PFW compound because of
the formation of undesirable, more stable second phases such as PbW04, Pb2W05 and
pyrochlore Pb2FeW06.s (A2B207-type) phase [48-521. The presence of these second
phases with non-ferroelectric properties seriously damages the perovskite microstructure
and dielectric properties of the ceramic materials. The other high temperature reaction
route is the Columbite method, which was first employed by Swarts and Shrout [44] for
the preparation of perovskite Pb(Mgl13Nb213)03 (PMN). In this method, Fe203 and W 0 3
are first reacted together to form F e 2 W O ~ - type structure B'B"206 (not really a
columbite phase) by calcinations at high temperature (-1000 OC), then followed by the
addition of PbO at a second step to form PFW ceramics at the temperatures of 850" to
900" [44]. Another name for this method is the B-site precursor method because it

involves the formation of B-site precursor oxides, in which cations prefer to occupy the
B-sites of the perovskite structure, followed by a reaction with the A-site species [53].
Therefore, the direct reactions between PbO and W 0 3 can in principle be avoided and the
subsequent formation of the pyrochlore phase Pb2FeW06,5 and other side products
(PbW04 and Pb2W05) can be suppressed. The content of the pyrochlore phase in the
PFW products can be determined on the basis of X-ray diffraction (XRD) spectrum
according to the following formula [54]:
Pyrochlore content (%) = {Ipyro(222) / [Ipy,(222) + Ip,ro,(l lo)]) x 100, (1.6)
where IpYr,(222) is the intensity of the (222) reflection peak (28 = 29.65") of the
pyrochlore phase and Ip,r,,(l 10) is the intensity of the (1 10) peak of the perovskite phase.
A higher content of perovskite phase (97-98%) can be obtained in the columbite method,
compared with -86% using the conventional mixed oxide method [53, 551. Improved
dielectric properties of PFW were achieved by using the columbite method [43].
As discussed above, it is very difficult to obtain a very pure PFW perovskite by
using any synthetic method. Lattice defects always exist in the PFW structure where
oxygen vacancies form defect pairs with positively charged defect sites in order to
neutralize the charge in the system [56, 571. In addition, the second phases resulting in
non-stoichiometric PFW phase also affect the domain wall motion and the dielectric
response leading to ageing. Ageing is a process for a system to evolve from a
nonequilibrium state to the equilibrium state [58]. It shows a strong dependence on the
frequency and has a log linear function of ageing time. Some authors have investigated
the influence of element doping in PFW on the microstructure, dielectric properties, and
ageing rate. A certain amount of Mn-doping in PFW (Pb(Fe2/3W1/3)1-xMnx03, x 5 2 at%)

was found to control the loss of normal and relaxor ferroelectrics and adjust the
magnitude of the dielectric constant and T,,, by changing its ageing effect [58, 591. The
Mn ions, existing in the form of Mn2+ (r = 0.67 A) or Mn3+ (r = 0.58 A) [60], occupy the
B-sites, resulting in the existence of oxygen vacancies in compensation for the charge
balance in the perovskite compound. Hence, it provides reorientable dipole pairs that are
responsible for the ageing process of Mn-modified PFW ceramics [61]. The Co-doped
PFW (Pb[(Fe2/3W1/3)1-\C~u]03, x 1 7.5 at% ) and Cr-doped PFW (Pb[(Fe2/3W1/3)1-xCrx]03,
x 5 5at%) exhibit a decrease of the dielectric permittivity maximum and the phase
transition shifts toward high temperature [62]. It was suggested that both ions
incorporated on the B-sites of PFW are compensated by oxygen vacancies, in order to
keep the charge balance. Relaxor ageing behavior was observed for both doped
compositions.
In addition to the Mn, Co and Cr doping on the B-sites of PFW perovskite
structure, some studies on Na or La doping on the A-site of the perovskite, Pbl-xNax[Fe(2.
\)l3W( 1+,)13]03 and Pb 1 .xLax[Fe(2+,)nW(~ .x)/3]03 were also reported [63, 641. It was found
that ~ a + (r = 1.02 A [63]) or ~ a ~ + (r = 1.32 A [65, 661) doping in PFW results in the
decrease of the lattice constant of the perovskite structure. The Na-doping significantly
improves the ordering of Fe and W cations (-1: 1 ratio) on the B sites of the PFW lattice,
while La-doping enlarges the difference of F ~ ~ + / w ~ + ratio in the ordered and disordered
regions. After La doping into PFW, the dielectric permittivity maximum decreases and
the transition peak broadens, while the corresponding transition temperature, T,, shifts
toward lower temperature. On the other hand, the Na doping does not cause obvious
changes in the transition temperature and the dielectric permittivity maximum, which

seems to be in contradiction to the improvement of the ordering of the PFW structure
lattice. This may be related to the presence of the non-ferroelectric PbW04 phase and the
mixing of two cations (Na and Pb) on the A sites which may contribute to a certain
degree of disorder to counterbalance the increased order on the B sites [64].
The influence of thermal treatments on the relaxor ferroelectric properties of the
manganese-doped PFW ceramics was investigated in Refs [67, 681. Air annealing causes
a sharpening of the dielectric permittivity peak and higher permittivity maximum values.
Oxygen annealing does not cause evident changes in the dielectric permittivity plot
against temperature. The difference is that air annealing can alter the oxygen vacancy
equilibrium concentration in the PFW perovskite structure, significantly increasing the
possibility of rearranging Fe3+ and W" in B sites. The presence of vacancies favors the
diffusion of B cations. It was further suggested that the manganese ions and oxygen
vacancies couple to the spontaneous dipoles, enhancing long-range dipolar interaction,
thus promoting dipolar order, which accounts for the enhancement of the dielectric
maximum value.
In the complex perovskite compound PFW, Fe'+ and W" ions exhibit a disordered
occupancy on the B-site. The degree of ordering in PFW can be modified by forming a
solid solution with a long-range ordered perovskite compound PbTiO, [PT]. Partial
substitution of ~ i ~ + ions (r = 0.605 A [69]) for the ~ e ' + and w6+ ions enhances the related
lattice distortion in the perovskite structure, thus modifying the relaxor ferroelectric
properties as well. In the binary PFW-PT system, with the PT content increasing, the
relaxor ferroelectric may be transformed into a normal ferroelectric phase, accompanied
with a structural phase transition from a pseudo-cubic to a tetragonal phase. The
coexistence of multi-phases may take place in a certain composition range. The boundary
(or region) of the multi-phases is called the morphotropic phase boundary (MPB) near
which the system is expected to exhibit anomalous dielectric properties [40 - 41, 701. X-
ray diffraction results at room temperature demonstrate that the PFW-PT solid solutions
with 0 - 20wt% of PT have cubic structure, and those with 30wt% - 100wt% of PT show
tetragonal structure [71]. Mitoseriu et al. determined a morphotropic phase boundary in
the (1-x)PFW-xPT system at 300 K in the range of compositions, 0.20 I x 5 0.37 [72].
He also investigated the dielectric behavior of (l-x)PFW-xPT with x = 0, 0.2,0.3 and 0.4
using a modified Landau theory proposed for the ferroelectric relaxor. The temperature
dependence of the local order parameter (the average local square polarization < pi B2)
displays the evolution of the system from short-range order (SRO) to long-range order
(LRO) ferroelectric, with the increasing PT component. However, the anomaly related to
MPB was not observed on the temperature dependence of the dielectric constant of (1-
x)PFW-xPT [73, 741. The microstructural evolution of 0.68PFW-0.32PT ceramics was
analyzed using in situ TEM over the temperature range of 16 to 300 K [75]. At 16 IS, all
grains show a macrodomain structure throughout their volume, but at T>250 K a domain-
free shell is formed around the central core that still exhibits strong domain wall. EDS
(Energy Dispersive X-ray Spectrometer) analysis revealed that the cores were Ti-rich and
the shells are W-rich with respect to the bulk composition. So far, systematic and detailed
studies of the PFW-PT system in terms of component (structure) and dielectric properties
are still lacking.
1.6.2 Relaxor Ferroelectric PFW Single Crystal

While almost all of the chemical and physical characterizations have been carried
out on PFW and PFW-PT polycrystalline ceramic systems, single crystals of PFW and
PFW-PT are expected to display superior dielectric properties to polycrystalline PFW
ceramics when appropriate crystallographic directions are chosen for the measurements.
This is because single crystals usually show a perfect and continuous structure without
any heterogeneous phases due to the presence of grain boundaries. Unfortunately, the
growth of PFW and PFW-PT single crystals has encountered some difficulties arising
from the control of the thermal and chemical parameters of multi-component systems and
from the volatility of the solvents at high temperatures [76, 771. Recently, Ye et nl.
successfully synthesized single crystals of PFW from a high temperature solution growth
using (PbO + Bz03) as flux [14, 381. The grown small crystals (- 1.0 x 1.0 x 1.0 mm3)
exhibited a regular cubic morphology, black and semi-metallic luster, and a good optical
isotropy, without inclusions or internal stress. The structural analysis of the single crystal
by X-ray diffraction shows that it has an average primitive cubic perovskite structure
with Pn23m symmetry. The structural refinement demonstrates a positional disorder due
to shifts of atoms (Pb, Fe and W) from their ideal positions. Hence, a disordered
structural model was presented for PFW. It was found that at zero electric field the PFW
crystals remain optically isotropic down to 10 K, and show typical relaxor ferroelectric
behaviour in the temperature dependence of the dielectric permittivity. A
macroscopically polar phase can be induced by the application of an electric field and
remain metastable when the field is removed at low temperature. Under an alternating
electric field, the induced polarization gave rise to dielectric hysteresis loops showing

ferroelectric behaviour at low temperature below 80 K. However, no PFW-PT single
crystals have been successfully grown and reported so far.
1.6.3 Magnetic Properties of Perovskite Compounds PFW and (1-x)PFW-xPT
Besides relaxor ferroelectric properties, PFW is also believed to be a
"ferroelectric antiferromagnetic" material, because of an antiferromagnetic ordering
taking place below the NCel temperature, TN = 363 K. Above TN, the temperature
dependence of the magnetic susceptibility x = C/(T-8) is satisfied [78, 791. In the PFW
perovskite structure, the paramagnetic ions ~ e ' ' (3d5) are located on the octahedral B-
sites with an occupancy of 66.7%. Magnetic ordering may occur upon cooling as the
polar nanodomains form and develop. Earlier studies found that the antifen-omagnetic
order of PFW ceramics takes place in the temperature range of 363 K - 383 K on the
temperature dependence of magnetization [78, 80, 811. Later, Al'shin et al. [82] claimed
that there are two Curie-Weiss regions below TN = 383 K, on the basis that the
antifen-omagnetic ordering and a small spontaneous magnetic moment occur at low
temperatures. Mossbauer spectroscopy measurements of PFW indicated that one
magnetic ordering should occur in the magnetic sublattice I below 41 5 K and the other in
the magnetic sublattice I1 below 383 K. [83]. Clearly, there is inconsistency in an
agreement on the results of magnetic measurements of the PFW ceramics.
In a recent study of the PFW single crystal, Ye et al. observed two types of
antiferromagnetic phase transitions in the temperature dependence of the magnetization at
TN, = 350 K and TNZ = 20 K, respectively, as shown in Fig. 1.8 [14]. They proposed that
these antiferromagnetic orders arise from two different types of interaction, one from a
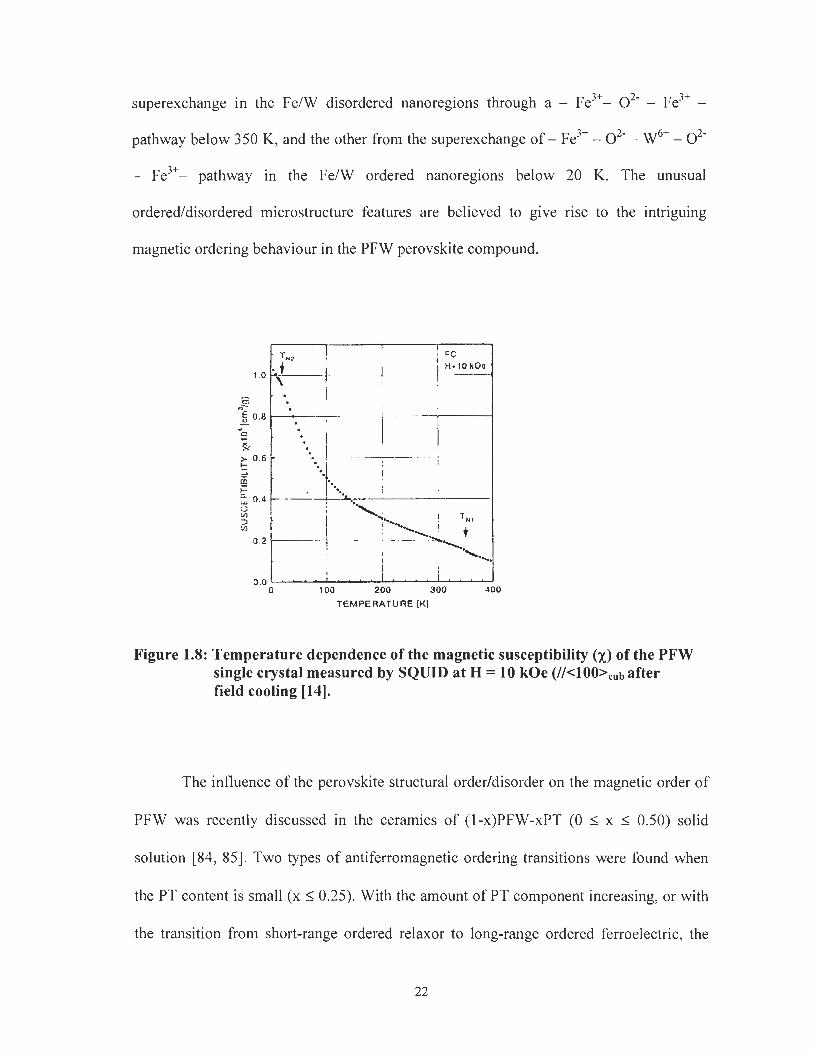
superexchange in the FeIW disordered nanoregions through a - Fe3+- 02- - Fe3+ -
pathway below 350 K, and the other from the superexchange of - ~ e ' + - 0" - w6+ - 02-
- ~ e ~ + - pathway in the FeIW ordered nanoregions below 20 K. The unusual
orderedldisordered microstructure features are believed to give rise to the intriguing
magnetic ordering behaviour in the PFW perovskite compound.
I
0.0 . . " ' . . . ' . . . ' I " . . 0 100 200 300 400
TEMPERATURE [KI
Figure 1.8: Temperature dependence of the magnetic susceptibility ( x ) of the PFW single crystal measured by SQUID at H = 10 kOe after field cooling 1141.
The influence of the perovskite structural order/disorder on the magnetic order of
PFW was recently discussed in the ceramics of (1-x)PFW-xPT (0 I x 5 0.50) solid
solution [84, 851. Two types of antiferromagnetic ordering transitions were found when
the PT content is small (x 5 0.25). With the amount of PT component increasing, or with
the transition from short-range ordered relaxor to long-range ordered ferroelectric, the

low-temperature antiferromagnetic NCel point shifts toward a higher temperature and the
high-temperature one shifts toward a lower temperature. Unfortunately, no detailed
explanation was provided of the shift of the low-temperature Nkel transition towards
higher temperature. The induced magnetization of the PFW ceramics was also
investigated under an alternating electric field. At the temperatures below the low-
temperature NCel transition, a very slim hysteresis loop was obtained, suggesting a weak
ferromagnetism in the material 1841.
1.6.4 Magnetoelectric Effect in the Multiferroic PFW and PFW-PT Systems
Magnetism and ferroelectricity involve local spins and off-centre structural
distortions, respectively. These two kinds of interactions can coexist in some particular
materials, termed multiferroics, or magnetoelectrics [86-881. Since some substances
possess simultaneous electric and magnetic dipole moments, the applied electric
(magnetic) fields may induce not only electric (magnetic) polarization, but also magnetic
(electric) polarization [89, 901. First-principle calculations proved that the
magnetoelectric effect is caused due to the role of the d electrons of the transition metals
associated with their magnetic properties, which tends to reduce the off-centre
ferroelectric distortion [91]. Therefore, the ferroelectric (magnetic) transition is probably
influenced by the magnetic (ferroelectric) behavior. The magnetoelectric effect has been
observed in many multiferroics, such as the perovskite BiFe03 [92] and BiMn03 [90], the
boracite family [93], and RMn03 (R= rare earth) [94].
The magnetoelectric phenomenon in PFW single crystal was first reported by Ye
et al. [14]. A slight deviation of the magnetization from linearity in the temperature
interval of the dielectric relaxation around T,, = 175 K is possibly a sign of
magnetoelectric coupling within the perovskite compound (Fig. 1.8). The slowing down
in the dynamics of the polar clusters, which was considered to be the origin of the
dispersive dielectric peak in relaxor ferroelectrics, seems to interrupt the magnetic
interaction. Mitoseriu et al. [84] discussed the magnetoelectric effect based on the fact
that an anomaly of the magnetic hysteresis loop observed at the phase transition
temperature 175 K in the PFW ceramics, as shown in Fig. 1.9. However, it is difficult to
detect an obvious magnetoelectric interaction. The complete (non-reversible) rotation of
the ferroelectric domains by an applied magnetic field is rarely observed. The theoretical
study of the coupling mechanism between antiferromagnetic and ferroelectric ordering
based on the soft-mode theory for a ferroelectric system and the mean-field
approximation for the magnetic subsystem [95] indicated that the Nkel temperature
would decrease with decreasing magnetoelectric coupling. Thus, in the (I-x)PFW-xPT
system, the maximum magnetoelectric coupling seems to occur in pure PFW. Generally
speaking, the magnetoelectric effects observed in the experiments of temperature and
magnetic field dependence of magnetization are very weak in PFW and PFW-PT
systems. It is also necessary to clarify by means of other magnetic or dielectric
measurement techniques.

1 PFW ceramic 1.0 i
-M -25 0 25 SO Magnetic field (Oe)
Figure 1.9: Magnetic hysteresis loops of the PFW ceramics at different temperatures [84].
1.7 Objectives and Plans of This Work
Some fundamental studies on the ferroelectric and magnetic properties of the
PFW and PFW-PT ceramics systems have been carried out, although some results are not
in agreement with each other. Generally speaking, systematic and detailed studies of the
PFW-PT ceramic and single crystal systems in terms of phase (structure) transitions,
dielectric, relaxor ferroelectric, and magnetic properties are still not reported. Such
studies will be useful in order to reveal the intrinsic relationships among con~position,
structure, relaxor ferroelectric and magnetic properties of this system.
The plan of this work is to synthesize the (1-x)PFW-xPT solid solution system in
the focus on ceramics and single crystals, and to characterize the structural, dielectric,
relaxor ferroelectric, and magnetic properties, in order to provide a better understanding
of the structure-property relations of this magnetically ordered relaxor ferroeletric
system. It is composed of the following parts.

(1) Synthesis, Structure and Properties of the (1-x)PFW-xPT Solid Solution
Ceramics
A modified B-site precursor method is developed to synthesize highly pure
perovskite phase of (1-x)PFW-xPT, with x = 0, 0.10, 0.20, 0.25, 0.30, 0.325, 0.35, 0.40,
0.60, and 0.80. The phase and structure are characterized by X-ray diffraction.
The dielectric/ferroelectric properties and the phase transitions will be examined
by means of dielectric measurements and differential scanning calorimetry (DSC)
analysis. A ferroelectric phase diagram of the solid solution system is established, which
describes the perovskite phase as a function of composition and temperature. A
morphotropic phase boundary (MPB) is located within a certain composition interval,
which separates a pseudocubic (rhombohedral) phase from a tetragonal phase. The
relaxor ferroelectric behavior of (1-x)PFW-xPT systems will be investigated as a function
of frequency, temperature, and perovskite structural ordering (or composition).
(2) AC Impedance Spectroscopic Analysis of the Electrical Microstructural
Phases in the (1-x)PFW-xPT Ceramics
It is known that polycrystalline ceramics materials contain different
microstructural phase components. Each phase component makes individual contribution
to the total electric response of the system. The electrical transport properties of
microstructure phases in the (I-x)PFW-xPT polycrystalline system will be studied with
the help of con~plex ac impedance spectroscopic measurements combined with electric
modulus formalism analysis. The resistivity, electric modulus, and capacitance of the
microstructure phases, are measured and analyzed as functions of temperature and

frequency. More importantly, the influence of each microstructural component phase on
the ferroelectric behaviour of the (1 -x)PFW-xPT ceramics system will be discussed.
(3) Growth and Characterization of the (1-x)PFW-xPT Single Crystals
Single crystals of the (1-x)PFW-xPT solid solution, with x = 0, 0.07, 0.13, 0.17,
0.27, and 0.75, are grown from high temperature solution using PbO as flux. The
dielectric measurements are carried out as a function of temperature and frequency. The
relaxor ferroelectric mechanism is further analyzed with the help of the dispersive
dielectric relaxation models. In addition, the dependence of the macroscopic polarization
of relaxor ferroelectrics on the external applied electric field will also be investigated.
(4) Magnetic Properties of the (1-x)PFW-xPT Single Crystals
The magnetic properties of the (1-x)PFW-xPT single crystals are investigated by
measuring the temperature and magnetic field dependences of the magnetization. The
macroscopic magnetization by the application of a magnetic field is studied, which
further reveals the different magnetic interactions at various temperatures. The variation
of the magnetic interaction behaviour with the perovskite microstructure and composition
will be discussed to understand of the experimental results obtained in the PFW-PT
system.
(5) Mossbauer Spectroscopic Measurements of the PFW and 0.75PFW - 0.25PT
Ceramics
The magnetic properties and hyperfine interactions in the 57~e-enriched PFW and
0.75PFW-0.25PT ceramics are studied by means of the Mossbauer spectroscopic

measurements. The magnetic interaction between the magnetic moment of the nucleus
and the internal magnetic field arising from the ceramic materials at different
temperatures is discussed. The influence of the PT-component on the Mossbauer spectra
of PFW-PT is also further discussed.
(6) General Summary
Finally, a general summary is given on this magnetically ordered relaxor
ferroelectric (1 -x)PFW-xPT system.
References
T. Mitsui, I. Tatsuzaki and E. Nakamura, An introduction to thephysics of
ferroelectrics, Gordon and Breach Science Publishers, New York (1 976).
R. E. Eitel, Plz. D thesis in muter-ials science and engineering, Pennsylvania State
University (2003).
F. Jona & G. Shirane, Ferroelectric Crystals, Dover Publication Inc., New York
(1 993).
L. E. Cross and K. H. Hardtl, Encyclopedia of Chemical Technology 10, 1 (1980).
W. J. Merz, Ph-ys. Rev., 91, 513 (1953).
M. E. Line and A. M. Glass, Principles and Applications of Ferroelectrics and
Related Materials, Clarendon Press, Oxford (1 977).
G . Shirane and S. Hoshino, J. phys. Soc. Jpn. 6,265 (1951).
A. R. West, Basic Solid State Chemistry, John Wiley & Sons, Ltd., Chichester

(1996).
[9] L. E. Cross, Ferroelectrics 151, 305 (1994).
[lo] Z.-G. Ye, Key Eng. Mater. 155 - 156, 81 (1998).
[ 1 1 ] L. E. Cross, Ferroelectrics 76,24 1 (1 987).
[12] A. Verbaere, Y. Piffard, Z.-G. Ye and E. Husson, Mat. Res. Bull. 27, 1227 (1992).
[13] A. Geddo Lehmann, F. Kubel, Z.-G. Ye and H. Schmid, Ferroelectrics 172, 277
(1995).
[14] Z.-G. Ye, K. Toda, M. Sato, E. Kita and H. Schmid, J, Korean Phys. Soc. 32,
S1028 (1998).
[15] C. A. Randall and A. S. Bahlla, Jpn. J. Appl. Phys. 29,327 (1990).
[16] C. A. Randall and A. S. Bahlla, T. R. Shrout and L. E. Cross, J. Mater. Res. 5,829
(1 990).
[17] G. A. Smolenskii, J. Phys. Soc. Japan 28,26 (1970).
[I 81 G. A. Smilenskii, V. A. Isupov, A. I. Agranovskaya and S. N. Popov, Soviet Plzys.
-Solid State 2, 2584 (1961).
[19] D. Viehland, S. J. Jang, and L. E. Cross, J. Appl. Phys. 68,2916 (1990).
[20] U. T. Hochli, K. Knorr and A. Loidl, Adv. Phys. 39.405 (1 990).
[21] V. Westphal, W. Kleemann and M. D. Glinchuk, Phys. Rev. Lett. 68, 847
(1 992).
[22] W. Kleemann and A. Klossner, Ferroelectrics 150, 35 (1993).
[23] L. A. Bursill, H. Qian, J.-L. Peng and X.-D Fan, Physica B, 216, l(1995).
[24] A. A. Bokov and Z.-G. Ye. J. Phys.; Condens. Matter 12, L541 (2000).
[25] A. A. Bokov and Z.-G. Ye, P l z j ~ Rev. B. 65, 1441 12 (2002).
1261 A. A. Bokov and Z.-G. Ye, Phys. Rev. B 66,064103 (2002).
[27] R. Pirc and R. Blinc, Phys. Rev. B 60, 13470 (1999).
[28] C. N. R. Rao, Solid Stute Chemistry, Marcel Dekker, Inc. New York, (1974).
[29] F. Fiorillo, Meuszirenzetzt aizd Chat-ucterizutiotz of Mugtzetic Materials, Elsevier
Academic Press, Amsterdam, (2004).
[30] T. R. Shrout and A. Halliyal, Am. Cerum. Soc. Bull. 66 (4), 704 (1987).
[3 11 G . H. Haerlling, J. Atn. Cerum. Soc. 82(4) 797 (1 990)
[32] C. G. F. Stenger, F. L. Scholten and A. J. Burggraaf, Solid State Cotntnon 32,989
(1979).
[33] N. Setter and L. E. Cross, J. Mater. Sci., 15, 2478 (1980).
[34] F. Chu, I. M. Reaney and N. Setter, Ferroelectrics 151, 343 (1995).
[35] J. Chen, H. M. Chan, and M. P. Harmer, J. Atn. Cerurn. Soc. 72,593 (1989).
[36] 2.-G. Ye, Ferroelectrics 184, 193 (1996).
[37] L. Feng and 2.-G. Ye, J. Solid State Chetn. 163,484 (2002).
[38] Y. -J. Kim and S.-W. Choi, Fei-roelectrics 186,287 (1996).
[39] M. Yonezawa, Am. Cernm. Soc. Bull. 62, 1375 (1983).
[40] V. V. Gagulin, S. K. Korchagina, Y. A. Shevchuk, N. V. Fadeeva and V. V. Bogatko,
Ferroelectrics 204, 345 (1 997).
[41] L. Mitoseriu, A. Stancu, C. Fedor and P. M. Vilarinho, J. Appl. Phys. 94, 1918 (2003).
[42] L. Mitoseriu, P. M. Vilarinho, M. Viviani and J. L. Baptista, Muter. Lett. 57, 609
(2003).
[43] L. Zhou, P. M. Vilarinho, J. L. Baptista, Muter. Res. Bull. 29, 11, 1193
(1 994).

[44] S. L. Swartz, T. R. Shrout, Mater. Res. Bull. 17, 1245 (1982).
[45] A. S. Khim, J. Wang and J. Xue, Solid State Ionics 132, 55 (2000).
[46] C. H. Lu, Y. C. Wong, Cerant, h t . 21,413 (1995).
[47] C. H. Lu, K. Shinozaki, N. Mitzutani, J. Am. Cernm. Soc. 75, 1303 (1992).
[48] G. A. Smolenskii, A. I. Agranovskaya, V. A. Isupov, Sov. Phys. Sol. State 1,907
(1 959).
[49] C. H. Lu, N. Ishizawa, K. Shinozaki, N. Mizutani, M. Kato, J. Mat. Sci. Lett. 7,
1078 (1988).
[50] P. M. Vilarinho, J. L. Baptista, J. Europ. Cernnz. Soc. 11,407 (1993).
[51] A. I. Agraanovskaya, Bull. Acad. Sci. USSR Phys. Ser. 1271 (1960).
[52] M. P. Kassarjian, R. E. Newnham and J. V. Bigger. Amer. Ceratn. Soc. Bull. 64,
1 lo8 (1985).
[53] B.-H. Lee, N.-K. Kim, B.-0. Park and S.-H. Cho, Mater. Lett. 33, 57 (1 997).
[54] G. Drazic, M. Trontelj, and D. Kolar, Mater. Sci. Eng. B 26, 189 (1994).
[55] L. Zhong Mnter. Res. Bull. 1,193 [1994].
[56] W. Y. Pau, T. R. Shrout and L. E. Cross, J. Mater. Sci. Lett. 8, 771 (1989).
[57] G. Drazic, H. Trontelj and D. Kolar, Mater. Sci. Eng. B 26, 189 (1 994).
[58] R. Natarajan, J. P. Dougherty, J, Mnter. Sci. 33, 1991 (1998).
[59] Q. M. Zhang, J. Zhao and L. E. Cross, J. Appl. Phys. 79, 1 (1996).
[60] X. Wang and X. Yao, Ferroelectr-ic 154,307 (1994).
[61] L. Zhou, P. M. Vilarinho, and J. L. Baptista, Mater. Res. Bulletin 31, No. 6,699
(1 996).
[62] C. Miranda, P. M. Vilarinho and L. Zhou, Ferroelectrics 233,269 (1 999).

[63] L. Zhou, P. M. Vilarinho and J. L. Baptista, J. European Ceram Soc. 18, 1383
(1 998).
[64] L. Zhou, P. M. Vilarinho and J. L. Baptista, Key. Engng. Mater. Vol. 132, 1080
(1 997).
[65] L. Zhou, P. M. Vilarinho, P. Q. Mantas, J. L. Baptista, and E. Fortunato, J. European
Ceramic Soc. 20, 1033 (2000).
[66] R. D. Shannon and C. T. Prewitt, , Acta. Cryst. B 26, 1046 (1970).
[67] P. M. Vilarinho, Ph. D thesis, Aveiro University, Portugal, (1994).
[68] L. Zhou, P. M. Vilarinho and J. L. Baptista, J. Mater. Sci. 33,2673 (1998).
[69] R. D. Shannon, Acta. Crystallogr, A32 75 1 (1 976).
[70] B. Jaffe, W. R. Cook, and H. Jaff, Piezoelectric Ceranzics, Academic Press, London
(1971).
[71] T. S. Shrout, Z. P. Chang, N. Kim, and S. Markgraf, Ferroelectrics Lett. 12, 63
(1 990).
[73] V. J. Tennery, K. W. Hang and R. E. Novak; J. Am. Ceram. Soc. 51,671 (1968).
[73] L. Mitoseriu. M. M. Camasciali, P. Piaggio, P. Nani, Appl. Phys. Lett. 81, 5006
(2002).
[74] L. Mitoseriu, A. Stancu and C. E. Fedor, J. Opt. and Adv. Mater. Vol. 5,3,787
(2003).
[75] Z. Li, A. Wu, P. M. Vilarinho and I. M. Reaney, J. Phys.: Condens. Mater 17,2167
(2005).
[76] Z.-G. Ye and H. Schmid, Ferroelectrics 162, 1 19 (1 994).

[77] D. Elwell and H. J. Sheel, Crystal Growth from High Temperatue solution,
Academic Press, New York, (1 975).
[78] G. A. Smolenskii and A. F. Ioffe, in "Colloque International de magnetisme de
Grenoble", 71 (1958).
[79] V. A. Bokov, I. E. Myl'nikova and G. A. Smolenskii, Sovietphys.-JETP 15,447
(1 962).
[SO] G. A. Smolenskii and V. a. Bokov, J. Appl. Phys. 35,915 (1964).
[81] V. A. Bokov, I. E. Myl'nikova, and G. A. Smolenskii, Ferroelectrics-
Anti$erornagnets, Zlz. Eksp. Teor. Fiz. Vol. 42 (2), 643 (1 962).
[82] V. I. Al'shin, Investigation of Magnetoelectric Interactions in magnetically Ordered
Crystals, Cand. Sci. (p11ys.-math.) Dissertation, Leningrad: Inst. Of
Semiconductors, USSR Acad. Sci., (1970).
[83] Yu. N. Venevtsev, V. V. Sklyarevskii, I. I. Lukashevich, Kristallograjiya, Vol. 21 (5),
971 (1976).
[84] L. Mitoseriu, D. Marre, A. S. Siri and P. Nanni, Appl. Phys. Lett., Vol. 83 (26),
5509 (2003).
[85] L. Mitoseriu, D. Marre, A. S. Siri, A. Stancu, C. E. Fedor and P. Nanni, J. Opt. and
Adv. Mater. Vol. 6 (2), 723 (2004).
[86] G. A. Smolenskii and I. E. Chupis, Ferroelectromag~zets. Usp. Fiz. Nauk. 137, 41 5
(1982).
[87] H. Schmid, Fei-roelectr-ics 162, 3 17 (1 994).
[88] J. Wang, J. B. Neaton, H. Zheng, V. Nagarajan, S. B. Ogale, B. Liu, D. Viehland,
V. Vaithyanathan, D. G. Schlom, U. V. Waghrnare, N. A. Spaldin, K. M. Rabe, M.
Wuttig, R. Ramesh. Science 299, 171 9 (2003).
[89] S. A. Boguslavskii, Izbrannye Trudy po Fizike, Moscow: Fizmatgiz 231 (1961).
[90] T Kimura, S Kawamoto, I Yamada, M Azuma, M TakanoT . Plzys. Rev. B 67,
180401 (2003).
[91] N. A. Hill, K. M. Rabe, Pl~ys. Rev. B 59, 8759 (1999).
[92] G. A. Smolenskii, V. M. Yudin, E. S. Sher and Yu. E. Stolypin, Sov. Phys, JETP
16,622 (1 963).
[93] E. Ascher, H. Rieder, H. Schmid and H. Stossel, J. Appl. Phys. 37, 1404 (1966).
[94] T. Katsufuji, Phys. Rev. B 64, 10441 9 (2001).
[95] C. G. Zhong and Q. Jiang, J. Phys.: Corzderzs. Matter 14, 8605 (2002).

Chapter 2: Experimental and Principles
2.1 Introduction
In this chapter, the experimental methods and the basic principles that are used in
this thesis work are introduced. The main experimental methods include X-ray diffraction
for structure and phase characterization, AC impedance spectroscopy for dielectric,
electrical conductivity and resistivity measurements, Sawyer-Tower circuit for dielectric
hysteresis measurement, differential scanning calorimetry (DSC) for thermal analysis and
phase transition, superconducting quantum interferometric device (SQUID)
magnetometer for magnetic measurements, and Mossbauer spectroscopy for magnetic
properties studies.
2.2 X-ray Diffraction (XRD) for Crystal Structure Characterization
Different crystal structures (d-spacing, Bragg angle and atomic numbers) have
distinct X-ray diffraction patterns (angles and intensities of the reflection peaks).
Therefore, the "fingerprint" feature of the X-ray diffraction pattern has been used widely
for the identification of crystalline materials [I].
Single crystals are built up of regular arrangements of atoms in three dimensions.
These arrangements can be represented by repeatable unit cell with six parameters. They
are three unit cell edges a, b, c, and three angles a (between b and c), P (between a and
c), y (between a and b) [2]. When a crystal structure changes, for example from cubic (a =
b = c and a = p = y = 90") to tetragonal (a = b ;t c and a = P = y = 90") structure, the X-

ray diffraction pattern also changes, as shown in Fig. 2.1. The 200 reflection peaks in
cubic structure split into the (002) and (200)/(020) peaks in tetragonal structure, and the
(220) reflection peak splits into the (202)/(022) and (220) peaks, because the lengths of
the unit cell edges are no longer equal after the structure symmetry change. All (1 11)
reflections in the tetragonal structure are identical and display only one peak (Fig. 2.l(b)).
Based on this principle, the phase symmetry and phase components of the (1-x)PFW-xPT
solid solution can be characterized in this work, especially for the compositions near the
morphotropic phase boundary where multiple phases coexist.
(111) (b) Tetragonal
Figure 2.1: Characteristic X-ray spectrum for (a) Cubic (prototype) and (b) Tetragonal. The corresponding splitting is shown as the crystal structure changes from cubic to tetragonal phase.
2.2.1 XRD Instruments Used in Our Work
Two types of X-ray diffraction apparatus were used for the structural analysis of
the ceramics and single crystals. One is Philips PW 1730 X-ray diffractometer. The
resolution of angle 29 scanning is usually 2 0.02'. The maximum current and voltage
used are 40 mA and 45 kV, respectively. The R-AXIS RAPID X-ray diffractometer is

made by Rigaku International Corporation. This apparatus is capable of rapidly collecting
(usually less than 30 min.) the diffraction pattern of low-molecular single crystal. It is
mainly composed of three sections: main body, X-ray generator, and host computer
sections. The maximum operation current and voltage are 50 mA and 45 kV,
respectively.
2.3 Dielectric Spectroscopy
2.3.1 Simple Principles of Dielectric Constant Measurements
Dielectric materials ideally have zero electrical (ionic) conductivity and are used
as capacitors and electrical insulators in a variety of applications. When a potential
difference is applied to the dielectric electrodes of a parallel capacitor, a polarization of
charge arises, although long-range motion of ions or electrons should not occur. The
capacitance ( C ) of a dielectric substance can be expressed by
where c, is the permittivity of free space, 8.854 x 1 0 ~ ' ~ F m-', E, is the dielectric constant
(or relative real permittivity), A is the area of plates of the parallel capacitor, and d is the
thickness of the capacitor [3,4].
In a real dielectric constant measurement, an alternating electromotive force 0
with frequency f is applied to the electrodes of a parallel capacitor structure, and an
alternating magnitude of current, i, can be written in the following form
i = j$+C, 0 (2.2)

where j = 4-1, C, = E,N~ is the vacuum capacitance of the space cell with electrode area
(A). Because of the existence of dielectric loss (including the leakage current) in
dielectric materials, the dielectric constant E, has to be written in a complex form:
cr*m = E'@ - j d l @ , (2.3)
where E' is the real part of the dielectric permittivity (usually called dielectric constant)
and E" the imaginary part of the dielectric permittivity. The ratio of imaginary part to real
part of the dielectric pernlittivity represents the dielectric loss. In a complex coordinate
system, it is equal to
t a n 6 = ~ " / E ) ,
where tan 6 is the tangent of the dielectric loss angle.
2.3.2 AC Impedance Analyzer and Broadband Dielectric Spectrometer
The measurements of the dielectric permittivity as a function of temperature at
different frequencies were carried out using a Solartron impedance analyzer associated
with a Solartron 1296 dielectric interface or using an Alpha high-resolution
dielectriclimpedance analyzer (NovoControl), as shown in Fig.2.2. A wide frequency
range of 1 Hz to 1000 kHz is often applied for the dielectric measurements. The
experiments are carried out upon heating in the temperature range of 100 K to 700 K.

Figure 2.2: Alpha high-resolution broadband dielectric/impedance spectrometer (NovoControl)
The dielectric and impedance spectroscopy was employed in this work to
characterize the dielectric properties, relaxor ferroelectric behaviour and the electrical
microstructure of the (1 -x)PFW-xPT solid solution ceramics and single crystals.
2.4 Ferroelectric Hysteresis Loop Measurements
The induced polarization under the application of an electric field can be
investigated with the help of ferroelectric hysteresis loop measurements in which the
electric field dependence of the polarization of a dielectric substance is obtained. When
such a hysteresis loop is observable, the dielectric substance shows ferroelectricity,
because the macroscopic polarization occurs and some residual electrical polarization is
retained after an applied electric field is switched off in the system, as explained in
section 1.1.
2.4.1 Sawyer-Tower Circuit for Ferroelectric Hysteresis Loop Measurements

In order to measure the polarization as a function of electric field, a RT66A
standard ferroelectric testing system (Radiant Tech.) combined with RT66A high voltage
interface (HVI) was used based on the principle of Sawyer-Tower circuit that is a typical
ferroelectric measurement method [4]. Figure 2.3a is a photograph of the test set-up with
the HVI connected and Fig. 2.3b is a modified Sawyer - Tower circuit describing the
principle of measurement [5, 61. An alternating voltage V is applied on a dielectric
sample with capacitance C, and resistance R,. If the thickness of a sample is d, an electric
field gradient can be expressed in terms of E = Vld, which is often used in the
measurements of induced polarization of the dielectric substance. An RC circuit is
connected in series with the sample C, in the circuit. The parallel RC circuit allows
con~pensation for any phase shift due to conductivity or dielectric loss in the sample. Two
capacitors in the circuit are connected in series. Therefore, the voltage V, across C, is
proportional to the charge (Q) of the sample C, by
V,. = Q/C,. = (A/C,)P ct P ,
here A is the electrode area of a sample and P is the polarization of the sample. The
voltage is monitored and converted into the polarization of the sample. The polarization
(or electric displacement) plot against electric field applied is displayed on a typical
RTGGA software data screen.
RT-66A Standardized Ferroelectric Test System
Figure 2.3: (a) RT66A standard ferroelectric testing system (Radiant Tech.), (b) A modified Sawyer-Tower circuit for the measurement of ferroelectric hysteresis loops [5 ] .
(b) Sample
Cr
The dielectric hysteresis loop measurements are carried out in this work to
characterize the ferroelectricity of the ( I -x)PFW-xPT single crystals.
CX, RX
2.5 Differential Scanning Calorimetry (DSC)
In order to analyze and confirm the structural phase transition in the (1-x)PFW-
xPT solid solution system, the temperature dependence of heat flow is measured using
the differential scanning calorimeter (DSC) technique in this work.
nY * Yr t
(Scope Y )
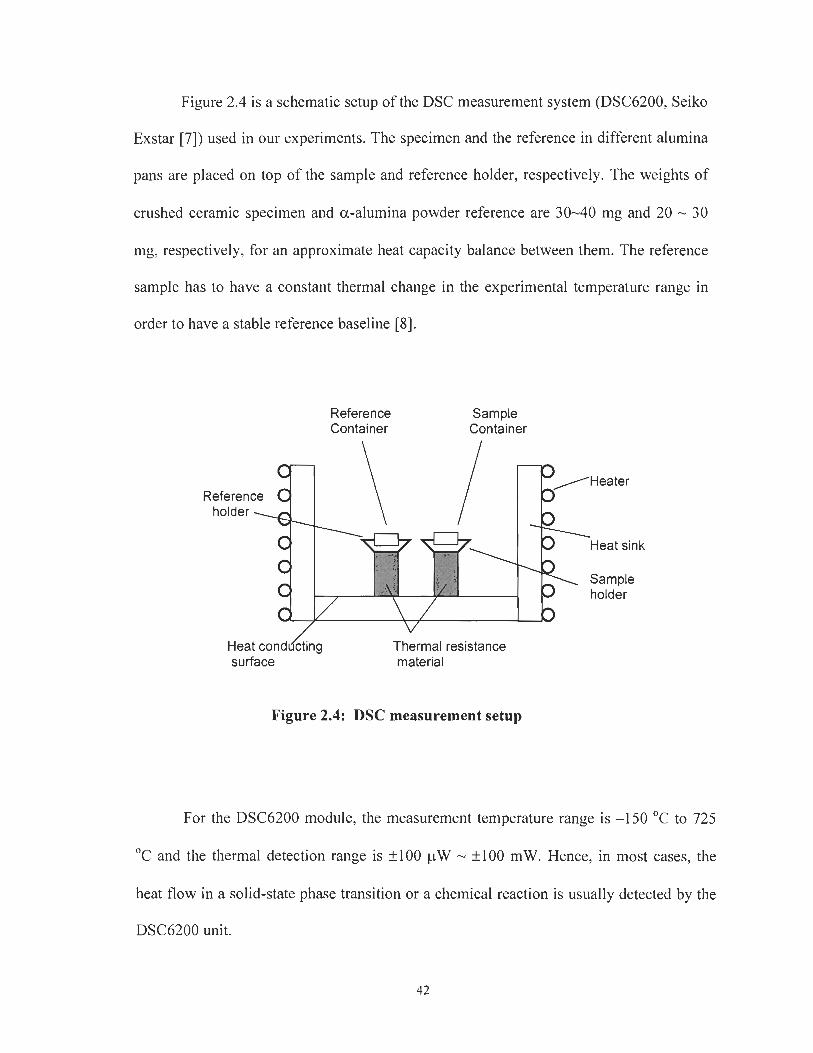
Figure 2.4 is a schematic setup of the DSC measurement system (DSC6200, Seiko
Exstar [7]) used in our experiments. The specimen and the reference in different alumina
pans are placed on top of the sample and reference holder, respectively. The weights of
crushed ceramic specimen and a-alumina powder reference are 30-40 mg and 20 - 30
mg, respectively, for an approximate heat capacity balance between them. The reference
sample has to have a constant thermal change in the experimental temperature range in
order to have a stable reference baseline [8].
Reference Sample Container Container
Heater
Heat sink
Sample holder
Heat conddcting Thermal resistance surface material
Figure 2.4: DSC measurement setup
For the DSC6200 module, the measurement temperature range is -150 "C to 725
OC and the thermal detection range is f 100 pW - f 100 mW. Hence, in most cases, the
heat flow in a solid-state phase transition or a chemical reaction is usually detected by the
DSC6200 unit.

2.6 Magnetic Measurements
2.6.1 Basic Magnetic Measurement Principle
When a sample with magnetic properties moves through the metal coils under the
condition of magnetic field, the magnetic flux density (or magnetic induction) B within
the metal coil will be changed because of the variation of magnetic moment of the sample
and obeys the following equation [9, 101:
B = H + 4 x M , (2.6)
where H is the applied magnetic field (Oe), and M is the magnetization of the sample
(emulg, or emulmole).
The ratio of M over H is called the magnetic susceptibility x (emu/g /Oe),
x = M I H . (2.8)
which is often plotted against temperature for the studies of magnetization properties of
the sample. The dia-, para-, or antiferromagnetic substances usually have constant
susceptibility x under normal condition, such as magnitude of magnetic field, and retain
no magnetism when the field is removed. However, the ferromagnetic substance is quite
different (see section 1.4)
2.6.2 Magnetic Measurement by a Superconducting Quantum Interference Device
(SQUID) [lo1
The magnetic moment of a sample is measured by moving the sample through the
detection coil in a series of steps. At each step, the sample's magnetic moment produces
some magnetic flux through the superconducting detection coils, which is then detected by
a SQUID magnetometer (Superconducting Quantum Interference Device). Because the

detection coils, connecting wires, and the SQUID input coil form a closed superconducting
loop, any change of magnetic flux in the detection coils produces a change in the persistent
current in the detection circuit, which is proportional to the change in magnetic flux. The
SQUID electronics produces an output voltage that is proportional to the current flowing in
the SQUID input coil. Hence, the SQUID device has a function as an extremely sensitive
current-to voltage convertor. The SQUID we used can operate in a magnetic field as large
as 7 teslas in the temperature range of 2 K to 400 K.
Figure 2.5 is a photograph of the MPMS XL system used in the magnetic
measurements of the ( 1 -x)PFW-xPT solid solution single crystal.
Figure 2.5: MPMS XL magnetic measurement system.
2.7 Miissbauer Spectroscopy
2.7.1 Simple Principle of Mossbauer Spectroscopic Measurement
The Mossbauer effect is recoilless nuclear resonance absorption, in which a system
absorbs a quantum of energy equal to the difference between two energy states. It was
discovered in 1958 by the German physicist R. L. Mossbauer, who was awarded the Nobel
Prize for this work [ l 11.

Mossbauer spectroscopy is also y-ray (gamma ray) spectroscopy. The gamma rays
are electromagnetic rays. The only difference between gamma rays and X-rays is that the
former comes from the nucleus and is somewhat higher in energy (14.4 keV for 5 7 ~ e ) than
the latter. y-rays are produced by the decay of radioactive elements such as " ~ e ~ 9 or
"9~n50. Under certain conditions of 'recoilless emission', all of this energy change is
transmitted to the emitted y-rays with a highly monochromatic beam of radiation. If a
sample contains similar atoms to the emitter, the y-rays may be absorbed by the same
atoms in the sample. A Mossbauer spectrum is normally produced by varying the energy
of y-rays and measuring the nuclear resonance absorption as a function of energy of y-
rays. I11 practice, the energy of the y-rays is modified by making use of the Doppler effect,
in which the y-ray source is moved at a constant velocity either towards or away from the
sample. This can increase or decrease the energy of the y-rays on a sample. Hence, it
enables the very small energy changes resulting from the hyperfine interactions between
the nucleus and its surrounding electrons to be investigated.
Several types of information may be obtained from Mossbauer spectroscopy. First,
if emitter and sample are identical, the resonant absorption peak occurs when the radiation
source is stationary. Secondly, when the source and the absorbent are not identical, the
absorption peak is shifted, which is called chemical shift (isomer shift), 8. The chemical
shift arises from the columbic interaction of the nuclear charge and the electron charge.
The variation of electron density around the nucleus is closely related to the oxidation
states, coordination numbers and chemical bond character [12].
2.7.2. Quadrupole Splitting and Magnetic Hyperfine Splitting

When the nuclear quadrupole moment appears in an asymmetric electric field
produced by an asymmetric electric charge distribution or ligand arrangement, an electric
quadrupole interaction occurs. This gives rise to a splitting of the nuclear energy level. In
case of "Fe, the excited state, I (spin quantum number) = 312, splits into two substates
characterized by m, (magnetic quantum number) = + % and ml = f 312 in the presence of a
non-zero electric field gradient. This leads to a two-line spectrum and the two lines are
separated by the quadrupole splitting A, as shown in the middle of Fig. 2. 6. A is sensitive
to local structure and oxidation state [12, 131.
When nucleus and spin state are placed in a magnetic field, there is a magnetic
dipole interaction between any nuclear magnetic moment and magnetic field. The
magnetic field arises either from the internal magnetic field produced by the samples or
from an externally applied field. Each nuclear energy level splits into (21 + 1) sublevels.
For isotope "Fe, the excited state I = 312 has four sublevels and the ground state I = !h
splits into two. A total of six-line magnetic hyperfine splitting (nuclear level) can be
obtained according to the selection rule, as shown on the right of Fig. 2.6. Hence, six
possible absorption lines (sextet) appear in a Mossbauer spectrum. The study of hyperfine
splitting, especially as a function of temperature, can provide useful information on
magnetic ordering within the samples.

Bare Isomer shift Quadrupole Magnetic HFS Nucleus HFS (Doublet) (Sextet)
Figure 2.6: Energy level diagram for "Fe showing the origins of the isomer shift, quadrupole hyperfine splitting and magnetic hyperfine splitting. Each of the vertical arrows on the right side between ground and excited states represents a possible absorption line. HFS stands for hyperfine splitting.
2.7.3 Mossbauer Spectroscopic Experimental
Mossbauer measurement system mainly includes a radioactive source containing
the Mossbauer isotope in an excited state and an absorber consisting of the material to be
investigated which contains this same isotope in its ground state. A detector is placed
behind the absorber for collection of the y-rays that is not absorbed by a sample. In our
experiment, the source for " ~ e Mossbauer spectroscopy is radioactive "CO which
undergoes a spontaneous electron capture transition to give a metastable state of " ~ e . It in
turn decays to the ground state through a gamma ray cascade. The energy of Mossbauer

gamma rays is 14.4 keV. Another major component is a device called a multichannel
analyser that can store an accumulated total of y-counts registered by the detection system.
When a given channel is open, only y counts coming at the same velocity from the y-ray
source are accumulated. Therefore, the channel number in practice represents a different y-
ray energy. A Web Research spectrometer in the transmission mode is used in our
Mossbauer spectroscopic measurements in the temperature range of 295 K-4.4 K. The
WMoss (v. 2.5) Mossbauer spectral analysis software is used to fit the experimental data.
The experiments at high temperatures (353 K and 373 K) are carried out by use of a
constant acceleration Hanvell Mossbauer drive. A sample for Mossbauer measurements is
usually prepared in the form of a thin disc or thin layer of powders sandwiched between
the Kapton tapes.
Mossbauer spectroscopy is used in this work to investigate the magnetic properties
and hyperfine interactions of the PFW and PFW-PT solid solution.
2.8 References
[ I ] A. R. West, Busic Solid Stute Chemistry, John Wiley & Sons, Ltd., Chichester (1996)
[2] G. H. Stout and L. H. Jensen, X-ray structure deter~~lirzation, John Wiley & Son,
New York (1989).
[3] Y.-H. Xu, Ferroelectric Materials und Their Applicutioizs. North-Holland, the
Netherlands (1 991).
[4] C. B. Sawyer and C. H. Tower, Phys. Rev. 35,269 (1 930).
[5] J. K. Sinha, J. Sci. Iizstrum. 42,696 (1965).
[6] Y .-H. Bing, PIID thesis, Simon Fraser University (2005).

[7] Dgerential Scatzning Calorinzeter Module Operation Manual, DSC 6200, Seiko
Instruments Inc.
[8] M. E. Brown, Handbook of Tlzerrnal Analysis and Calorimetry, Elsevier
Science B. V . Netherlands, (1998).
[9] W. M. Visscher, Annals of Physics 9, 194 (1 960).
[lo] MPMS User's Manual, Quantum Design, San Diego, (2003).
[ l 11 R. L. Mbssbauer, 2. Physik 151, 124 (1958).
[12] Richard 1. Cohen, Applicutions of Mossbauer Spctroscopy 1, Academic
Press New York, (1 976).

Chapter 3: Synthesis, Structure and Properties of the
(l-x)Pb(Fe213Wl13)03-xPbTi03 [(I-x)PFW-xPT] Solid Solution Ceramics
The following chapter is a revised version of the paper published in Journal of Solid
State Clieniistry 163, 484-490 (2002) by L. Feng and Z.-G. Ye. The use of this article is by
permission of the publisher of Elsevier, Science.
3.1 Introduction
Complex perovskite Pb(Fe2/3WI,3)03 (PFW) exhibits a broad and diffuse
maximum of dielectric permittivity around T, = 180 K with strong frequency dispersion
[I] . Macroscopically, no ferroelectric phase transition occurs upon cooling through T,,.
These properties are characteristic of relaxor ferroelectric behaviour (2-4). PFW shows an
average primitive cubic perovskite structure with ~ r n % group, in which the A-site are
occupied by pb2' ions and the octahedral B-sites positions are filled by ~ e " and w6' ions
at random. On the microscopic scale, polar nanoregions (or clusters) are expected to exist
due to composition fluctuations and partial orderldisorder, which is believed to be the
origin of the relaxor ferroelectric behavior (2-4). On the other hand, PFW contains
paramagnetic ~ e ' ' (3dS) ions on the B-site with an occupancy of 66.7%. Magnetic order
may occur upon cooling while the polar microdomains develop. PFW single crystals
indeed show two antiferromagnetic orderings at T N ~ = 350 K and TN2 = 20 K,
respectively [ 5 ] . The former was supposed to result from the magnetic interactions via the
superexchange pathway, -~e'+- 0 - ~e"-, within the disordered local clusters, and the

latter would arise from the - ~ e ~ + - 0 -W - 0 - ~ e ~ + - superexchange pathway within the
ordered microdomains [5]. The magnetic and dipolar interactions in PFW are expected to
give rise to some peculiar properties in this relaxor.
It was known that the synthesis of pure PFW is difficult because of the formation
of other non-ferroelectric phases, such as pyrochlore Pb2FeW06..5, PbW04, and Pb2W05.
Almost-pure polycrystalline PFW was prepared using the columbite/wolframite precursor
method [6], with improved dielectric properties compared with the samples prepared by
the conventional mixed-oxide method [7, 81, in which lead tungsten oxide second phases
(PbW05 and Pb2W05) seemed to be present in a remarkable amount. In the columbite
process, direct reaction between the B-site metal oxides and PbO is basically prohibited
at the early stage, preventing the formation of the pyrochlore-type phase.
When PFW forms multicomponent systems with other ferroelectrics, the materials
exhibit excellent multifunctional properties due to an improvement of dielectric
properties, a higher Curie temperature, and a lower firing temperature [9-111. Therefore,
PFW has been known as a promising material for a multilayered ceramic capacitor [ l l ] .
Among the binary systems, Pb(Fe2l3WlI3)O3-PbTi03 (PFW-PT) is of particular interest.
PFW is a relaxor ferroelectric and antiferromagnet, while PbTi03 is a typical ferroelectric
with a sharp maximum of dielectric constant at Tc = 763 K. It is possible to move the
Curie temperature to around room temperature and to modify the relaxation behavior by
choosing an appropriate amount of PT in the system. Some results were reported on the
preparation of the PFW and the PFW-PT ceramics at high temperature using additives or
columbite method [6, 91. It is found that the relaxor ferroelectric behaviour attenuates

with the increase of the PT content. But systematic studies of the PFW-PT system in
terms of phase transitions and dielectric and magnetic properties are still lacking.
In the present work, an improved B-site precursor method is developed to
synthesize a highly pure perovskite phase of (1-x)PFW-xPT. The phase formation and the
structural parameters are characterized by X-ray diffraction. Phase transitions and the
related properties are studied by differential scanning calorimetry and dielectric
measurements.
3.2 Experimental
A modified B-site precursor method (12-15) was adopted for the synthesis of (1-
x)PFW-xPT , with various compositions, x = 0, 0.10, 0.20, 0.25, 0.30, 0.325, 0.35, 0.40,
0.60, and 0.80. It consists of a two-step reaction process taking place sequentially. In the
first step, an intermediate (or precursor) phase or a mixture of phases was formed by
means of reacting the oxides of the B-site elements. In the second step, the B-site
precursor phase was reacted with the other (A-site) reactant to form the complex
perovskite phase. When the intermediate phase has a columbite structure, such as
MgNb206, the B-site precursor method can be referred to as the so-called "columbite
method" [12].
Fe203 (99.99%, Alfa) and W03 (99.9%, Alfa) were mixed in a mole ratio of 1:1
and finely ground in acetone media for 4 hours, and then dried and preheated at 1000 OC
for 2 hours to form Fe2W06. Afterward, PbO (99.99%, GFS Chemicals) or a mixture of
PbO and TiOz (99.99%, Aldrich) was mixed with Fe2W06 in a stoichiometric ratio and
finely ground in acetone media for 4 hours. The mixture was initially calcined at 800 OC

for 2 hours, reground, and pressed into a pellet with a weight of 2.3 g-2.5 g. This pellet
was finally sintered at 850 OC-890 OC for 2-3 hours. With the increase of PT component,
the sintering temperature was increased slightly. Figure 3.1 is a diagram of a Muffle
furnace for the preparation of the PFW-PT ceramics. The temperature ramps were
controlled at 5 OClmin for heating and 2 'Clmin for cooling (to 700 OC), followed by a
final cooling to room temperature at 250 "Clh. PFW and PFW-PT compounds were
formed according to the following solid state reactions:
Since the Fe2W06 phase was presynthesized, the direct reactions between PbO
and W 0 3 can be avoided in the B-site precursor method. Therefore, subsequent formation
of the pyrochlore Pb2FeW06.s phase will be suppressed in the final reaction.
Phase analysis and structural refinement of the (1-x)PFW-xPT system were
performed based on powder X-ray diffraction measurement (Philips X-ray diffractometer,
CuKa radiation, h = 1.541 8 A) .

I PI plate 1
Figure 3.1: Schematic diagram of the set-up for the preparation of the (1-x)PFW- xPT ceramics at high temperature.
The thermal analysis was performed using a Seiko ExStar DSC 6200 apparatus
for the (I-x)PFW-xPT ceramic sample. All the DSC runs were performed under flowing
nitrogen gas using alumina powder (20-30 mg) as reference. The sample with 30-40 mg
was first heated at 20 OCImin to 600 K to eliminate any adsorbed H 2 0 traces, and then
cooled to 170 K, followed by heating to 500 K at a coolindheating rate of 10 OClmin.
The ceramic pellet was properly polished into a sample with a size of -41 0 x 1.0
mm3. Silver paste was put on top and bottom surfaces of the sample that forms
electrodes. The ceramic electrode was dried at 150 OC in oven for 2 hours before
measurements. Complex dielectric permittivity of the (I-x)PFW-xPT ceramics was
measured as a function of temperature at frequencies f = 1, 10, and 100 kHz, under
isothermal conditions. The measurements were carried out upon heating from 100 to 600
K at the temperature intervals of 3-5 degrees by means of a computer-controlled

impedance analyzer (Solartron 1260) associated with a dielectric interface (Solartron
1296).
3.3 Phase Analysis and Structural Refinement
Figure 3.2 shows the XRD patterns of Fe2W06 before and after calcining, as well
as the diffraction patterns of ZnTa206 (tri-aPb02 structure) [16] and MgNb2o6
(columbite structure) [I71 as references. From the comparison of Fig.3.2b with Fig. 3.2c,
it can be seen that Fe2W06 obtained as the B-site precursor compound B2'Bn06,
crystallizes in a tri-aPbOz type structure, rather than in a columbite-type structure as
reported in Ref. [6] . The two structures can be distinguished from each other according to
the XRD patterns given in Fig. 3 . 2 ~ and 2d.
Figure 3.2: X-ray diffraction patterns of (a) Fe2WO6 before firing; (b) Fe2Wo6 after firing at 1000 "C for 2 h; (c) ZnTa206 of tri-aPb02 structure; and (d) MgNb206 of columbite structure [17].

Identification and analysis of the perovskite phase with regard to the undesirable
pyrochlore phase was carried out after the final reaction. The content of pyrochlore phase
in the products was calculated according to the following equation [18],
Pyrochlore content (%) = {Ip,,(222)/[I,,,(222) + Iperov(l 1 O)]) x 100, [3-31
where I,,,(222) is the intensity of the (222) reflection peak of the pyrochlore phase and
Ip,,,,(l 10) is the intensity of the (1 10) peak of the perovskite phase. Figure 3.3 shows the
XRD patterns of the PFW samples prepared at 800 OC for 2 h (a) and sintered at 890 "C
(b). A nearly pure PFW phase was formed after calcinations (with the pyrochlore content
below the detectable limit) and a highly pure PFW product was obtained after sintering.
These results show an improvement in the preparation of pure PFW by the B-site
precursor technique, compared with the conventional mixed-oxide method (1 0, 19,20).
(a ) P F W fired a t 8 0 0 OC
I
(b ) P F W fired
28 (deg.)
Figure 3.3: X-ray diffraction patterns of (a) PFW powder after calcining at 800 "C and (b) PFW ceramics after sintering at 890 O C ,
both showing the perovskite phase.

The XRD patterns of various compositions of (1-x)PFW-xPT (x = 0 to 0.80) are
presented in Fig. 3.4. The compounds of 0 I x I 0.25 show a cubic perovskite structure at
room temperature. When the PT content, x, is increased to higher than 0.25, the
diffraction peaks (loo), (200), and (21 1) start splitting. With further increase of x, the
splitting becomes more and more significant for all the indexed peaks except for the
(1 1 I), indicating that (1 -x)PFW-xPT gradually transforms from a pseudocubic perovskite
structure into a tetragonal structure.
Figure 3.4: X-ray diffractograms for various compositions of the (1-x)PFW-xPT system at room temperature, showing a tetragonal splitting for x > 0.25.

The lattice parameters of (1-x)PFW-xPT were refined in the cubic in% and/or
tetragonal P4min phase. Figure 3.5 shows the variation of the lattice parameters as a
function of PT content. The parameter a of the cubic perovskite phase decreases slightly
from 3.9909 A to 3.9734 A with the increase of x from 0 to 0.2. Such a variation can be
attributed to the substitution of the smaller ~ i ~ ' ions (r = 0.605 A) for the ~e~~ ions (r =
0.645 A) on the B-site, while w6+ (r = 0.60 A) has almost the same size as ~ i ~ + [21]. At x
= 0.40, the tetragonal symmetry can be monitored with a clear split of the parameters, a =
3.9357 A and c = 4.0433 A. With further increase of x from 0.4 to 1.0, a continues to
decrease slightly while c increases more pronouncedly. Accordingly, the c/a ratio
augments from 1.0273 (for x = 0.4) to 1 .O65 1 (for x = 1.0), indicating an increase of
4.3 Parameter a
4.2 -
Figure 3.5: Variation of the pseudocubic (a) and tetragonal (a and c) lattice parameters with x for (1-x)PFW-xPT at room temperature. Solid lines indicate the data trend for visual reference only.

tetragonality (Fig. 3.6). The compositions of x = 0.30-0.35 show a very small split
between a and c, and a c/a ratio close to 1, indicating the onset of tetragonal distortion
from the cubic symmetry.
The corresponding volume change versus PT content is also presented in Fig. 3.6.
The volume of the cubic phase decreases from 63.56 A3 to 62.73 A' with x increasing
from 0 to 0.2. The volume of the tetragonal phase increases slightly from 62.60 A3 (for x
= 0.4) to 63.15 A3 (for x = 1.0), suggesting that the size effect of ~ i ~ + ions is
predominated by the tetragonal distortion of the unit cell. For x = 0.25 to 0.35, an
irregular variation of lattice volume is observed, suggesting that both the cubic and the
tetragonal phases may coexist within that composition range at room temperature.
Figure 3.6: Variation of the pseudocubic and tetragonal unit cell volume and the tetragonality c/a as a function of Ti content in (1-x)PFW-xPT. Solid lines indicate the data trend for visual reference only.

3.4 Differential Scanning Calorimetry (DSC) Measurements
Differential scanning calorimetry (DSC) was carried out to analyze the phase
transition in the (1-x)PFW-xPT ceramic system, in which a morphotropic phase boundary
(MPB) is expected. Figure 3.7 shows some DSC results. Upon heating, two endothermic
peaks occur at 250 and 281 K, 240 and 3 1 1 K, and 21 0 and 342 K, respectively, for each
of the compositions x = 0.25, 0.30, and 0.35. The low-temperature thermal event
indicates the morphotropic phase boundary from the low-temperature phase to the
tetragonal phase at TMPB, and the high-temperature peak shows the tetragonal to cubic
phase transition at Tc. Therefore, the morphotropic phase boundary of (1-x)PFW-xPT is
localized in the composition range of 0.25 I x I 0.35.
(a) 0.75PFW-0.25PT 1 I . I . I . I . 1 . 1 . I . I . I 00 150 200 250 300 350 400 450 500
Temperature (K)
Figure 3.7: DSC scanning curves upon heating for (a) 0.75PFW-0.25PT, (b) 0.70PFW-0.30PT, and (c) 0.65PFW-0.35PT.

3.5 Dielectric Properties
The temperature and frequency dependences of the real part of dielectric
permittivity are presented in Fig. 3.8 for different compositions. Ln Fig. 3.8a, PFW
displays a broad and diffuse maximum of dielectric constant with strong frequency
dispersion, demonstrating a typical relaxor ferroelectric in the system. The temperature of
permittivity maximum T, varies from 181 K at 1 kHz to 197 K at 100 kHz. The
maximum value of the dielectric constant decreases with increasing frequency. The
dielectric dispersion below Tc reflects typical relaxor ferroelectric behavior arising from
the responses of polar microdomains (relaxators) with a spectrum of relaxation time [2-
41. Since the relaxation appears at low temperature (<I81 K), the contribution of mobile
charges is not significant. In the high-temperature paraelectric phase (T > T,), another
frequency dispersion appears, which is particularly significant at low frequencies. Such a
low-frequency dispersion (LFD) can be attributed to the conductivity effects due to
slowly mobile electronic charges. These charges arise from the Fe3+ ions (d5), which are
usually combined with Fe2+ ions to fornl charge defects. Electrons hopping between
~e '+and ~ e ~ + ions would result in the conductivity, which in turn gives rise to dielectric
dispersion, more remarkable at lower frequencies, as shown in Fig. 3.8a. The LFD was
also observed in other relaxor ferroelectric systems, such as Pb(MglnNbzn)03-PbTi03,
where the contribution to the electronic conduction comes from structural defects [3].
The reason the LFD is more significant in the high-temperature phase is two-fold. First,
the paraelectric phase of PFW-PT has a disordered cubic perovskite structure like PFW
[5], with the ~ e " , w6+, and ~ i ' ' ions statistically distributed on the B-sites. This provides
a relatively short ~ e ~ + - ~ e ~ ' distance, favouring the electron hopping between the two

ions. Second, the LFD appears more significantly in the high-temperature range (>250
K), where thermal activation enhances the electric conduction and hence results in the
frequency dispersion.
8000- TerPerah.e(N Tenperatue (4 (C) 075PFW - 0.257 8x0. ( q a 7 m - 0 . m
c. t m w
c 6000- +low+ i;.
m c. -A- 1 Id+ A m I 1
8 m- f llr 8 0 'TV. .- L c. 0 ,+it '. - 0 2003-
a, - Q
6 m - 5
Figure 3.8: Temperature dependences of the real part of dielectric permittivity at frequencies f = 1, 10, and 100 kHz for various compositions: (a) PFW, (b) 0.90PFW-O.lOPT, (c) 0.75PFW-0.25PT, (d) 0.70PFW-0.30PT, (e) 0.65PFW-0.35PT, and (f) 0.40PFW-0.60PT.

With the increase of PT content, the low-temperature dielectric dispersion (i.e.,
the relaxor relaxation below Tc) is significantly attenuated. The dielectric properties of
0.75PFW-0.25PT are shown in Fig. 3.8c, where no significant relaxation appears around
and below Tc = 288 K, indicating that the substitution of ~ i ~ + for ( ~ e z / 3 ~ 1 1 3 ) ~ + has
induced a transformation from the relaxor regime in PFW toward a long-range (normal)
ferroelectric state. The dielectric permittivity of 0.70PFW-0.30PT shows nondispersive
peaks at Tc = 320 K, corresponding to the ferro- to paraelelctric phase transition (Fig.
3.8d). Tc further increases to 350 K and 500 K for x = 0.35 (Fig. 3.8e) and 0.60 (Fig.
3.80, respectively.
For the compositions around the morphotropic phase boundary, x = 0.25-0.35, in
contrast to the DSC measurements in which the morphotropic phase transition has been
clearly detected with TMPB varying from 250 K to 21 0 K, the temperature dependence of
the dielectric constant (Fig. 3.8~-e) show only weak or broad anomalies around TMPB.
This phenomenon can be understood on the basis of the fact that the MPB transition
occurs between two polar (and ferroelectric) phases, and therefore involves relatively
weak structural instability and small net polarization changes compared with the ferro-
lparaelectric transition at Tc. As a result, the dielectric measurements usually show weak
effects for the MPB transition. This behaviour was also observed in the other relaxor-
based solid solution systems with MPB, such as Pb(Mgl~3Nb2/3)03-PbTi03 [22] and
Pb(Znl13Nb213)03-PbTi03 [23], in which the MPB transition appears as a weak and broad
dielectric anomaly, while it can be clearly detected as a first-order transition by optical
domain studies [24] or by DSC measurements (with appearance of latent heat) [25].

Therefore, thermal analysis by DSC is more sensitive for detecting the morphotropic
phase transition in the PFW-PT system.
3.6 Morphotropic Phase Diagram of the PFW-PT Binary System
Based on the results of XRD, DSC, and dielectric measurements, a ferroelectric
phase diagram for the (1-x)PFW-xPT binary system has been established, as shown in
Fig. 3.9. It indicates the phase boundaries and phase transition temperatures of the solid
solution system. Up and down triangles represent the transition temperatures detected by
DSC analysis and the filled and open circles correspond to the phase transition
temperatures obtained from the dielectric measurements. The Curie temperature increases
almost linearly with the increase of PT content x, from T, = 18 1 K for PFW to Tc = 763
K for PT. The symmetry of the low-temperature ferroelectric phase with a small PT
content can be refined in a pseudocubic symmetry with a slight rhombohedral R3m
distortion, as in the case of Pb(Zn1/3Nb2/3)03-PT [26] and Pb(MglnNbzI,)O3-PT [27]
systems. For example, the edge and angle of the unit cell are individually 3.989 A and
90.064 O for 0.80PFW-0.20PT, and 3.978 A and 89.976" for 0.75PFW-0.25PT at room
temperature according to the rhombohedral-hexagonal transformation to the XRD
measurement results [28]. A cubic perovskite structure appears above the Curie
temperature line. At room temperature, the cubic phase transforms into the tetragonal
phase at a PT content of about 25%. The cubic and tetragonal phases coexist for the
compositions around the phase boundary, as shown by the anomalies in the variations of
lattice parameters and volume (Figs. 3.5 and 3.6). Below the Tc line, the ferroelectric
rhombohedral and tetragonal phases are separated by a morphotropic phase boundary
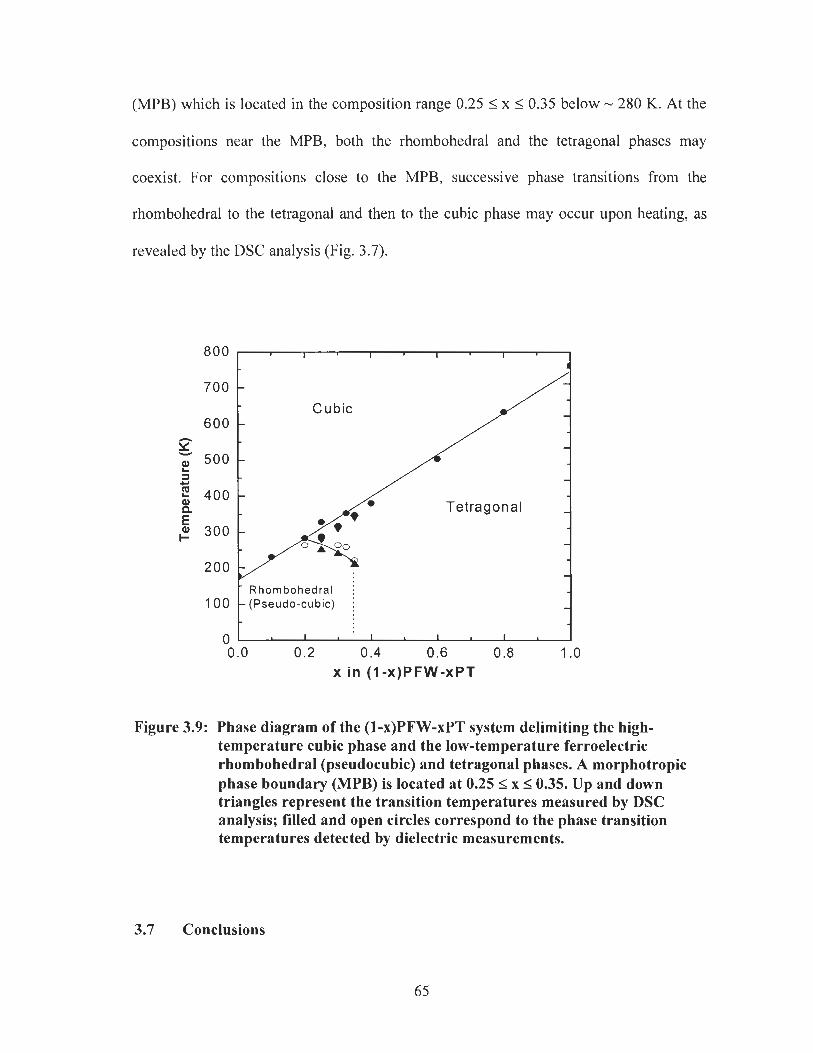
(MPB) which is located in the composition range 0.25 I x I 0.35 below - 280 K. At the
compositions near the MPB, both the rhombohedral and the tetragonal phases may
coexist. For compositions close to the MPB, successive phase transitions from the
rhombohedral to the tetragonal and then to the cubic phase may occur upon heating, as
revealed by the DSC analysis (Fig. 3.7).
Figure 3.9: Phase diagram of the (1-x)PFW-xPT system delimiting the high- temperature cubic phase and the low-temperature ferroelectric rhombohedral (pseudocubic) and tetragonal phases. A morphotropic phase boundary (MPB) is located a t 0.25 I x I 0 . 3 5 . Up and down triangles represent the transition temperatures measured by DSC analysis; filled and open circles correspond to the phase transition temperatures detected by dielectric measurements.
800 I I I I
700 -
A s - 2 500 - 3 C,
- 2 400 - d Tetragonal E
- 300 - I- -
-
3.7 Conclusions
100 - Rhombohedra1 I - (Pseudo-cubic) i -
0 I I I I
0.0 0.2 0.4 0.6 0.8 1 .O x in (I-x)PFW-xPT

A modified B-site precursor method, which consists of forming the tri-aPb02-
type Fe2W06 phase prior to final reactions with PbO or (PbO + Ti02), has been
developed to prepare a pure and complete solid solution system of (I-x)PFW-xPT. The
structural refinements based on X-ray diffractograms at room temperature indicate that
the perovskite (1-x)PFW-xPT transitions from a cubic phase to a tetragonal phase at a PT
content of x 2 0.25, where a splitting of the cubic lattice parameter a into the tetragonal
parameters a and c.
The temperature dependences of the dielectric permittivity at various frequencies
have revealed that the ferroelectric phase transition temperature Tc increases with the
increasing content on the B-site, while the relaxor ferroelectric behaviour of PFW is
gradually transformed into a normal (long-range) ferroelectric state, as evidenced by the
sharp and nondispersive dielectric permittivity peaks around Tc for x 2 0.25. For the
compositions 0.25 I x 1 0.35, the DSC analyses have revealed a low-temperature phase
transition at TMPB which is related to the existence of a morphotropic phase boundary, in
addition to the high-temperature ferro-lparaelectric phase transition at Tc.
A complete phase diagram for the (1-x)PFW-xPT system has been established,
which delimits a high-temperature paraelectric cubic phase, a ferroelectric rhombohedral
(pseudocubic) phase, and a ferroelectric tetragonal (p4mrn) phase. The morphotropic
phase boundary is located at 0.25 I x 1 0.35, which separates the rhombohedral (pseudo-
cubic) phase from the tetragonal phase. PFW-PT compositions within the MPB range
exhibit successive phase transitions from the rhombohedral to a tetragonal, and then to a
cubic phase upon heating. Such a phase diagram is of relevance to further investigation

and understanding of the magnetic, dielectric, and magnetoelectric properties of the
PFW-PT system.
3.8 References
[I] Z.-G. Ye and H. Schmid, Ferroelectrics 162, 1 19 (1 994).
[2] L. E. Cross, Ferroelectrics 76,241 (1987).
[3] L. E. Cross, Ferroelectrics 151,305 (1 994).
[4] Z.-G. Ye, Key Eng. Mater. 155 - 156, 81 (1998).
[5] Z.-G. Ye, K. Toda, M. Sato, E. Kita and H. Schmid, J. Korean Phys. Soc. 32,
S 1028 (1 998).
[GI L. Zhou, P. M. Vilarinho and J. L. Baptista, J. Mater. Sci. 33, 2673 (1998).
[7] P. M. Vilarinho, J. L. Baptista, J. Eur. Ceranz. Soc. 11, 407 (1993).
[8] C. H. Lu, N. Ishizawa, K. Shinozaki, N. Mizutani, M. Kato, J. Mat. Sci. Lett. 7,
1078 (1988).
[9] Y. -J. Kim and S.-W. Choi, Ferroelectrics 186,287 (1996).
[lo] M. Yonezawa, Am. Ceram. Soc. Bull. 62, 1375 (1983).
[1 1] T. R. Shrout and A. Halliyal, Anz. Ceranl. Soc. Bull. 66(4), 704 (1987).
[12] S. L. Swartz, T. R. Shrout, Mater. Res. Bull. 17, 1245 (19821.
[13] A. Halliyal, U. Kumar, R. E. Newhnam, and L. Cross, Am. Ceram. Soc. Bull. 66,
671 (1987).
[14] B.-H. Lee, N.-K. Kim, J.-J. kim, and S.-H. Cho, Ferroelectrics 211,233 (1998).
[15] M. -C. Cae, S. -M. Lim, and N. K. Kim, Ferroelectrics 242,25 (2000).

[16] Wong-ng, H. McMurdie, B. Paretzkin, C. Hubbard, and A. Dragoo, JCPDS-ICDD
File #39-1484 [powder Diffraction 3, 121 (1 998)]
[17] C. Roob and McCarthy, JCPDS-ICDD File #33-875.
[I 81 G. Drazic, M. Trontelj, and D. Kolar, Mater. Sci. Eng. B26, 189 (1 994).
1191 G. A. Smolenskii, A. I. Agranovskaya, V. A. Isupov, Sov. Phys. Sol. State 1,907
(1 959).
[20] M. Yonezawa and T. Ohno, "Proceedings of the Japanese Study Seminar on
Dielectric and Piezoelectric Ceramics," T-8, 1 (1 982).
[21] R. D. Shannon, Acta. Crystallogr A32 75 1 (1 976).
[22] S.W. Choi, T. R. Shrout, S. J. Jang, and A. S. Bhalla, Mater. Lett. 8,253 (1989).
[23] L. Zhang, M. Dong, and Z.-G. Ye, Mater, Sci. Eng. B78, 96 (2000).
[24] Z.-G. Ye and M. Dong, J. Appl. Phys. 87,2312 (2000).
[25] M. Mendoza and Z.-G. Ye, unpublished.
[26] J. Kuwata and K. Uchino, and S. Nomura, Jpn. J. Appl. Phys. 21, 1298 (1982).
[27] T. R. Shrout, Z. P. Chang, N. Kim, and S. Markgra, Ferroelectrics Lett. 12,63
(1 990).
[28] B. D. Cullity, Elements of X-Ray Diffraction, Addision-Wesley Publishing
Company, Inc. Reading, USA (1 956).

Chapter 4:
Electrical Microstructure and Properties of Relaxor Perroelectric Pb(FeznWIn)O3-PbTi03 Solid Solution System
4.1 Introduction
Complex perovskite Pb(FeznWlI3)O3 [PFW] is a typical relaxor ferroelectric
material exhibiting a broad and diffuse maximum of dielectric permittivity with strong
frequency dispersion [ l , 21. PFW-based multi-component systems show excellent multi-
functional properties due to an improvement of dielectric properties, a higher Curie
temperature, and a low firing temperature [3, 41. Therefore, PFW has been known as a
promising material for multilayered ceramic capacitors [5].
The previous studies on PFW single crystals indicated that PFW indeed exhibits
relaxor fen-oelectric behaviour with the temperature of dielectric permittivity maximum
around T,,, = 180 K. Two types of magnetic interactions via (i) - F ~ ~ + - o - F ~ ~ + - and (ii) -
F~~+-o-w-o-F~~+- were suggested to take place at the temperatures TN1 = 350 K and
TN2 = 20 K, respectively [6]. In recent years, the solid solution of Pb(FeznWlI3)O3 -
PbTi03 (PFW-PT) has been given considerable attention. PFW has a disordered structure
on the octahedral B-site of the perovskite that are occupied by ~ e ~ + and w6+ ions at
random, which results in the presence of polar nanoregions giving rise to the ferroelectric
relaxation [7]. PbTi03 is a typical fen-oelectric compound with a sharp peak in the
dielectric constant at the paraelectric/ferroelectric phase transition temperature Tc=763 K.
The relaxor ferroelectric behaviour of PFW can be modified by the addition of the PT

content in the PFW-PT solid solution, as shown in Chapter 3. Up to now, systematic
studies of PFW-PT system have been missing. No detailed information on the effects of
microstructural phases on the electrical properties has been reported in the binary system
PI. Ac impedance spectroscopic technique has been applied to measure and analyze
the electrical properties of materials in many fields, such as solid electrolytes [9],
batteries [lo], as well as most of electrochemical reaction processes. West et al. [ l l , 121
and Macdonald et ul. [13] reported the impedance spectroscopic analysis of a number of
electroceramics (polycrystalline material with useful electronic properties), such as
Ca12A114033 and BaTiO,. This powerful method can characterize resistive (resistance)
and reactive (capacitance and inductance) properties of electroceramic systems. In
particular, it can be applied for distinguishing the electrical responses of each
microstructural component or phases (electrode, grain boundary, grain bulk, etc.)
according to their different electrical relaxation times andlor time constants (product of
resistance and capacitance), and for indicating whether or not the overall conductance of
the system is dominated by an individual phase (component) at different temperatures.
Sakurai et al. [14] investigated the ac impedance spectroscopy of the PFW ceramics at
room temperature. A simple equivalent electric circuit composed of resistance and
capacitance of grain and grain boundary phases was presented to simulate the impedance
spectra of the ceramics. The impedance analysis of the multi-component system
P~(Z~II~N~~,~)O~-P~(F~~I~WII~)O~-P~(F~~I~N~II~)O~ [PZN-PFW-PFN] was reported by
Drazic et nl. [8]. However, so far, no detailed impedance spectroscopic measurements
combined with electric modulus formalism analysis on the PFW and PFW-PT
polycrystalline ceramics have been reported.
In the previous chapter, highly pure peroviskite compounds of the (I-x)PFW -
xPT solid solution were synthesized by an improved B-site precursor method and
characterized by X-ray diffraction. In this chapter, ac impedance spectroscopic
measurements of the ceramic system are carried out at different temperatures and
frequencies. The relationships among microstructure, composition, and electrical
properties have been analyzed and discussed based on the combined complex impedance
and electrical modulus spectra.
4.2 Principles of Electric Analysis of Dielectric Ceramics
4.2.1 Impedance and Electrical Modulus Principles
When a small sine-wave signal, V(t) = V,,sin(ot), where o (= 27cj) is the angular
frequency and V, is the magnitude of voltage V, is applied to a material system, a steady
state current I(t) = I,sin(ot + 0) is generated. Here I, is the magnitude of current I and 0
is the phase difference between the voltage and the current (0 = 0 when the system is a
pure resistor). The complex impedance (Z*) of a system can be defined as [13]
z * = V(t) I I(t) 7 (4.1)
and its magnitude:
Z m = V n l / I m . (4.2)
In a pure resistance system, the impedance Z* = R is a constant. If the system is a pure
capacitor, the impedance Z* = -jlmC, where C is capacitance and imaginary number j =

4-1. In this case, 0 is not equal to 0 and the impedance Z* is frequency dependent. When
a system is a parallel circuit composed of resistor and capacitor (parallel RC element), as
shown in Fig. 4.1, the total impedance is given as follows:
2 2 2 Z* = ( l / ~ + j w c ) - ' = R/(l+w C R ) - ~ ~ c R ~ / ( ~ + w ~ c ~ R ~ ) = Z' - jZ9' , (4.3)
2 2 2 with Z' = R/(l+w C R ) and (4.4)
2 2 2 Z" = W C R ~ / ( ~ + W c R ) , (4.5)
where Z' and 2" are real and imaginary parts of the impedance, respectively. The
magnitude of the impedance is 1Zl = ( z ' ~ + z " ~ ) " ~ . In addition, a circle equation can be
deduced from Equations 4.4 and 4.5:
Figure 4.1: (a) Parallel RC circuit and (b) the corresponding ac impedance spectrum. Arrow indicates the direction of increasing frequency.
The corresponding impedance spectrum is a semicircle, as a function of frequency V), as
shown in Fig. 4. lb. In impedance experiments, the frequency applied is often in the range
of lo-* - 10 HZ. It is easily found that the resistance can be obtained from the intercept
on the real axis (Z' axis) at low frequency. In practice, it is equal to the diameter of the
semicircle curve. By solving the differentiation equation dZ"1dZ' = 0, a relationship
between the frequency at maximal imaginary, o,,,, and time constant, RC, can be
obtained:
oma,RC= 1 . (4.7)
Therefore, the resistance and capacitance can be obtained by analyzing the impedance
spectrum. The time constant (RC), which is independent of the sample geometry, and the
frequency (f,,,), are the two characteristic parameters to each semicircle. When an
impedance spectrum is composed of a distorted semicircle due to the overlap of
semicircles with similar time constants, it is difficult to get the numerical solution for
each semicircle in the impedance spectrum. Hence, electric modulus analysis has to be
applied in such complicated systems.
The complex electric modulus M* is defined as [12]:
M* = jroCZ* , (4.8)
M* = M1-jM" , (4.9)
where C, is the vacuum capacitance of the measuring cell electrodes with an air gap in
place of the sample, C, = ~ d k , where E, is the permittivity of free space (8.854 x 1 0 ' ' ~
F/cm), and k = I / A , is the cell constant where I is the thickness and A is the area. M' and
M" are real part and imaginary part of the modulus, respectively. The modulus
spectroscopy can give most emphasis to those elements with the smallest capacitance,

whereas impedance plots highlight those with the largest resistance. The combination of
impedance and modulus analyses can effectively reveal the electrical features of each
component (phase) in a complex electroceramic system.
In order to clearly analyze and interpret the impedance spectrum of a
polycrystalline material system, it is necessary to have an equivalent circuit model that
simulates the electrical properties of the spectrum. Each semicircle in impedance or
modulus spectrum can be described by a parallel RC element in the circuit. Each parallel
RC element is contributed by individual phase component (electrode, grain boundary,
grain bulk, etc.) in the ceramic system. Therefore, a complicated impedance spectrum can
be represented by a simple equivalent circuit, from which the electrical contributions to
the system from each microstructural phase can be clearly depicted.
4.2.2 Microstructural Phase Model for Polycrystalline Ceramics
In polycrystalline ceramic systems, the microstructure is not uniform in local area
and consists mainly of grain and grain boundary phases (and possibly very small amount
of impurities). Each component (phase) makes an individual contribution to the total
electrical properties of the ceramic system. Some conduction models have been proposed
for the simulation of the electrical properties in electro-ceramic materials [13] based on
different equivalent circuit diagrams, correlating the microstructure of the sample and its
impedance spectra. One of them is the "series layer model" that is composed of two
phases (grain and grain boundary) to be stacked in layers parallel to the measuring
electrodes in the system. This model is equivalent to an electrical circuit with two parallel
RC elements connected in series, as shown in Fig. 4.2(a). The impedance spectrum of the

series model usually consists of two semicircles in the complex impedance plane. Figure
4.2(b) shows the equivalent electrical circuit for the "parallel layer model", in which the
layers of two different phases are stacked across the electrodes. It often shows only one
relaxation (i.e. one semicircle in impedance spectrum). The third model termed the "brick
layer model" (Fig. 4 . 2 ~ ) treats the ceramic microstructure as an array of cubic-shaped
grains (bricks), separated by thin grain boundaries. In this model two current paths are
possible. One is through the grains and across grain boundaries, and the other along
grains boundaries. When the conductivity of grains is much larger than that of grain
boundaries, the conduction passes predominantly through the grains and across grain
boundaries. The circuit is equivalent to that of the "series layer model", and two
semicircles appear in the impedance spectrum. If the conductivity of grain boundaries is
higher than the conductivity of grains, the circuit is equivalent to the circuit of the
"parallel layer model", and one semicircle often appears in the impedance spectrum.
Electrode I
Electrode

Bulk (Grains) phase
i Grain boundary phase
Figure 4.2: Various models for the ceramics with two-phase components. (a) "Series layer model" and the corresponding equivalent electrical circuit; (b) "Parallel layer model" and the associated equivalent circuit; and (c) " Brick layer model".
4.3. Experimental
A B-site precursor method consisting of a two-step reaction process was used for
the preparation of the (1-x)PFW-xPT ceramics. A more detailed description can be found
in Chapter 3.
Starting chemicals Fe203 (>99.9%, Alfa) and W 0 3 (99.8%, Alfa) were mixed in a
molar ratio of 1: 1 and ground in the presence of acetone for 4 hours. A reaction was
carried out at 1000 O C for 2 hours to form an intermediate compound of Fe2Wo6,
according to reaction (4.10). It has been found by XRD analysis that Fe2W06 shows a tri-
a P b 0 2 -type structure of the B'BW2O6 formula, resembling a perovskite phase [IS]:
In the second step, the intermediate phase Fe2W06 was mixed with PbO in a
stoichiometric ratio based on the following reactions:
The mixture was ground in the presence of acetone for 4 hours, and initially calcinated at
800 "C for 2 hours, then reground and finally sintered at 850 "C - 890 "C for 2-3 hours.
With the increase of PT content in PFW-PT, the firing temperature increases slightly. The
heating and cooling rates were controlled at 5 "Clmin and 2 "Clmin, respectively.
Since the Fe2WO6 phase was made in the first reaction (4.10), direct chemical
reaction between PbO and W 0 3 in the second reaction (4.1 1) or (4.12) has been mostly
prevented, which would result in the formation of undesirable second phases, like PbW04
and Pb2FeW06,s phase [15]. Therefore, this B-site precursor method shows advantage in
the preparation of pure PFW and PFW-PT compounds over the conventional direct
mixed-oxide methods [16-181.
The ac impedance measurements of (1-x)PFW-xPT were carried out on a
Solartron 1260 impedance analyzer combined with a Solartron 1296 dielectric interface,
in the frequency range of 1 Hz to 1 MHz. The ceramic sample, with a size of 10
(diameter) x 1.0 (thickness) mm2, was polished and painted with silver paste on both
sides of the disk as electrodes. The sample was then dried at 160 OC for 2 hours before the
impedance measurements in the temperature range of 100 - 600 K.

4.4 Results and Discussion
4.4.1 XRD Patterns
XRD patterns for the ceramic samples of (I-x)PFW-xPT (x = 0 to 0.8) are
presented in Figure 4.3. It is found that PFW shows a pseudo-cubic perovskite structure
at room temperature. When the PT content is increased to x = 0.25, the peaks (100) and
(21 1) show a tendency to split, indicating the onset of phase transition from the pseudo-
cubic to a tetragonal phase. With the further increase of PT content, all peaks, except
peak (1 1 I), split, which clearly illustrates the composition (PT component) dependences
of the perovskite structure.
Figure 4.3: X-ray diffraction patterns for the various compositions of the (1-x)PFW-xPT ceramics at room temperature.
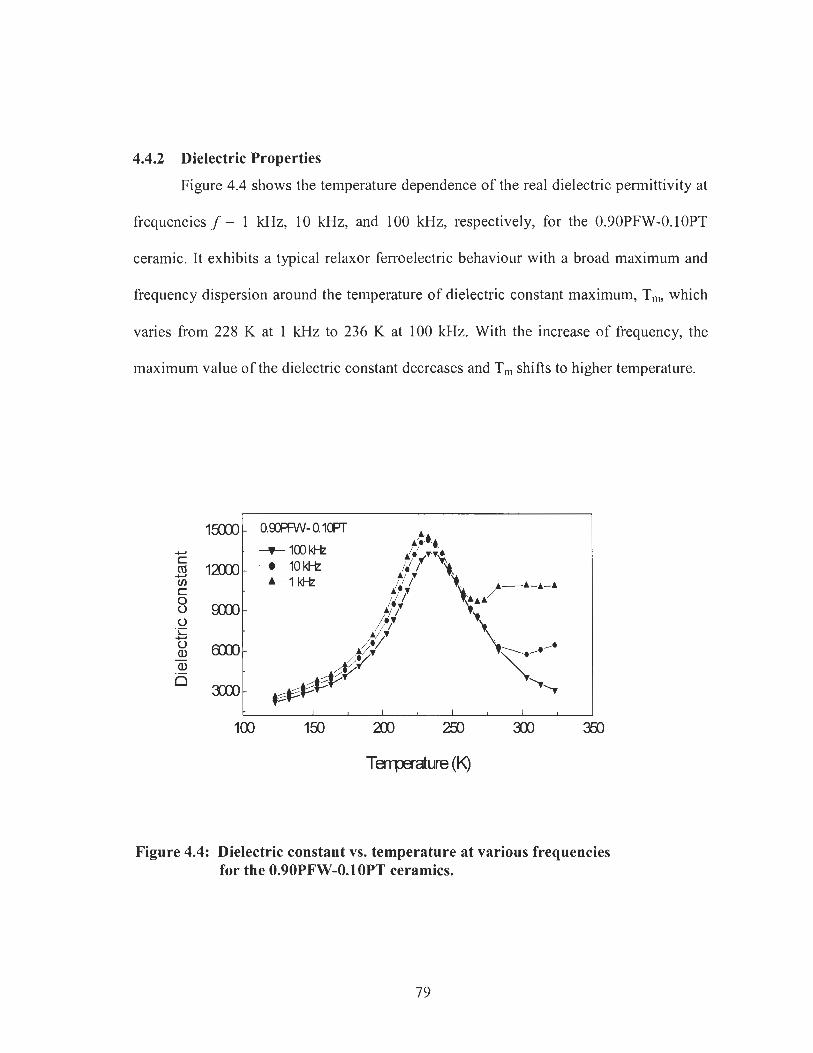
4.4.2 Dielectric Properties
Figure 4.4 shows the temperature dependence of the real dielectric permittivity at
frequencies f = 1 kHz, 10 kHz, and 100 kHz, respectively, for the 0.90PFW-O.1OPT
ceramic. It exhibits a typical relaxor ferroelectric behaviour with a broad maximum and
frequency dispersion around the temperature of dielectric constant maximum, T,, which
varies from 228 K at 1 kHz to 236 K at 100 kHz. With the increase of frequency, the
maximum value of the dielectric constant decreases and T, shifts to higher temperature.
Figure 4.4: Dielectric constant vs. temperature at various frequencies for the 0.90PFW-0.1 OPT ceramics.

4.4.3 Impedance and Modulus Spectroscopic Analyses of the PFW-PT Ceramics
Figure 4.5 gives the complex impedance spectrum of the 0.90PFW-O.1OPT
ceramics in the form of resistivity at 293 K. p' and p" are the real part and imaginary
part of the resistivity, respectively. It seems that the spectrum approximately consists of a
distorted semicircle at high frequencies and a linear response at an angle of -50' to the X-
axis in low frequency range. The low-frequency 'spike' indicates that the diffusion of
oxygen through the interfacial layer between the ceramics sample and the metal electrode
is a semi-infinite diffusion process. This diffusion impedance is often called the Warburg
diffusion impedance appearing on the surface layers [13]. The distorted and incomplete
semicircle at high frequencies is possibly resulted from the overlap of some semicircles.
-
- " 0 20000 40000 60000 80000 I00000
p' (ohmm)
Figure 4.5: Complex impedance spectrum of the 0.90PFW-O.1OPT ceramics at 293 K. Arrow indicates the direction of increasing frequency.

It is difficult to directly analyze and calculate each of the RC elements, because all the
semicircles are merged into a depressed one. Therefore, an electric modulus analysis has
to be performed here.
The corresponding electric modulus spectrum of the 0.90PFW-O.10PT ceramics is
shown in Fig. 4.6. M' and M" represent the real and imaginary parts of the modulus,
respectively. The spectrum is mainly composed of two semicircles in the middle
frequency ranges and two other segments at lower and higher frequencies, respectively.
Each part has individual electrical properties (R and C components) attributed by relevant
component (phase) in the system. Clearly, the distorted semicircle in the impedance
spectrum of Fig. 4.5 is indeed caused by the overlap of semicircles. In order to directly
show the frequency dependence of the imaginary part of the modulus, M", and extract the
capacitance values, the modulus spectrum in Fig. 4.6 is redrawn in terms of M" vs.
frequency, as shown in Fig. 4.7. The maximal imaginary modulus, M",,,, for each peak
of the plot is inversely proportional to the capacitance of each ceramic phase according to
the following equation [lo]:
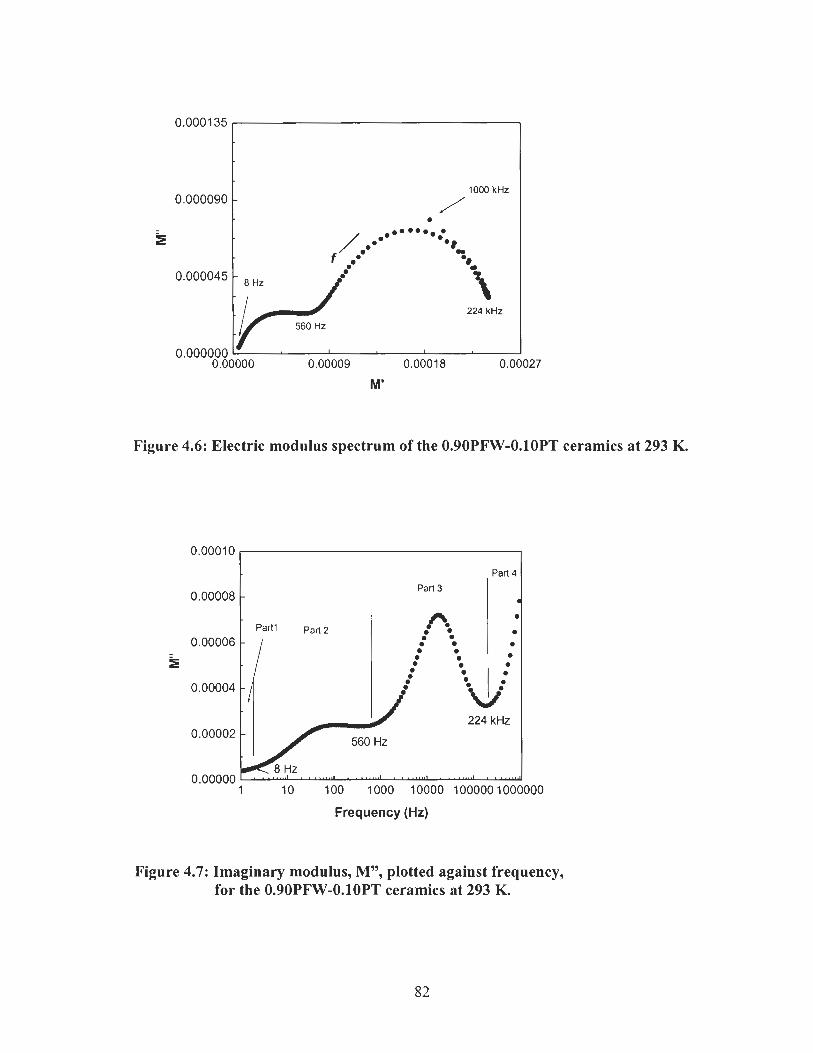
Figure 4.6: Electric modulus spectrum of the 0.90PFW-O.1OPT ceramics at 293 K.
0.00010
Part 4
Frequency (Hz)
0.00008
Figure 4.7: Imaginary modulus, M", plotted against frequency, for the 0.90PFW-O.1OPT ceramics at 293 K.
- Part 3
Part1 part2 0 . 0 0 0 0
0
% 0 0 0
0 0 0 0
0
0
0 0
0
0 =u: 224 kHz
0.00000 . a ...-..' a . .....-' . . -..* 1 10 100 1000 10000 100000 1000000
The modulus spectrum M"V) (Fig. 4.7) can be divided into four parts, according
to the frequency responses of the modulus and impedance. In the low frequency range
(part I), the modulus M" gradually increases with the increase of frequency from 1 Hz to
8 Hz. This corresponds to the linear part of the impedance spectrum in Fig. 4.5, which
can be associated with diffusion of oxygen through the electrode [13]. This Warburg
diffusion impedance is related to the diffusion coefficient and concentration of the
species. In the frequency range of 8 Hz - 560 Hz (Part 2), a small and broad modulus
peak corresponding to the smaller semicircle in Fig. 4.6 is observed. According to
Equation 4.13, the relevant magnitude of the capacitance, C, is found to be -1.0 x 1 o - ~ F,
which is associated with a grain boundary phase in the polycrystalline material, since the
grain boundary capacitance in electroceramics typically falls in the range of 10 - ' I to 10 -
' F [ l 11. This relatively large value of grain boundary capacitance indicates the feature of
the narrow intergranular regions (capacitance is inversely proportional to the thickness of
the boundary) and the well-sintered properties of the PFW-PT ceramics [19]. In the third
segment in the frequency range of 560 Hz - 224 kHz, a larger and sharper modulus peak
appears at f = 19.5 kHz, corresponding to a capacitance of - 3.0 x lo-'' F. It arises from
the bulk (grain) phase of the ceramics, because a bulk phase exhibits a typical
capacitance of 10- '~-10-~ F. The magnitudes of resistance of the grain boundary and bulk
phases are -3.0 x10⁶ ohms and -1.0x10bhms, respectively, on the basis of Equation 4.7.
These two resistances differ by -30 times, while the relevant capacitances differ by only
3 times. This is the reason why only a single distorted semicircle can be seen in the
complex impedance plane due to the domination of the impedance response by the very
large resistance of the grain boundary phase. However, the separate semicircles can be

obtained in the corresponding electric modulus plane. For the last segment in the
frequency range of 224 kHz-1000 kHz, as shown in Fig. 4.7 the modulus peak overflows
with respect to the frequency scale of the instrumentation. A very small resistivity is
estimated in this frequency range from the impedance plot in Fig. 4.5, where the high-
frequency spectrum is close to the origin. Hence, a minor phase is possibly responsible
for this electrical behaviour with a very small capacitance (very large M" in Fig. 4.7) and
resistance [ l l ] . This minor phase should be related to the structural defect and impurity
in the ceramic system. For example, the charge defect in the form of ~ e ~ + / ~ e ? + ions could
promote the electron hopping between them, and thus affects the conductivity of the
system and dielectric dispersion [15].
The corresponding equivalent circuit can be deduced from the impedance and
modulus analyses above, as shown in Fig. 4.8. It results from a series model consisting of
four parallel RC elements. Rg and Cg individually represent the resistance and
capacitance of the dielectric bulk (grains) phase associated with the modulus M",,, in the
frequency range of 560 Hz - 224 kHz. Rgb and Cgb are the resistance and capacitance of
grain boundary phase, respectively, which corresponds to the M,,, in the frequency
range of 8 Hz - 560 Hz. Kt and Cdl are the charge transfer resistance and double-layer
capacitance occurring at the sample-electrode interface, respectively. Z , is the Warburg
diffusion impedance as the oxygen ions diffuse through the electrode surface layer. R,
and C,,, correspond to the resistance and capacitance of the minor phase due to the
existence of structural defect and impurity in the system. It is clear that the conductance
of the PFW-PT ceramics is composed of the four components connected in series, but
their electrical contributions are different from each other. In most cases, the impedance

properties of bulk and grain boundary phases are given more attention in the studies of
dielectric and ferroelectric ceramic microstructure, because of their major contribution to
the dielectric properties.
Figure 4.8. Equivalent circuit that describes the electrical response of the 0.90PFW-O.1OPT ceramics. R, and C,, stand for resistance and capacitance of the minor phase, respectively, Rg and C, for those of the bulk (grain) phase, Rgb and Cgb for those of the grain boundary phase, Kt and C d l for those of charge transfer and double layer, and Z, is for the Warburg diffusion impedance.
Figure 4.9 illustrates the resistivity of the 0.90PFW-O.1OPT ceramics, as a
function of frequency at 293 K. The resistivity decreases in a wavy form with the
increasing frequency, demonstrating the influence of the capacitance impedance on the
total resistivity of the system, because only the capacitance impedance, Zc = -j/2njC, is
frequency dependent. Each component has different capacitance impedance, which
results in individual frequency dependence of the resistivity. In a ceramic system

composed of bulk and grain boundary components that are connected in series, the total
complex resistivity, p,, can be given by [ I 31,
Pt = XgPg +XgbPgb 9 (4.14)
where p, and xp are the complex resistivity and volume fraction of the bulk phase,
respectively. pgb and x,b are those of the grain boundary phase. The complex resistivity of
each component (phase) is frequency-dependent, giving rise to the frequency dependence
of resistivity of the system. The conductivity, o(o) , is expressed as
o(m) = oo + Am" > (4.15)
where o, is a frequency-independent part, A is a constant, and n is a constant between 0
andl. Hence, the conductivity (resistivity) of the system increases (decreases) with
increasing frequency.
Figure 4.9: Frequency dependence of the real part of resistivity for the 0.90PFW-O.1OPT ceramic at 293 K.
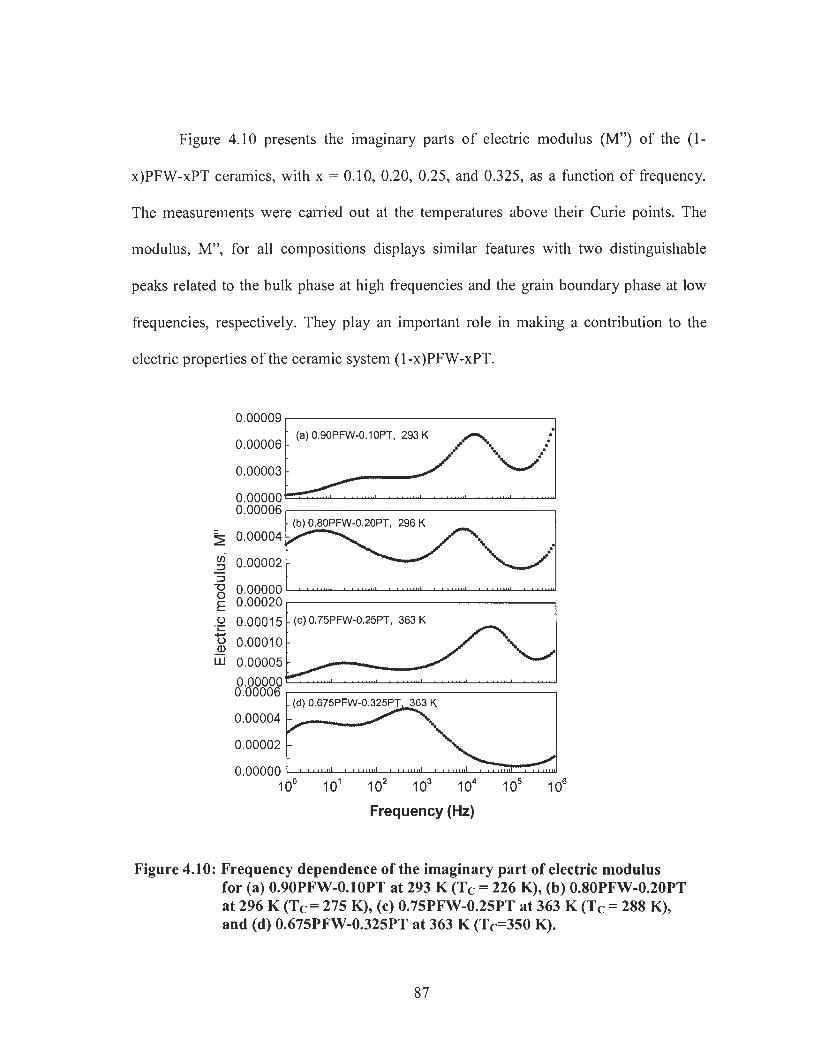
Figure 4.10 presents the imaginary parts of electric modulus (M") of the (1-
x)PFW-xPT ceramics, with x = 0.10, 0.20, 0.25, and 0.325, as a function of frequency.
The measurements were carried out at the temperatures above their Curie points. The
modulus, M", for all compositions displays similar features with two distinguishable
peaks related to the bulk phase at high frequencies and the grain boundary phase at low
frequencies, respectively. They play an important role in making a contribution to the
electric properties of the ceramic system (I -x)PFW-xPT.
(a) 0.90PFW-O.IOPT, 293 K 0.00006
0.00003
0.00000
Frequency (Hz)
Figure 4.10: Frequency dependence of the imaginary part of electric modulus for (a) 0.90PFW-O.1OPT at 293 K (Tc = 226 K), (b) 0.80PFW-0.20PT at 296 K (Tc= 275 K), (c) 0.75PFW-0.25PT at 363 K (Tc = 288 K), and (d) 0.675PFW-0.325PT at 363 K (Tc=350 K).

The influence of temperature on the electric modulus M" in the 0.75PFW-0.25PT
ceramics is shown in Fig. 4.1 1. The electric modulus spectra with two peaks associated
with grain boundary and bulk phases are clearly separated at high temperature, T = 363 K
> Tc = 288 K. Since the modulus peak MnmaX of the bulk phase at high frequencies is
larger than that of grain boundary phase at low frequency, the corresponding capacitance
value is smaller according to Equation 4.13 in which the capacitance is inversely
proportional to maximum of imaginary modulus. Upon cooling to 303 K, the higher-
frequency peak decreases rapidly and finally disappears, whereas the lower-frequency
peak becomes broadened and shifts toward lower frequency. The high-frequency peak
M",.,,,, decreases much faster than the low-frequency peak M",,,,, in the temperature range
of 363 K - 303 K. Therefore, the capacitance of the ceramic system is dominated by that
Frequency (Hz)
Figure 4.1 1: Frequency dependence of the modulus M" for the 0.75PFW-0.25PT ceramics at (a) 258 K, (b) 303 K, and (c) 363 K, respectively.

of the bulk phase. With the temperature decreasing to below the Curie point (T = 258 K <
Tc = 288 K), the value of the whole electric modulus spectrum increases a bit, showing a
decrease of the capacitance (or dielectric constant). The similar phenomenon also occurs
in the 0.675PFW-0.325PT ceramics, as shown in Fig. 4.12, where the two modulus peaks
are distinguishable at high temperature of 373 K (>Tc = 350 K), but the high-frequency
modulus peak disappears at the temperature below Tc. The maximum of capacitance (or
dielectric constant) occurs near the Curie temperature for these two systems. The
temperature and frequency dependences of the modulus analyzed above are consistent
with the dielectric and ferroelectric properties of the PFW-PT ceramics (see e.g. Fig. 5.5
and Chapter 3).
-
1 10 100 1000 10000 100000 1000000
Frequency (Hz)
Figure 4.12: Frequency dependence of the modulus for the 0.675PFW-0.325PT ceramics at (a) 298 K, (b) 323 K, and (c) 373 K.
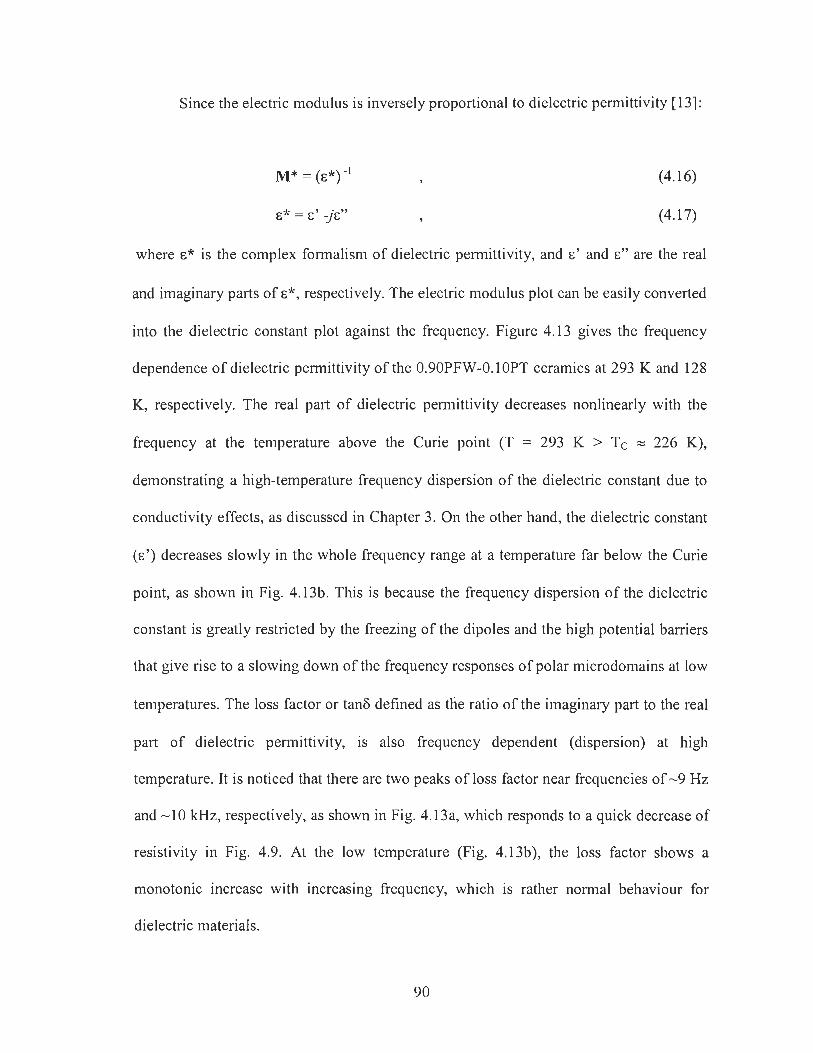
Since the electric modulus is inversely proportional to dielectric permittivity [13]:
M* = (E*) - 1 , (4.16)
E* = E' j&" , (4.17)
where E* is the complex formalism of dielectric permittivity, and E' and E" are the real
and imaginary parts of E*, respectively. The electric modulus plot can be easily converted
into the dielectric constant plot against the frequency. Figure 4.13 gives the frequency
dependence of dielectric permittivity of the 0.90PFW-0.10PT ceramics at 293 K and 128
K, respectively. The real part of dielectric permittivity decreases nonlinearly with the
frequency at the temperature above the Curie point (T = 293 K > Tc = 226 K),
demonstrating a high-temperature frequency dispersion of the dielectric constant due to
conductivity effects, as discussed in Chapter 3. On the other hand, the dielectric constant
(E') decreases slowly in the whole frequency range at a temperature far below the Curie
point, as shown in Fig. 4.13b. This is because the frequency dispersion of the dielectric
constant is greatly restricted by the freezing of the dipoles and the high potential barriers
that give rise to a slowing down of the frequency responses of polar microdomains at low
temperatures. The loss factor or tan6 defined as the ratio of the imaginary part to the real
part of dielectric permittivity, is also frequency dependent (dispersion) at high
temperature. It is noticed that there are two peaks of loss factor near frequencies of -9 Hz
and -10 kHz, respectively, as shown in Fig. 4.13a, which responds to a quick decrease of
resistivity in Fig. 4.9. At the low temperature (Fig. 4.13b), the loss factor shows a
monotonic increase with increasing frequency, which is rather normal behaviour for
dielectric materials.

(a) T = 293 K
I
. . . . . . . . . . . . . . . . . . . . . . . . . . . . . . . . . . . . . . . . . . . . . . . . . 1 10 100 1000 10000 100000 1000000
Frequency (Hz)
Frequency (Hz)
10000 0.5 (b) T=128K
W
Figure 4.13: Frequency dependence of the dielectric permittivity and loss factor of the 0.90PFW-O.1OPT ceramic at (a) 293 K and (b) 128 K, respectively.
1000 >; C, . - > . - S . - - 5 100 !w -
L
a, 0 .-4
a 11 U
0 ' c u U
a, . - n
- :
0.4
E"

4.5 Conclusions
The combined complex impedance and electric modulus formalisms have been
successfully applied to analyze the electrical response of the (1-x)PFW-xPT ceramics (x
= 0.10, 0.20, 0.25, and 0.325), and to reveal the electrical components (R and C) of each
microstructural phase in the system, which contribute to the total electric properties of the
solid solution ceramics.
It is found that four different microstructural phases: dielectric and ferroelectric
bulk (grains), grain boundary, ceramics-electrode surface diffusion, and minor (structural
defect and impurities) phase, contribute to the electrical properties of the (1-x)PFW-xPT
ceramics. An equivalent circuit composed of the related RC elements has been presented
to simulate and interpret the complex impedance and corresponding modulus spectra. The
bulk (grains) and grain boundary phases are the main components making electrical
contributions to the electric response of the ceramic system. The minor phase makes only
a small electrical contribution to the system because of its very small resistivity.
The electric modulus spectra of 0.75PFW-0.25PT, in terms of imaginary part of
the modulus vs. frequency, have been analyzed at 325 K, 303 K, and 258 K, respectively.
The higher-frequency modulus peak M,,," corresponding the bulk (grains) phase is
larger than the lower-frequency modulus peak referred to the grain boundary phase at the
temperature far above the Curie point Tc = 288 K, indicating that the former has a
smaller capacitance value than the latter. Upon cooling close to the Curie temperature,
both the grain and grain boundary capacitances increase to their maximum values,
showing the highest polar activities near the ferroelectric phase transition. The
capacitance from the bulk phase increases more quickly than that from the grain

boundary phase. Hence, it is concluded that the dielectric and ferroelectric properties of
the system are dominated by the bulk (grains) component.
The frequency dependences of the real and imaginary dielectric permittivity were
measured for the 0.90PFW-0.1 OPT ceramics at the temperatures above and below Tc.
The dielectric constant decreases significantly with increasing frequency at a temperature
above Tc, demonstrating the high-temperature frequency dispersion. When the
temperature is far below Tc, the dielectric constant changes slowly with the frequency,
which is attributed to the dynamic freezing of the polar clusters and the attenuation of
dipole relaxation. The resistivity and loss factor of the 0.90PFW-O.10PT ceramics at 293
K vary in a wavy form with the increasing frequency, which is related to multiple
activation energies from the different phases in the system.
4.6 References
[ l ] L. E. Cross, Ferroelectrics 151,305 (1994).
[2] L. E. Cross, Ferroelectrics 76,241 (1987).
[3] Y.-J. Kim and S.-W. Choi, Ferroelectrics 186,287 (1996).
[4] M. Yonezawa, Ainer. Ceranz. Soc. Bull 62, 1375 (1 983).
[5] T. R. Shrout and A. Halliyal, Alner. Cerum. Soc. Bull. 66,704 (1987).
[6] Z.-G. Ye, K. Toda, M. Sato, E. Kita and H. Schmid, Koreaiz Phys. Soc. 32,
S 1028-3 1 (1 998).
[7] G. A. Smolenskii, J. Phys. Soc. Jpiz. Szrppl. 28,26 (1970)
[8] G. Drazic, M. Trontel, and D. Kolar, Muter. Sci. & Eizg. B26, 189 (1994).

[9] J. E. Bauerle, J. Phys. Chem. Solids 30,2675 (1969).
[I 0] B. Scrosati, Electrockirtz. Acta 26, 1559 (1 98 1).
[I I] J. T. S. Irvine, D.C. Sinclair, A. R. West, Adv. Mater. 2, 132 (1 990).
[I 21 D. C. Sinclair and A. R. West, J. Appl. Phys. 66(8), 3850 (1 989).
[I31 J. Ross Macdonald: Impedance Spectroscopy, A Wiley-Interscience Publication,
New York 1987.
[14] 0. Sakurai, K. Shinozaki, and N. Mizutani, fiuns. Mater. Res. Soc. Jpiz. B14,
[I 51 L. Zhou, P. M. Vilarinho and J. L. Baptista, Mater. Res. Bulletin 31(6), 699 (1996).
[I61 L. Zhou, P. M. Vilarinho, and J. L. Baptista, J. Mater. Sci. 33 2673-77 (1998).
[17] G. A. Smolenskii, A. I. Agranovskaya, V. A. Isupov, Sov. Phys. Sol. State 1,907
(1 959).
[18] M. Yonezawa, T. Ohno, in Proceediizgs of the Japan - US Study Seminar on
Dielectric and Piezoelectric Ceramics T-8, 1 (1 982).
[19] P. G. Bruce, and A. R. West, J. Electrochem. Soc. 30,662 (1983).
[20] L. Feng and Z.-G. Ye, J. Solid State Chenr. 163,484 (2002).

Chapter 5: Growth and Electric Characterization of Relaxor Ferroelectric
Pb(FemW,,3)03 -PbTi03 [PFW-PT] Single Crystals
5.1 Introduction
Complex perovskite compound Pb(Fez13Wln)03 is a relaxor ferroelectric
compound showing a broad and diffuse maximum of the dielectric permittivity at T, =
180 K with a strong frequency dispersion, and an absence of macroscopic polarization
and anisotropy at temperatures far below T, [ I , 21. This is attributed to the unusual
chemical feature of the perovskite structure in which the A-sites are filled by pb2' ions
and the octahedral B-sites are occupied by the ~ e ) + and w6+ ions at random. On the other
hand, PFW contains magnetic ions ~ e ~ ' (3d5) on the B-site with an occupancy of 66.7%.
Magnetic ordering may occur upon cooling while the polar nanodomains form and
develop [3].
Among the PFW-based systems, the solid solution between PFW and PbTi03
(PT) is of particular interest, because the relaxor ferroelectric and magnetic behaviour in
PFW can be modified by the addition of the ferroelectric PT component. We recently
studied the phase transitions in the ceramics and established the binary phase diagram for
the (1-x)PFW-xPT solid solution system, which indicates the presence of a morphotropic
phase boundary separating the rhombohedra1 (pseudo-cubic) from the tetragonal phase
[2]. The magnetic hysteresis loop measurements of the PFW-PT ceramics revealed a
magnetodielectric coupling taking place near the temperature of dielectric constant
maximum [4]. So far, all studies of the (I-x)PFW-xPT system have been carried out on
the ceramic system which has potential applications in multilayered capacitors [5, 61.
Single crystals of the (1-x)PFW-xPT solid solution are expected to have superior
dielectric/ferroelectric properties over the ceramic system because of their perfect and
continued single crystal structure without heterogeneous phases such as grain boundaries.
Unfortunately, the growth of the PFW-PT single crystals encountered some difficulties
arising from the control of thermal and chemical parameters and from the volatilization
of the solvent at high temperatures. Up to now, only the single crystals of PFW have been
synthesized from high temperature solution growth and studied in terms of their optical,
ferroelectric and magnetic properties [5,7].
In this work, the single crystals of the (1-x)PFW-xPT solid solution, with x = 0,
0.07, 0.13, 0.17, 0.27 and 0.75, are successfully synthesized and characterized by X-ray
diffraction and dielectric measurements.
5.2 Experimental
5.2.1 Growth of the (1-x)PFW-xPT Single Crystals
Single crystals of the (1-x)PFW-xPT solid solution are grown from high
temperature solution using PbO as flux. PbO is an effective solvent for many oxides. In
complex perovskite systems, it is also one of reactants, so that any contamination from
foreign ions can be avoided when PbO is used as self-flux [8-101. Table 5.1 lists the
melting points of Pb(Fe2/3W1/3)03 [GI, PbTi03 [ l 11 and PbO [12], which gives a reference
to the determination of growth temperature of the (1-x)PFW-xPT single crystals.
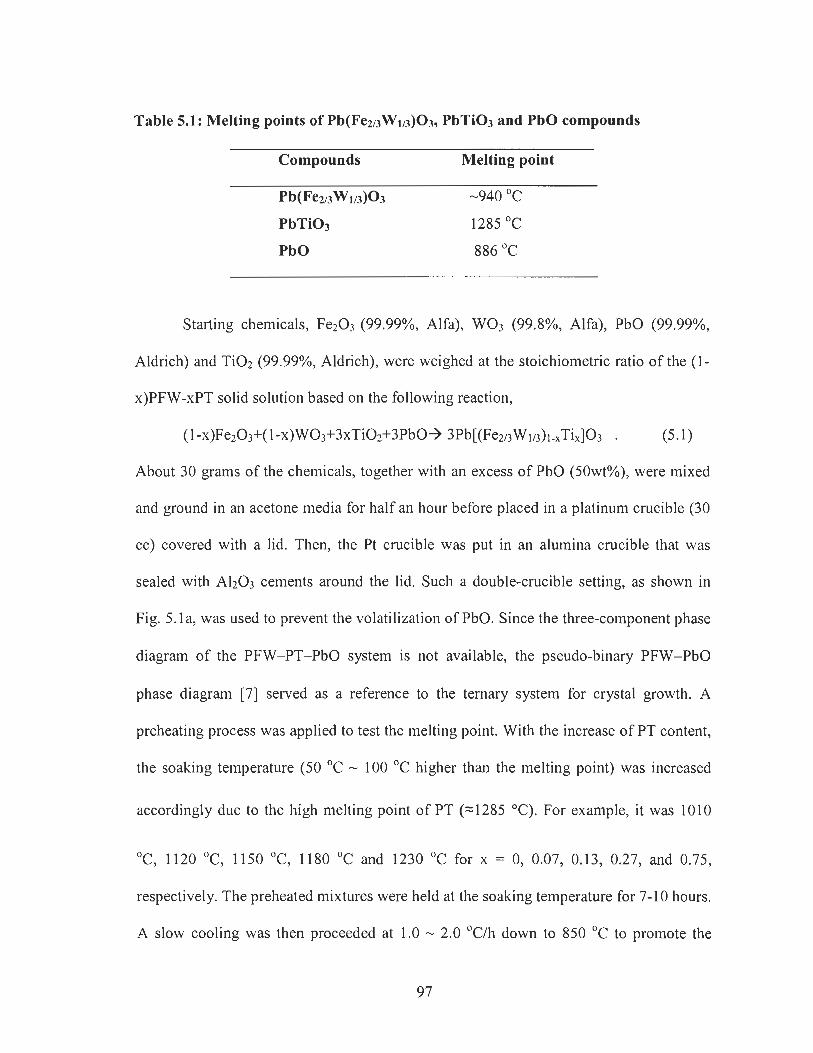
Table 5.1: Melting points of Pb(Fe2/3WlI3)O3, PbTi03 and PbO compounds
Compounds Melting point
Pb(Fe213Wld03 -940 OC
PbTi03 1285 OC
PbO 886 OC
Starting chemicals, Fe203 (99.99%, Alfa), W03 (99.8%, Alfa), PbO (99.99%,
Aldrich) and Ti02 (99.99%, Aldrich), were weighed at the stoichiometric ratio of the (1 -
x)PFW-xPT solid solution based on the following reaction,
(1 -x)Fe203+( 1 -x)W03+3xTi02+3PbO+ 3Pb[(Fe2nWln)1-,Tix]03 . (5.1)
About 30 grams of the chemicals, together with an excess of PbO (50wt%), were mixed
and ground in an acetone media for half an hour before placed in a platinum crucible (30
cc) covered with a lid. Then, the Pt crucible was put in an alumina crucible that was
sealed with A1203 cements around the lid. Such a double-crucible setting, as shown in
Fig. 5.la, was used to prevent the volatilization of PbO. Since the three-component phase
diagram of the PFW-PT-PbO system is not available, the pseudo-binary PFW-PbO
phase diagram [7] served as a reference to the ternary system for crystal growth. A
preheating process was applied to test the melting point. With the increase of PT content,
the soaking temperature (50 OC - 100 "C higher than the melting point) was increased
accordingly due to the high melting point of PT ( ~ 1 2 8 5 "C). For example, it was 1010
"C, 1120 "C, 1150 OC, 1180 OC and 1230 "C for x = 0, 0.07, 0.13, 0.27, and 0.75,
respectively. The preheated mixtures were held at the soaking temperature for 7-10 hours.
A slow cooling was then proceeded at 1.0 - 2.0 OCIh down to 850 OC to promote the

nucleation and growth of the single crystals, followed by a final cooling to room
temperature at 250 OCIh. Figure 5.1 b shows the typical temperature profile used for the
crystal growth. The solidified flux was leached out in hot HN03 aqueous solution
(-0.5M). The residual PbO flux was further removed in an ultrasonic vibration bath to
obtain clean PFW-PT single crystals.
Alumina Sagger for Crystal Growth
0.0 40.0 80.0 120.0 160.0 Time ( h o u r )
Crystal Growth Temperature Route
Figure 5.1: (a) Schematic of an alumina sagger for the PFW-PT crystal growth from high temperature solution and (b) the temperature profile for the crystal growth.

The crystal plates parallel to the (OO1),,b plane were polished using diamond
pastes (#9 and #5), and then gold electrodes were sputtered on the plates using a
Hummer 6-2 sputtering machine. The gold electrodes were connected to the dielectric
analyzer by two gold wires. Figure 5.2 shows a sample of the crystal used for subsequent
dielectric measurements. The dielectric measurements of the (1-x)PFW-xPT crystals
were performed with an Alpha high-resolution dielectriclimpedance analyser
(NovoControl Broadband Dielectric Spectrometer) in a frequency range of 10 - lo6 Hz
from 650 K to 100 K at 3-5 O C intervals. Ferroelectric loop measurements of the PFW-PT
crystals were performed using RT66A standard ferroelectric testing system (Radiant.)
combined with RT66A high voltage interface (HVI) based on the Sawyer-Tower circuit
at the scanning rate of1 00 cyclesls.
Figure 5.2: Photograph of a PFW-PT crystal with the Au electrode, showing the silver paste and Au wires on the surface of the crystal.

5.3 Results and Discussion
5.3.1 Morphology and XRD Characterization of the (1-x)PFW-xPT Single Crystals
Figure 5.3 depicts the samples of the (1-x)PFW-xPT (x = 0, 0.27 and 0.75) single
crystals with different sizes. They are all black with semi-metallic luster. The small
crystals (<1 mm) exhibit pseudo-cubic morphology (Fig. 5.3a & c). The larger crystals
(3-5 mm) show a degenerated form (Fig. 5.3b & d), suggesting less stable conditions at
late stages of the growth. The grown crystals show good quality and are suitable for
subsequent structural and physical characterization.
Figure 5.3: Photographs of the single crystals of (a) PFW, (b) & ( c ) 0.73PFW-0.27PT, and d & (e) 0.25PFW-0.75P1. \
100

The phase and structure of the (1-x)PFW-xPT single crystals were characterized
by X-ray diffraction (Rigaku diffractometer, CuKa radiation, h = 1.5418 A) at room
temperature. Figure 5.4 shows XRD patterns of the crushed crystals of (1-x)PFW-xPT,
with x = 0, 0.13, 0.27 and 0.75. It is clear that PFW and 0.87PFW-0.13PT crystals have a
pseudo-cubic perovskite phase at room temperature. As the PT content increases to 0.27,
the (200), (21 1) and (220) peaks start to split (Fig. 5.4b), showing the onset of structure
transition from the cubic to tetragonal one. In the XRD pattern of the 0.73PFW-0.27PT
crystals, a very small peak at 29 = 28.60 O was found, which is related to the traces of the
parasitic phase (a ferromagnetic phase of the hexagonal magnetoplombite "PbFe1201<7-
type [7]) in the powder sample. It results from the inclusions of the magnetic phase and
the composition inhomogeneity of the "magnetic" PFW crystal. In practice, the effect of
the trace impurity phase on subsequent characterization of 0.73PFW-0.27PT is
negligible. The 0.25PFW-0.75PT crystal exhibits a complete tetragonal phase with full
split of the characteristic peaks. Such a structure variation with the PT content is in
agreement with the phase diagram previously established for the (1-x)PFW-xPT binary
ceramic system, as discussed on page 65 in Chapter 3.
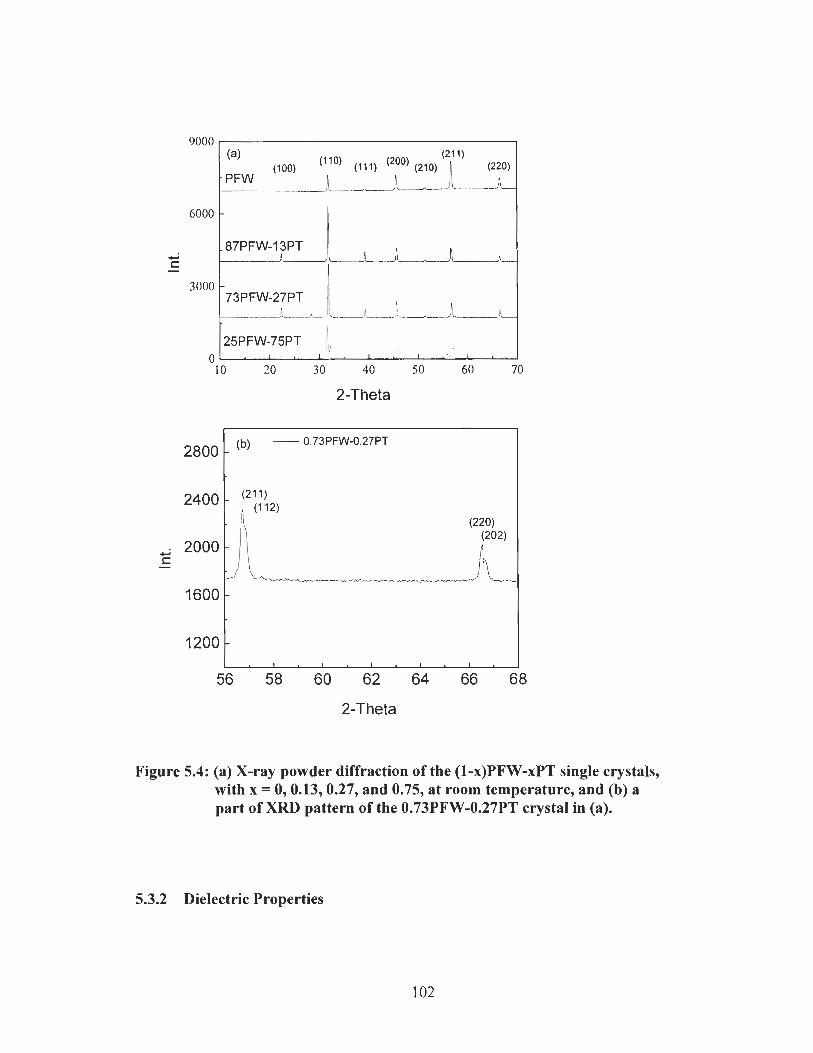
2-T heta
Figure 5.4: (a) X-ray powder diffraction of the (1-x)PFW-xPT single crystals, with x = 0,0.13,0.27, and 0.75, at room temperature, and (b) a part of XRD pattern of the 0.73PFW-0.27PT crystal in (a).
5.3.2 Dielectric Properties

Figure 5.5 displays the temperature dependence of the real part of dielectric
permittivity for the (1-x)PFW-xPT crystals, with x = 0, 0.13, 0.17, 0.27 and 0.75. A
broad and diffuse maximum of the dielectric permittivity with significant frequency
dispersion is observed in Fig. 5Sa, b, c, and d, indicating typical relaxor ferroelectric
behaviour. With the PT content increasing, the temperature (T,) of maximal dielectric
constant gradually shifts toward higher temperature (T, = 185 K, 248 K, 267 K, 274 K
and 603 K for PFW, 0.87PFW-0.13PT, 0.83PFW-0.17PT, 0.73PFW-0.27PT and
0.25PFW-0.75PT systems at 1 kHz, respectively) and the dielectric peaks become
sharper, which exhibits an attenuation of the relaxor behaviour. In order to quantify the
frequency dispersion of T,, a parameter AT defined as AT = T,(I MHz) - Tm(1 kHz) is
applied. Figure 5.6 illustrates the temperature difference, AT, as a function of the PT
content. From the decreasing trend of AT, the AT will be zero at x 2 0.43. Hence, the
frequency dispersion of T,, will completely vanish at x 2 0.43. This observation is
consistent with that found in the PFW-PT ceramics system reported in Chapter 3 and in
Ref. 1131. At high temperatures (T > T, or Tc), the dielectric constant increases and
shows another kind of frequency dispersion in the crystals with x 5 0.27, especially more
significant at low frequencies (Fig5.5a, b, c, and d). The low-frequency dispersion can be
attributed to the conductivity effect due to slowly mobile electronic charge. These
charges arise from the Fe3+ ions, which are usually combined with ~ e ~ + ions to form
charge defects. Thus, electron hopping between ~ e ~ + and Fe2+ ions results in an increase
or decrease in conductivity, which in turn gives rise to the dielectric dispersion [2, 141.
The crystals with PT content x L 0.43, for example, 0.25PFW-0.75PT, exhibits a normal
ferroelectric behaviour with a sharp permittivity peak at the temperature Tc = 603 K,

corresponding to the phase transition from a normal ferroelectric to paraelectric phase
upon heating (Fig. 5.5e).
Figure 5.5: Temperature dependence of the dielectric constant at different frequencies for the PFW-PT crystals with various compositions, (a) PFW, (b) 0.87PFW-0.13PT, ( c ) 0.83PFW-0.17PT, (d) 0.73PFW- 0.27PT, and (e) 0.25PFW-0.75PT.

Figure 5.6: Frequency dispersion of T, described in terms of the temperature difference AT =T,,,(loo ~ H Z ) - TITI ( I ~ H Z ) of the crystal (1-x)PFW-xPT as a function of PT content x.
Table 5.2 gives the values of the dielectric dissipation factor (loss tangent) of the
(I-x)PFW-xPT (x = 0,0.27 and 0.75) single crystals measured at 10 and 100 kHz at room
temperature and compares them to the ceramics (x = 0, 0.25 and 0.60) [2]. With the
increase of PT content, the loss tangent decreases in both single crystals and ceramics.
For the same or similar composition, however, the single crystals show a lower value of
loss tangent than the ceramics. This indicates that the grown (I-x)PFW-xPT single
crystals exhibit good quality with a better chemical stoichiometry than the ceramics,
which reduces the concentration of charge carriers (mainly arising from defects and non-
stoichiometry), and thereby improves the dielectric properties of the crystals.

Table 5.2. Dielectric dissipation factor (loss tangent) of the (1-x)PFW-xPT single crystals (SC) measured at 10 and 100 kHz at room temperature, compared to the ceramics.
I SC I SC I SC l ~ e r a m i c s l Ceramics I Ceramics
5.3.3 Vogel-Fulcher relationship
There have been various models proposed for the possible mechanism of
dielectric relaxation and dispersive polarization behaviour in some relaxor ferroelectric
systems [l5- 1 81.
In the dipole glassy-like model, a slowing down of dipole dynamics occurs,
leading to the freezing of dipoles due to the size of the polar regions and potential barriers
increasing upon cooling from temperatures above T, to those below T,. A broad and
diffuse maximum of the dielectric constant from the paraelectric to dipole glass transition
appears in the temperature dependence of dielectric constant because of a dynamic
freezing. The dielectric relaxation can be described by the Vogel-Fulcher (V-F) equation
(1.2) in terms of the AC frequency o and the temperature of the maximal dielectric
constant T,.
Figure 5.7 is the reciprocal dielectric constant of the PFW crystal as a function of
temperature for the purpose of fitting to the Curie-Weiss law according to Equation (1. l),
E = C/(T-8). It is found that the linear relationship can be obtained only at temperatures
(>270 K) far above T, (-1 85 K). Therefore, the temperature dependence of the dielectric
100kHz
10 kHz
PFW
0.018
0.067
0.73PFW- 0.27PT
0.027
0.037
0.25PFW- 0.75PT
<0.0008
~0.002
PFW
0.261
0.32
0.75PFW- 0.25PT
0.028
0.026
0.4OPFW- 0.60PT
0.021
0.044

constant of the PFW crystal does not obey the Curie-Weiss law for the description of
simple ferroelectric behaviour.
50 100 150 200 250 300 350 400
Temperature (K)
Figure 5.7: Reciprocal of dielectric constant as a function of temperature for the PFW single crystal at various frequencies.
The Vogel-Fulcher relationship (1.2) can be expressed in the following form:
I/(T,-Tf) = -(WE,)LnV) + (WE,)ln 6) , (5.2)
where Ty is the temperature of dynamic freezing of the polar clusters due to their
interaction,& is a constant, E, is the activation energy, and k is the Boltzman constant. A
plot of l/(T, - T/-) vs. 1nV) is shown in Fig. 5.8 for the (I-x)PFW-xPT crystals, with x =
0, 0.07, 0.13, 0.17 and 0.27. A linear relationship between the natural logarithms of
frequency and the reciprocal temperature difference in frequency range of 100 Hz - 1000
kHz was obtained. The data can be well fitted to the V-F law, indicating that the typical

relaxor ferroelectric behaviour in the PFW-PT system can be described by the glassy-like
dipole relaxation and freezing mechanism [ I , 191.
Figure 5.8: l/(T, (100 k ~ ~ ) -Tf) VS. LnV) for the (I-x)PFW-xPT crystal, with x = 0, 0.07,0.13,0.17 and 0.27. Solid lines show a linear fitting to the Vogel-Fucher relationship (5.4).
Table 5.3 gives the V-F equation fitting parameters, activation energy E,, freezing
point Th and temperature difference (T,(loo kHz) - Tf) for the crystals of (1-x)PFW-xPT, x
= 0, 0.07, 0.13, 0.17, and 0.27. The activation energy needed for switching the dipole
from one position to another opposite one tends to decrease with the increasing amount of
PT component, which is in agreement with the characteristic of relaxor ferroelectric
materials. The freezing temperature Tf increases with increasing PT content (Tf= 136 K,
157 K, 205 K, 226 K and 251 K for x = 0, 0.07, 0.13, 0.17 and 0.27, respectively),
indicating that the temperature of the dynamic freezing of polar cluster, or glass

transition, gradually increases due to the enhanced correlation between dipole moments.
The decrease of the temperature difference between T, and Tr with the PT content
increasing reveals that the relaxation behaviour gradually attenuates in the system. Since
the size of the ~ i ~ ' ion (r z 0.605 A) is similar to the w6' ion (r = 0.60 A), but is smaller
than the ~ e ) ' ion (r = 0.645 A), the substitution of the ~ i ~ ' ions for the ~ e ~ + and W" ions
on the octahedral B-site is in favour of inducing the ferroelectric long-range order by
increasing the correlation between dipole moments [ I ] . Hence, the transition into a glassy
state with frozen random orientation of dipole moments weakens, making the freezing
temperature increase. PFW has the lowest freezing temperature in the (1-x)PFW-xPT
binary system. The increase of the freezing temperature was also found in the Mn doped
PFW ceramics, because the formation of the defect pairs increases the correlation
between the dipole moments [20].
Table 5.3: Vogel-Fucher law fitting parameters for the (1-x)PFW-xPT
crystals.
5.3.4 Induced Electric Polarization and Ferroelectric Hysteresis Loop
Macroscopic polarization in the relaxor ferroelectric (1 -x)PFW-xPT crystals was
also investigated by the application of an electric field. Figure 5.9 and 5.10 show the
Composition
PFW
0.93PFW-O.07PT
0.87PFW-0.13PT
0.83PFW-O.17PT
0.73PFW-0.27PT
Ea (ev)
0.15
0.1
0.11
0.1 1
0.06
Tf (K)
136
157
205
226
25 1
Ttn-Tr at 100KHz
70
60
53
49 39

induced polarization of (1-x)PFW-xPT, with x = 0 and 0.13, respectively, under an
alternating electric field at different temperatures. The experiments were performed by
measuring the electric displacement (polarization) as a function of the electric field with
the help of a Sawyer-Tower circuit. It is seen that PFW shows a very small nonlinear
polarization at room temperature (Fig. 5.9b), and a clear electric hysteresis loop (Fig.
5.9a) at 223 K. This macro polarization induced above the phase transition T, ~ 1 8 5 K
demonstrates the relaxor ferroelectricity of the PFW crystal. For the 0.87PFW-0.13PT
crystal, two electric hysteresis loops were observed below and above the phase transition
temperature (T, B 268 K), as shown in Fig. 5.1 0. The remnant polarization and coercive
electric field increase with decreasing temperature, showing a stronger ferroelectricity of
the system at lower temperature. Compared with the results in Fig. 5.9, the larger
ferroelectric hysteresis in Fig. 5.1 0 is attributed to the enhancement of the ferroelectric
order due to the addition of the ferroelectric ion ~ i ~ + into the system.
-16 -8 0 8 16
Electric field (kV/cm)
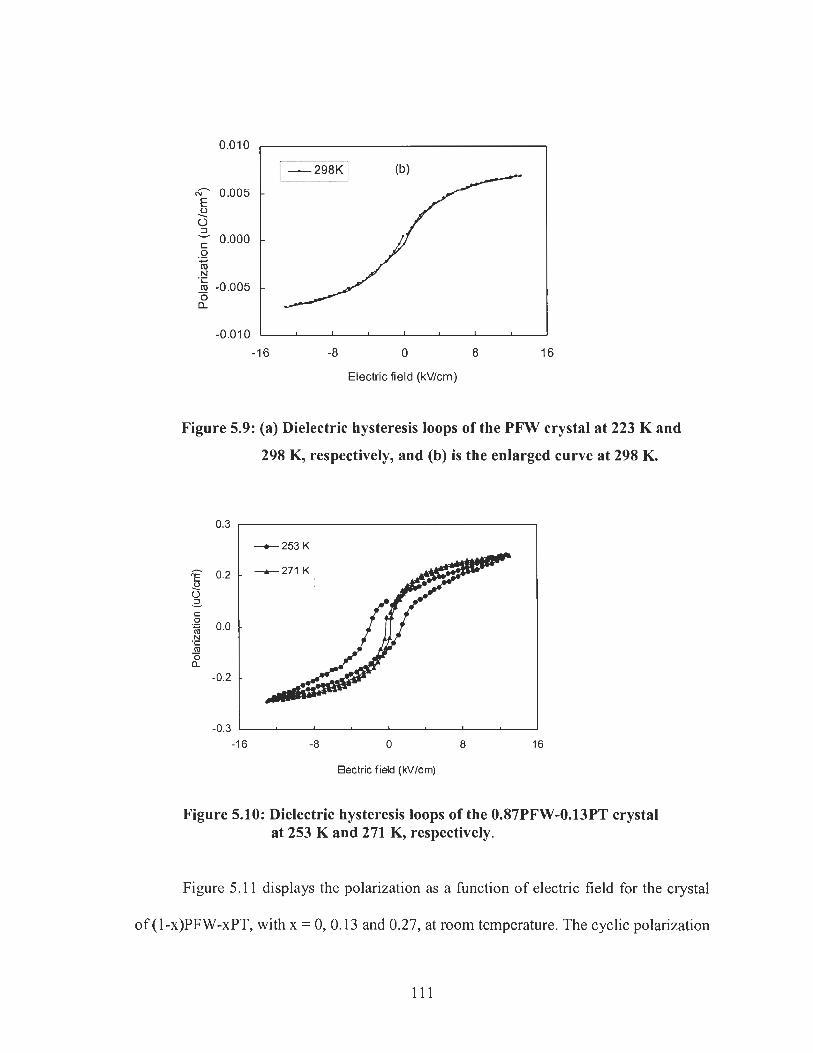
-1 6 -8 0 8 16
Electric field (kVlcm)
Figure 5.9: (a) Dielectric hysteresis loops of the PFW crystal at 223 K and
298 K, respectively, and (b) is the enlarged curve at 298 K.
-1 6 -8 0 8 16
Eectric field (kV/cm)
Figure 5.10: Dielectric hysteresis loops of the 0.87PFW-0.13PT crystal at 253 K and 271 K, respectively.
Figure 5.1 1 displays the polarization as a function of electric field for the crystal
of (1 -x)PFW-xPT, with x = 0,O. 13 and 0.27, at room temperature. The cyclic polarization

gave rise to the hysteresis loops in the 0.87PFW-0.13PT and 0.73PFW-0.27PT crystals,
but a nonlinear polarization for PFW. The remnant polarization and coercive electric field
are 0.14 p , ~ / c m ~ and 0.50 kVIcm, respectively, for 0.73PFW-0.27PT, and 0.04 p , ~ / c r n ~
and 0.3 1 kV/cm, respectively, for 0.87PFW-0.13PT. With the increasing PT content, the
macroscopic remnant polarization increases.
-1 6 -8 0 8 16
Electric field (kVIcm)
Figure 5.1 1 : Induced dielectric polarization of the (1-x)PFW-xPT crystals, with x = 0,0.13, and 0.27, at room temperature.
5.4 Conclusions
Single crystals of the (I-x)PFW-xPT solid solution, with x = 0, 0.07, 0.13, 0.17,
0.27 and 0.75, have been grown from the high temperature solution using PbO as flux,
and characterized by X-ray diffraction and dielectric measurements. As the PT content x
is increased to x = 0.27, the crystal structure at room temperature starts to change from a
pseudo-cubic to a tetragonal one, which is consistent with the phase diagram established
previously for the ceramics (1-x)PFW-xPT system in Chapter 3.
The temperature and frequency dependences of the dielectric permittivity of the
(1-x)PFW-xPT crystals show a crossover from the relaxor ferroelectric behaviour in low-
content PT crystals (x I 0.27) to normal ferroelectric properties in high-content PT
crystals (x > 0.27). The frequency-dispersive dielectric constant maxima arising from the
relaxor behaviour can be well fitted to the Vogel-Fulcher (V-F) law. With the PT content
increasing, the glassy-like behaviour with frozen random orientation of dipole moments
attenuates due to the enhanced correlation between dipole moments. The grown crystals
show improved dielectric properties with much smaller loss tangent than the ceramics at
room temperature.
The n~acroscopic polarization in the (1-x)PFW-xPT crystals, x = 0, 0.13, and
0.27, induced by the application of an electric field has been measured at different
temperatures. Non-linear polarization and a slim electric hysteresis loop at the
temperatures above T, further reveals the relaxor ferroelectric behaviour of the PFW
crystal. With the PT content increasing, the macroscopic remnant polarization increases
at room temperature, demonstrating the enhanced ferroelectricity in the PFW-PT system.
5.5 References
[ I ] Z.-G. Ye, Key Eng. Mater. 155 - 156, 81 (1998).
[2] L. Feng and Z.-G. Ye, J. Solid State Chern. 163,484 (2002).
[3] Z.-G. Ye, K. Toda, M. Sato, E. Kita and H. Schrnid, J. Korean Phys. Soc. 32, S1028

[4] L. Miliana, D. Marre, A. S. Siri and P. Nanni, Appl. Phys. Lett. 83, 5509 (2003).
[5] Z.-G. Ye and H. Schmid, Ferroelectrics 162, 119 (1994).
[6] T. R. Shrout and A. Halliyal, Am. Ceram. Soc. Bull. 66,704 (1987).
[7] Z.-G. Ye, H. Schmid, J. Crystal Growth 167, 628 (1 996).
[8] I. H, Brunskill, R. Boutellier, W. Depmeier, H. Schrnid and H. J. Scheel, J.
Crystal Growtlz 56, 541 (1982).
[9] W. Brixel, R. Boutellier, W. Depmeier, H. Schmid and H. J. Scheel, J.
Crystal Growth 82,396 (1982).
[lo] Z.-G. Ye, P. Tissot and H. Schmid, Mater. Res. Bull 25,739 (1990).
[11] M. A. Eisa, M. F. Abadir, and A. M. Gadalla, Trans. J. Br. Ceram. Soc. 79, 100
(1 980).
[12] R. F. Geller and E. N. Bunting, J. Research Nut. Bur. Staizclnrds 18, 585
[13] Y. -J. Kim and S.-W. Choi, Ferroelectrics 186,287 (1996).
[14] Z. Li, A. Wu, P. M. Vilarinho and I. M. Reaney, J. Phys.: Condens. Mater 17,2167
[15] Z. G. Lu and G. Calvarin, Mater. Res. Bull. 31,445 (1996).
[16] D. Viehland, J. -F. Li, S. J. Jang, E. Cross and M. Wuttig, Phys. Rev. B 46, 8013
(1 992).
[I71 D. Viehland and J. F. Li, J. Appl. Phys. 75, 1705 (1994).
[18] N. Yasuda, S. Fujimoto and K. Tanaka, J. Phys. D: Appl. Phys. 18, 1909 (1985).
[19] L. E. Cross, Ferroelectrics 76,241 (1987).
[20] L. Zhou, P. M. Vilarinho and J. L. Baptista, J. Mater. Sci. 33,2673 (1998).

Chapter 6:
Magnetic Ordering in (1-x)Pb(Fe213W113)03-xPbTi03
[(I -x)PFW-xPT] Single Crystals
6.1 Introduction
Pb(FezI3Wln)O3 is an unusual member of the complex perovskite family of
compound, which shows both relaxor ferroelectric behaviour and magnetic ordering. The
octahedral B-sites of the AB03 unit cell are occupied with paramagnetic ~ e ~ + and non-
magnetic w6+ ions at random. On the nanoscopic scale, polar nanoregions (or clusters)
are expected to exist due to compositional fluctuations and partial orderldisorder.
Therefore, a broad and diffuse maximum of dielectric permittivity occurs at around T, =
178 K, accompanied with strong frequency dispersion on the temperature dependence of
the dielectric constant [ l , 21. The dispersive maximum of dielectric constant is not related
to any structural changes, the perovskite material remaining in a pseudo-cubic structure
down to very low temperature [3].
On the other hand, the paramagnetic ions ~ e ~ + (3d5) on the octahedral B-site with
an occupancy of 66.7% in the perovskite structure may give rise to the magnetic ordering
upon cooling while the polar nanodomains develop. Most studies on Pb(Fez/3W1/3)03
(PFW) and Pb(Fe2/3W1/3)03-PbTi03 (PFW-PT) systems have been related to the
dielectric and ferroelectric properties, while few attempts were made to investigate their
magnetic properties in order to understand the magnetic ordering and to explore the

possible magnetoelectric (ME) coupling effect [2-41. In the ME coupling effect, an
electric (magnetic) field may induce not only electric polarization (magnetization), but
also magnetization (electric polarization) [5, 61. The magnetism and ferroelectricity are
involved with local spin arrangement and off-centre structural distortions, respectively
[7-91. The intrinsic relationships among the magnetic ordering, ferroelectric relaxation,
composition and structure are expected to exist in this system, which have not been
thoroughly understood yet.
Smolenskii et ul. [ lo] first reported the antiferromagnetic ordering appearing at
363 K in the PFW ceramics by magnetic and neutron-diffraction measurements. Later,
Al'shin [ l 11 found that there are two Curie-Weiss regions below TN = 383 K. Below 10
K, the magnetic susceptibility drops, presumably as a result of a "full antiferromagnetic
ordering". Uchino [12] investigated the magnetic field dependence of magnetization of
the (1 -X)P~(F~~/~WII~)O~-XP~(CO~/~W~/~)O~ system above the liquid nitrogen temperature,
and suggested that the slight deviation from the theoretical curve in the phase diagram is
caused by the partial ions participating in magnetic co-operative ordering based on
the hypothesis of Goodenough et u1. [13, 141, according to which a magnetic ion that has
no magnetic neighbours or only one magnetic neighbour does not take part in magnetic
ordering. Similar results were also obtained in PFW on the basis of the non-saturated
magnetization at low temperature (10 K), suggesting that not all the magnetic moments
participate in the ordering [15]. Ye et al. [Z] found that two types of magnetic orderings
take place in the PFW single crystals at T N I = 350 K and TN2 = 20 K, respectively, based
on the temperature dependence of the magnetization. The high-temperature magnetic
ordering at 350 K was suggested to arise from a superexchange in the Fe/W disordered

regions through the - Fe3+ - 0 - Fe3+- pathway, and the low-temperature one at 20 K
from a superexchange of the - ~ e ~ + - 0 - W - 0 - Fe3+ - pathway in the Fe/W ordered
nanoregions of the perovskite structure [2]. In the (1-x)PFW-xPT ceramic system,
Mitoseriu et al. [3, 16, 171 found a small shift of low-temperature magnetic transition
(TNI) towards higher temperature and the high-temperature transition towards lower
temperature with the increasing amount of PT component. Unfortunately, no detailed or
satisfactory explanation was given.
Some phenomena related to magnetoelectric coupling effects were also reported.
A very slight deviation of the magnetization from linearity in the temperature interval of
dielectric relaxation around T, = 175 K was observed [2], which was suggested to be
associated with the effect of electric field on the magnetic ordering in the PFW crystal. A
small anomaly of the magnetic hysteresis loop near the T, of the PFW ceramics was
suggested to indicate a magnetoelectric coupling [13]. However, a pronounced interplay
between the electric and magnetic properties is not easily observed because of the very
weak coupling effect between them [16]. It is necessary to prove the weak
magnetoelectric effect by more detailed and accurate measurement techniques
Up to now, there still lacks the systematic studies on the (1-x)PFW-xPT systems,
especially the magnetic properties of the single crystals of the solid solution. In this
chapter, the magnetic properties of the single crystals of the (I-x)PFW-xPT solid
solution, with x = 0, 0.07, 0.27 and 0.75, are studied with SQUID magnetometric
measurements.
6.2 Experimental

Single crystals of the (1-x)PFW-xPT solid solution were grown from high
temperature solution using PbO as self-flux, as described in chapter 5. A more detailed
description of the crystal growth can be found in Chapter 5. The starting chemicals,
Fe203 (99.99%, Alfa), W03 (99.8%, Alfa), PbO (99.99%, Aldrich) and Ti02 (99.99%,
Aldrich), were mixed at the stoichiometric ratios of the (1-x)PFW-xPT solid solution
according to the following reaction,
(1 -x)Fe203+(1 -x)W03+3xTi02+3Pb0+ 3Pb[(Fe2/3W1,3)1-~Ti,l0~ , (5.1)
with x = 0, 0.07, 0.27, and 0.75. The mixtures, together with an excess of PbO (50wt%),
were ground in an acetone media for half an hour before being placed in a platinum
crucible covered with a lid. The Pt crucible was then put in an alumina crucible that was
sealed to an alumina lid with A1203 cements. Such a double-crucible setting was used to
prevent the volatilization of PbO. Since the three-component phase diagram of the PFW-
PT-PbO system is not available, the pseudo-binary PFW-PbO phase diagram [18] served
as a reference to the ternary system for the crystal growth. A preheating process was
carried out to test the melting point. It was found that the melting point of the system
increases with the increasing PT content because of the high melting point of PT (-1265
OC). Therefore, the mixtures of different compositions were heated to a higher soaking
temperature (about 50 "C - 100 OC above the melting point) with the increasing PT
content, i.e. 1010 OC, 1120 "C, 1180 "C and 1230 OC for x = 0, 0.07, 0.27, and 0.75,
respectively, and held for 7 hours. A slow cooling process then took place at 1.0 - 2.0
"Clh down to 850 OC to trigger the nucleation and to promote the growth of the single
crystals, followed by a final cooling down to room temperature at 250 "Clh. The
solidified flux was leached out in hot and diluted FINO3 aqueous solution. The residual

PbO flux was further removed in an ultrasonic vibration bath to obtain clean PFW-PT
single crystals.
The magnetic measurements were performed on a Superconducting Quantum
Interference Device (SQUID) magnetometer (Quantum Design, MPMS XL-7 Ever Cool).
At first, the sample (0.020-0.070 grams) was heated to 373 K to eliminate any absorbed
H 2 0 traces. The magnetization of the crystals was then measured upon magnetic field
heating (FH) at 50 Oe and 1 kOe applied along <100>,,b, respectively, after zero field
cooling (ZFC) down to 2 K, at the temperature intervals of 2 - 5 degrees. Ac
magnetization measurements were carried out with a small ac magnetic field of 5 Oe and
at frequencies of 10 Hz and 1 kHz, respectively.
6.3 XRD of the Single Crystals
The phase and structure of the (1-x)PFW-xPT crystals were characterized by X-
ray powder diffraction (Cu K a radiation, h = 1.5418 A). Figure 6.1 shows the XRD
patterns of the ground (1-x)PFW-xPT crystals, with x = 0, 0.07, 0.27 and 0.75. The PFW
and 0.93PFW-0.07PT crystals show a pseudo-cubic perovskite structure at room
temperature. As the PT content is increased to 0.27, the (200), (21 1) and (220) peaks start
to show a tendency to splitting, indicating the onset of phase transition from the cubic to
a tetragonal structure. The crystals of 0.25PFW-0.75PT exhibit a complete tetragonal
phase with full split of the characteristic peaks, except the (1 11) peak. This structural
change as a function of the PT content is in agreement with the phase diagram we
recently established for the (1-x)PFW-xPT solid solution ceramic system, as described in
Chapter 3 and in Ref [l9].

Figure 6.1: X-ray powder diffraction patterns of the (1-x)PFW-xPT single crystals, indicating a rhombohedra1 (pseudocubic) phase for low PT-contents and a tetragonal splitting for x > 0.27
6.4 Results and Discussion
6.4.1 Magnetic properties
Figure 6.2 presents the temperature dependence of the magnetization of the (1-
x)PFW-xPT crystals, with x = 0, 0.07, 0.27 and 0.75, at a magnetic field heating of 50
Oe after zero field cooling. Upon heating from 2 K, a magnetization peak appears at the
Nee1 temperature of T N I = 8.5 K for PFW, which indicates a magnetic transition from a
(weakly) ferromagnetic state to an antiferromagnetic phase. With the temperature further
increasing, the magnetization gradually decreases and shows a high-temperature
magnetic anomaly at TN2 = 370 K, which is attributed to the antiferromagnetic-to-
paramagnetic transition. This transition is more clearly observed in Fig. 6(b) and (c).

These two types of magnetic ordering can be explained in light of the magnetic
interactions proposed in Ref. [2] for the PFW single crystals. The weakly ferromagnetic
ordering at low temperature arises from a superexchange of dominantly AFM-type (see
subsection 6.4.1) in the Fe/W ordered nanoregions through the - Fe3+ - 0 - W - 0 - Fe3+
- pathway, while the one at high temperature results from a superexchange of the -Fe3+-
0 - Fe3+ - pathway in the Fe/W disordered nanoregions. Since the magnetic interaction
distance (- 4.0 A) between the adjacent Fe3+ ions in the disordered regions is shorter than
that (-8.0 A) in the ordered ones, the corresponding magnetic coupling within the
disordered regions is stronger and can be stabilized at a higher temperature.
2.5E-03 , -- -
- (iii) 0.73PFW-0.27PT
5. OE- 03
4. OE- 03
3. OE- 03
2. OE- 03
1.OE-03
1 O.OE+OO ' I I
I , I I I I I 0. O E O O
0 50 100 150 200 250 300 350 400 450
Temperature (K)
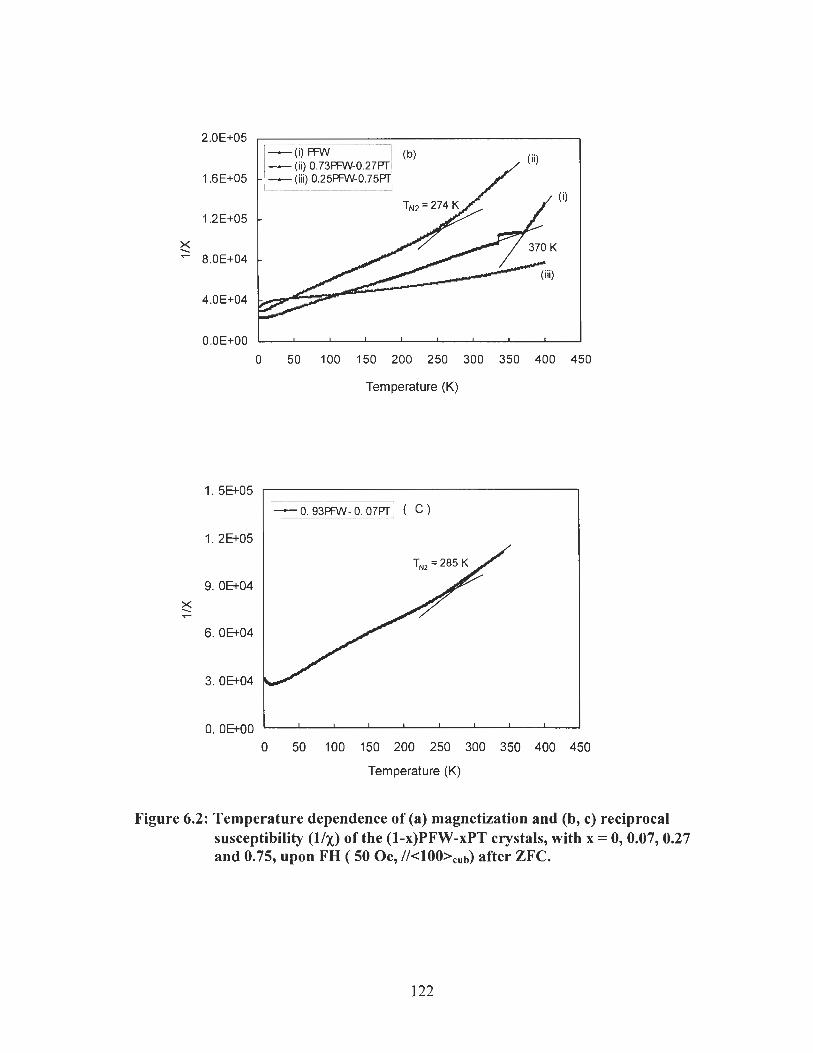
- (i) PFW (b) - (ii) 0.73PFW-0.27FTI - (iii) 0.25PFW-0.75PT,
0 50 100 150 200 250 300 350 400 450
Temperature (K)
0. O E O O I I I I I I I I I
0 50 100 150 200 250 300 350 400 450
Temperature (K)
Figure 6.2: Temperature dependence of (a) magnetization and (b, c) reciprocal susceptibility (11~) of the (1-x)PFW-xPT crystals, with x = 0,0.07,0.27 and 0.75, upon FH ( 50 Oe, after ZFC.
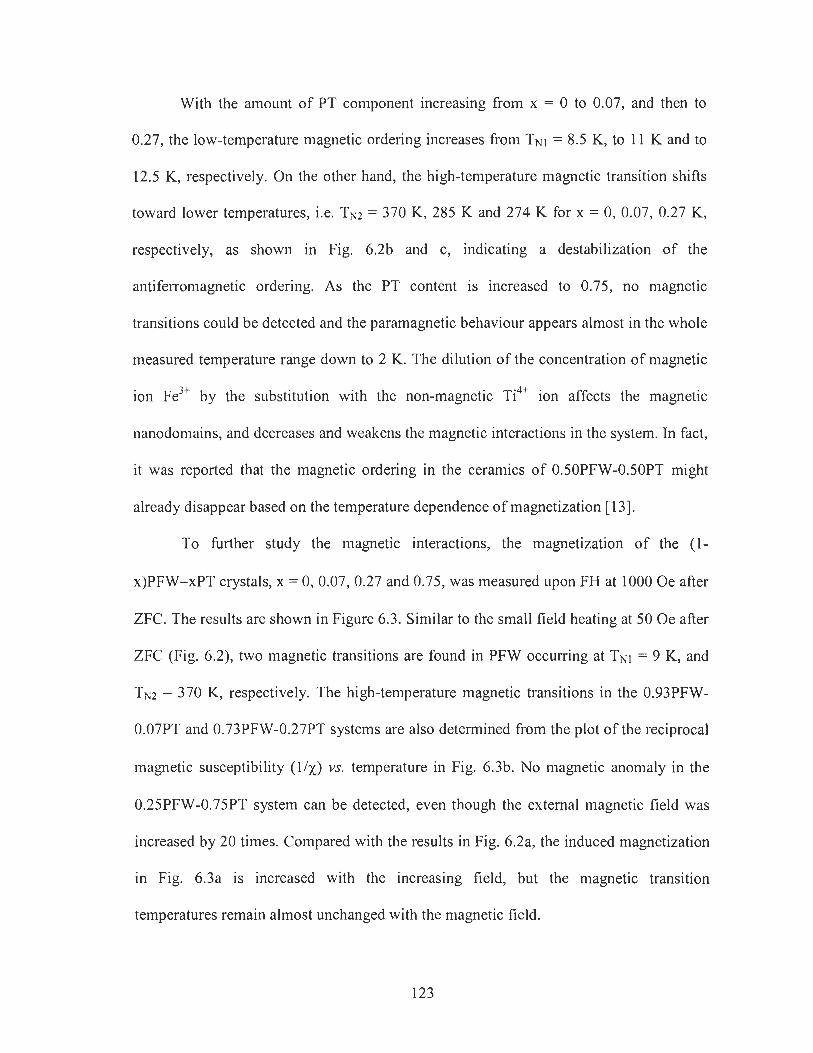
With the amount of PT component increasing from x = 0 to 0.07, and then to
0.27, the low-temperature magnetic ordering increases from TNI = 8.5 K, to 11 K and to
12.5 K, respectively. On the other hand, the high-temperature magnetic transition shifts
toward lower temperatures, i.e. TN2 = 370 K, 285 K and 274 K for x = 0, 0.07, 0.27 K,
respectively, as shown in Fig. 6.2b and c, indicating a destabilization of the
antiferromagnetic ordering. As the PT content is increased to 0.75, no magnetic
transitions could be detected and the paramagnetic behaviour appears almost in the whole
measured temperature range down to 2 K. The dilution of the concentration of magnetic
ion ~ e ' + by the substitution with the non-magnetic ~ i ~ + ion affects the magnetic
nanodomains, and decreases and weakens the magnetic interactions in the system. In fact,
it was reported that the magnetic ordering in the ceramics of 0.50PFW-0.50PT might
already disappear based on the temperature dependence of magnetization [13].
To further study the magnetic interactions, the magnetization of the (1-
x)PFW-xPT crystals, x = 0,0.07, 0.27 and 0.75, was measured upon FH at 1000 Oe after
ZFC. The results are shown in Figure 6.3. Similar to the small field heating at 50 Oe after
ZFC (Fig. 6.2), two magnetic transitions are found in PFW occurring at TNI = 9 K, and
TN2 = 370 K, respectively. The high-temperature magnetic transitions in the 0.93PFW-
0.07PT and 0.73PFW-0.27PT systems are also determined from the plot of the reciprocal
magnetic susceptibility (11~) vs. temperature in Fig. 6.3b. No magnetic anomaly in the
0.25PFW-0.75PT system can be detected, even though the external magnetic field was
increased by 20 times. Compared with the results in Fig. 6.2a, the induced magnetization
in Fig. 6.3a is increased with the increasing field, but the magnetic transition
temperatures remain almost unchanged with the magnetic field.

Based on the above results, a partial magnetic phase diagram of the (I-x)PFW-
xPT system is established, as shown in Fig. 6.4. It indicates the areas of paramagnetic,
antiferromagnetic and (weakly) ferromagnetic phases as a function of temperature (T)
and composition (x), which are delimited by the two magnetic transition temperatures.
The high-temperature magnetic ordering temperature TNZ decreases more rapidly as the
PT-content increases from 0 to 0.1, suggesting that the dilution of the magnetic ion has a
significant influence on the magnetic transition at TN2. Interestingly, the low-temperature
magnetic transition temperature increases slightly with the increase of x from 0 to 0.27.
- - -
(a) - U ) w - (11) 0.93W-0.07W - (111) 0.73PNV-0.27W - ( IV) 0 .25W-0 75W
0 50 100 150 200 250 300 350 400 450
Temperature (K)

. - (il PFW
0 50 100 150 200 250 300 350 400 450
Temperature (K)
Figure 6.3: Temperature dependence of (a) magnetization and (b) reciprocal susceptibility ( 1 1 ~ ) of the (1-x)PFW-xPT crystals, with x = 0,0.07, 0.27 and 0.75, upon FH (1000 Oe, //<lOO>,,b) after ZFC.
-
-
-
(Weakly) Ferromagnetic , . ' * I , ++-m T N ?
0.0 0.1 0.2 0.3 0.4
Paramagnetic
- -' TN2 -.- T,, 50 Oe - e T,, 50 Oe
Antiferromagnetic A T,, kOe
-7- TNZ 1 kOe i
Figure 6.4: Partial magnetic phase diagram of the (1-x)PFW-xPT system, which delimits the paramagnetic, antiferromagnetic, and weakly ferromagnetic phases.

It can be seen in Fig. 6.4 that the high-temperature magnetic transition at T N ~
shifts towards lower temperatures with the decreasing concentration of the magnetic Fe3+
ions in the (I-x)PFW-xPT system, in order to balance the magnetic ordering against
thermal agitation. However, the low-temperature magnetic transition at TN, slightly
moves to higher temperature, which seems to come into conflict with the common belief
that the "dilution" of the concentration of magnetic ion Fe3+ usually weakens the
magnetic coupling strength and would cause the magnetic transition to shift towards a
lower temperature in order to stabilize the magnetic ordering against the thermal motion
agitation. Similar experimental results were also found in the PFW-PT ceramic system,
but were not explained in detail [16, 171. In order to understand this unusual variation of
TN1 with composition, the unit cell volume of the perovskite solid solution calculated
from the XRD patterns [19] is presented in Fig. 3.6 (Chapter 3) as a function of
composition. The volume decreases with the PT content x increasing from 0 to about
0.30, and then increases slowly with x further increasing. The magnetic interaction
distance between the magnetic ions Fe3+, i.e. - Fe3+ - 0 - W - 0 - Fe3+ -, in the ordered
region, corresponding to the double edge length of the primitive unit cell, is also reduced,
giving rise to a stronger magnetic coupling. Therefore, the thermal stability of magnetic
ordering increases and the transition temperature TNI moves toward a higher temperature.
Two different factors determine the magnetic ordering, (i) the concentration of Fe3+ ions
and (ii) the magnetic interaction distance. Our results seem to point out that at PT content
x I 0.27, the enhanced magnetic coupling due to the shortened magnetic interaction
distance plays a dominant role in the low-temperature magnetic ordering, so that TN1
shifts toward higher temperature with increasing x. With the PT content further

increasing, it is expected that the effect of the "dilution" of Fe3+ ion concentration on the
destabilization of the weakly ferromagnetic ordering becomes more important, and
thereby T N I should decrease. At higher PT content (e.g. 75%), no magnetic orderings
should occurs because the so much diluted Fe3+ ions become magnetically isolated almost
in the whole range of experimental temperatures.
The decrease of the average unit cell volume as the PT-content increases up to x =
0.30 should normally enhance the both magnetic interactions at TN2 and TN1 in the same
way. However, since the latter interaction occurs at a much lower temperature of TNI , the
thermal agitatioddestabilization effect is much smaller and thereby the enhancement of
magnetic interaction is much more effective than the interaction that occurs at TN2. In
other words, the effect of decreasing unit cell volume on increasing TN2 is offset by the
thermal destabilization effect, while the dilution of magnetic Fe3+ ion by the substitution
of PT becomes a predominant factor. Therefore, TN2 decreases while TN1 increases with
the PT-content x increasing from 0 to about 0.30.
The influence of PT-content on the low-temperature magnetic ordering was
further investigated by ac magnetization measurements, in which an oscillating ac
magnetic field is applied on the sample. This method demonstrates an increased
sensitivity to the measurements by reducing the effective noise level. A small ac
magnetic field of 5 Oe at frequencies of 10 Hz and 1 kHz, respectively, was applied on
the crystals. Figure 6.5 shows the ac magnetization of the PFW and 0.93PFW-0.07PT
crystals in the temperature range of 1.9 K - 20 K. An ac magnetization peak appears at
T N I = 8.0 K for PFW in Fig. 6Sa, which is close to the magnetic ordering temperature
detected in the dc magnetic measurements (Fig. 6.2 and 6.3). In the 0.93PFW-0.07PT
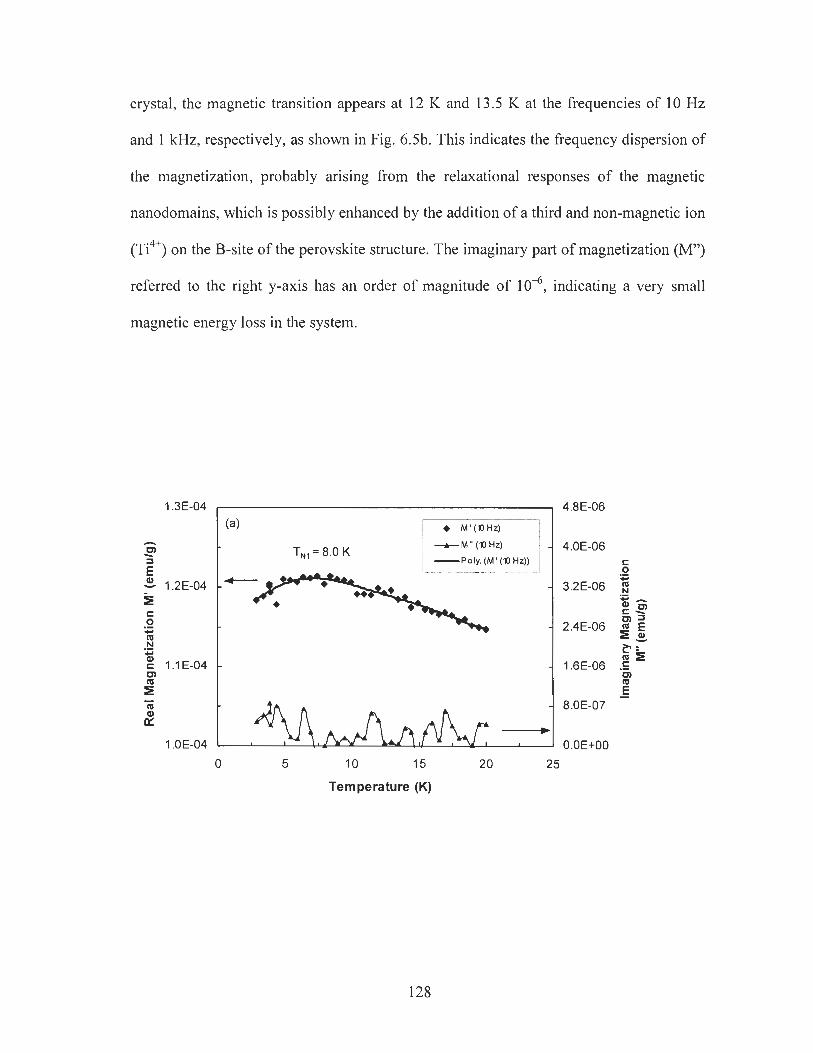
crystal, the magnetic transition appears at 13 K and 13.5 K at the frequencies of 10 Hz
and 1 kHz, respectively, as shown in Fig. 6.5b. This indicates the frequency dispersion of
the magnetization, probably arising from the relaxational responses of the magnetic
nanodomains, which is possibly enhanced by the addition of a third and non-magnetic ion
( ~ i ~ ' ) on the B-site of the perovskite structure. The imaginary part of magnetization (M")
referred to the right y-axis has an order of magnitude of lo4, indicating a very small
magnetic energy loss in the system.
0 5 10 15 2 0 25
Temperature (K)
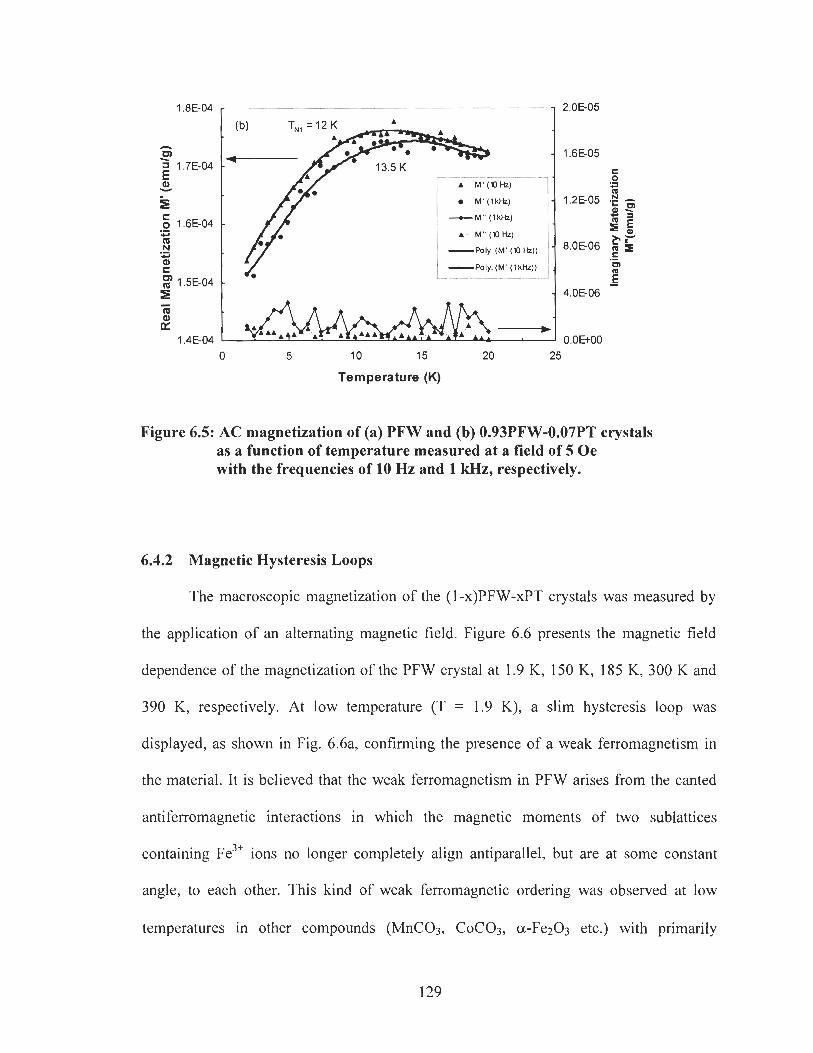
0 5 10 15 20 25
Temperature (K)
Figure 6.5: AC magnetization of (a) PFW and (b) 0.93PFW-0.07PT crystals as a function of temperature measured at a field of 5 Oe with the frequencies of 10 Hz and 1 kHz, respectively.
6.4.2 Magnetic Hysteresis Loops
The macroscopic magnetization of the (I -x)PFW-xPT crystals was measured by
the application of an alternating magnetic field. Figure 6.6 presents the magnetic field
dependence of the magnetization of the PFW crystal at 1.9 K, 150 K, 185 K, 300 K and
390 K, respectively. At low temperature (T = 1.9 K), a slim hysteresis loop was
displayed, as shown in Fig. 6.6a, confirming the presence of a weak ferromagnetism in
the material. I t is believed that the weak ferromagnetism in PFW arises from the canted
antiferromagnetic interactions in which the magnetic moments of two sublattices
containing ~ e ~ ' ions no longer completely align antiparallel, but are at some constant
angle, to each other. This kind of weak ferromagnetic ordering was observed at low
temperatures in other compounds (MnC03, CoC03, a-Fez03 etc.) with primarily

antiferromagnetic ordering [20]. In the ferromagnetic Pb(Fe112Nb112)03 single crystals
[?I], the existence of the hysteresis below TN was suggested to originate from the
magnetoelectric coupling.
At 150 K (Fig. 6.6b), 185 K (Fig. 6.6c), and 300 K (Fig. 6.6d), the magnetization
vs. field becomes non-linear and the non-linearity increases as temperature decreases,
indicating an enhancement of antiferromagnetic ordering. A complete linear field
dependence of magnetization occurs at the temperature of 390 K, which obeys the Curie-
Weiss law. Hence, PFW is in a paramagnetic state above TN2 = 370 K (Fig. 6.6e).
-50000 -25000 0 25000 50000
Magnetic field (Oe)
Figure 6.6: Field dependence of the magnetization for the PFW crystal measured at (a) 1.9 K, (b) 150 K, (c) 185 K, (d) 300 K, and (e) 390 K, respectively.

Figure 6.7 gives the induced magnetization of the 0.93PFW-0.07PT crystal.
Interestingly, compared with PFW, a more opened magnetic hysteresis loop was
displayed at low temperature (T = 1.9 K, Fig. 6.7a), suggesting an enhancement of the
weak ferromagnetism by the PT-substitution. The nonlinear magnetization showing
antiferromagnetic behaviour appears in the temperature range of TNI - TN2 (Fig. 6.7b). At
higher temperatures (T 2 300 K or T 2 TN2), a linear field dependence of the
magnetization appears, indicating the paramagnetism in the material (Fig. 6.7c, d, and e).
For the 0.73PFW-0.27PT crystal, the M-H hysteresis becomes even more opened and
hence the weak ferromagnetism more enhanced, as shown in Fig. 6.8
-50000 -25000 0 25000 50000
Magnetic field (Oe)
Figure 6.7: Field dependence of the magnetization for the 0.93PFW-0.07PT crystal measured at (a) 1.9K, (b) 150 K, (c) 300 K, (d) 350 K, and (e) 390 K, respectively.
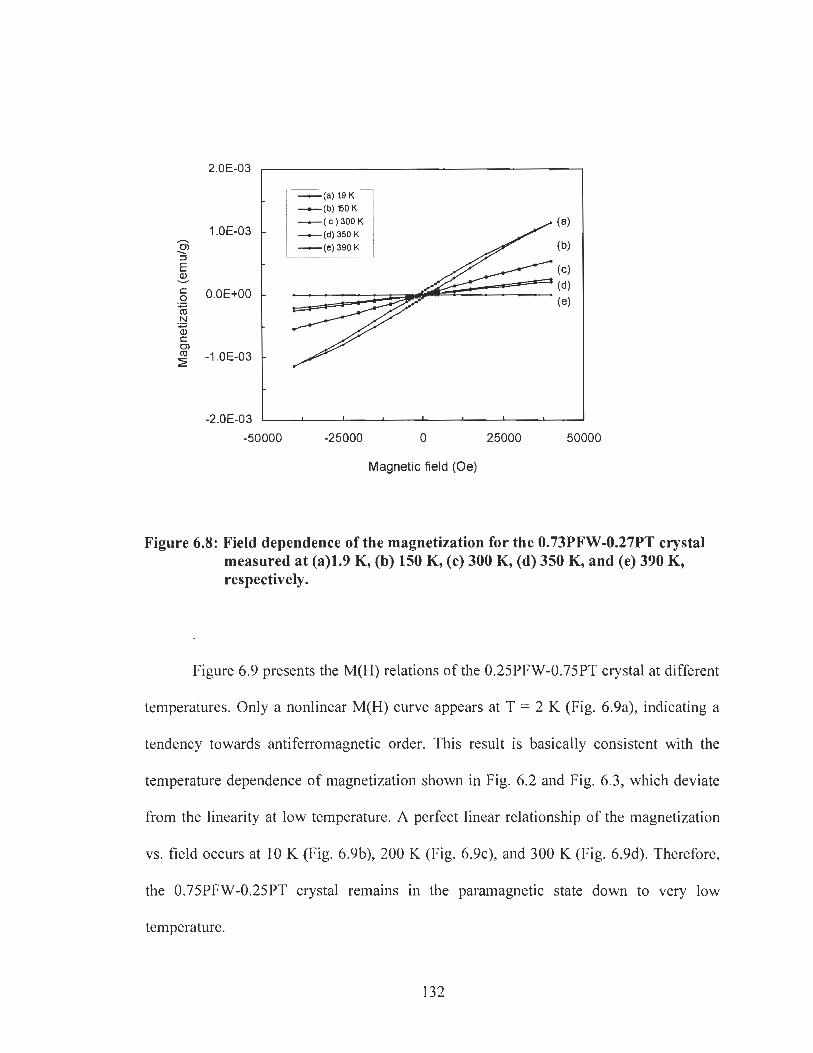
-(b) 150 K - (c )300K -(d) 350 K - (e) 390 K
-
-50000 -25000 0 25000 50000
Magnetic field (Oe)
Figure 6.8: Field dependence of the magnetization for the 0.73PFW-0.27PT crystal measured at (a)1.9 K, (b) 150 K, (c) 300 K, (d) 350 K, and (e) 390 K, respectively.
Figure 6.9 presents the M(H) relations of the 0.25PFW-0.75PT crystal at different
temperatures. Only a nonlinear M(H) curve appears at T = 2 K (Fig. 6.9a), indicating a
tendency towards antiferromagnetic order. This result is basically consistent with the
temperature dependence of magnetization shown in Fig. 6.2 and Fig. 6.3, which deviate
from the linearity at low temperature. A perfect linear relationship of the magnetization
vs. field occurs at 10 K (Fig. 6.9b), 200 K (Fig. 6.9c), and 300 K (Fig. 6.9d). Therefore,
the 0.75PFW-0.25PT crystal remains in the paramagnetic state down to very low
temperature.
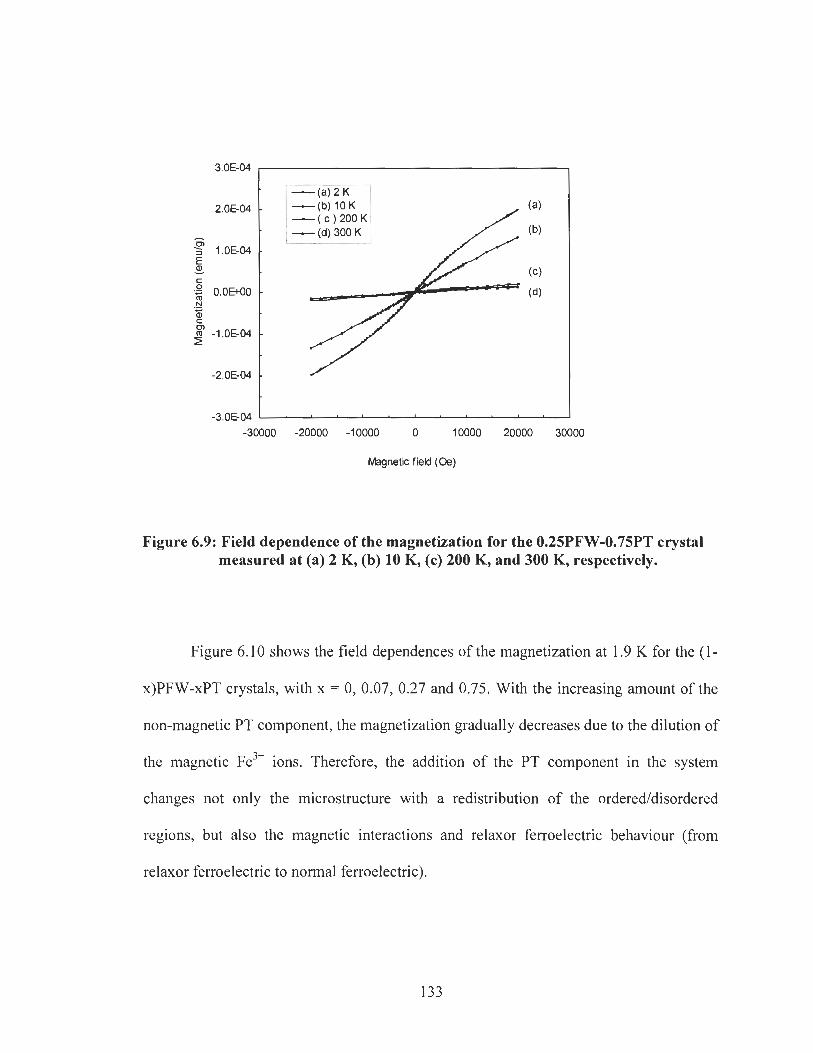
-30000 -20000 -10000 0 10000 20000 30000
Magnetic field (Oe)
Figure 6.9: Field dependence of the magnetization for the 0.25PFW-0.75PT crystal measured at (a) 2 K, (b) 10 K, (c) 200 K, and 300 K, respectively.
Figure 6.10 shows the field dependences of the magnetization at 1.9 K for the (1 -
x)PFW-xPT crystals, with x = 0, 0.07, 0.27 and 0.75. With the increasing amount of the
non-magnetic PT component, the magnetization gradually decreases due to the dilution of
the magnetic ~ e ~ + ions. Therefore, the addition of the PT component in the system
changes not only the microstructure with a redistribution of the orderedldisordered
regions, but also the magnetic interactions and relaxor ferroelectric behaviour (from
relaxor ferroelectric to normal ferroelectric).

-50000 -25000 0 25000 50000
Magnetic field (Oe)
Figure 6.10: Magnetic hysteresis loops for the (1-x)PFW-xPT crystals with various PT contents measured at 1.9 K.
The (I-x)PFW-xPT crystals, with x = 0, 0.07 and 0.27 display a weak
ferromagnetism at low temperature. Figure 6.1 1 is the remnant magnetization M, as a
function of the PT content (x). It can be seen that the remnant magnetization (or
hysteretic effect) increase as the PT content increases from 0 to 0.27, and then decrease
with the further increasing the amount of PT component. This phenomenon is in
accordance with the variation of the low-temperature magnetic transition temperature TN1
with the PT content x, demonstrating an enhancement of weak ferromagnetism by the
addition of the ferroelectric PT in the solid solution up to x = 0.27.

Figure 6.1 1 : Variation of the remnant magnetization at 1.9 K as a function of ferroelectric PT-content for the (1-x)PFW-xPT crystals.
6.5 Conclusions
The magnetic properties in the (I-x)PFW-xPT single crystals, x = 0, 0.07, 0.27
and 0.75, have been investigated by measuring the magnetization as a function of
temperature and magnetic field. Two types of antiferromagnetic orderings have been
observed on the temperature dependence of magnetization in the crystals with x I 0.27,
which arise from the different magnetic interactions. The low-temperature magnetic
ordering corresponding to the weakly ferromagnetic to antiferromagnetic transition
occurs at TNI = 8.5 K, 11 K, and 13 K for x = 0, 0.07, and 0.27, respectively, which
results from the canting of the primarily antiferromagnetic coupling in the ordered
regions, through the - ~ e " - 0 - W - 0 - ~ e ~ + - pathway. The high-temperature
ordering referred to antiferromagnetic to paramagnetic transition appears at TN2 = 370 K,
284 K, and 274 K, respectively, which arises from the antiferromagnetic coupling of the
- ~ e ) + - 0 - ~ e ) + -type occurring in the disordered microregions. With the measuring
magnetic field increasing from 50 Oe to 1000 Oe, the magnetization increases, but the
magnetic transition temperatures TN1 and TN2 remain unchanged. The low-temperature
magnetic orderings in the PFW and 0.93PFW-0.07PT systems have been further
confirmed by means of ac magnetization measurements. It is worth noting that no clear
and reliable anomaly on the temperature or magnetic field dependence of magnetization
has been found near the temperature of the maximal dielectric permittivity (T, z 185 K).
There are two factors that affect the magnetic transitions in the (I-x)PFW-xPT
system. On the one hand, the "dilution" of the concentration of the magnetic ion ~ e ) + by
the addition of the non-magnetic PT component generally destabilizes the magnetic
ordering of the substance. On the other hand, the decrease in distance of the magnetic
interaction due to lattice contraction gives rise to a stronger magnetic coupling between
adjacent ~ e ) + ions in the system. The former is responsible for the vanishing of the low-
temperature and high-temperature magnetic orderings at T N I and TN2, respectively, as the
amount of PT component is increased to a large extent. The latter plays an important role
in the shifting towards higher temperatures of the low-temperature magnetic transition
and the enhancement of the weak ferromagnetism with the increasing PT amount in the
low-content PT crystals. Based on the analysis of the magnetic transitions, a partial
magnetic phase diagram has been established, which delimits the paramagnetic,
antiferromagnetic and weakly ferromagnetic phases in the (1-x)PFW-xPT solid solution
system.
The magnetization of the crystals (I-x)PFW-xPT vs an alternating magnetic field
has been measured at different temperatures. In the PFW, 0.93PFW-0.07PT and
0.73PFW-0.27PT crystals, the M(H) curve at 1.9 K displays a slim hysteresis loop with
weak ferromagnetic feature. The remnant magnetization and the hysteretic effect increase
with the increasing PT content, indicating an enhancement of the ferromagnetism by the
addition of the ferroelectric PT (up to x = 0.27). The M(H) variation appears in the form
of a nonlinear curve without hysteresis in the temperature range between TNI and TNZ,
consistent with the antiferromagnetic nature in this temperature interval. At the
temperatures above TN2, a perfect linear relationship between the magnetization and
magnetic field is displayed and the Curie-Weiss relationship is observed. Hence, the
crystals are in the paramagnetic state. For the 0.25PFW-0.75PT crystal, the paramagnetic
behaviour exists down to 10 K with only a tendency toward antiferromagnetic ordering at
T < 10 K, suggesting that the magnetic ~ e ~ + ions become isolated in the perovskite
structure as a result of the high substitution of non-magnetic ion for ~ e ~ ' .
Therefore, as the perovskite structure gradually changes from a pseudo-cubic to a
tetragonal phase by increasing the amount of ferroelectric and non-magnetic PT
component in the PFW-PT system, the nature of dipole interaction transforms from the
relaxor ferroelectric state with short-range order to the ferroelectric long-range order. At
the same time, the low-temperature magnetic ordering slightly shifts toward a higher
temperature with enhanced weak ferromagnetism up to x = 0.27 and then disappears at
higher PT content, while the high-temperature antiferromagnetic transition moves
towards lower temperatures and then vanishes. These observations demonstrate the
intrinsic relationships among the microstructure, composition, dielectric and magnetic
properties and the intriguing multiferroic feature of the relaxor-based PFW-PT solid
solution system.

6.6 References
[ I ] Z.-G. Ye and H. Schmid, Ferroelectrics 162, 1 19 (1995).
[2] Z.-G. Ye, K. Toda, M. Sato, E. Kita and H. Schmid, J. Korean Phys. Soc. 32,
S 1028 (1 998).
[3] L. Mitoseriu, M. M. Carnasciali, P. Piaggio, P. Nanni, Appl. Phys. Lett. 81,
5506 (2002).
[4] G. A. Smolenskii and V. A. Bokov, J. Appl. P l y . 35,9 15 (1964).
[5] N. Hur, S. Park, P.A. Sharma, J.S.Ahn, S. Guha & S-W. Cheong, Nature, 429,394
(2004).
[6] T. Kimura et al. Phys. Rev. B 67, 18040 1 (2003).
[7] G. A. Smolenskii and I. E. Chupis, Fervoelectronzagnets. Usp. Fiz. Nauk. 137,415
(1982).
[8] H. Schmid, Ferroelectrics 162, 317 (1994).
[9] J. Wang, J. B. Neaton, H. Zheng, V. Nagarajan, S. B. Ogale, B. Liu, D. Viehland, V.
Vaithyanathan, D. G. Schlom, U. V. Waghmare, N. A. Spaldin, K. M. Rabe, M.
Wuttig, R. Ramesh, Science 299, 17 19 (2003).
[lo] V. A. Bokov, I. E. Myl'nikova and G. A. Smolenskii, Ferroelectrics-
Antiferrornagnets, Zh. Teor. Fiz 42 (2), 643 (1962).
[I 11 V. I. Al'shin, Investigation of Magnetoelectric Interactions in Magnetically Ordered
Crystals, Cand. Sci. (Phys. -Math.) Dissertation, Leningrad : Inst. of
Semiconductors, USSR Acad. Sci., 1970.
[12] K. Uchino and S. Nomura, Ferroelectrics 17, 505 (1978).
[I 31 J. B. Goodenough, D. G. Wickham and J. W. CroA, J. Phys. Chem. Solids 5, 107
(1 958).
[14] M. A. Gilleo, J. Phys. Che~n. Solids 13,33 (1960).
[15] S. A. Ivanov, S.-G. Eriksson, R. Tellgren, and H. Rundlof, Experimental Report
486, 1 (2006).
[16] L. Mitoseriu, D. MarrC, A. S. Siri and P. Nanni, Appl. Phys. Lett. 83, 5509 (2003)
[17] L. Mitoseriu, D. Marre, A. S. Siri, A. Stancu, C. E. Fedor and P. Nanni, J. Opt. and
Adv. Motet-. 6 (2), 723 (2004).
[18] Z.-G. Ye and H. Schmid, J. Crystal Growth 167,628 (1 996).
[19] L. Feng and Z.-G. Ye, J. Solid State Chem. 163,484 (2002).
[20] I. E. Dzialoshinskii, Soviet Physics Jetp 5 (6), 1259 (1957).
[21] Y. Yang, J.-M. Liu, H. B. Huang, W. Q. Zou, P. Bao, and 2. G. Liu, Phys. Rev. B
70, 132 10 1 (2004).

Chapter 7: Mossbauer Spectroscopic Studies of
Pb(Fe213 WlI3)O3 and Pb(FeZl3 Wl13)03 -PbTi03
7.1 Introduction
The magnetic properties of PFW and (1-x)Pb(Fev3Wli3)03 - xPbTi03 [(I-x)PFW-
xPT] single crystals presented in the last chapter indicate that the magnetic transition
temperatures change with the PT content and that the different magnetic ordering occur
in the temperature range of 2 - 390 K (see Chapter 6).
On the atomic scale, the statistically random distribution of ~ e ~ + and w6+ on the
crystallographic B-site positions of the perovskite structure very likely affects the electric
field symmetry at the position of Fe nucleus, which should result in a hyperfine
interaction between the electric quadrupole moment of the Fe nucleus and the electric
field gradient at the nucleus. In addition, the magnetic field arising from the magnetic
ordering of ~ e ~ ' ions may interact with the Fe nuclear magnetic moment, giving rise to a
magnetic hyperfine interaction at the Fe nucleus, which is known as magnetic hyperfine
Zeeman splitting. The magnetic hyperfine interaction can bring about as many as six
gamma absorption peaks in the Mossbauer spectrum (sextet). Therefore, the Mossbauer
spectroscopic technique is a very useful tool to investigate these magnetic (or electric)
hyperfine interactions between the Fe nucleus and its magnetic (or electronic)

environments. The environment is closely related to the valence of the Mossbauer atom,
the structure of the compound, and its magnetic and electric properties.
Despite the unusual relaxor ferroelectric and magnetic properties of the PFW and
PFW-PT systems, and thereby their potential multiferroic features, there have been few
studies on the Mossbauer spectroscopy of PFW and PFW-based multicomponent material
systems, none of which was performed below liquid nitrogen temperature. Nomura et al.
[ l ] measured the Mossbauer spectra of the PFW ceramics at temperatures of 100 K and
400 K, and attributed the magnetic hyperfine Zeeman splitting in the Mossbauer spectra
of PFW at 100 K to the statistically random distribution of the ~ e ~ ' ions on the B-site
positions of the perovskite structure. The data suggested the existence of two sites of ~ e ~ +
ions with internal magnetic field strengths slightly different from each other. Uchino and
Nomura [2] investigated the Mossbauer spectra of the 0.6Pb(Fez13Wl13)03-
O . ~ P ~ ( C O ~ / ~ W ~ , ~ ) O ~ [0.6PFW-0.4PCWl solid solution at 295 K and 89 K, i.e. above and
below the "Curie" temperature of the system, and observed an asymmetric shape of the
paramagnetic Mossbauer spectrum with a doublet and singlet above the Curie
temperature. This was explained by the proposed model of two sublattices in which ~ e ~ +
ions fill in the different sites, giving rise to the different electric field gradients. Below
the "Curie" temperature, a ferrimagnetic Mossbauer spectrum composed of a main
central peak and a small sextet on the sides was observed. Because of non-resonant
scattering by the Pb and W nuclei, the Mossbauer spectra obtained in these two studies
were of relatively poor quality. It was felt that a systematic study of the Mossbauer
spectra in the PFW-PT system would be useful for providing a better understanding of
the complex magnetic interactions in this disordered structure.

In the present work, the 5 7 ~ e isotope-enriched PFW and 0.75PFW-0.25PT
ceramics prepared using a B-site precursor method were characterized by X-ray powder
diffraction and Mossbauer spectroscopic measurements. The Mossbauer spectra are
interpreted based on the magnetic interactions, disorder perovskite structure and the
composition.
7.2 Experimental Section
Ceramics of PFW and 0.75PFW-0.25PT solid solutions were prepared by a
modified B-site precursor method consisting of two-step reactions. A detailed description
57 of the method can be found in Chapter 3. The mixture of 33 % 57~e-enriched Fe203
(75% in abundance) and 67% normal Fe203 (>99.9%, Alfa) was used as iron oxide
starting material.
5 7 ~ e Mossbauer spectra of the PFW and 0.75PFW-0.25PT samples were recorded
using a Web Research spectrometer operating in transmission mode at temperatures
between 295 K and 4.4 K. In addition, Mossbauer spectroscopic measurements for PFW
above room temperatures, i.e. 353 K and 373 K, were carried out using a constant
acceleration Harwell Mossbauer drive. A 5 7 ~ o ~ (20 mCi) source was mounted on a
velocity transducer driven in a constant acceleration mode at room temperature. A
Reuter-Stokes proportional counter was used to monitor the 14.4 keV Mossbauer y-ray.
The spectra were calibrated using a 25 pm Fe foil spectrum obtained at room temperature
and isomer shifts are reported relative to Fe foil.

Powdered samples of around 100 mg were prepared on a Parafilm sheet and
sealed using Kapton tape. By using samples enriched in " ~ e , excellent quality Mossbauer
spectra were obtained.
Samples were cooled for the low-temperature studies in a Janis Research SHI-850
variable temperature closed-cycle refrigerator. For PFW, which was studied above room
temperature, the sample was mounted in a hole through an electrically heated copper
block, insulated with asbestos tap. The temperature at the sample was measured using a
thermocouple to + 2K. The WMoss (v. 2.5) Mossbauer spectral analysis software
supplied with the spectrometer was used to fit the Mossbauer data.
7.3 X-ray Diffraction
Figure 7.1 displays the X-ray powder diffraction patterns of the "~e-enriched
PFW and 0.75PFW-0.25PT ceramic samples. Both of them have a pseudo-cubic
perovskite structure, which is consistent with the phase diagram previously established in
Chapter 3 for the (1-x)PFW-xPT binary ceramic system where the phase transition from a
pseudo-cubic phase to the tetragonal phase usually happens as the PT content is increased
higher than 25% in the binary system.

Figure 7.1 : X-ray diffraction patterns of the 57~e-enriched PFW and 0.75PFW- 0.25PT ceramics at room temperature.
7.4 Mossbauer Spectroscopy of PFW and 0.75PFW-0.25PT
7.4.1 Mossbauer Spectroscopy of PFW
Figure 7.2 shows the Mossbauer spectra of PFW at 373 K and 353 K,
respectively. The quadrupole split doublet observed in these spectra has an isomer shift of
0.34 mmls and a splitting of 0.50 mmls, with a linewidth of 0.55 m d s . These parameters
are consistent with the high spin state of ~ e ~ ' . The 373 K spectrum can be fitted to a
single doublet. In contrast to the interpretations of References 6 and 7, there is no clear
evidence for two iron sites with different quadrupole splittings. The different iron sites
which arise from the random distribution of ~ e ~ ' and w6+ ions on the B-sites of the
perovskite structure, as shown in Fig. 7.3, appear to be indistinguishable in the
Mossbauer spectrum. PFW becomes anti-ferromagnetic below TN2 (= 340 - 370 K) [3, 4,

Chapter 61. As a result, in the 353 K spectrum (Fig. 7.2b), we begin to see the onset of
magnetic ordering which produces the broad background absorption on which the doublet
is still superimposed.
Velocity (mrnls)
Figure 7.2: Mijssbauer spectra of PFW at (a) 373 K and (b) 353 K.
The Mossbauer spectra of PFW at 295 K, 77 K and 4.4 K are shown in Fig. 7.4.
These spectra clearly show magnetic ordering and the doublet is no longer observed. The
magnetic field observed at the iron atoms increases as the temperature is lowered. This,
and the general form of the spectra at 353 K and 373 K, is consistent with the presence of
thermal relaxation which is greater at higher temperatures and which decreases as the
temperature is lowered. This would be consistent with the presence of chemical nano
regions within the material. For example, two types of nano regions can be found in Fig.
7.3. One shows a structure of the - ~ e ~ + - 0 - Fe3+ - and the other has a structure of the -
Fe3'-0-W-o-F~~'-. Within a nano region, the electron spins on the iron ions begin to
line up as the temperature is lowered below TN2, generating the magnetic field. However,
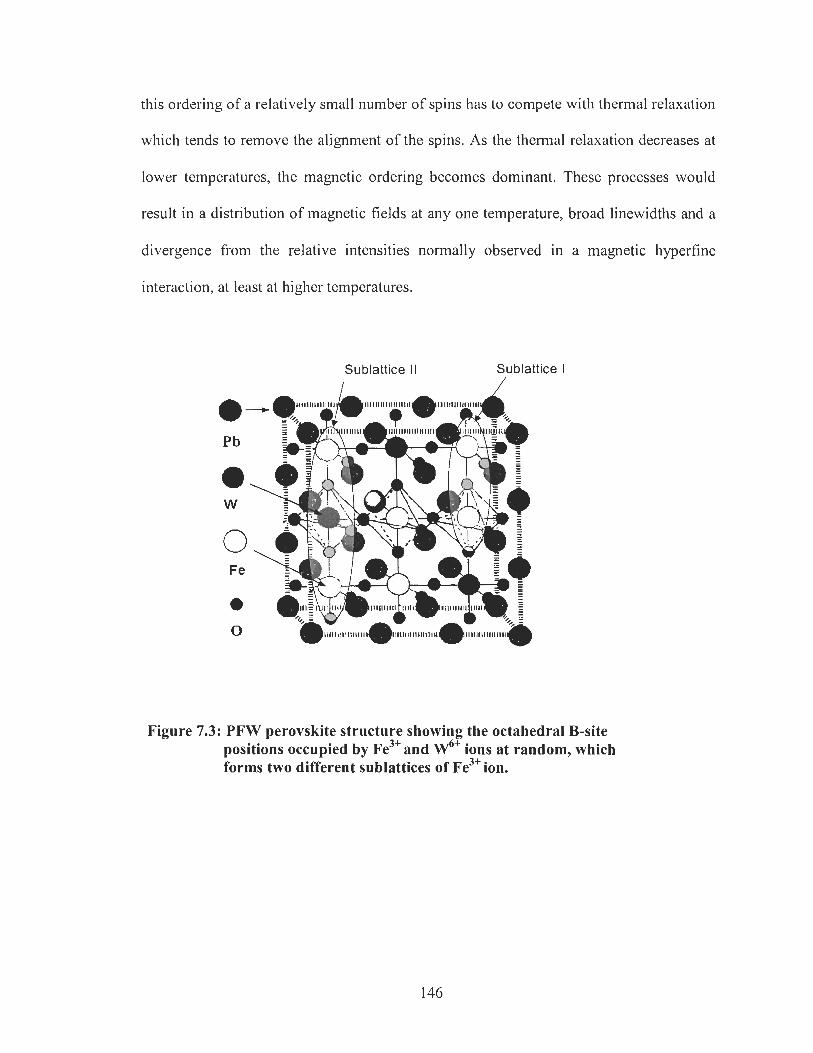
this ordering of a relatively small number of spins has to compete with thermal relaxation
which tends to remove the alignment of the spins. As the thermal relaxation decreases at
lower temperatures, the magnetic ordering becomes dominant. These processes would
result in a distribution of magnetic fields at any one temperature, broad linewidths and a
divergence from the relative intensities normally observed in a magnetic hyperfine
interaction, at least at higher temperatures.
Sublattice I I Sublattice I
Figure 7.3: PFW perovskite structure showing the octahedral B-site positions occupied by Fe3+ and W" ions at random, which forms two different sublattices of Fe3+ ion.

Velocity /mmil
Figure 7.4: Mossbauer spectra of the PFW samples at (a) 295 K, (b)77 K and ( c ) 4.4 K, respectively. The solid lines represent the fitting results.
According to the magnetization as a function of temperature reported in Chapter
6, at TN1=9.0 K the PFW material becomes weakly ferromagnetic due to a canted
antiferromagnetic interaction where the magnetic moments on the two sub-lattices
containing ~ e ~ ' are no longer anti-parallel but are at some angle to each other. The
spectrum at 4.4 K shows a normal magnetic sextet with H=530 kOe, suggesting the two
sub-lattices below 9.0 k have the same internal magnetic field.
As discussed above, the broadened linewidths of the 295 K and 77 K spectra can
be explained by the relaxation phenomenon that would result in a range of magnetic field
at a given temperature. However, these two spectra can also be fitted assuming the two
sub-lattices give rise to different magnetic fields at the two iron sites, at least above TNI.
Figure 7.5 shows the hyperfine field distributions obtained using the WMoss (v.2.5)
Mossbauer spectral analysis software assuming the two sites model. This interpretation
must be treated with some caution. It can be seen that the larger hyperfine field
distribution is attributed to the iron ions on site 1 in the disordered nanoregions of the
perovskite structure (see Fig. 7.3) because of a stronger magnetic interaction, and the
smaller one results from the iron ions on site 2 in the ordered nanoregion with a weaker
magnetic interaction. The total field distribution is contributed from the iron ions on the
two sites. Table 7.1 lists the Mossbauer parameters obtained based on the fitting of the
spectra. At lower temperatures, the isomer shifts keep in a range of 0.3-0.6 mms-',
indicating that the ~ e ~ + ion (3d5) exists in the form of the high spin state [I, 5, 61, which
is expected.
Table 7.1: Mossbauer parameters: isomer shifts [6 (mm")] and magnetic hyperfine fields [Hhf (kOe)] for PFW.
Temperature 1 Subspectrum 6 H hf

H y p e r f i n e field 1 k O e
0 100 200 300 400 500 600 700
Hyperfine field IkOe
0 1 0 0 2 0 0 3 D D 4 0 0 5 0 0 0 0 0 7 0 0
H y p e r f i n e field I k O e
Figure 7.5: Hyperfine field distribution of PFW at (a) 295 K, (b) 77 K and (c) 4.4 K, respectively. The site 1 and site 2 correspond to the fitted results.

7.4.2 Mossbauer Spectroscopy of 0.75PFW-0.25PT
The Mossbauer spectra of 0.75PFW-0.25PT at 295 K, 77 K and 4.4 K are shown
in Fig. 7.6. The dominant feature of the former two spectra is a quadrupole doublet with a
splitting of 0.6 m d s and an isomer shift of 0.4 to 0.5 mm/s (see Table 7.2), again
consistent with high-spin state of ~ e ~ + . The somewhat larger splitting observed here in
comparison with PFW can be rationalized in terms of the increasing disorder resulting
from the addition of PT to the system.
- (a) 295 K -2 -
-4 - -6 -
1 , 1 , 1 . I . I . I , I . I . I , I . I ,
0 C 0 .- p -2 2 2 -4 s -6
0
-1
-2 I . l . I . I , I . I . I , I . I . I . I .
-12 -10 -8 -6 -4 -2 0 2 4 6 8 10 12
Velocity 1mrn.s-'
Figure 7.6: Mossbauer spectra of the 0.75PFW-0.25PT sample at (a) 295 K, (b) 77 K and ( c ) 4.4 K, respectively. Solid lines represent the fitting results.

On cooling to 4.4 K the quadrupole split doublet is replaced by a magnetic
hyperfine interaction with a field of 500 kOe. The fact that the onset of magnetic ordering
occurs at a much lower temperature in 0.75PFW-0.25PT than in PFW is in agreement
with the dilution of the ~ e ~ + ions by the non-magnetic PT component. Magnetic
measurements reported in Chapter 6 on this phase show that it is anti-ferromagnetic
below 274 K and weakly ferromagnetic below 13 K.
The spectra at 295 K and 77 K contained, in addition to the doublet, a lower-
intensity magnetic component. The magnetic field strength of this component increased
somewhat in going from 295 K to 77 K. This component is also present in the spectrum
at 4.4 K and has a field strength at 4.4 K similar to, but somewhat larger than, that of the
primary magnetic component. The fact that the two magnetic field strengths are so
similar would be consistent with both arising from iron ions in similar lattice
environments. The major magnetic component observed at 4.4 K arises from iron ion on
B-site of the perovskite structure. But, the weak magnetic component at 295 K, 77 K and
4.4 K probably result from an impurity, most likely Fe203. As temperature is lowered, the
weak magnetic field was increased and the positions of two lines (#2 and #6) in the
spectra were moved clearly, which is very similar to Fe203. However, no peak of Fez03
was observed in the X-ray powder diffraction patterns. Further clarification is necessary
for the magnetic component at 295 K.
Again, an interpretation in terms of a two-site model is possible. The Mossbauer
parameters obtained from the fitting based on a two-sites model are listed in Table 7.2.
As mentioned above, all results on the isomer shifts and quadrupole splitting indicate that

the addition of PT component into the system does not change the high-spin state of ~ e ~ +
in the measured temperature range.
Table 7.2: Isomer shifts 6 (mm-I), quadrupole splitting (mm-l), and magnetic hyperfine fields [Hhf (kOe)] for 0.75PFW-0.25 PT.
The hyperfine field distribution at 4.4 K is presented in Fig.7.7 for 0.75PFW-
0.25PT. Compared with the field distribution of PFW at 4.4 K in Fig. 7.5, the hyperfine
field of 0.75PFW-0.25PT is smaller, but the corresponding half width of the peak is
wider. This suggests that the dilution of the ~ e ~ + ion by the non-magnetic PT component
results in an increase of disordered nano regions within the material, giving rise to a
broadened field distribution.
Temperature
(K) 295 K
77 K
4.4 K
Subspectrum
B-site 1 B-site 2 B-site 1 B-site 2 B-site
6 (mms-')
0.34 0.41 0.5 0.51 0.51
Quadrupole splitting
(mms-')
0.59
0.62
H hf
W e ) 525
542
500

0 100 200 300 400 500 600 700
Hyperfine field I kOe
Figure 7.7: H y p e t h e field distribution of 0.75PFW-0.25PT at 4.4 K.
7.5 Conclusions
The 57~e-enriched PFW and 0.75PFW-0.25PT ceramics have been prepared by a
B-site precursor method and characterized by X-ray powder diffraction and Mossbauer
spectroscopy down to 4.4 K for the first time. Both of the ceramic samples display a
pseudo-cubic perovskite structure.
Compared to previous reports on PFW, more clear Mossbauer spectra in the two
57~e-enriched compounds have been obtained in our experiments, which is beneficial to
the subsequent accurate analysis and interpretation of the Mossbauer spectra.
At the temperatures above the (high-temperature) antiferromagnetic transition
(TN2=340-370 K), the Mossbauer spectra of PFW show a doublet corresponding to the
quadrupole splitting due to the presence of the statistically random distribution of ~ e ~ +
ion on the B-sites of the perovskite structure. The onset of magnetic ordering was

observed at 353 K. As the temperature is cooled down to 295 K, 77 K and 4.4 K, the
doublet was gradually changed to a sextet, indicating that the magnetic hyperfine
interaction dominates the whole Mossbauer spectra below the antiferromagnetic
transition TN2. Because the low-temperature magnetic ordering (a canted
antiferromagnetic interaction) occurs at TN1 = 9 K, the spectrum at 4.4 K shows a normal
magnetic sextet with H = 530 kOe, suggesting the two sub-lattices below 9 K have the
same internal magnetic field. In addition, the spectra show evidence for the presence of
thermal relaxation between 4.4 K and 353 K.
On the other hand, the 0.75PFW-0.25PT solid-solution system displays different
Mossbauer spectra from PFW at 295 K and 77 K. The spectra consist of a doublet and a
lower-intensity magnetic component. In fact, the difference can easily be explained on
the basis of the lower onset of magnetic ordering in 0.75PFW-0.25PT than in PFW
because of the dilution of the el' ions by the non-magnetic PT component. Two
magnetic field strengths in 0.75PFW-0.25PT have been observed at 4.4 K. It is induced
that the major magnetic component could arise from iron ion on the B-site of the
perovskite structure and the weak one (also appears at 295 K and 77 K) is related to an
impurity phase.
Based on the two sites model that gives rise to different magnetic fields on the
two iron sites, the Mossbauer spectra of the PFW and 0.75PFW-0.25PT systems have
been fitted. As the temperature decreases, the magnetic hyperfine field strength in the
PFW system increases, indicating the increase of magnetic stability against thermal
relaxation. It is also found that the half width of the hyperfine field distribution of
0.75PFW-0.25PT is broader than that of PFW at 4.4 K, which suggests an increase in the

degree of disordered magnetic domain in nano regions resulting from the addition of the
non-magnetic component PT.
The chemical isomer shifts are within 0.3 - 0.6 mms-' and quadrupole splitting
are in a range of 0.5 to 0.6 mms-' for both PFW and 0.75PFW-0.25PT systems,
confirming that the magnetic ~ e ~ + ion exists in the form of high spin ~ e ~ + (3d5) state in
the measurement temperature range. The Mossbauer spectroscopic results are consistent
with the structural and magnetic behaviours of the PFW and PFW-PT systems reported in
the previous chapters.
7.6 References
[I] S. Nmura, M. Kaachi and F. Kojima, J. Phys. Soc. of Jpn 35, 1008 (1973).
[2] K. Uchino and S. Nomura, Ferroelectrics 17, 505 (1978).
[3] Z.-G. Ye, K. Toda, M. Sato, E. Kita and H. Schmid, J. Korean Phys. Soc. 32,
S1028 (1998).
[4] A. R. West, Basic Solid State Chemistry, John Wiley & Sons, Ltd., Chichester
(1 996).
[5] A. Vkrtes, L. Korecz znd K. Burger, Mossbauer Spectroscopy, Elsevier Scientific
Publishing Company, New York, 1979.
[6] S. Trudel and R. H. Hill, Polyhedron, in press, (2006).

Chapter 8: General Summary
8.1 Extended Summary of This Work
This work has contributed to a better understanding of the relationships of
properties, structure and composition in the unusual relaxor-based multiferroic (1-
x)PFW-xPT solid solution. It is composed of the following five parts:
i) Synthesis, structure and properties of the relaxor ferroelectric (1-
x)Pb(Fe2/3 W 1/3)03-~PbTi03 [(I -x)PFW-xPT] solid solution ceramics;
ii) Electrical microstructure and properties of the (1 -X)P~(F~~/~W~/~)O~-XP~T~O~
ceramics;
iii) Growth and electric characterization of the (l-~)Pb(Fe~/~W~~~)O~-xPbTi0~ single
crystals;
iv) Magnetic properties of the (l-~)Pb(Fe2/3Wl/~)O~-xPbTiO~ single crystals;
v) Mossbauer spectroscopic studies of Pb(Fe2/3W1/3)03 [PFW] and P b ( F e 2 ~ ~ W ~ / ~ ) 0 ~ -
PbTi03 [PFW-PT].
An extended summary of each part is provided in this chapter to highlight the
contribution of the work.

8.1.1 Synthesis, Structure and Properties of the Relaxor Ferroelectric (1- x ) P ~ ( F ~ ~ ~ ~ W ~ ~ ~ ) ~ ~ - X P ~ T ~ ~ ~ [(I-x)PFW-xPT] Solid Solution Ceramics
A modified B-site precursor method has been developed to prepare highly pure
solid solution of (1-x)PFW-xPT in the form of ceramics. It has been shown that this
synthesis route is superior to conventional oxide mixed method in the synthesis of the (1-
x)PFW-xPT ceramics with high quality perovskite structure and excellent dielectric
properties.
The detailed phase analysis and structural refinements based on X-ray diffraction
spectra at room temperature indicate that the perovskite structure of (I-x)PFW-xPT is
transformed from a pseudo-cubic phase (x < 0.25) to a tetragonal phase as the PT content
is increased to x 2 0.25. A complete tetragonal perovskite structure is observed at the PT
content x 2 0.35. It is possible that a morphotropic phase boundary is located in the
composition range 0.25 I x I 0.35, which probably displays different dielectric and
magnetic properties.
The temperature dependence of the dielectric permittivity measured at various
frequencies has shown that the temperature of permittivity maximum T, in PFW, a
characteristic of relaxor ferroelectric behaviour, increases with the increase of the PT
content, while the relaxor ferroelectric behaviour of the system is gradually transformed
into a normal ferroelectric state, as evidenced by the sharp and nondispersive dielectric
permittivity peaks at the ferrolparaelectric phase transition temperature Tc for x 2 0.25.
The second anomaly below T, (or Tc) on the temperature dependence of dielectric
constant has been clearly observed for the first time within the composition interval 0.25
I x I 0.35. This anomaly is further confirmed by DSC (Differential Scanning
Calorimetry) thermal analysis, as an addition thermal event at TMPB corresponding to a

morphotropic phase transition from the low-temperature rhombohedral (or pseudocubic)
phase to a tetragonal phase, in addition to the high-temperature ferro-lparaelectric phase
transition from the tetragonal to cubic phase at Tc. Therefore, the dielectric and thermal
analysis experimental results are in agreement with our prediction based on the
perovskite structural analysis.
A complete phase diagram for the (1 -x)PFW-xPT system has been established for
the first time. It clearly delimits the high-temperature paraelectric cubic phase and the
low-temperature ferroelectric rhombohedral (pseudocubic) and tetragonal (Plmm)
phases. The morphotropic phase boundary (region) is located in the composition range
0.25 5 x I 0.35, which separates the rhombohedral (pseudocubic) phase from the
tetragonal phase. Such a phase diagram is useful for understanding the structural and
physical properties of the multiferroic (1 -x)PFW-xPT system.
8.1.2 Electrical Microstructure and Properties of the ( l - ~ ) P b ( F e ~ / ~ W ~ / ~ ) 0 ~ - xPbTi03 Ceramics
The ferrolectric behaviour of polycrystalline ceramics is closely associated with
the electrical properties (dielectric constant, capacitance, conductivity, resistivity, etc.) of
microstructural components. Each microstructural component (phase) has individual
contribution to the total electrical properties of the ceramic system.
The combined complex ac impedance and electric modulus formalisms have been
applied for the first time to analyze the electrical properties of the (I-x)PFW-xPT
ceramics, with x = 0, 0.10, 0.20, 0.25, and 0.325, on the basis of ac impedance
spectroscopic measurements at various temperatures. Four different constituent phases
(bulk, grain boundary, ceramics-electrode surface diffusion, and minor phase) have been
found to make contributions to the total electrical behaviour of the systems. An
equivalent circuit composed of four RC elements connected in series was proposed to
simulate and interpret the complex impedance and corresponding modulus spectra. Bulk
(grains) and grain boundary phases are the main components making the electrical
contributions to the electroceramic materials of PFW-PT. The minor phase shows a very
small resistivity and a large electric modulus ( M ) , suggesting an insignificant electrical
contribution to the whole system.
It is also found that the bulk phase and grain boundary phase capacitances
(inversely proportional to the electric modulus) increase and reach their maximum values
upon cooling down to around the ferroelectric Curie temperature in the 0.75PFW-0.25PT
and 0.675PFW-0.325PT systems, showing the highest polar activities near the
ferroelectric phase transition. Especially, the capacitance arising from the bulk phase
increases more quickly than that from the grain boundary phase. Hence, it is concluded
that the dielectric/ferroelectric properties of the ceramics are controlled by the bulk
(grains) phase.
The frequency dependence of resistivity and dielectric permittivity of the
0.90PFW-0.10PT ceramics has been studied. It is found that the resistivity decreases in a
wavy form with the increasing frequency, demonstrating the capacitance impedance
effects on the resistivity of the electroceramic material at room temperature. The
dielectric constant decreases significantly with increasing frequency at the temperatures
above T,, but varies very slowly in a non-wavy form with frequency far below T,. The
former is related to the high-temperature frequency dispersion due to the electronic

conductance. The latter clearly shows the dynamic slowing down and freezing of the
polar clusters, giving rise to the attenuated relaxation behaviour.
8.1.3 Growth and Electric Characterization of Relaxor Ferroelectric Pb(FeZ13W1,3)03 -PbTi03 Single Crystals
Single crystals of the ferroic materials provide ideal specimens for characterizing
the dielectric/ferroelectric and magnetic properties, and are also expected to have superior
properties over the ceramic samples. Therefore, we have strived to synthesize the crystals
and to investigate their structural and physical properties.
Single crystals of the (1-x)PFW-xPT solid solution, with x = 0, 0.07, 0.13, 0.17,
0.27, and 0.75, have been successfully grown for the first time from the high temperature
solution using PbO as flux and characterized by X-ray diffraction, dielectric and
ferroelectric measurements. As the PT content is increased to x 2 0.27, the crystal
structure at room temperature starts to change from a pseudocubic to a tetragonal phase,
which is in accordance with the phase diagram established for the (1-x)PFW-xPT
ceramics system in Chapter 3.
The temperature and frequency dependences of the dielectric permittivity of the
(1-x)PFW-xPT crystals show a crossover from the relaxor ferroelectric behaviour in low
PT- content crystals to normal ferroelectricity in high PT-content crystals. The frequency-
dispersive dielectric maxima arising from the relaxor properties can be well fitted to the
Vogel-Fulcher (V-F) equation. The appearance of normal ferroelectric behaviour
indicates an enhanced correlation between dipole moments with the increase of PT-
content in the PFW-PT system. It is found that the grown crystals exhibit improved

dielectric properties with much smaller loss factor (tangent 6) than the ceramics at room
temperature.
The macroscopic polarization of the (1-x)PFW-xPT crystals, x = 0, 0.13, and
0.27, as a function of the applied alternating electric field has been investigated. The non-
linear polarization and a slim electric hysteresis loop obtained in PFW above the maximal
permittivity temperature T, further demonstrate the relaxor ferroelectric characteristic.
With the increasing PT content in the binary system, the enhanced ferroelectricity with
more opened hysteresis loops was observed around the transition temperature T, (or Tc).
At room temperature, the induced polarization as a function of electric field changes from
non-linear, to a slim, and then to a general electric hysteresis loop for PFW, 0.87PFW-
0.13PT, and 0.73PFW-0.27PTY respectively, indicates that the addition of PT component
enhances the ferroelectric order range through the ferroelectrically active ~ i ~ + i o n s on the
B-site of the perovskite structure.
8.1.4 Magnetic Properties of the (1-x) Pb(FeznWln)03 -xPbTi03 Single Crystals
Apart from the relaxor ferroelectric behaviour, PFW also exhibits peculiar
magnetic properties because of the presence of the paramagnetic ~ e ~ + ions. The
magnetization of the single crystals of the (1-x)PFW-xPT solid solution, with x = 0, 0.07,
0.27 , and 0.75, have been measured as a function of temperature and magnetic field.
Two types of antiferromagnetic orderings and a succession of magnetic transitions with
the PT content dependence of Nee1 temperature, have been observed at TN2 = 370 K, 285
K, and 274 K, and TNI = 8.5 K, 11 K, and 12.5 K, in the (1-x)PFW-xPT crystals, with x =
0, 0.07 and 0.27, respectively. The antiferromagnetic orderings are explained on the basis

of the superexchange magnetic interaction mechanism through - Fe3+- 0 - Fe3+- and -
Fe3+ - 0 - W - 0 - Fe3' - pathway, respectively. It is found, interestingly, that the low-
temperature magnetic transition from the weakly ferromagnetic to antiferromagnetic
phase increases with the increase of PT content x from 0 to 0.27, and then vanishes as x is
continuously increased to 0.75. On the other hand, the (high-temperature)
antiferromagnetic-to-paramagnetic phase transition temperature decreases and then
disappears with the PT content increasing.
It is suggested that two different factors affect the magnetic transitions in the (1-
x)PFW-xPT system. The "dilution" of the concentration of the magnetic ion Fe3+ by the
addition of the non-magnetic PT component generally destabilizes the magnetic ordering
of the substance. On the other hand, the decrease in the distance of magnetic interaction
due to lattice contraction of the perovskite structure gives rise to a stronger magnetic
coupling between adjacent Fe3+ ions in the system. The former is responsible for the
vanishing of the low-temperature and high-temperature magnetic orderings at TN1 and
TN2, respectively, as the amount of PT component is increased to a large extent (x 2
0.75). The latter plays an important role in the shifting towards higher temperature of the
low-temperature magnetic transition and the enhancement of the weak ferromagnetism
against thermal agitation with the increasing PT amount in the low-PT content crystals (x
I 0.27). In this way, the substitution of the non-magnetic PT for PFW actually enhances
the ferromagnetic interaction at low temperature in the PFW-PT solid solution. Such an
unusual behaviour has never been reported in detail in this system. A partial magnetic
phase diagram has been established, which clearly delimits the paramagnetic,

antiferromagnetic, and weak ferromagnetic phases by the low-temperature and high-
temperature magnetic transition temperature curves.
The macroscopic magnetization of the crystals (1-x)PFW-xPT under an
alternating magnetic field has been measured at various temperatures. In the PFW,
0.93PFW-0.07PT and 0.73PFW-0.27PT crystals, the magnetization curve M(H) at 1.9 K
displays a slim hysteresis loop, indicating the weak ferromagnetic behaviour. The
remnant magnetization and the hysteretic effect also increase with the PT content
increasing from 0 to 0.27 and decreases with the further increase of the PT content. A
nonlinear magnetization curve M(H) appears in the temperature range of TNI-TN2,
revealing that the magnetic ordering is transformed from the ferromagnetic into
antiferromagnetic phase upon heating. At temperatures above the high-temperature
magnetic transition temperature T N ~ , a perfect linear relationship between the
magnetization and magnetic field is displayed, which obeys the Curie-Weiss law. Hence,
the crystals are in the paramagnetic state. For the 0.25PFW-0.75PT crystal, a
paramagnetic feature exists nearly in the whole measured temperature range (at least 2 10
K), suggesting that the long-range magnetic ordering have been destroyed as a result of
high-substitution of the non-magnetic ~ i ~ + ion for ~ e ~ + ion and that ~ e ~ + ions are
embedded in magnetically isolated nanoregions in the complex perovskite. The
magnetization induced by magnetic field decreases with the increasing amount of PT
component.
Therefore, as the perovskite structure gradually changes from a pseudo-cubic to a
tetragonal phase by increasing the amount of ferroelectric and non-magnetic PT
component in the PFW-PT binary system, the nature of dipole interaction transforms

from the relaxor ferroelectric short-range order to the ferroelectric long-range order. At
the same time, the low-temperature magnetic ordering slightly shifts toward a higher
temperature with enhanced weak ferromagnetism and then disappears, while the high-
temperature magnetic transition moves toward lower temperature and then disappears. In
addition, the anomalies on the temperature dependence of dielectric permittivity and
enhanced magnetic hysteresis loop just happen near the compositions showing
morphotropic phase boundary. These observations point to the intrinsic relationships
among the microstructure, composition, dielectric and magnetic properties, and
demonstrate the intriguing multiferroic features of the PFW-PT system.
8.1.5 Mossbauer Spectroscopic Studies of Pb(Fe2/3W113)03 and Pb(FezI3Wll3)O3- PbTi03.
In order to study the effects of the magnetic (electric) properties on the Mossbauer
spectra of the (1-x)PFW-xPT system, the 57~e-enriched PFW and 0.75PFW-0.25PT
ceramics have been prepared and characterized for the first time by Mossbauer
spectroscopy at temperatures between 373 K and 4.4 K.
At temperatures above the high-temperature magnetic ordering TN2, the
Mossbauer spectra of PFW display a quadrupole split doublet related to the presence of
the statistically random distribution of ~ e ~ + ion on the B-sites of the perovskite structure.
But, there is no obvious evidence for the two iron sites showing different quadrupole
splittings reported by other authors. As the temperature is lowered to 295 K, 77 K and 4.4
K, a sextet occurs in the Mossbauer spectra, indicating that the antiferromagnetic
ordering is established within PFW. In particular, the spectrum at 4.4 K shows a normal
magnetic sextet with the magnetic field of 530 kOe. Therefore, it is suggested that the
iron ions at two sub-lattices in the disordered perovskite structure have the same internal
magnetic field at temperatures below the low-temperature antiferromagnetic transition
(TNI = 9.0 K), because the weakly ferromagnetic behaviour was observed in the
magnetization measurements of the PFW single crystal, as a function of temperature and
magnetic field. The linewidths of distribution of magnetic fields of PFW become narrow,
revealing that the magnetic field gradually increases and thermal relaxation decreases
upon cooling.
On the other hand, the Mossbauer spectra of 0.75PFW-0.25PT at 295 K and 77 K
are composed of a doublet and a lower-intensity magnetic component, which indicates
that the onset of magnetic ordering occurs at a lower temperature in 0.75PFW-0.25PT
than in PFW after the dilution of the ions by the non-magnetic PT component. On
cooling to 4.4 K, the magnetic sextet dominates the Mossbauer spectrum, showing a
strong internal magnetic field arising from the weakly ferromagnetic due to a canted
antiferromagnetic interaction in the material at very low temperature. It is suggested that
the major magnetic component at 4.4 K arises from ~ e ~ + ion on the B-site of the
perovskite structure and the weak magnetic component observed at 295 K 77 K, and 4.4
K probably results from an impurity phase, most likely Fe203.
The Mossbauer spectra have also been fitted assuming the two-sites model. The
different hyperfine field distributions of the iron ions from two sub-lattices of the
perovskite structure were obtained at least above the magnetic transition TN1 for PFW. It
is found that the half width of the hyperfine field distribution of 0.75PFW-0.25PT is
broader than that of PFW at 4.4 K, suggesting that the degree of disordered magnetic
domain is enhanced by the addition of non-magnetic component into the system.

The chemical isomer shifts and quadrupole splitting are obtained at various
temperatures, indicating the presence of high-spin state of ~ e ~ ' .
In conclusion, a synthetic method for the preparation of highly pure ceramics and
single crystals of the P b ( F e 2 1 ~ W ~ / ~ ] 0 ~ -PbTi03 [PFW-PT] solid solution has been
developed. The dielectric/ferroelectric and magnetic properties of the binary system have
been investigated, which reveals the intrinsic relationships of properties, structure and
composition.