magnetic tape rapid search
TRANSCRIPT

(2, 3). Pseudocontact shifts result from direct interaction between the magnetic dipoles of the unpaired electrons of the paramagnetic metal and the magnetic dipoles of the ligand nuclei (8-10). The pseudocontact interaction is transmitted through space, even when there is no covalent bonding (II), and is attenuated as the distance from the paramagnetic ion increases. Thus the magnitudes of the downfield shifts for the nonequivalent carbon-bonded protons of alcohols bonded to Eu(DPM)$ depend mainly on the distance between the europium and the protons.
The dependence of the shift gradient for a particular pro- ton on the distance from the hydroxyl group should prove use- ful in structural studies (12). From the data in Tables I1 and 111, the average shift gradients a t 30 “C are 23.0, 13.4, 8.6, 4.2, 2.4, 1.5, and 0.9 ppm for carbon-bonded protons sepa- rated from the hydroxyl group by one, two, three, four, five, six, and seven carbons, respectively.
(8) D. R. Eaton and W. D. Phillips, Aduan. Magn. Resonance, 1, 103 (1965).
(9) P. J. McCarthy, “Spectroscopy and Structure of Metal Chelate Compounds,” K. Nakamoto and P. J. McCarthy, Ed., John Wiley and Sons, Inc., New York, N. Y., 1968, p 309.
(10) H. J. Keller and K. E. Schwarzhans, Angew. Chem., Int. Ed. Engl., 9, 196 (1970).
(11) G. N. LaMar, J . Chem. Phys., 41, 2992 (1964). (12) D. R . Crump, J. K. M. Sanders, and D. H. Williams, Tetra-
hedron Lett., 4419 (1970).
Analysis of Mixtures. The problem in the analysis of multicomponent alcohol mixtures by N M R is one of obtaining a resolved analytical resonance for each component to be ana- lyzed. In some cases, analytical resonances can be resolved by using a spectrometer of a higher magnetic field strength. The examples in Figures 3-6 demonstrate that utilization of the shifting ability of E u ( D P M ) ~ provides a n alternative method for resolving analytical resonances for the components. The amenability of other alcohol mixtures to analysis by NMR using this approach can be predicted with the data in Tables I1 and 111. Thus, many mixtures whose spectra were previ- ously characterized by overlapping resonances are now suscep- tible to analysis by proton magnetic resonance spectrometry.
We are also investigating the application of E U ( D P M ) ~ and other paramagnetic shift reagents t o tne analysis of multicom- ponent mixtures of compounds containing other functional groups, including amines, esters, ethers, and ketones.
ACKNOWLEDGMENT
It is a pleasure t o acknowledge the technical assistance of Mr. F. Baudais in several phases of this work.
RECEIVED for review April 30, 1971. Accepted June 28, 1971. Presented before the Division of Analytical Chemistry, 161st National Meeting, American Chemical Society, Los Angeles, Calif., March 29, 1971. This work was supported, in part, by a grant from the National Research Council of Canada.
Small Computer, Magnetic Tape Oriented, Rapid Search System Applied to Mass Spectrometry
L. E. Wangen, W. S. Woodward, and T. L. Isenhour Department of Chemistry, Uniaersity of North Carolina, Chapel Hill, N . C. 27514
A fast search procedure capable of searching a spec- tral library at a rate of 10000 16-bit words per second directly from magnetic tape has been developed for a small computer. No computer memory is devoted to library spectra. A library of 6652 low resolution mass spectra with 352 mass positions coded to peak/no peak information can be completely searched for nearest as well as perfect matches in 15 seconds. Statistical considerations and some principles of in- formation theory are used to reduce to 48 the number of bits necessary to code a mass spectrum with mini- mal loss of pertinent information. Mass positions that consistantly correlate throughout the data set are combined such that all spectra are reduced in dimensionality by the same procedure. This makes it unnecessary to perform any decoding operations on library spectra prior to or during the search. Re- sults are presented for searching 352 dimensional spectra as well as the same spectra reduced to 80 and 48 dimensions.
THE AVAILABILITY of large libraries of spectrometric data in computer compatible form has led t o an increasing use of spectral comparison as a n aid t o structure determination and compound identification. Powder diffraction files have been utilized i n mineral identification while the use of infrared and mass spectra in compound identification has become of
increasing import as spectra libraries (1-5) are made available. Several recent papers have dealt with the numeric representa- tion of the data and methods for efficient search and com- parison.
Anderson and Covert ( I ) reported a system developed for infrared data on the IBM 7080 computer. As many as 20 spectral terms (adsorption maxima or no absorption) and 15 chemical classification terms together with melting or boiling point information could be compared with the library spectra to identify a compound. This system allowed for a *O.l-pm ambiguity in the wavelength of adsorption peaks and could search for five unknowns at a time giving up to the 100 best matches for each unknown. They achieved a rate of 167 spectral comparisons per second. Erley (2) com- pacted the ASTM infrared file into 10 16-bit words per spec- trum and used logical operations to perform comparisons. The data coding included chemical group and elemental
(1) D. H. Anderson and G. L. Covert, ANAL. CHEM., 39, 1288
(2) D. S. Erley, ibid., 40, 894 (1968). (3) D. S. Erley, Appl. Spectros., 25, 200(1971). (4) F. E. Lytle, ANAL. CHEM., 42, 355 (1970). ( 5 ) F. E. Lytle and T. L. Brazie, ibid., p 1532.
(1967).
ANALYTICAL CHEMISTRY, VOL. 43, NO. 12, OCTOBER 1971 1605
information in addition to the spectra. His searching pro- cedure requires that the library and the unknown spectra have exactly the same peaks present although there may be a =kO.l-pm ambiguity in peak position. This assembler lan- guage search program required about 7000 16-bit words of memory in the IBM-1130 computer. It could search loo0 spectra (10000 16-bit words) per second from disk data files. [Where possible, for comparative purposes, search speeds are given in number of 16-bit words (a common computer word size) searched per second.] More recently Erley (3) mentions, but doesn’t elaborate on, a more flexible extension of the above searching procedure that allows one or more complete mismatches between the unknown and standard spectra.
Lytle ( 4 ) reported a computerized search developed on portions of the infrared data in Sadtler’s Spec-Finder. The Spec-Finder library contains the position of the most intense absorption in each of the 1.0-pm intervals from 2 through 14 where each micrometer interval is divided into ten subintervals of 0.1 pm width or, in case a given micrometer interval con- tains no maximum, a no absorption is recorded. Thus of eleven possibilities for each micrometer interval corresponding to a given compound, only one is recorded. Lytle organized the data into 943 separate files according to wavelength sub- intervals such that there was a file corresponding to every 0.1-pm interval or no absorption possibility. Each file con- tained a position (bit) for every compound in the collection. The bit was on if the position corresponded to the compounds most intense absorption in the appropriate 1.0-pm interval, otherwise it was of, Thus only of the total bits are on. A major advantage of this method is that only those files corresponding to the unknowns’ absorption maxima are searched. In addition, these files are input to the computer sequentially, thus reducing computer memory requirements. This system, although not allowing any ambiguity in peak position, does give closest matches as well as perfect matches. The method searches for only one unknown at a time but can search 20000 to 30000 spectra a t a rate of approximately loo0 per second in a computer with 8000 16-bit words of memory using paper tape input.
More recently Lytle and Brazie (5) reported a method using statistical compression of the same infrared compilation. They used statistical considerations and principles of informa- tion theory in a n attempt to maximize information content relative to the number of bits used to represent the data. The idea is to reduce the number of bits needed to store the data with a minimal loss of information. Each spectrum is com- bined and packed into 1 16-bit word and the data are input to the computer in blocks from disk. The number of spectra that can be searched per second depends on the amount of memory available as a n input buffer. In this case an XDS Sigma 5 computer with 16000 32-bit words of memory was used allowing a maximum search speed of 18000 16-bit spectra per second for a single unknown. The method as presented requires perfect matches and doesn’t allow any ambiguity in peak position. However perfect matching is undoubtedly a program imposed limitation rather than a characteristic of the general method.
Jurs (6) used “hash coding” to obtain near optimum speeds for retrieval from computer memory of perfect matches of simulated infrared spectra, This method gives fast retrieval with only a fraction of excess memory, however it suffers from the inherent disadvantage of allowing no room for error in experimental data acquisition.
(6) P. C. Jurs, ANAL. CHEW, 43, 364(1971).
1606 ANALYTICAL CHEMISTRY, VOL. 43, NO. 12, OCTOBE
Of the above search systems the first two have been ex- tensively tested. Erley (3) makes some practical suggestions for quantitative comparison of infrared search systems and presents data comparing three different search algorithms.
A further area of current interest is the coding and searching of mass spectra. Knock et al. (7), compared various matching methods using the most intense peaks for compound identifica- tion from low resolution mass spectra. Attempts were made to compensate for instrumental variations by dividing the spectrum into equal ranges, each containing the same number of mass units. In each mass range, the n most intense peaks are retained in order of decreasing intensity. Corresponding mass positions are then compared as usual. A success rate of 97 was reported, and similar compounds were generally retrieved in addition to the unknown. Therefore the method appears useful even when the unknown is not included in the library. A limited range of molecular weights is searched t o reduce time and memory requirements. Search time de- pends on several variables and ranges from 3 to 30 seconds per unknown for a file of 8000 spectra on direct access disk with an IBM 360/50 computer. Hertz et a/. (8) report a search procedure designed for use with a GLC-MS system. The method of representing the mass spectra is similar to one described more generally in reference 7. In the work by Hertz et a/., the two largest peaks in each 14-mass unit interval beginning with mass position 6 are retained to form a n “ab- breviated” mass spectrum, This method is intended to allow reduction of the spectrum while retaining “interpretively” significant peaks. The search procedure involves extensive preprocessing to eliminate the necessity of making exhaustive comparisons of dissimilar spectra. After preprocessing de- tailed comparisons are made with the selected standard spectra by a ratio method. The system has been extensively tested and a high success rate is reported. Approximate search time for processing a library of 7600 abbreviated low resolu- tion mass spectra from disk with an IBM 1800 computer is 2 minutes per unknown.
In related work, Grotch (9) did an extensive study designed to ascertain the feasibility of using low resolution mass spectra coded as peak/no peak information for compound identifica- tion. Each mass position in a spectrum is coded to one bit, if the peak intensity in that position is greater than a given fraction of the base peak, the bit is on; if not, the bit is of. Exhaustive comparisons were made using various fractions of the base peak (transition levels) as cut offs and this method of encoding was shown to retain much useful information. His results indicate that a compound could be identified by searching a library of mass spectra encoded in this way. In addition this method of coding offers a substantial savings in storage and, as will be shown below, lends itself nicely to efficicnt searching.
This work presents a search procedure developed on (but not restricted to) the Atlas of Mass Spectral Data compilation (IO); the procedure incorporates many of the desirable features of earlier work including speed, minimal memory requirement, and applicability to real data and is designed to operate on a small computer system.
If a search system is to be practical for spectrometry data, it should have the following two attributes. The data should
(7) B. A. Knock, I. C. Smith, D. E. Wright, and R. G. Ridley,
(8) H. S . Hertz, R. A. Hites, and K . Biemann, ibid., 43, 681 (1971). (9) S. L. Grotch, ibid., 42, 1214(1970). (10) “Atlas of Mass Spectral Data,” E. Stenhagen, S. Abrahams-
son, and F. W. McLafferty, Ed., John Wiley and Sons, New York, N. Y., 1969.
ANAL. CHEM., 42, 1516 (1970).
:R 1971

:::I 100
MOLECULAR WEIGHT D I S T R I B U T I O N
MOLECULflR WEIGHT Figure 1. Molecular weight distribution of the 6652 low resolution mass spectra
be coded and the search performed so as to allow successful retrieval given the nearly unavoidable experimental and human errors resulting from data collection-Le., the coding should retain sufficient redundancy such that close matches are meaningful and the search should find such near misses. The results of searching for unknowns not contained in the library should be intuitively meaningful. These two factors are closely related.
The development of a search and retrieval system logically concerns two related problems-representation of the data and the search algorithm. These will be discussed separately.
SPECTRUM REPRESENTATION AND CODING
The usual approach for search and retrieval of mass spectra is to select a given number of the most intense peaks, assuming that these are most important for compound identification. This selection reduces both the time and storage requirements of a search system; retaining the complete spectrum including intensities presents an inordinate amount of data for storage and searching. Additional savings can be realized if peaks are coded in order of decreasing intensity rather than as actual intensity. This is the basic approach successfully taken by Knoch er al. (7). However the work of Grotch (9) indicates that there may be sufficient information for compound identi- fication when the entire spectrum is retained with peak height encoded to only one bit. Because this representation lends itself nicely to computer coding and searching, it was decided to investigate its utility with the Atlas library.
The Atlas of Mass Spectral Data used in this study consists of6652 low resolution mass spectra including all peaks present a t intensities greater than 0.1 of the base peak (transition level of 0.1%). The spectra were originally measured by a variety of laboratories using different instruments, but were all obtained by electron-bombardment ionization, generally between 30 and 100 eV. There are about 5000 different com- pounds represented in the compilation; however, all 6652 spectra were retained because duplications resulting from different laboratories allow an estimation of a search methods applicability under actual experimental conditions. The elemental statistics, molecular weight distribution, and mass
Table I. Statistics of the 6652
No, of compounds containing" Mass Spectra in the Atlas Compilation
C 6607 H 6216 0 3521 CI 792 N 5 36 S 467 F 29 5 Br 259 D 90 Si 48 I 42 P 10 C'* 1 C'S 1 Av no. peaks 2 0.1 86 Av molecular weight 167 Av no. of elements 3
Each elemental symbol implies the normal isotopic distribution unless indicated otherwise.
fragment populations of the original spectra are shown in Table I and Figures 1 and 2, respectively.
Three transition levels (0.1, 1.0, and 5.0p7,) were tested to ascertain the utility of each for spectral representation. To completely perform this task would require matching each spectrum with every other spectrum at each transition level for all 6652 spectra-a large expenditure of computer time. However, it is a relatively fast computer task to sort the spectra after coding and packing the data into computer words. Once sorted, a single iteration through the 6652 spectra, writ- ing out neighbors that match perfectly, will provide all identi- cal spectra. In this way, the perfect matches can be obtained although not the close matches or the average number of disagreements. The number of perfect matches at each transition level together with the type of compounds involved in such matches is shown in Table 11. The table shows that the number of perfect matches increases with transition level and indicates that the information loss is going from a transi-
ANALYTICAL CHEMISTRY, VOL. 43, NO. 12, OCTOBER 1971 1607

I t 90 --- 4
30
20
10 r 0 0
0 . 1 X TRRNSITION LEVEL
15 30 +S bO 75 90 105 120 135 IS0 165 180 195 210 225 290 2S5 270 285 300 315 330 395 3 0
M A S S P O S I T I O N Figure 2. Percentage of spectra having a given mass fragment at a 0.1 % transition level
Table 11. Comparison of Number of Perfect Matches at Transition Levels of 0.1 %, 1.0 %, and 5.0
Chemical characteristics of matching spectra
Related No. structure
Transition matching spectra Com- Similar miscel- level, groups" involved pound isomer laneous
0 . 1 167 3 70 112 42 14 1 . O 209 45 1 156 38 15 5 . 0 376 836 335 98 43
a Matching groups in some cases contain several spectra meaning that the same compounds, similar isomers and related structure, or miscellaneous can all occur in a given matching group.
perfectly No. Same or
tion level of 0.1 to 1.0% is small relative to the comparable loss a t 5.0%. Most of the perfect matches derive from identi- cal compounds while those remaining are predominantly
similar isomers. Thus it appears that using a transition level of 1 .O
In addition to showing that peak/no peak coding of mass spectra is useful for compound identification, the tests at levels other than the original of 0.1 % were prompted by noise and/or contamination considerations. Higher transition levels are desirable for minimizing the effect of spectral noise, i .e., an extremely low transition level would result in a peak at every position. These considerations (noise us. information loss) prompted a compromise in favor of a 1.0% transition level and further discussion is with respect to this level. It should be noted that the representation of the mass spectra by 352 positions was purely a matter of convenience. It is believed that the spectra could be equally well represented by about 300 positions with all fragments greater than 300 as- signed to one of the other positions.
as opposed to 0.1 would be quite acceptable.
REDUCTION OF DIMENSIONALITY The average number of peaks per spectrum at a 1.0% transi-
tion level is 5 5 and as shown in Figure 3 , the majority of mass
1. .0 % TRRNSITION LEVEL
0
MASS POSITION Figure 3. Percentage of spectra having a given mass fragment at a 1.0% transition level
1608 ANALYTICAL CHEMISTRY, VOL. 43, NO. 12, OCTOBER 1971

positions are sparsely populated, hence an average mass spectrum will contain predominantly zeros. Thus when the entire mass spectrum is coded, the information content of many mass positions is very low. In information theory, information entropy provides a quantitative measure of the inherent information of a source. If, as in the case under discussion, there are only two possible states’ per channel (e .g . peak/no peak), the information entropy per channel (mass position) is given by
- [ p log2 p + (1 - P ) log, (1 - p)l; 0 I P I 1 (1) h =
where p i s the probability of the given mass position containing a peak (the fraction of spectra having the given mass frag- ment). The total entropy is obtained by summing over all channels. Equation 1 is a maximum at p = ’/? implying that the information content will be maximized when all bits (mass positions) are on for exactly half the compounds in the library. If the actual number of bits of an information source are most efficiently utilized, the entropy will have its maximum possible value-i.e., it will be numerically equal to the number of real bits. This efficiency concept is quantified by the rela- tive entropy defined as the actual (measured) entropy divided by the maximum possible entropy of the information source. Thus for ten data bits with a n entropy of 8.5, the relative entropy is 0.85; and the efficiency of the representation is 85 %.
If possible, different transition levels might be chosen for each mass position such that the bit corresponding to that position would be on half the time. However as shown by Figure 2 most positions are on for less than 50% of the library spectra making this impossible. Even if this procedure were possible, noise considerations would make it less useful. An alternative approach, similar to one taken by Lytle and Brazie (5), is to combine various mass positions such that the re- sultant bit position will have 50% occupancy. For example Figure 3 shows that if mass positions 86 and 87 (p’s of 0.236 and 0.246, respectively) are combined, the resultant bit would be an for about 48 % of the compounds assuming few correla- tions between the two mass positions. If such a procedure is carried out for the entire spectrum, a reduction in dimen- sionality will result. Hopefully, the accompanying loss of total information will be less significant. Thus for cases where the data contain many zeros, it might be possible to drastically reduce the number of bits required to represent a spectrum with a minimum, loss in total information content. (The lost information can be calculated using Equation 1.) As always a compromise must be made, in this case between dimensionality reduction and information content (efficacy of the resulting spectral representation).
One procedure of reduction involves arbitrarily combining various mass positions, the sole criterion being that the individual occupancy levels sum to -50%. This procedure reduced the number of bits used to represent a spectrum from 352 to 80. The perfect matches in addition to those originally present a t a 1.0% transition caused by this reduction are shown in Table 111 as are the entropy calculations (Equation 1). It is apparent that there has been a significant decrease in entropy compared to the original spectra; however the amount of important information lost as measured by additional matching groups seems quite acceptable, considering the large reduction in dimensionality. Of 51 additional matching groups, 35 are either’identical or similar isomers while the majority of the remainder are structurally very similar, e .g . , differing only in length of carbon chain.
Further dimensionality reduction can be accomplished by using the correlations between various mass positions. For
Chemical charac- terization of
fectly additional matching per-
Table 111. Information Loss at 1.0 Transition Level Due to Reduction of the Mass Spectra from 352 to 80 and 48
Dimensions (“Mass” Positions) 80- 48-
Dimensions Dimensions 230 No. additional perfectly matching groupsa 51
22 76 Same 13 115 Similar isomers
Related structure 16 60
No. spectra involved in matching groups 115 555
Relative entropy (coding efficiency), % 95.8 95 .5 Total entropy (Equation 1) 76.5 45 .8
Decrease in entropy with respect to 352- dimensions at a 1.0% transition level 5 5 . 2 85 .9 a See footnote to Table 11.
example when mass positions 86 and 87 are combined, the resultant bit is turned on if either 86 or 87 or both contain a peak giving an apparent p of 0.48 for the bit. Actually this value is an upper limit for p . In reality if position 86 contains a peak, there is a 56% probability that position 87 also con- tains a peak. When the two are combined, the resultant bit will be turned on by peak 86 only 44% of the time that 86 actually contains a peak because, for the other 56% of the spectra that have a fragment a t position 86, the bit will have already been turned on by position 87. Thus the resultant bit will be on for 35% rather than 48% of the compounds or p = 0.35.
A measure of how well two mass positions correlate can be obtained by logically anding the corresponding 6652-dimen- sional vectors and summing the result. These operations are identical to the dot product of two mass positions treated as vectors, each vector containing an entry for every spectrum. Not surprisingly the best correlations were obtained for posi- tions separated by 1, 2, 13, 14, and 15 mass units correspond- ing to 1 H, 2 H’s, CH, CH?, and CHI fragments, respectively. N o other masses gave significant correlation. This does not suggest that strong correlations do not occur between various mass positions for specific classes of compounds as these would not necessarily be discovered by performing the calcula- tion with all classes of spectra.
This correlation information was used as an aid in combin- ing mass positions that correlate well in an attempt to obtain maximum reduction of dimensionality consistent with maxi- mum average entropy per channel and minimum loss of important information. Thus positions differing by 1, 2, 13, 14, and 15 mass units were most commonly combined. The spectra were reduced to 48 dimensions by this method. The average p was 0.45. The additional matching groups together with the entropy calculations are shown in Table 111. The additional perfect matches again consist primarily of identical compounds, similar isomers, or structurally related com- pounds of a different molecular weight. As might be ex- pected, the result of the large reduction in dimensionality is to make the near neighbors closer to the unknown. Another perhaps unexpected result is that the near neighbors are often more intuitively meaningful. This is undoubtedly an effect of combining highly correlating mass positions.
CODING LOGIC AND SEARCH ALGORITHM
Computer hardware is most efficiently utilized by perform- The search system ing operations on “word” size bit strings.
ANALYTICAL CHEMISTRY, VOL. 43, NO. 12, OCTOBER 1971 1609
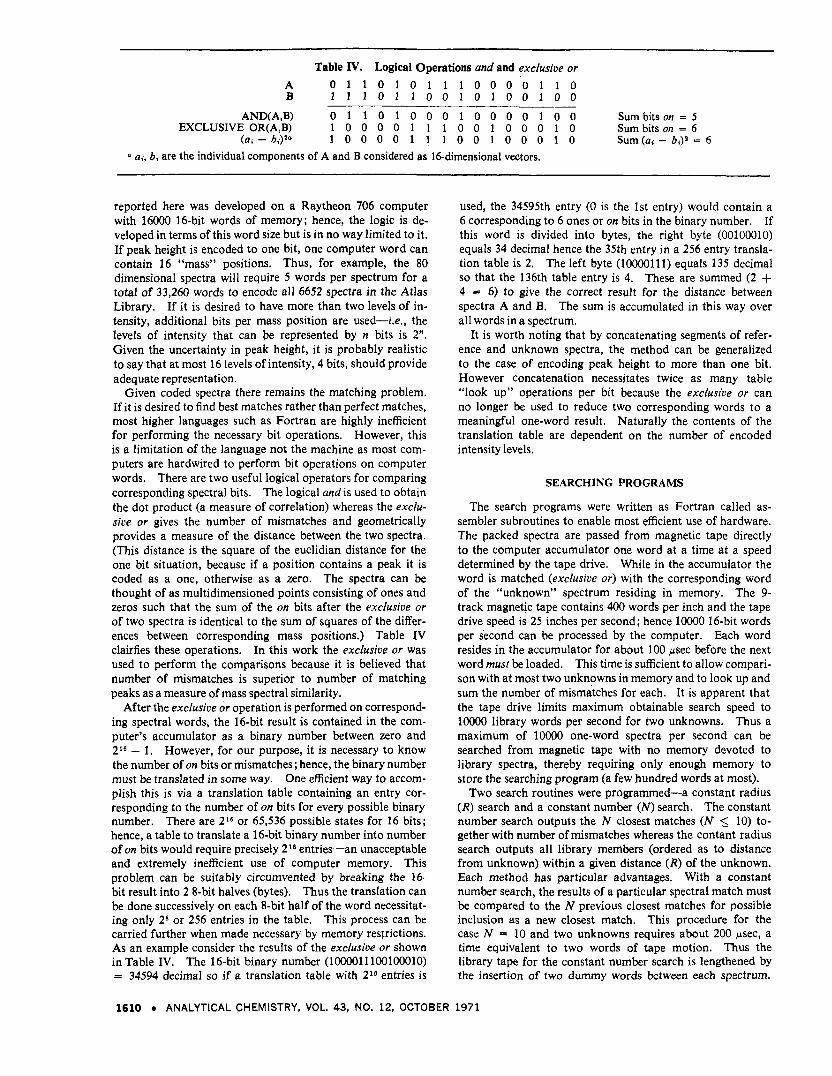
Table IV. Logical Operations and and exclusive or
B l l l o l l o o l o l o o l o o A 0 1 1 0 1 0 1 1 1 0 0 0 ’ 0 1 1 0
AND(A,B) 0 1 1 0 1 0 0 0 1 0 0 0 0 1 0 0 Sum bits on = 5 EXCLUSIVE OR(A,B) 1 0 0 0 0 1 1 1 0 0 1 0 0 0 1 0 Sum bits OIZ = 6
(ai - hi)’” 1 0 0 0 0 1 1 1 0 0 1 0 0 0 1 0 Sum(ai - b,)* = 6 a ai, bi are the individual components of A and B considered as 16-dimensional vectors,
reported here was developed on a Raytheon 706 computer with 16000 16-bit words of memory; hence, the logic is de- veloped in terms of this word size but is in no way limited to it. If peak height is encoded to one bit, one computer word can contain 16 “mass” positions. Thus, for example, the 80 dimensional spectra will require 5 words per spectrum for a total of 33,260 words to encode all 6652 spectra in the Atlas Library. If it is desired to have more than two levels of in- tensity, additional bits per mass position are used-i.e., the levels of intensity that can be represented by n bits is 2”. Given the uncertainty in peak height, it is probably realistic to say that a t most 16 levels of intensity, 4 bits, should provide adequate representation.
Given coded spectra there remains the matching problem. If it is desired to find best matches rather than perfect matches, most higher languages such as Fortran are highly inefficient for performing the necessary bit operations. However, this is a limitation of the language not the machine as most com- puters are hardwired t o perform bit operations on computer words. There are two useful logical operators for comparing corresponding spectral bits. The logical andis used to obtain the dot product (a measure of correlation) whereas the exclu- siue or gives the number of mismatches and geometrically provides a measure of the distance between the two spectra. (This distance is the square of the euclidian distance for the one bit situation, because if a position contains a peak it is coded as a one, otherwise as a zero. The spectra can be thought of as multidimensioned points consisting of ones and zeros such that the sum of the on bits after the exclusive or of two spectra is identical t o the sum of squares of the differ- ences between corresponding mass positions.) Table 1V clairfies these operations. In this work the exclusive or was used to perform the comparisons because it is believed that number of mismatches is superior to number of matching peaks as a measure of mass spectral similarity.
After the exclusive or operation is performed on correspond- ing spectral words, the 16-bit result is contained in the com- puter’s accumulator as a binary number between zero and 216 - 1. However, for our purpose, it is necessary to know the number of on bits or mismatches; hence, the binary number must be translated in some way. One efficient way to accom- plish this is via a translation table containing a n entry cor- responding to the number of on bits for every possible binary number. There are 216 or 65,536 possible states for 16 bits; hence, a table to translate a 16-bit binary number into number of on bits would require precisely 216 entries-an unacceptable and extremely inefficient use of computer memory. This problerp can be suitably circumvented by breaking the 16- bit result into 2 8-bit halves (bytes). Thus the translation can be done successively on each 8-bit half of the word necessitat- ing only 2* or 256 entries in the table. This process can be carried further when made necessary by memory restrictions. As an example consider the results of the exclusive or shown in Table IV. The 16-bit binary number (1oooO111001OOO10) = 34594 decimal so if a translation table with 21° entries is
1610 ANALYTICAL CHEMISTRY, VOL. 43, NO. 12, OCTOBER
used, the 34595th entry (0 is the 1st entry) would contain a 6 corresponding to 6 ones or on bits in the binary number. If this word is divided into bytes, the right byte (00100010) equals 34 decimal hence the 35th entry in a 256 entry transla- tion table is 2. The left byte (1oooO111) equals 135 decimal so that the 136th table entry is 4. These are summed (2 + 4 = 6) to give the correct result for the distance between spectra A and B. The sum is accumulated in this way over all words in a spectrum.
It is worth noting that by concatenating segments of refer- ence and unknown spectra, the method can be generalized to the case of encoding peak height to more than one bit. However concatenation necessitates twice as many table “look up” operations per bit because the exclusive or can no longer be used to reduce two corresponding words to a meaningful one-word result. Naturally the contents of the translation table are dependent on the number of encoded intensity levels.
SEARCHING PROGRAMS
The search programs were written as Fortran called as- sembler subroutines to enable most efficient use of hardware. The packed spectra are passed from magnetic tape directly to the computer accumulator one word at a time a t a speed determined by the tape drive. While in the accumulator the word is matched (exclusive or) with the corresponding word of the “unknown” spectrum residing in memory. The 9- track magnetic tape contains 400 words per inch and the tape drive speed is 25 inches per second; hence lo000 16-bit words per second can be processed by the computer. Each word resides in the accumulator for about 100 psec before the next word must be loaded. This time is sufficient to allow compari- son with at most two unknowns in memory and to look up and sum the number of mismatches for each. It is apparent that the tape drive limits maximum obtainable search speed to lo000 library words per second for two unknowns. Thus a maximum of loo00 one-word spectra per second can be searched from magnetic tape with no memory devoted to library spectra, thereby requiring only enough memory to store the searching program (a few hundred words at most).
Two search routines were programmed-a constant radius (R) search and a constant number (N) search. The constant number search outputs the N closest matches ( N 5 10) to- gether with number of mismatches whereas the contant radius search outputs all library members (ordered as to distance from unknown) within a given distance (R) of the unknown. Each method has particular advantages. With a constant number search, the results of a particular spectral match must be compared to the N previous closest matches for possible inclusion as a new closest match. This procedure for the case N = 10 and two unknowns requires about 200 psec, a time equivalent t o two words of tape motion. Thus the library tape for the constant number search is lengthened by the insertion of two dummy words between each spectrum.
1971

Table V. Chemical Characterization Relative to the Unknown of the Best Matches Resulting from Searching for Randomly
Chosen “Unknowns” a t a 1.0% Transition Level Percentage of closest matches found in various chemical classifications
Spectrum coding - Little or no No. of No. of Identical or Structurally apparent
dimensions words close isomer similar relation 352 22 84 13 3 80 5 76 19 5 48 3 74 15 11
The constant radius method has no similar requirements, hence is faster by 200 psec per library spectrum. For ten word spectra, this means that the constant number search requires 2 0 z more time than the constant radius method while for one word spectra there is a 200 % increase in search time. The major disadvantage of a constant radius search is uncertainty in assigning a n R value for different unknowns. A practical limit on the number of neighbors retained must be set if it is necessary t o minimize memory requirements. Thus if R is too large, the library may not be completely searched before filling available memory with matches. On the other hand if R is too small, there may be no recorded matches at all. However R can be varied and if a reasonable maximum is set on number of near neighbors, it should be possible with experience to overcome these disadvantages and therefore obtain maximum search speed without use of excessive memory.
SEARCH RESULTS
Library tapes of the 6652 Atlas Mass Spectra were prepared a t 352, 80, and 48 dimensions corresponding to 22, 5, and 3 16-bit words per spectrum, respectively. (These tapes were
prepared on the Triangle Universities Computation Centers IBM 360/75 computer.) A set of 100 unknowns was chosen at random from the complete set for purposes of testing and comparing different coding methods. These results are sum- marized in Table V for the 80 cases where the “unknown” had either duplications or similar isomers present in the library. Of course, the “unknown” is retrieved as an exact match in every case. The results a t various codings are comparable and the 3-word spectra generally gave good results, thereby allowing considerable reduction in storage requirements in addition to greatly increasing search speeds.
To enable intuitive feeling for search output, some illustra- tive results are shown in Tables VI-VI11 for the 22 and 3 word cases. (Again in these as in all other cases, the “unknown” is always retrieved as a n exact match but is not shown.) Two of these (Table VI, VII) illustrate a better as well as one of the poorer search results in addition to a case (Table VIII) where the library contains no similar compounds. Search time for the 3-word library is approximately 2 seconds with the con- stant radius search and 3lI2 seconds for a constant number search whereas with 22 word spectra search time is 16 seconds for a constant number search of all 6652 spectra.
Although conclusive comparisons with the work of Knock ef af. (7) are difficult because of the limited molecular weight ranges and to some extent the different set of spectra searched in that work, it was felt desirable to do so. They pointed out that the spectra of Farnesol originating from different instru- ments show large variations. The Atlas library contains Farnesol seven times representing 4 different sources, thus seven searches were made, one for each “unknown” Farnesol spectrum. The results including five closest matches are shown in Table IX for what are considered the best and worst cases. Of the seven searches, Farnesol showed up first in 4 cases and in the nearest 5 for all cases. Furthermore, if compounds were eliminated because of molecular weight information, Farnesol was 1 st in every instance, thus compar-
Table VI. Search Results a t 352 and 48 Dimensions for 2,6-Dimethyl-4-Thiaheptane Mol wt = 146, mol form. = CsH& ref no. = BAR 0029, struct. form. = (CH3)zCHCHzSCHzCH(CH3)z
No. No. dim. Ref no. Mol wt Mol form. mismatches
SIK 2269 146 CaHisS 9
SIK 2267 146 CsHisS 12 API 1391 146 CeHisS 13
3 WUR 1770 132 C7HieS 17 5
API 1409 132 C7HisS 18 2
SIK 2264 132 C,Hi 6s 18
SIK 2269 146 CsHisS 3
Compound name 2,6-Dimethyl-4-
thiaheptane 5-Thianonane 5-Thianonane 3-Methyl-4-
thiaheptane 2,4-Dimethyl-4-
thiahexane 2,4-Dimethyl-4-
thiahexane 2,6-Dimethyl-4-
thiaheptane SIK 2267 146 CsHisS 5 5-Thianonane API 1391 146 CsHiiS 5 5-Thianonane
WUR 1770 132 C7HieS 5 3-Methyl-4- thiaheptane
API 1409 132 CiHieS 7 2,4-Dimethyl-3- thiahexane
SIK 2264 132 C7HieS 7 2,4-Dimethyl-3- thiahexane
SIK 2263 I32 C,HieS 7 2-Methyl-3- thiaheptane
API 0573 116 CeHizS 7 2,5-Dimethyl- thiacyclo- pentane
4 8
ANALYTICAL CHEMISTRY, VOL. 43, NO. 12, OCTOBER 1971 m 1611

Table VII. Search Results at 352 and 48 Dimensions for 2-Myristo-1,SDiacetin HzCOCOCHa
I I
Mol wt = 386, mol fonn. = CniHdla, ref no. = HOL 5V73, structfonn. = HC0CO(CH&,CH8
HzCOCOCHa
No. dim. Ref no. HOL 9437
HOL 2652
DOW 2550 3 5 2
DOW 3562
DOW 0520
Mol wt 414
442
210
210
200
No. mis-
Mol form. matches Compound name CzaH4zOs 52 1-Palmityl-2,3-
diacetin
G5H4EO8 55 2-Stearo-l,3- diacetin
Ci5Hid0 69 2,3-Dihydro-2- methyl-7- phenylbenzo- furan
Ci5H140 70 2,3-Dihydro-2- methyl-7- phenylbenzo- furan
hydroxy- ethy1)benzene
C8H9Br0 70 (l-Bromo-2-
Structural formula H2COCqCHz)irCHa
HCOCOCHI
HzCOCOCHa
HiCOCOCHs
I I
HCOCO(CHz)lsCH I 3
q3 “13
I HzCOCOCH3
#
HOL 9283 358 CzlH4204 7 2-Monostearin HzCOH I I
diacetin I I
I I
HCOCO(CH2)isCHa
HzCOH HOL 9272 386 GiHwOs 7 l-Myristo-2,3- HnCOCO(CHz)inCH~
HCOCOCHj
H~COCOCHI HOL 2652 442 G5H4sOs 7 2-Stearo-l,3- HzCOCOCH3
4
diacetin HCOCO(CHz)isCH3
HzCOCOCH,
SHH 0057 410 C30H50 9 Squalene CH3 CHI I I
[(CH~)~C=CH(CH&C=CH(CHZ)ZC=CHCHZ-IZ HOL 9263 358 CisHa4Oe 9 l-Lauro-2,3- HzCOCO(CHz)ioCHa
diacetin HCOCOCHa
HzCOCOCH3 I
Table VIII. Search Results at 352 and 48 Dimensions for Benzoyl Fluoride Mol wt = 124, mol form. = C7HhF0, ref no. = DOW 4693, struct form. = CEH~COF
No. No. dim Ref no. Mol wt Mol form. mismatches Compound name Structural formula
Benzaldehyde CEH~CHO DOW 1230 106 CiHsO 17 DOW 1042 122 C~HEOZ 17 Benzoic acid CeHaCOzH
3 DOW 5152 134 CsHsOn 18 Phthalide mo 5 2 DOW 1586 226 C14H1003 18 Benzoic anhydride (C EH sC0)zO
MOR 0077 106 C7HsO 19 Benzaldehyde CeHsCHo Continued
1612 ANALYTICAL CHEMISTRY, VOL. 43, NO. 12, OCTOBER 1971

Table VIII. Continued Mol wt = 124, mol form. = C7HsF0, ref no. = DOW 4693, struct form. COH~COF
No. No. dim Ref no. Mol wt Mol form. mismatches Compound name Structural formula
DOW 1586 226 C14HioOs 7 Benzoic anhydride (CeHsC0)zO DOW 2050 96 CsH5F 7 Fluorobenzene CaHaF
DOW 2456 130 CsHdCIF 8 I-Chloro-2-fluoro- benzene
4 8
CH’CH2 DOW 5304 138 CeHiCI 9 P-Chlorostyrene
DOW 2523 137 CiH4NCI 9 P-Chlorobenzonitrile
DOW 2823 140 CgHgCI 9 4-Chloro- M-x ylene
Table IX. Search Results at 352 Dimensions for Farnesol Mol wt = 222, mol form. = C15HZ60, struct form = (CH~)ZCCH(CH,~C(CHJ)CH(CHZ)X(CHJ)CHCH,OH
No. Ref. no. Mol wt Mol form. mismatches Compound name Structural formula
SSA 0032 222 C15H260 17 Farnesol Same as unknown WUR 0043 222 c15H2 6 0 18 Farnesol Same as unknown SSA 0034 264 CITH~OZ 20 Farnesyl acetate Replace OH by OCOCHJ
API 1516 386 C d a o 23 1 ,lO-Di(5-primhexahydro- in unknown
indany1)decane
API 1267 414 CmHsr 24 l,lO-Di(cu-decalyl)decane
4 SSA 0009 204 CisH1, 18 B-Car yophyllene
SIK 1632 204 Cl5HZ4 19 7-Cadinene
SSA 0007 204 CL5H21 21 a-Cedrene
SIK 2484 204 Cl&4 21 Thujopsene
SIK 2485 222 ClsHz6O 21 Farnesol
CH]CHcH] h “12
Same as unknown
ing favorably with (7). To allow further comparison, search results for 1,3-dimethyl benzene and N-dodecane are shown in Table X. In all these cases, the results at 80 and 48 dimen- sions were comparable to those at 352.
may derive from searching only selected parts of the library (such as compounds of a certain molecular weight range), the entire library must be searched if it is desired to be certain that the best match is obtained. As pointed out in (7), it may be necessary to consider compounds of different molecular weight for structural clues if the “ unknown” is not contained in the library, A
This study was undertaken to develop a practical search mentally derived spectra. Although there exist rather elegant and retrieval system for low resolution spectra. The
primary considerations were optimal use of available hardware and a minimization of search time consistent with maintaining the two critera felt necessary for a useful search stated in the introduction. For most small computer systems, the most practical means of storing vast amounts of data is on magnetic
CONCLUSIONS AND SUMMARY It is felt that any search and retrieval procedure that finds
only perfect matches is unrealistic for dealing with experi-
procedures for finding perfect there are no known useful alternatives to exhaustive searches for finding a best match within a library (11). Although certain advantages
(11) M. Minsky and S. Papert, “Preceptrons,” M.J.T. Press,
in point is recorded in Table ~111 .
Cambridge, Mass., 1969, p 215ff.
ANALYTICAL CHEMISTRY, VOL. 43, NO. 12. OCTOBER 1971 1613

Table X. Search Results a t 352 Dimensions for M-Xylene and
M-Xylene, mol wt = 106, mol form. = CsHla, ref no. =
N-Dodecane
a.
Mis-
API 0254, struct form. =
Ref no. Mol wt Mol form. matches Compound name API 0253 106 CsHio 1 0-Xylene API 0255 106 CsHio 1 P-Xylene API 0178 106 CsHio 2 0-Xylene API 0422 106 Cr”o 2 P-Xylene API 0179 106 CsHio 2 M-Xylene N-Dodecane, mol wt = 170, mol form. = C12H2(, ref no. = API 0404 API 0403 156 CllH24 5 N-Undecane AST2004 156 CllHI4 5 5-Methyldecane AST 2003 156 ClIH24 5 4-Methyldecane API 1028 170 CllH16 6 N-Dodecane AST 2013 170 CiiHi.5 6 4-Methylundecane
of time given the limited buffer size of small machines. The system reported here uses this otherwise wasted time to actually perform the search.
It has been shown that peak height encoded to one bit re- tains sufficient information to allow useful characterization of mass spectra. The spectra can be further reduced in dimen- sionality by combining correlating mass positions with mini- mal loss of important information. Encouraging results were obtained with 48-dimensional spectra requiring only 3 16-bit words to completely encode a reduced mass spectrum, A magnetic tape library of the 6652 mass spectra encoded in this way can be searched in 2 seconds for two unknowns. On the other hand by using the techniques of this study, it would be possible to search a n entire library of loo00 low resolution mass spectra with peak height encoded to 16 in- tensity levels (4 bits per mass position) in 60 seconds from magnetic tape using minimal memory. Minimum required hardware consists of a moderate speed CPU with 4K words of core memory, one 25 IPS, 9-track tape drive with accumula- tor I/O, and some means of inputting the unknown spectra and outputting search results.
tape. Therefore most conventional search systems would require transferral of the data from tape t o memory or disk prior to searching, a process requiring a n appreciable amount
RECEIVED for review April 30,1971. Research supported by the National Science Foundation.
Accepted June 29, 1971.
Spectrophotometric Determination of Xanthate and Total Sulfur in Viscose Matiur Rahman Research and Development Department, Tee-Pak, Inc., Danville, Ill. 61832
Sodium trithiocarbonate, one of the major compo- nents of viscose, displays a sharp isosbestic point at 363 nm. The absorbance at this wavelength gives a more accurate value for the concentration of the salt than the maximum absorbance at 332 nm. The reac- tion with oxygen in dilute solutions to form trithio- percarbonate causes a relatively rapid decrease in the maximum absorbance and the development of the isosbestic point. This procedure for trithiocarbonate has been combined with the determination of xanthate sulfur by batch ion exchange and spectrophotometry in a slightly modified form to give the new method for both xanthate and total sulfur. The sum of the xan- thate and trithiocarbonate values gives the total sulfur, and this checks closely (&l% relative deviation) with other standard methods for total sulfur such as zin- cate decomposition or oxidation.
ROUTINE ANALYSES of total sulfur and its distribution as sodium cellulose xanthate and by-products are important control operations in the viscose process. Several methods are known (1-10) for these analyses. However, most of (1) Reviewed by T. E. Muller and C. B. Purves in “Methods in
Carbohydrate Chemistry,” Vol. 111, Roy L. Whistler, Ed., Academic Press, New York, N. Y., 1963, pp 246-250.
(2) J. P. Dux and L. H. Phifer, ANAL. CHEM., 29, 1842 (1957). (3) L. H. Phifer and Joan L. Bell, TAPPI, 43, 622 (1960). (4) L. H. Phifer, ibid., 52, 671 (1969). ( 5 ) D. Tunc, R. F. Bampton, and T. E. Muller, ibid., p 1882. (6) E. Schauenstein and E. Treiber, MeNiand Texfi/ber.,32,43(1951). (7) W. H. Fock, Kunstseide, 17, 117 (1935). (8) D. J. Bridgeford, Tee-Pak, Inc., private communication, 1951. (9) H. L. Barthelemy and L. Williams, ANAL, CHEM., 17, 624
(10) 0. Samuelson and F. Gartner, Acta Chem. Scand., 5,596(1951). (1945).
these methods are time-consuming, complex, or require special instrumentation. Among these methods, the de- termination of xanthate sulfur by anion exchange purification of viscose and spectrophotometry, developed by Phifer and coworkers (2 , 3), has gained importance recently because of rapidity and simplicity of the steps involved. On the other hand, the method of total sulfur determination by X-ray fluorescence techniques (4) requires special instrumentation. The purpose of this paper is t o describe a simple and rapid spectrophotometric method for the determination of both xanthate and total sulfur in viscose, and to compare the re- sults obtained in this way with several standard procedures. The validity of a recent objection (5 ) to the anion exchange purification of viscose is also discussed.
Sodium cellulose xanthate and sodium trithiocarbonate, the two major sulfur containing components of viscose, absorb strongly at 303 and 332 nm, respectively (2). A viscose solution thus appears t o be suitable for spectrophoto- metric analysis as a typical multicomponent system. Schauen- stein and Treiber (6), and more recently Tunc, Bampton, and Muller (5 ) have reported on the analysis in this way. HOW- ever, we find that a serious limitation in this method of multicomponent analysis arises from the instability of tri- thiocarbonate in dilute alkaline solutions. Figure 1 shows that the transmittance at 332 nm of a dilute viscose solution increases rapidly with time.
Sodium trithiocarbonate has several absorption bands in the ultraviolet and visible regions (21). The shoulder at
(11) J. Dyer, TAPPI, 49, 447 (1966).
1614 a ANALYTICAL CHEMISTRY, VOL. 43, NO. 12, OCTOBER 1971