magnetic properties of uranium based ferromagnetic ......an die musik du holde kunst, in wieviel...
TRANSCRIPT

Magnetic Properties of Uranium Based
Ferromagnetic Superconductors

The research described in this thesis was performed in the section FundamentalAspects of Materials and Energy of the department Radiation, Radionuclides and
Reactors, faculty of Applied Sciences, Delft University of Technology,Mekelweg 15, 2629 JB Delft, The Netherlands.

Magnetic Properties of Uranium Based
Ferromagnetic Superconductors
PROEFSCHRIFT
ter verkrijging van de graad van doctoraan de Technische Universiteit Delft,
op gezag van de Rector Magnificus Prof. dr. ir. J.T. Fokkema,voorzitter van het College voor Promoties,
in het openbaar te verdedigen op maandag 5 februari 2007 om 15:00 uur
door
Serdar SAKARYA
natuurkundig ingenieurgeboren te ‘s-Gravenhage

Dit proefschrift is goedgekeurd door de promotor:Prof. dr. I. M. de Schepper
Toegevoegd promotor: Dr. P. C. M. Gubbens
Samenstelling promotiecommissie:Rector Magnificus voorzitterProf. dr. I. M. de Schepper Technische Universiteit Delft, promotorDr. P. C. M. Gubbens Technische Universiteit Delft, toegevoegd promotorProf. dr. H. von Lohneysen Universitat Karlsruhe, DuitslandProf. dr. M. S. Golden Universiteit van AmsterdamProf. dr. ir. T. M. Klapwijk Technische Universiteit DelftDr. ir. N. H. van Dijk Technische Universiteit DelftDr. P. Dalmas de Reotier Commissariat a l’Energie Atomique, FrankrijkProf. dr. ir. T. H. J. J. van der Hagen Technische Universiteit Delft, reservelid
Dr. ir. N. H. van Dijk heeft als begeleider in belangrijke mate aan de totstandkoming vandit proefschrift bijgedragen.
� 2006 S. Sakarya and IOS Press
All rights reserved. No part of this book may be reproduced, stored in a retrieval system,or transmitted, in any form or by any means, without prior permission from the publisher.
ISBN
Keywords: Ferromagnetism and superconductivity, muon spin relaxation, neutron depo-larization, chemical substitution, URhGe, UGe2, UIr
Published and distributed by IOS Press under the imprint Delft University Press
PublisherIOS PressNieuwe Hemweg 6b1013 BG AmsterdamThe Netherlandstel: +31-20-688 3355fax: +31-20-687 0019e-mail: [email protected]
LEGAL NOTICEThe publisher is not responsible for the use which might be made of the following infor-mation.
PRINTED IN THE NETHERLANDS

An die Musik
Du holde Kunst, in wieviel grauen Stunden,Wo mich des Lebens wilder Kreis umstrickt,Hast du mein Herz zu warmer Lieb entzunden,Hast mich in eine bessre Welt entruckt!
Oft hat eine Seufzer, deiner Harf entflossenEin susser, heiliger Akkord von dirDen Himmel bessrer Zeiten mir erschlossen,Du holde Kunst, ich danke dir dafur!
Franz von Schober(Musik: Franz Schubert)
Aan mijn moeder

VI

CONTENTS
Contents VII
1 Introduction 11.1 General Introduction . . . . . . . . . . . . . . . . . . . . . . . . . . . 11.2 Outline of this thesis . . . . . . . . . . . . . . . . . . . . . . . . . . . 3
2 Experimental Techniques 52.1 Sample Preparation . . . . . . . . . . . . . . . . . . . . . . . . . . . . 52.2 μSR Spectroscopy . . . . . . . . . . . . . . . . . . . . . . . . . . . . . 6
2.2.1 Production, life, and decay of the muon . . . . . . . . . . . . . 62.2.2 Experimental Geometries . . . . . . . . . . . . . . . . . . . . . 92.2.3 μSR Spectrometers: EMU, GPS, and GPD . . . . . . . . . . . 92.2.4 Depolarization and Relaxation Functions . . . . . . . . . . . . 112.2.5 Magnetic Field at the Muon Site . . . . . . . . . . . . . . . . 17
2.3 Three-Dimensional Neutron Depolarization . . . . . . . . . . . . . . . 202.4 Macroscopic techniques . . . . . . . . . . . . . . . . . . . . . . . . . . 22
2.4.1 Magnetization . . . . . . . . . . . . . . . . . . . . . . . . . . . 222.4.2 Thermal Expansion and Magnetostriction . . . . . . . . . . . 232.4.3 Electrical Resistivity . . . . . . . . . . . . . . . . . . . . . . . 252.4.4 Specific Heat . . . . . . . . . . . . . . . . . . . . . . . . . . . 252.4.5 X-ray Powder Diffraction . . . . . . . . . . . . . . . . . . . . . 25
3 Theory 273.1 Heavy Fermions . . . . . . . . . . . . . . . . . . . . . . . . . . . . . . 273.2 Quantum Phase Transitions . . . . . . . . . . . . . . . . . . . . . . . 333.3 Fermi liquid and non-Fermi liquid behavior . . . . . . . . . . . . . . . 36
3.3.1 Fermi gas . . . . . . . . . . . . . . . . . . . . . . . . . . . . . 373.3.2 Fermi liquid . . . . . . . . . . . . . . . . . . . . . . . . . . . . 38

VIII CONTENTS
3.3.3 Non-Fermi liquid . . . . . . . . . . . . . . . . . . . . . . . . . 393.4 Gruneisen parameters . . . . . . . . . . . . . . . . . . . . . . . . . . . 413.5 Thermodynamic Considerations . . . . . . . . . . . . . . . . . . . . . 423.6 Ferromagnetic Superconductors . . . . . . . . . . . . . . . . . . . . . 43
4 UGe2 454.1 Introduction . . . . . . . . . . . . . . . . . . . . . . . . . . . . . . . . 454.2 Three-Dimensional Neutron Depolarization . . . . . . . . . . . . . . . 47
4.2.1 Introduction . . . . . . . . . . . . . . . . . . . . . . . . . . . . 474.2.2 Experimental . . . . . . . . . . . . . . . . . . . . . . . . . . . 504.2.3 Three-dimensional neutron depolarization . . . . . . . . . . . 504.2.4 Results . . . . . . . . . . . . . . . . . . . . . . . . . . . . . . . 534.2.5 Discussion . . . . . . . . . . . . . . . . . . . . . . . . . . . . . 544.2.6 Conclusions . . . . . . . . . . . . . . . . . . . . . . . . . . . . 59
4.3 Muon Spin Rotation and Relaxation . . . . . . . . . . . . . . . . . . 594.3.1 Introduction . . . . . . . . . . . . . . . . . . . . . . . . . . . . 594.3.2 Experimental . . . . . . . . . . . . . . . . . . . . . . . . . . . 604.3.3 Results . . . . . . . . . . . . . . . . . . . . . . . . . . . . . . . 624.3.4 Analysis . . . . . . . . . . . . . . . . . . . . . . . . . . . . . . 784.3.5 Discussion . . . . . . . . . . . . . . . . . . . . . . . . . . . . . 884.3.6 Conclusions . . . . . . . . . . . . . . . . . . . . . . . . . . . . 92
5 URhGe 975.1 Introduction . . . . . . . . . . . . . . . . . . . . . . . . . . . . . . . . 975.2 Dilatometry . . . . . . . . . . . . . . . . . . . . . . . . . . . . . . . . 99
5.2.1 Introduction . . . . . . . . . . . . . . . . . . . . . . . . . . . . 995.2.2 Experimental . . . . . . . . . . . . . . . . . . . . . . . . . . . 995.2.3 Results . . . . . . . . . . . . . . . . . . . . . . . . . . . . . . . 995.2.4 Discussion . . . . . . . . . . . . . . . . . . . . . . . . . . . . . 1005.2.5 Conclusions . . . . . . . . . . . . . . . . . . . . . . . . . . . . 106
5.3 Muon Spin Rotation and Relaxation . . . . . . . . . . . . . . . . . . 1065.3.1 Introduction . . . . . . . . . . . . . . . . . . . . . . . . . . . . 1065.3.2 Experimental . . . . . . . . . . . . . . . . . . . . . . . . . . . 1075.3.3 Results . . . . . . . . . . . . . . . . . . . . . . . . . . . . . . . 1085.3.4 Analysis . . . . . . . . . . . . . . . . . . . . . . . . . . . . . . 1125.3.5 Discussion . . . . . . . . . . . . . . . . . . . . . . . . . . . . . 1155.3.6 Conclusions . . . . . . . . . . . . . . . . . . . . . . . . . . . . 119
6 URh1−xRuxGe 1216.1 Introduction . . . . . . . . . . . . . . . . . . . . . . . . . . . . . . . . 1216.2 Experimental . . . . . . . . . . . . . . . . . . . . . . . . . . . . . . . 1246.3 Results . . . . . . . . . . . . . . . . . . . . . . . . . . . . . . . . . . . 125
6.3.1 Magnetization at ambient pressure . . . . . . . . . . . . . . . 1256.3.2 Electrical resistivity . . . . . . . . . . . . . . . . . . . . . . . . 129

CONTENTS IX
6.3.3 X-ray powder diffraction . . . . . . . . . . . . . . . . . . . . . 1336.3.4 Specific heat . . . . . . . . . . . . . . . . . . . . . . . . . . . . 1346.3.5 Magnetization under pressure . . . . . . . . . . . . . . . . . . 135
6.4 Analysis and Discussion . . . . . . . . . . . . . . . . . . . . . . . . . 1376.5 Conclusions . . . . . . . . . . . . . . . . . . . . . . . . . . . . . . . . 143
7 UIr 1457.1 Introduction . . . . . . . . . . . . . . . . . . . . . . . . . . . . . . . . 1457.2 Magnetization in High Magnetic Fields . . . . . . . . . . . . . . . . . 148
7.2.1 Introduction . . . . . . . . . . . . . . . . . . . . . . . . . . . . 1487.2.2 Experimental . . . . . . . . . . . . . . . . . . . . . . . . . . . 1497.2.3 Results . . . . . . . . . . . . . . . . . . . . . . . . . . . . . . . 1497.2.4 Discussion . . . . . . . . . . . . . . . . . . . . . . . . . . . . . 1507.2.5 Conclusions . . . . . . . . . . . . . . . . . . . . . . . . . . . . 150
7.3 Specific Heat . . . . . . . . . . . . . . . . . . . . . . . . . . . . . . . 1517.3.1 Introduction . . . . . . . . . . . . . . . . . . . . . . . . . . . . 1517.3.2 Experimental . . . . . . . . . . . . . . . . . . . . . . . . . . . 1517.3.3 Results and Discussion . . . . . . . . . . . . . . . . . . . . . . 151
7.4 Thermal Expansion and Magnetostriction . . . . . . . . . . . . . . . 1537.4.1 Introduction . . . . . . . . . . . . . . . . . . . . . . . . . . . . 1537.4.2 Experimental . . . . . . . . . . . . . . . . . . . . . . . . . . . 1537.4.3 Results . . . . . . . . . . . . . . . . . . . . . . . . . . . . . . . 1547.4.4 Discussion and Conclusions . . . . . . . . . . . . . . . . . . . 158
Summary 163
Samenvatting 167
Bibliography 171
Acknowledgements 181
Curriculum Vitae 183
List of publications 185

X

CHAPTER 1
Introduction
1.1 General Introduction
he discovery of superconductivity within a limited pressurerange (1.0-1.6 GPa) in UGe2 [1] provided an unanticipated exampleof the coexistence of superconductivity and ferromagnetism, becausethese phenomena were long thought to be exclusive. One year later,a coexistence of these two phenomena was also found in URhGe [2].The most striking difference with UGe2 is that this coexistence occurs
at ambient pressure and is therefore not a pressure induced effect. Just like in UGe2,a coexistence was later found in UIr [3], where it occurs within a limited pressurerange (2.6-2.7 GPa), where ferromagnetic order is on the verge of its existence. Withthe coexistence of ferromagnetism and superconductivity, these three U compoundsbelong to a class of materials, which exhibit unconventional ground state propertiesin a strongly correlated ferromagnetic system. In this class of materials UIr holdsa special place because it is a system in which the crystal structure lacks inversionsymmetry.
In the late 1950s, Bardeen, Cooper and Schrieffer (BCS) showed that supercon-ductivity involves the formation of bound pairs of electrons, named Cooper pairs [4].They argued that the electron pairs were “glued together” by excitations. Althoughphonons were implicated in superconductivity many years before the BCS theory, itwas not until the 1960s that it became possible to definitively identify them as theglue in conventional superconductivity. The model predicts that the attractive pair-ing interaction is reduced in a magnetic field and, as a consequence, is suppressed byferromagnetic order. This prediction is consistent with experimental observations ina number of systems where ferromagnetic order sets in below the superconductingtransition temperature and the superconducting pairing of the conduction electronsis either weakened or completely suppressed. This is nicely demonstrated by the

2 Introduction
experiments on ErRh4B4 [5, 6] and HoMo6S8 [7], where the superconductivity issuppressed when ferromagnetic order sets in.
The 1970s and 1980s led to the discovery of superconductivity in two new, un-conventional classes of materials, the heavy-fermion [8] and high-temperature [9]superconductors. Conventional superconductivity is suppressed by the tiniest con-centration of magnetic atoms, but the unconventional superconductors contain adense array of magnetic atoms, which appear to be actively involved in electronpairing. In the heavy-fermion systems, intermetallic compounds usually based onCe or U, the 4f or 5f electrons play a crucial role leading to the formation of qua-siparticles with a large effective mass. A better understanding of superconductivityin these type of materials has been sought ever since the pioneering discovery ofheavy-fermion superconductivity in CeCu2Si2 [8]. For these systems a new kindof magnetically mediated superconductivity was proposed in which the glue thatcauses electrons to form Cooper pairs is derived from magnetic fluctuations [10, 11].
However, until the discovery of the coexistence of ferromagnetic order and su-perconductivity, it was generally believed that these two phenomena were mutuallyexclusive. Superconductivity would be destroyed because of the paramagnetic effect(aligning of the opposite spins) and by the orbital effect (opposite Lorentz forces).With UGe2, URhGe, and UIr, a new class of materials has been shown to exhibit astable phase in which superconductivity coexists within the ferromagnetic orderedstate. This discovery has led to the study of intriguing new possibilities for uncon-ventional mechanisms for magnetically mediated superconductivity.
Another fascinating feature of these three U-based ferromagnetic superconduc-tors, is that this type of superconductivity was found to occur in the vicinity ofa quantum critical point (QCP). A phase transition from a magnetically orderedphase to a disordered phase by tuning the pressure or by chemical substitution, iscalled a quantum phase transition since quantum fluctuations lead to a breakdownof the long-range order, in contrast to the classical phase transitions where thermalfluctuations play a crucial role. The critical pressure, or critical chemical composi-tion, where the ordering temperature is tuned to TC = 0 K is referred to as a QCP.At this point the Fermi-liquid theory breaks down and new physics is observed.
Fermi-liquid theory has been successful in describing the low-temperature be-havior of many metallic compounds. Within this theory the electron interactionsare accounted for by an effective mass for the conduction electrons. Many Ce and Usystems with very strong electronic correlations are well described in terms of Fermi-liquid theory. In recent years, several systems where the Fermi-liquid scenario doesnot apply, have been found. These systems, known as non-Fermi liquids, are mainlyfound in the vicinity of a quantum critical point.
The coexistence of ferromagnetism and superconductivity in the vicinity of aferromagnetic quantum critical point, is the main motivation that the related com-pounds are investigated thoroughly. The fact that magnetic fluctuations are en-hanced near a quantum critical point, just where superconductivity is found, stronglysuggests that the attractive force between the electrons forming the Cooper pair,

1.2 Outline of this thesis 3
originates from the magnetic fluctuations.The magnetic fluctuations and the non-Fermi-liquid behavior observed near a
ferromagnetic quantum critical point are not fully understood yet, neither howmagnetic fluctuations cause an attractive force between electrons, nor how supercon-ductivity and ferromagnetism can coexist. It is therefore of utmost importance tostudy the magnetic fluctuations, or more general, the magnetic properties, in UGe2,URhGe, and UIr, in combination with non-Fermi-liquid behavior. This thesis hasthe intention to contribute to the understanding of the role of ferromagnetism andferromagnetic spin fluctuations in their coexistence with superconductivity.
1.2 Outline of this thesis
In Chapter 2 the details of several experimental techniques are discussed. First,the sample preparation is presented. After this, a description of the μSR techniquefollows, including the used experimental set-ups, the interpretation of muon depo-larization data, and a discussion about the magnetic field at the muon site. Thethree-dimensional neutron depolarization technique is explained next. The Chap-ter ends with a basic description of the macroscopic techniques used in this thesis:magnetization, thermal expansion and magnetostriction, electrical resistivity, spe-cific heat, and X-ray powder diffraction.
Chapter 3 deals with the relevant theory from solid state physics. A basic de-scription is given about the main mechanism leading to the development of a stronglycorrelated state at low temperatures - the Kondo effect. A magnetic phase diagramresults when the competition with the long-ranged RKKY interaction is taken intoaccount. The concept of a quantum critical point is explained, as well as Fermi-liquidand non-Fermi-liquid behavior of the correlated electron system. After a review onthe Gruneisen analysis, which enables the study of the volume dependence of ther-modynamic energy scales, a few thermodynamic considerations on phase transitionare presented. The Chapter ends with a review of the recent theories to explain thecoexistence of superconductivity with ferromagnetism.
In Chapter 4 the ferromagnetic domain structure in UGe2 is studied by neutrondepolarization. The question is whether the ferromagnetic domain size d is in theorder of micrometers (i.e. much larger than the superconducting coherence lengthξsc) or in the order of nanometers (comparable to ξsc). The implications of thesize of d with respect to ξsc are discussed. Subsequently, muon spin rotation andrelaxation measurements are presented. These measurements have been performedunder pressures up to 1.0 GPa. An inner phase transition (TX), which occurs withinthe ferromagnetic phase, is monitored as a function of pressure. Subsequently, thecritical dynamics close to TC at a pressure of 0.95 GPa was studied. Conclusionsare drawn about the nature of the magnetic fluctuations and their influence on thesuperconducting state.
In Chapter 5 experimental data on URhGe are presented. Thermal expansionmeasurements were performed in order to determine the uniaxial pressure depen-

4 Introduction
dence of the Curie temperature TC. The data are analyzed with the help of theEhrenfest relation. The volume dependence of the energy scale for the spin fluc-tuations at low temperature is calculated. The magnetism in URhGe is furtherstudied by muon experiments. The frequency scale and anisotropy of the magneticfluctuations are measured by field scans in the vicinity of TC.
In Chapter 6 a report is given on the attempts to tune URhGe to a quantumcritical point (TC = 0) by appropriate chemical substitutions: Rh is substituted forRu and for Co, and Ge for Si. The critical substitution concentration xcr is obtainedby measuring TC as a function of concentration x, deduced from magnetization andelectrical resistivity measurements. The URh1−xRuxGe samples are investigatedfurther by means of X-ray powder diffraction, specific heat, and magnetization underpressure.
In Chapter 7 the magnetic properties of UIr are investigated by means of mag-netization in a pulsed field up to 52 T, specific heat in fields up to 14 T, thermalexpansion in zero field and 5 T, and magnetostriction up to 10 T. The high fieldmeasurements were performed to quantify the strength of the magnetic interactionsin UIr.

CHAPTER 2
Experimental Techniques
everal techniques have been employed in the study of the mag-netic properties of the ferromagnetic superconductors UGe2, URhGe,and UIr. They will be presented in this Chapter. After a brief discus-sion on sample preparation, the muon spin rotation and relaxation(μSR) technique is described in some detail, as well as the three-dimensional neutron depolarization technique. Subsequently, a sim-
ple description is given of a few techniques which probe macroscopic thermodynamicproperties of the compounds under study: magnetization, electrical resistivity, spe-cific heat, thermal expansion, and magnetostriction. The Chapter ends with a basicdiscussion on X-ray powder diffraction.
2.1 Sample Preparation
All the samples used and described in this thesis were prepared at the Van derWaals-Zeeman Institute (WZI) of the University of Amsterdam (UvA). Polycrystalswere prepared in collaboration with N. T. Huy and single-crystalline samples weregrown by Y. K. Huang and E. Bruck. Only single crystals were used in the studiesof UGe2, URhGe, and UIr, whereas measurements on U(Rh,Ru)Ge, U(Rh,Co)Ge,and URh(Ge,Si) were performed on polycrystals.
The polycrystalline samples were prepared by arc-melting the constituents in astoichiometric ratio in an arc furnace with a water cooled copper crucible underan argon atmosphere (0.5 bar). The single-crystalline samples were grown from apolycrystalline ingot using the Czochralski technique in a tri-arc furnace. For detailson the crystal growth of U intermetallic compounds, see e.g. Ref [12].
As far as the samples were annealed, they were wrapped in tantalum foil andput in a quartz tube together with a piece of uranium that served as a getter. Afterevacuating and sealing the tubes, the samples were annealed at high temperature.

6 Experimental Techniques
The temperature and duration of annealing depended on the sample. Details aregiven in the experimental parts of the following Chapters.
The single crystals were checked for their single-crystalline nature by means of theX-ray back-reflection Laue method [13] at Leiden University and at the Universityof Amsterdam (UvA). After orientation of the single crystals with the help of thecomputer program OrientExpress [14] the crystals were cut by spark-erosion in theappropriate shapes (platelets, bars, cubes, cylinders, and spheres).
2.2 μSR Spectroscopy
The acronym μSR stands for Muon Spin Rotation, Relaxation, Resonance, or simplyResearch. μSR is a widespread technique used in solid state physics and is closelyrelated to Nuclear Magnetic Resonance (NMR). The principle of the μSR techniqueis quite simple. Positive muons are produced and implanted in a sample where theylocalize at a particular site. The local magnetic field Bloc at this interstitial siteexerts a torque on the muon spin (Sμ = 1/2), so that the spin precesses around thelocal magnetic field with a frequency of ω = γμ|Bloc|. Here γμ = 851.62 Mrad s−1T−1
is the gyromagnetic ratio of the muon. After a certain time, the muon decays and apositron is emitted, preferentially in the direction of the muon spin, at the momentof decay. The positron is detected. After collecting several million positrons thetime-evolution of the polarization of an ensemble of muons can be reconstructed.The polarization function P (t) reflects the spatial and temporal distribution of themagnetic field at the muon site. In this Section a few elements of the μSR techniquewill be elaborated on. A more detailed general description can be found in Refs. [15,16, 17]. Experimental results on some exemplary materials can be found in Refs. [18,19, 20]. Some physical properties of the muon are given in Table 2.1.
2.2.1 Production, life, and decay of the muon
The production of intense muon beams starts in large accelerators where protons(p) gain energies up to ∼ 600 MeV. These highly energetic protons are aimed ata graphite or beryllium target. Several nuclear reactions take place between theprotons and the protons and neutrons (n) of the target, leading to the productionof pions (π):
p + p → p + n + π+
→ d + π+
→ p + p + π0
p + n → n + n + π+
→ p + n + π0
→ p + p + π−
(2.1)
where d stands for deuteron. The charged pions π+ and π− have an average life timeof 26 ns and decay into the muons μ+ and μ− and the accompanying (anti-)neutrinos

2.2 μSR Spectroscopy 7
Table 2.1: Several physical properties of the muon, compared to those of the electron (e)and the proton (p).
mass mμ 206.763835 (11) me
0.1126096 mp
charge +e or −e
spin Sμ 1/2
magnetic moment μμ 8.8905981 (13) μN
3.1833452 (20) μp
gyromagnetic ratio γμ 851.62 Mrad s−1T−1
γμ/2π 135.53879 (1) MHz T−1
life time τμ 2.19714 (7) μs
(νμ and νμ) according to:
π+ → μ+ + νμ
π− → μ− + νμ
(2.2)
The neutral pion π0 plays no role in the μSR technique, since it has a very shortaverage life time of 0.089 fs before it decays into photons. In solid state physicsalmost all μSR research is carried out using positive muons μ+.
Pions possess zero spin and neutrinos have a spin Sν = 1/2 polarized opposite totheir momentum. Because angular momentum has to be conserved, the muon spinhas to be antiparallel to its momentum in the rest frame of the pion. This allowsthe production of a highly spin polarized μ+-beam.
After production the muons are directed to the μSR instruments by electromag-netic guide fields using bending magnets and focussing quadrupole magnets. Alongthe path an electric and magnetic field separator is included to remove contami-nant particles (mainly positrons) from the muon beam. (These are however absentin high-energy beamlines such as GPD, see Sec. 2.2.3.) After implantation in thesample the muon will thermalize. Along the first part of its track the muon thermal-izes by energy exchange through ionizing host atoms and creating vacancies. Thishowever does not influence the experimental results since the final area of localiza-tion will not be affected. Along the last part of its track the muon thermalizes bysuccessive captures and dissociation of electrons from the host. The neutral boundstate with an electron is known as muonium (μ+e−), an exotic light version of thehydrogen atom. In semi-conductors and insulators muonium can be stable, and itcan even be incorporated in some organic materials. In metals, however, muoniumfinally dissociates, and the muon will localize at an interstitial site, where it willbe surrounded by a charge screening cloud of conduction electrons of its host. The

8 Experimental Techniques
Figure 2.1: The angular distribution We+(θ) of the decay positrons for (a) the maximumpositron energy of 52.83 MeV (a = 1) and (b) integrated over all energies (a = 1/3).
implantation and thermalization processes occur so rapidly (10−9 s) that depolariza-tion is insignificant. At its localization site the muon magnetically interacts with thesurrounding matter. The muon carries a relatively large magnetic moment, whicheven exceeds the proton’s magnetic moment: μμ = 3.2 μp. It therefore acts as a verysensitive local magnetic field probe. Due to the absence of a quadrupolar electricmoment (Sμ = 1/2) the muon does not couple to electric field gradients.
The average muon life time is 2.2 μs after which the muon decays into a positrone+ according to
μ+ → e+ + νe + νμ (2.3)
where νe and νμ are the neutrinos and antineutrinos associated with the positronand the muon respectively. The decay positrons are emitted preferentially in thedirection of the μ+ spin which allows a determination of the time evolution of thepolarization. The probability distribution of the positron emission is given by
We+(θ) ∝(1 + a(E) cos θ
)(2.4)
where θ is the angle between the muon spin at the moment of decay and the directionin which the positron is emitted. In Fig. 2.1 two characteristic angular patternsWe+(θ) are represented. The asymmetry parameter a depends on the energy ofthe positron. a increases monotonically with the positron energy and is 1 for themaximum positron energy Emax = 52.83 MeV. For E = 0, a = −1/3 and changessign for E = 1
2Emax. However, very few positrons are emitted with low energies and
those which are will usually not be detected. When integrated over all energies oneobtains a = 1/3 [21]. The positron detectors used around the world in μSR set-upsdo not determine the incoming energy of the positrons and therefore one alwaysmeasures the asymmetry parameter a averaged over all energies.
Because of their large kinetic energy (≈ 30 MeV), the positrons are only weaklyabsorbed by the sample and cryostat walls. They are monitored and stored by

2.2 μSR Spectroscopy 9
detection electronics in a counts versus time histogram. The time histogram of thecollected intervals is of the form
Ne+(t) = N0e−t/τμ [1 + aP (t) cos(φdet)] + b (2.5)
where b is a time independent background, N0 a normalization constant, and e−t/τμ
accounts for the μ+ decay with the average decay time τμ. P (t) reflects the timedependence of the μ+ polarization and is normalized to unity for t = 0. The value ofthe initial asymmetry a depends on the experimental set-up and is in practice smallerthan the theoretical value of 1/3. Due to the finite solid angle of the detectors,energy dependent efficiency of detection and possible reduced beam polarization, ais usually � 0.23 − 0.25. The phase factor φdet accounts for the angle between theinitial muon polarization and the positron detector.
2.2.2 Experimental Geometries
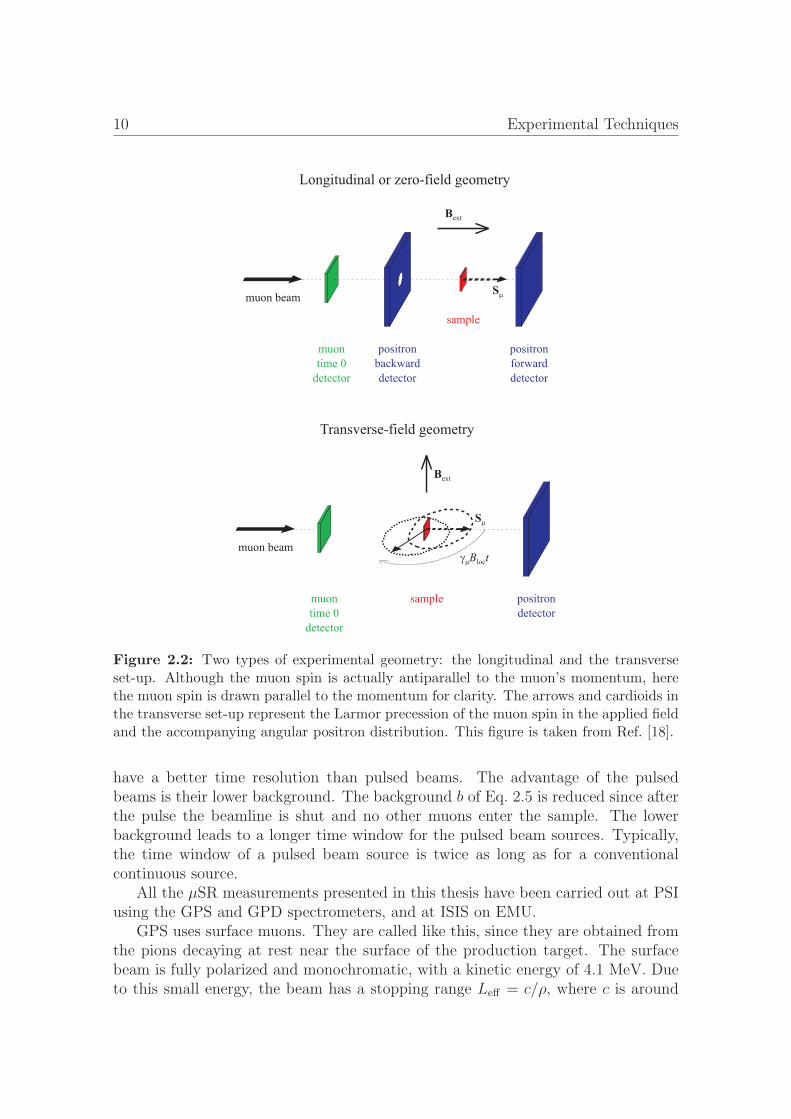
In μSR two types of experimental geometries are used. They are depicted in Fig. 2.2.Measurements in zero magnetic field and in longitudinal field are performed with thesame geometry. The positron detectors are set parallel and antiparallel to the initialbeam polarization Sμ(0). They are called the “forward” and “backward” detector,respectively.
By definition the magnetic field Bext is applied along the Z direction. In thelongitudinal geometry the field is applied parallel to the beam polarization Sμ(0).The measured polarization function is called PZ(t). In the transverse geometry Bext
is perpendicular to Sμ(0), which is then along X. The positrons are detected in adirection perpendicular to Bext, from which PX(t) is reconstructed.
It should be noted that for e.g. a ferromagnet in zero field, with Sμ(0) perpendic-ular to the local field, PX(t) is measured and not PZ(t), although the measurementsare performed in zero applied magnetic field. Physically for the muon spin there isno difference between a static externally applied magnetic field Bext or a constantfield with its origin in the ferromagnetism of the compound under study.
The transverse geometry is in practice often different from the situation inFig. 2.2. For practical reasons Bext is often directed along the beam direction andthe muon spin is rotated in the vertical direction.
2.2.3 μSR Spectrometers: EMU, GPS, and GPD
Muon beams are produced either as a continuous beam (PSI, Switzerland and TRI-UMF, Canada) or as a pulsed one (ISIS, UK and KEK, Japan). For continuousbeams every event is treated separately. A clock is started at the moment thata muon enters the sample. This clock is stopped when the corresponding decaypositron is detected. The elapsed time is stored in a counts versus time histogram.For pulsed beams all muons come in at the same time t0. This pulse has however afinite width distributed around t0. Due to this uncertainty in t0 continuous beams
10 Experimental Techniques
Figure 2.2: Two types of experimental geometry: the longitudinal and the transverseset-up. Although the muon spin is actually antiparallel to the muon’s momentum, herethe muon spin is drawn parallel to the momentum for clarity. The arrows and cardioids inthe transverse set-up represent the Larmor precession of the muon spin in the applied fieldand the accompanying angular positron distribution. This figure is taken from Ref. [18].
have a better time resolution than pulsed beams. The advantage of the pulsedbeams is their lower background. The background b of Eq. 2.5 is reduced since afterthe pulse the beamline is shut and no other muons enter the sample. The lowerbackground leads to a longer time window for the pulsed beam sources. Typically,the time window of a pulsed beam source is twice as long as for a conventionalcontinuous source.
All the μSR measurements presented in this thesis have been carried out at PSIusing the GPS and GPD spectrometers, and at ISIS on EMU.
GPS uses surface muons. They are called like this, since they are obtained fromthe pions decaying at rest near the surface of the production target. The surfacebeam is fully polarized and monochromatic, with a kinetic energy of 4.1 MeV. Dueto this small energy, the beam has a stopping range Leff = c/ρ, where c is around

2.2 μSR Spectroscopy 11
160-200 mg/cm2 and ρ the density of the compound in mg/cm3.The GPD is a high-energy muon beam line. The pions that decay into muons
leave the target at high energies. The polarization of the muon beam is limited toaround 80 %. Muons are generated in bunches at a rate given by the frequency ofthe accelerator (50.63 MHz at PSI). Although the bunch structure is smeared outduring the transport of the beam to the sample, it is still visible in the μSR spectraas an oscillating accidental background in the time dependence of the number ofcounts. In the analysis of the spectra additional oscillating terms are required, withfrequencies equal to the accelerator frequency and higher harmonics, multiplied byet/τμ , to compensate for the muon decay in the fitting procedure. The penetrationdepth of the muons into the sample is larger for the high-energy beam than that ofthe surface beam and the former should therefore be used when studying sampleswithin pressure cells, as discussed in Chapter 4.
EMU is a 32-detector μSR spectrometer which is optimized for zero field andlongitudinal field measurements. The ISIS synchrotron produces a double pulse ofprotons with a repetition rate of 50 Hz. Each pulse has a width of about 70 ns andthe two pulses are separated by 330 ns. Only one of these pulses is directed towardsthe EMU spectrometer. The repetition rate of 50 Hz makes ISIS unsuitable formeasuring frequencies higher than 8 MHz and relaxation rates larger than 5 μs−1.The advantage however is the very low background, i.e. b ≈ 0 in Eq. 2.5. Thepolarization is then simply calculated by
aP (t) =NF(t) − αNB(t)
NF(t) + αNB(t). (2.6)
Here NF(t) (NB(t)) is the number of counts in the forward (backward) detector andα is an experimental factor determined by detector efficiencies, exact experimentalfactors like distance between sample and detectors, cryostat, etc. It is measured byapplying a transverse field (in the paramagnetic state) at exactly the same experi-mental conditions. With the correct α, PX(t) should oscillate symmetrically aroundzero.
2.2.4 Depolarization and Relaxation Functions
In the previous Sections the basic ideas behind the μSR experiment have been dis-cussed, as well as the spectrometers used in this thesis. The polarization functionPα(t) (α = {X,Z}) extracted from the experiment contains the information on themagnetic distribution at the muon site and the time scale of the magnetic fluctua-tions. A few polarization functions will be discussed here, as far as they were usedin this thesis. For a more extensive study, see e.g. Refs. [18, 19, 17].
Static Magnetic Fields
The starting point of all calculations is the consideration of a single muon spin ina static local magnetic field Bloc oriented in an arbitrary direction. As explained

12 Experimental Techniques
Figure 2.3: Muon spin precession describing a cone around a local magnetic field Bloc.Here θ denotes the angle between the initial muon spin polarization and the local field.
before, the polarization function P(t) is measured either along the X axis or alongthe Z axis. Therefore Pα(t), with α = {X,Z}, reflects the projection of Sμ(t) alongthe X or Z direction. The Larmor precession of a single muon spin and its projectionalong the α direction (depending on whether Sμ(0) ‖ X or Sμ(0) ‖ Z) are illustratedin Fig. 2.3. If all muon spins precess in the same static magnetic field, oriented atan angle θ relative to the initial muon spin direction Sμ(0), the Larmor equationyields
Pα(t) = cos2 θ + sin2 θ cos (ωμt) . (2.7)
where ωμ = γμ |Bloc|. The polarization Pα(t) describes a cone with the local fieldBloc as the axis of rotation. It is only the component of the muon spin perpendicularto Bloc which oscillates. The parallel component is time-independent. Both thesecomponents are projected onto the X or Z direction, depending on the geometry.Eq. 2.7 is the basic equation in μSR.
Clearly, the assumption of a single magnetic field direction for all muons through-out the sample is a very simple model. Neglecting spin dynamics, the assumptionis only encountered in single crystals of ferromagnets and antiferromagnets with anegligible volume fraction of domain walls. Helical structured magnets for exam-ple are excluded, since in different unit cells the local field at the muon site willhave another direction. Obviously, the next step is to assume a field distributionat the muon site. It is easy to see that the polarization function Pα(t) can then bedescribed by
Pα(t) =
∫f (Bloc)
{cos2 θ + sin2 θ cos (γμ |Bloc| t)
}dBloc (2.8)
where f (Bloc) is the normalized magnetic field probability function. If only a single
2.2 μSR Spectroscopy 13
value of Bloc is present, f (Bloc) is a Dirac δ-function and Eq. 2.7 is recovered. Fora polycrystalline ferromagnet with no preferred direction for the grains (“texture”)one can write f (Bloc) = 1/ (4πB2
0) δ (|Bloc| − B0) to obtain
Pα(t) =1
3+
2
3cos (γμB0t) . (2.9)
A static distribution of local magnetic fields at the muon site, as the one aris-ing from randomly oriented static nuclear magnetic moments through their dipolefields, can be very well approximated by a Gaussian field distribution because of thestatistical law of large numbers. This distribution is isotropic and has zero averagefield, so no net precession is observed. Including an external magnetic field Bext
parallel to Z leads to
f (Bloc) =(γμ√2πΔ
)3
exp
(−(γμB
xloc)
2
2Δ2
)exp
(−(γμB
yloc)
2
2Δ2
)exp
(−
γ2μ (Bz
loc − Bext)2
2Δ2
)
(2.10)
where Δ2/γ2μ = 〈B2
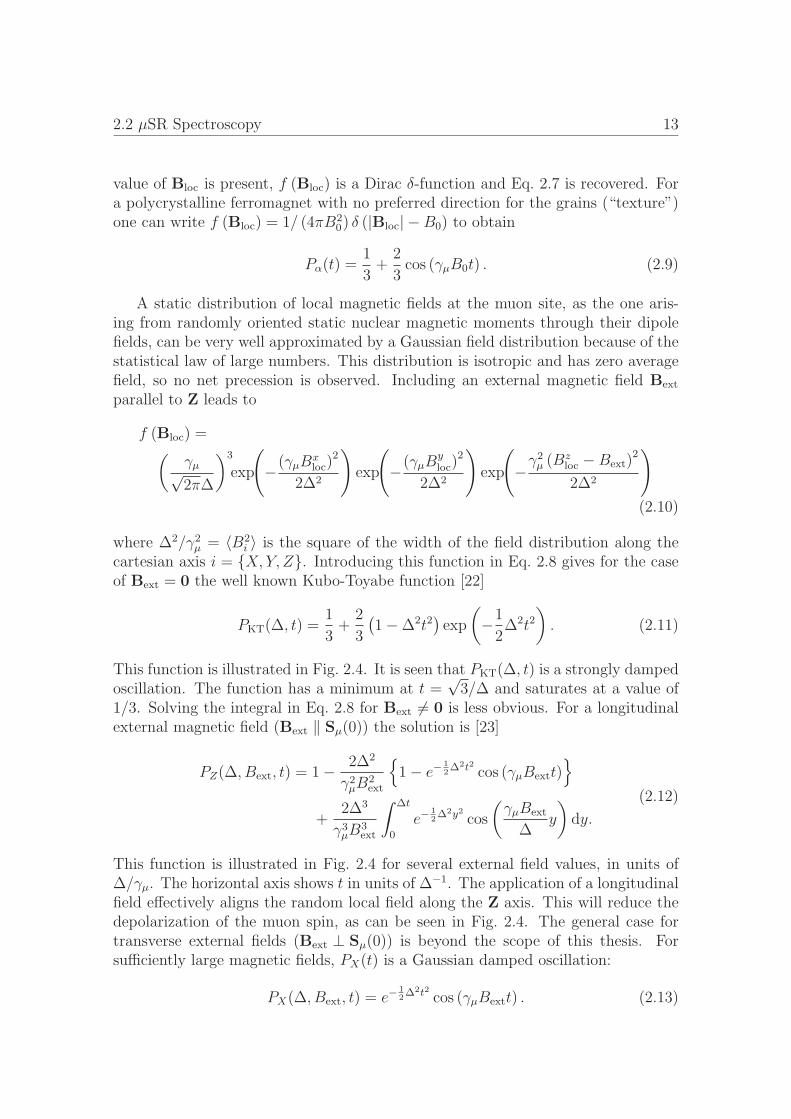
i 〉 is the square of the width of the field distribution along thecartesian axis i = {X,Y, Z}. Introducing this function in Eq. 2.8 gives for the caseof Bext = 0 the well known Kubo-Toyabe function [22]
PKT(Δ, t) =1
3+
2
3
(1 − Δ2t2
)exp
(−1
2Δ2t2
). (2.11)
This function is illustrated in Fig. 2.4. It is seen that PKT(Δ, t) is a strongly dampedoscillation. The function has a minimum at t =
√3/Δ and saturates at a value of
1/3. Solving the integral in Eq. 2.8 for Bext �= 0 is less obvious. For a longitudinalexternal magnetic field (Bext ‖ Sμ(0)) the solution is [23]
PZ(Δ, Bext, t) = 1 − 2Δ2
γ2μB
2ext
{1 − e−
12Δ2t2 cos (γμBextt)
}
+2Δ3
γ3μB
3ext
∫ Δt
0
e−12Δ2y2
cos
(γμBext
Δy
)dy.
(2.12)
This function is illustrated in Fig. 2.4 for several external field values, in units ofΔ/γμ. The horizontal axis shows t in units of Δ−1. The application of a longitudinalfield effectively aligns the random local field along the Z axis. This will reduce thedepolarization of the muon spin, as can be seen in Fig. 2.4. The general case fortransverse external fields (Bext ⊥ Sμ(0)) is beyond the scope of this thesis. Forsufficiently large magnetic fields, PX(t) is a Gaussian damped oscillation:
PX(Δ, Bext, t) = e−12Δ2t2 cos (γμBextt) . (2.13)

14 Experimental Techniques
Figure 2.4: The external magnetic field Bext dependence of the longitudinal depolariza-tion function PZ(Δ, Bext, t) derived from a static Gaussian field distribution with widthΔ/γμ. The values of the external magnetic field are given in units of Δ/γμ. The Kubo-Toyabe function corresponds to the curve labeled with 0.
The Kubo-Toyabe function is most often encountered in systems with nuclearmagnetic moments. Since these moments are small, the magnetic interaction is weakand the fluctuation time is long. Therefore, the created magnetic field at the muonsite can be regarded as static on the scale of the muon life time. In Chapter 4 aCu-Be pressure cell is used in the study of UGe2. In this material it is found thatΔ = 0.345 μs−1 or
√〈B2
i 〉 = 0.4 mT, because of the nuclear moments of 63Cu, 65Cu,and 9Be. In Chapter 5 this function is found as a background coming from the EMUspectrometer, with a typical value of 0.300 μs−1 for Δ.
For different types of magnetic systems, other field distributions at the muonsite than the Gaussian distribution can be relevant. For example, dilute magneticsystems (spin glass) are often well described assuming a Lorentzian distribution.Other case with different field distributions include helical structured magnetism orthe flux line lattice in a type-II superconductor [18].
Fluctuating Magnetic Fields
In contrast to the assumption of a static magnetic field at the muon site - staticcompared to the life time of the muon - the magnetic fields are in reality moreoften fluctuating on the muon time scale. This can be because of paramagneticfluctuations above the magnetic ordering temperature, or because of spin wavesbelow this temperature. In Strongly Correlated Electrons Systems (SCES), or heavy-Fermion systems, a strong competition is present between the RKKY interaction andthe Kondo effect, leading to small ordered magnetic moments and large fluctuations.

2.2 μSR Spectroscopy 15
However, the local field at the muon site can also fluctuate because of the muonitself, i.e. because of its diffusion through the sample. This effect is however not ofimportance in this thesis and will not be discussed further.
A mathematical description of the polarization function Pα(ν, t) due to fluctuat-ing magnetic fields can be obtained by applying the strong collision approximation.In this model, it is assumed that the local field Bloc changes orientation and magni-tude with a single fluctuation rate ν. According to Poisson statistics, the probabilityof j jumps within a time t is νje−νt, where the time ti of the ith jump is arbitrary.The only restriction is that t1 < . . . < ti < . . . < tj < t. After a “collision” thefield is randomly chosen from the probability distribution f(Bloc) applicable to thecompound under study and experimental conditions, without any correlation to thefield before the collision. Before the first collision the polarization Pα(t) should bedescribed by Eq. 2.8. After the first collision the ensemble of muons will furtherdepolarize according to the same function but with an initial time zero at the timeof collision. This process for multiple collisions is given by
Pα(ν, t) = e−νt
[Pα(t) + ν
∫ t
0
Pα(t1)Pα(t − t1) dt1
+ ν2
∫ t
0
∫ t2
0
Pα(t1)Pα(t2 − t1)Pα(t − t2) dt1dt2 + . . .
].
(2.14)
In general, this expression can not be solved analytically and therefore one needsnumerical computation. It is possible [24] to write this formula as
Pα(ν, t) = Pα(t) e−νt + ν
∫ t
0
Pα(ν, t − t′) Pα(t′) e−νt′ dt′. (2.15)
This equation is much easier to solve numerically than Eq. 2.14, and is thereforeused in the computations of Pα(ν, t).
With Pα(t) equal to the zero-field Kubo-Toyabe function PKT(Δ, t) of Eq. 2.11,the numerically calculated depolarization functions PKT
Z (ν, Δ, t) are shown in Fig. 2.5for several values of ν in units of Δ. It is seen that for increasing ν, first the tail ofthe function collapses, followed by an increase of PKT
Z (ν, Δ, t) at small t. For ν/Δsufficiently large, the Laplace transform can be used to find a useful approximateanalytical expression. The resultant formula [24] is given by
PKTZ (ν, Δ, t) = exp
{−2Δ2
ν2[exp (−νt) − 1 + νt]
}. (2.16)
In Fig. 2.5 this function is compared with the numerical calculation for ν/Δ = 3and ν/Δ = 10. It is seen that the agreement is reasonably good. For very fastfluctuations with respect to Δ, PKT
Z (ν, Δ, t) reduces to
PKTZ (t) = exp (−λZt) with λZ = 2Δ2/ν. (2.17)
This the so-called motional narrowing limit.

16 Experimental Techniques
Figure 2.5: The dependence of the dynamical Kubo-Toyabe function on the fluctuationrate ν, according to the strong collision approximation. The numbers indicate the fluc-tuating rate in units of Δ. The static Kubo-Toyabe function corresponds to the curvelabeled with 0. For ν/Δ = 3 and ν/Δ = 10, a comparison is made between the numericalsolution (full line) and the approximation for large ν/Δ in Eq. 2.16 (dashed line).
For applied magnetic fields Bext the integrals in Eq. 2.14 can also be evaluated.For a transverse field, the approximation
PKTX (ν, Δ, Bext, t) = exp
{−Δ2
ν2[exp (−νt) − 1 + νt]
}cos(γμBextt) (2.18)
is valid for large enough ν/Δ. This formula is found via the Laplace transform [24]and is known in NMR as the “Abragam formula”. It reduces to
PX(ν, Δ, Bext, t) = e−λX t cos (γμBextt) with λX = Δ2/ν (2.19)
in the motional narrowing limit (ν/Δ 1). For a longitudinal magnetic field, a sec-ond depolarization process should be considered. Up to now only a distribution inLarmor precession frequencies has been considered as an origin for depolarization.However, with a longitudinal field the muon energy is quantized into two energylevels. The muon spin can be flipped between the two states. The occupancies ofthese states are in theory governed by Boltzmann statistics at thermal equilibrium,although in practice calculations lead to a high degree of equipopulation of the twoenergy levels. The muon beam is however fully polarized at implantation and there-fore the polarization will decrease towards the equilibrium. Note that transverseperturbations (relative to the applied field) with an energy equal to the Zeemansplitting are needed to flip the muon spin. In this way the spectral density functionJ (γμBext) can be probed. A quantum-mechanical calculation [25, 26] shows that

2.2 μSR Spectroscopy 17
λZ , as appears in Eq. 2.17, is modified to
λZ(Bext) =2Δ2ν
(γμBext)2 + ν2
=2Δ2τ
1 + γ2μB
2ext τ 2
(2.20)
with τ = 1/ν the correlation time of the fluctuation. This equation is only valid inthe limit of ν/Δ 1. This formula is used in Chapters 4 and 5. Here it is foundthat a small applied longitudinal field of Bext = 2 mT is enough to reduce λZ toalmost 0. From the value of λZ(0) one can then estimate Δ.
Comments
By applying longitudinal magnetic fields a discrimination between static and fluc-tuating fields can be made. An external field decouples the muon spin and internalfields when these are static. The field distribution does not affect the time evolutionof the muon spin polarization. An example is shown in Fig. 2.4. For |Bext| > 10Δ/γμ
the polarization can be considered constant at 1. Fluctuations, however, are timedependent perturbations and induce spin-flip transitions between the two Zeeman-levels of the muon spin. An exponential function in zero field will therefore still beexponential in non-zero field, although the value of λZ is reduced.
It often occurs that the muons stop at magnetically inequivalent sites. Thiscan be due to a phase separation in the sample (e.g. magnetic domains with adifferent direction of the magnetization), but also the presence of more than onemuon stopping site at crystallographic inequivalent sites with different magneticenvironment belongs to the possibilities. In all these cases the polarization functionPα(t) is the sum of the contributions from the inequivalent muon sites: aPα(t) =∑
i aiPα,i(t). Here the relative values of ai directly measure the volume or populationfraction of the stopping site, if the muons are implanted uniformly into the sample.
In the previous Sections it was explained that either PX(t) or PZ(t) is measured,depending on the direction of the external field Bext relative to the initial muon spinSμ(0), see Fig. 2.2. However, even in zero field PX(t) is measured, when Sμ(0) isperpendicular to the easy direction of e.g. a ferromagnet. The observed wiggles inPX(t) are then referred to as “spontaneous precession”.
2.2.5 Magnetic Field at the Muon Site
The muon localizes at an interstitial site in the host crystal lattice. At this site alocal magnetic induction Bloc is present. The muon spin will precess with an angularfrequency ω = γμ|Bloc| (see Fig. 2.3). A detailed study of Bloc is given in Ref. [19].In a metal, the field at the muon site can be split into several terms:
Bloc = Bext + Bdem + B′dip + BL + Bcon + BP + Bdia, (2.21)
where Bext is the externally applied magnetic field and Bdem the associated demagne-tization field, which is given by Bdem = −μ0NMbulk. Here N is the demagnetization

18 Experimental Techniques
factor tensor that depends only on the shape of the sample. Mbulk is the macro-scopic or bulk magnetization. For a zero-field-cooled ferromagnet, Mbulk = 0, andtherefore, Bdem = 0.
A magnetic moment mi, localized at an atomic site, produces a dipolar field
Bidip =
μ0
4π
{3 (mi · ri) ri
r5i
− mi
r3i
}, (2.22)
where ri is the distance between the muon and the magnetic moment mi on atom i.Since all magnetic atoms will contribute to Bloc, a sum has to be taken extendingover all magnetic atom positions in the sample. For this purpose a so-called Lorentzsphere with radius rLS is defined with the muon at its center.
The magnetic moments outside the Lorentz sphere are regarded as a continuousand homogeneous magnetization density and will contribute to BL. The Lorentzsphere is a “non-magnetic cavity” in a magnetic environment. When the Lorentzsphere is assumed to be within one single magnetic domain, then the field BL isequal to BL = (μ0/3)M, where M is the saturation magnetization.
A discrete sum is taken over all the magnetic moments inside the Lorentz sphere:
B′dip =
∑ri< rLS
Bidip (2.23)
Together with the Lorentz field this results, for most ferromagnets and paramagnets(in applied field), in
B′dip + BL =
μ0
vC (q = 0)m. (2.24)
Here it is assumed that all magnetic moments mi are equal (mi ≡ m, ∀ i). There-fore, the macroscopic magnetization M is parallel to all mi. v is the volume permagnetic atom. C (q) is the coupling tensor that generally depends on the wavevector transfer q [27]. Because ferromagnets are considered in this thesis the wavevector q is equal to 0. The dipolar interaction shows a strong angular dependence(Eq. 2.22), and therefore C (q = 0) will be completely determined by the crystalstructure together with the assumed muon site. If T > TC, Eq. 2.24 can be writtenas
B′dip + BL = C (q = 0) χBext, (2.25)
where χ is the atomic susceptibility tensor with μ0Mbulk = χBext.The next term in Eq. 2.21 is the Fermi contact hyperfine field Bcon. The origin of
this field is the spin polarization of the conduction electrons at the μ+ position, whichin turn predominantly originates from the RKKY exchange interaction between thespins of the conduction electrons and the localized magnetic moments mi at themagnetic atoms. Bcon can be expressed by [27]:
Bcon = μ0
(rμH
4π
)Mi
T>TC=
(rμH
4π
)χBext. (2.26)

2.2 μSR Spectroscopy 19
The term in the brackets is the contact coupling constant, which is in general atensor. However, as a first approximation it may be assumed to be isotropic (i.e.a scalar) and temperature independent. Here rμ is the number of nearest-neighbormagnetic ions to the muon localization site and H the hyperfine interaction tensor.
An additional small contribution BP is caused by the Pauli spin paramag-netism of the conduction electrons: BP = APχPBext. Here AP is an isotropicand temperature-independent tensor (and may therefore be replaced by the scalarAP) and χP the Pauli spin susceptibility tensor.
The last contribution in Eq. 2.21, Bdia, is due to the diamagnetic response of theelectron screening of the muon charge. The diamagnetic screening produces only avery small contribution to the local magnetic field. For materials with an enhancedeffective electron mass m∗, the small diamagnetic contribution is reduced by a factorme/m
∗, becoming negligible for heavy-fermion compounds. For superconductors,however, this term is important.
Knight Shift - determination of the muon site
For the case of a paramagnet in an externally applied field Bext with Sμ(0) ⊥ Bext,a muon frequency shift is usually observed with respect to ω = 2πνμ = γμ|Bext|,i.e. Bloc �= Bext [19, 28]. In a general case Bloc and Bext are not necessarily parallelto each other. As |Bloc − Bext| � |Bext|, it is useful to define an experimental orapparent muon Knight shift Kμ by the projection of (Bloc − Bext) onto Bext:
Kμ =Bext · (Bloc − Bext)
|Bext|2. (2.27)
This is, with respect to ω = 2πνμ = γμ|Bext|, the relative frequency shift experiencedby the muon spin.
Assuming the paramagnetic susceptibility tensor χ is diagonal with elementsχa, χb, and χc, and writing μ0Mbulk = χBext, Kμ can be written with the help ofEq. 2.21 as (Bdia is neglected)
Ki =
[Cii (q = 0) −N ii +
(rμH
4π
)]χi + APχP,
i = {a, b, c} , Bext ‖ i
(2.28)
which is independent of |Bext| and where a, b, and c represent the crystal axes. HereC(q = 0) is the tensor that couples the U magnetic moments m to the magnetic fieldB′
dip + BL (Eq. 2.24) at the muon site. For a spherically shaped sample (N ii = 13)
the contribution of the demagnetization field Bdem and the Lorentz field BL cancelexactly. Since Ki
μ depends linearly on χi, Kμ is presented as a function of χ for agiven direction of Bext with the temperature as an implicit parameter. From theseso-called Clogston-Jaccarino plots, together with the fact that TrC(q = 0) = 1,the values of Cii(q = 0) and of rμH/4π can be extracted. Comparing the measuredvalues of Cii(q = 0) with calculated ones, the muon site can be determined.

20 Experimental Techniques
Figure 2.6: Schematic setup of the PANDA. Indicated are the monochromator M, thepolarizer P, the rotators R, the sample S, the analyzer A, and the detector D. The directionof the neutron beam is denoted x and the vertical direction z. The applied magnetic fieldis along z.
2.3 Three-Dimensional Neutron Depolarization
In this Section a brief summary is given on the three-dimensional neutron depolar-ization (3DND) technique. In Fig. 2.6 a schematic picture of the set-up is givenof the poly axis neutron depolarization analyzer (PANDA) at the Reactor InstituteDelft (RID) of the Delft University of Technology.
The neutron depolarization (ND) technique is based on the loss of polarizationof a polarized neutron beam after transmission through a (ferro)magnetic sample.Each neutron undergoes only a series of consecutive rotations on its passage throughthe (ferro)magnetic domains in the sample. It is important to note that the beamcross section covers a huge number of domains, which results in an averaging over themagnetic structure of the whole illuminated sample volume. This averaging causes aloss of polarization, which is related to the mean domain size and the mean directioncosines of the domains. The rotation of the polarization during transmission probesthe average magnetization.
In a ND experiment, a 3 × 3 depolarization matrix D expresses the relationbetween the polarization vector P0 before and P1 after transmission through thesample according to [29, 30, 31]
P1 = D P0. (2.29)
The monochromator M selects a fixed neutron wave length of 2.03 A which corre-sponds to a velocity of 1949 m/s. The polarization of the monochromatic neutronbeam is created and analyzed by magnetic multilayer polarization mirrors (P and Ain Fig. 2.6). In order to obtain the complete matrix D, one polarization rotator (R)is placed before the sample and another one right after the sample. Each rotatorprovides the possibility to turn the polarization vector parallel or antiparallel to thecoordinate axes x, y, and z. The resultant neutron intensity is finally detected bya 3He detector D. The polarization rotators enable the measurement of any matrixelement Dij with the aid of the intensity of the unpolarized beam IS
IS =Iij + I−i,j
2, (2.30)

2.3 Three-Dimensional Neutron Depolarization 21
where Iij is the intensity for P0 along i and P1 along j. The matrix element Dij isthen calculated according to
Dij =1
P0
IS − Iij
IS
, (2.31)
where P0 is the degree of polarization in the absence of a sample. In the presentcase, P0 = 0.965, which is experimentally determined.
Now the correlation matrix αij is introduced as [29, 30, 31]
αij =
⟨∫ L
0
dx′ΔBi(x, y, z)ΔBj(x′, y, z)
⟩, (2.32)
where ΔB(r) = B(r) − 〈B〉 is the variation of the magnetic induction and angularbrackets denote the spatial average over the sample volume. The integral is takenover the neutron transmission length L through the sample. Assuming αij ≡ 0 fori �= j, the correlation function ξ is defined as
ξ =∑
i
αii. (2.33)
With these quantities it can be shown that if there is no macroscopic magnetization(〈B〉 = 0) the depolarization matrix is diagonal and under the assumption thatαij ≡ 0 for i �= j given by [29, 30, 31]
Dii = e−γ2
v2 L{ξ−αii} i = x, y, z, (2.34)
where γ = 1.83 × 10⁸ s−1T−1 is the gyromagnetic ratio of the neutron and v =1949 m/s the neutron velocity.
The phenomenon that for magnetically isotropic media the depolarization de-pends on the orientation of the polarization vector with respect to the propagationdirection of the neutron beam, is known as intrinsic anisotropy. The origin of thisintrinsic anisotropy is that the line integral of the demagnetization fields aroundmagnetized volumes in the sample along the neutron trajectory is not isotropic dueto ∇·B = 0. In the following it will be assumed that the demagnetization fields arenegligible for needle-shaped magnetic domains.
When the sample shows a net magnetization, the polarization vector will rotate ina plane perpendicular to the magnetization direction. If the sample shape gives riseto macroscopic stray fields, the rotation angle φ is related to the net magnetization〈M〉 by
φ = ηγ
vLμ0〈M〉 = η
γ
vLμ0MS〈m〉, (2.35)
where η is a geometrically factor given in Eq. 4.51 for a rectangular-shaped sampleand 〈m〉 = M/MS the reduced sample magnetization in terms of the saturation mag-netization MS = MS(T ). If the mean magnetic induction 〈B〉 in the sample is ori-ented along the z axis, the depolarization matrix is, for φ (γ/v)2 |αxx − αyy|L/2

22 Experimental Techniques
(the weak damping limit), given by [29, 30, 31]
Dxx = Dyy = e−γ2
v2 L{ξ−αxx+αyy2 } cos φ,
Dxy = −Dyx = e−γ2
v2 L{ξ−αxx+αyy2 } sin φ,
Dzz = e−γ2
v2 L{ξ−αzz},
Dxz = Dzx = Dzy = Dyz = 0.
(2.36)
With the net magnetization along the z axis, the rotation angle φ of the beampolarization is obtained from the measurements by
φ = arctan
(Dxy − Dyx
Dxx + Dyy
)(2.37)
and ξ is calculated withξ = −v2 ln {det D} /2γ2L. (2.38)
As mentioned earlier, ND provides information about the mean-square directioncosines of the magnetic induction vector in the (ferro)magnetic domains. These aredirectly given by the quantities γi = αii/ξ (i = x, y, z), and can be estimated fromthe measurements by
γi = 1 − 2 ln {Dii} / ln {det D} . (2.39)
This equation is only valid for those directions that show no net rotation of thebeam polarization.
2.4 Macroscopic techniques
2.4.1 Magnetization
The measurements of magnetization M and magnetic susceptibility χ at ambientpressure were performed on a Quantum Design’s magnetic property measurementsystem (MPMS). This instrument uses a Superconducting QUantum Interface De-vice (SQUID), which is the most sensitive device available for measuring magneticfields. The principles of operation are nicely demonstrated in Ref. [32]. Magnetiza-tion measurements at fields up to 5.5 T were performed in the temperature rangeof 1.8 to 300 K at Leiden University and the University of Amsterdam (UvA).
Magnetization measurements at pressures up to 0.43 GPa were performed us-ing an Oxford Instruments MagLab vibrating sample magnetometer (VSM) at thePhysikalisches Institut of the Universitat Karlsruhe (TH). Magnetic field scans wereperformed in fields up to 12 T at several temperatures. The pressure clamp cell wasmade of a CuBe alloy. The pressure was determined by measuring the superconduct-ing transition temperature Ts of a piece of lead inside the pressure cell (Ts = 7.2 Kat ambient pressure). The pressure transmitting medium was a mixture of methanoland ethanol (1 : 4).

2.4 Macroscopic techniques 23
Magnetization at ambient pressure has also been measured in magnetic fieldsup to 52 T using the pulsed magnetic field facility of the Laboratoire National desChamps Magnetiques Pulses (LNCMP) in Toulouse. The magnetization in pulsedmagnetic fields is deduced from the voltage V (t) induced by a time varying magneticinduction B(t) in a pickup coil. Maxwell’s second law reads in differential form∇× E = −∂B(t)/∂t and in integral form∮
C
E · dl = −∫∫
∂B(t)
∂t· dS (2.40)
where E is the electric field and l and S are the length and the enclosed area of thecontour C, respectively. For a coil with N windings and an inner area A it reducesto
V (t) = −NA∂B(t)
∂t(2.41)
when B is parallel to the coil axis. Note that B = μ0 (H + M) where H is theapplied magnetic field and M the magnetization of the sample (along the coil axis).To get M , the voltage induced by the external field has to be compensated byadditional compensation coils. The induced voltages can then be written as
V1(t) = −μ0NA
(∂H(t)
∂t+
∂M(t)
∂t
),
V2(t) = −μ0NA∂H(t)
∂t.
(2.42)
These two signals can be subtracted from one another, or the two coils can beconnected and wound in opposite direction. Apart from a calibration factor, themagnetization M(t) is obtained by numerical integration of V (t) = V2(t) − V1(t)over t. From the values of H(t), deduced from V2(t), it is possible to reconstructM(H).
2.4.2 Thermal Expansion and Magnetostriction
High-precision measurements of the sample length as a function of temperature Tor magnetic field B were performed on single-crystalline samples using the parallel-plate capacitance method. The sample is connected to one of the plates, whereasthe other plate is fixed. Because the capacitance C is given by
C =εA
d, (2.43)
where d is the distance between the plates, A the area of the plates, and ε = εrε0 thedielectric constant of the medium between the plates, the length of the sample isinversely proportional to the capacitance. ε0 is the dielectric constant of the vacuumand εr the dielectric constant of a medium, relative to ε0.
24 Experimental Techniques
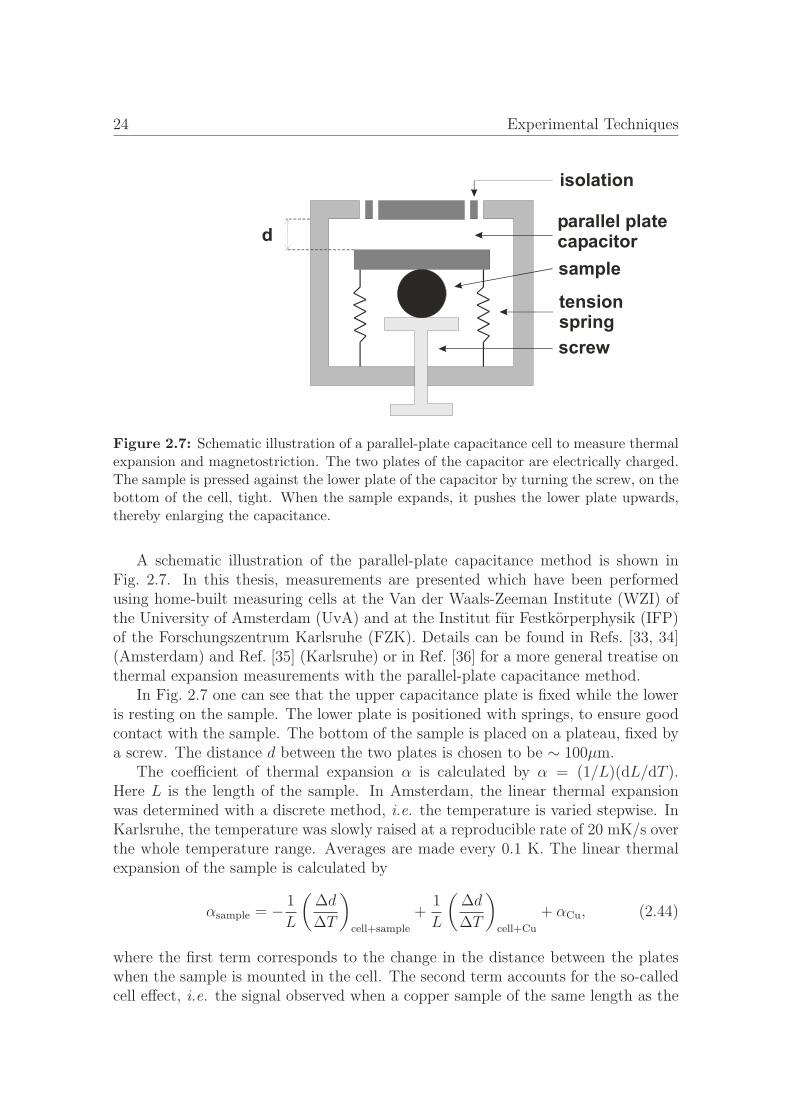
Figure 2.7: Schematic illustration of a parallel-plate capacitance cell to measure thermalexpansion and magnetostriction. The two plates of the capacitor are electrically charged.The sample is pressed against the lower plate of the capacitor by turning the screw, on thebottom of the cell, tight. When the sample expands, it pushes the lower plate upwards,thereby enlarging the capacitance.
A schematic illustration of the parallel-plate capacitance method is shown inFig. 2.7. In this thesis, measurements are presented which have been performedusing home-built measuring cells at the Van der Waals-Zeeman Institute (WZI) ofthe University of Amsterdam (UvA) and at the Institut fur Festkorperphysik (IFP)of the Forschungszentrum Karlsruhe (FZK). Details can be found in Refs. [33, 34](Amsterdam) and Ref. [35] (Karlsruhe) or in Ref. [36] for a more general treatise onthermal expansion measurements with the parallel-plate capacitance method.
In Fig. 2.7 one can see that the upper capacitance plate is fixed while the loweris resting on the sample. The lower plate is positioned with springs, to ensure goodcontact with the sample. The bottom of the sample is placed on a plateau, fixed bya screw. The distance d between the two plates is chosen to be ∼ 100μm.
The coefficient of thermal expansion α is calculated by α = (1/L)(dL/dT ).Here L is the length of the sample. In Amsterdam, the linear thermal expansionwas determined with a discrete method, i.e. the temperature is varied stepwise. InKarlsruhe, the temperature was slowly raised at a reproducible rate of 20 mK/s overthe whole temperature range. Averages are made every 0.1 K. The linear thermalexpansion of the sample is calculated by
αsample = − 1
L
(Δd
ΔT
)cell+sample
+1
L
(Δd
ΔT
)cell+Cu
+ αCu, (2.44)
where the first term corresponds to the change in the distance between the plateswhen the sample is mounted in the cell. The second term accounts for the so-calledcell effect, i.e. the signal observed when a copper sample of the same length as the

2.4 Macroscopic techniques 25
sample under investigation is mounted. This cell effect is found to reproduce verywell. The last term is the linear thermal expansion of the copper of the cell.
Because the capacitance can be measured very accurately, total length changesdown to 0.05 A are measurable. This means that for samples of just 1 mm length,a resolution of 5 · 10−8 K−1 can be obtained in α(T ) for a temperature step ofΔT = 0.1 K.
The linear magnetostriction λ(B) = (L(B)−L(0))/L(0) was measured by mon-itoring the length change of the sample as a function of the applied magnetic fieldB at a constant temperature. The magnetostriction of the copper of the cell turnsout to be negligible. The measurements were performed in Karlsruhe during fieldscans with a sweep rate of dB/dt = 0.25 T/min. The constant temperature wascontrolled by a metal plate with low magnetoresistivity.
2.4.3 Electrical Resistivity
Electrical resistivity measurements were performed at the Van der Waals-ZeemanInstitute (WZI) of the University of Amsterdam (UvA) using a standard four probeac technique in zero field in the temperature range from to 2 to 300 K. A MagLabsystem of Oxford Instruments was used.
2.4.4 Specific Heat
The specific heat Cp(T ) measurements presented in Chapter 6 were performed atthe Van der Waals-Zeeman Institute (WZI) of the University of Amsterdam (UvA)using the semi-adiabatic method in combination with a mechanical heat switch in a3He cryostat. The set-up was home-built. The samples were 3 - 4 grams in mass.
The specific heat Cp(T ) measurements presented in Chapter 7 were performed atthe Institut fur Festkorperphysik (IFP) of the Forschungszentrum Karlsruhe (FZK)using the commercially available Physical Property Measurement Systems (PPMS)of Quantum Design. The measurements were performed by the heat relaxationmethod in a temperature range between 3 and 300 K and in magnetic fields up to14 T. Heat capacity was obtained by fitting a heat relaxation curve recorded after aheat pulse caused a temperature increase of approximately 2 %. The heat capacityof the addenda (Apiezon N grease) had been measured in a separate run withoutthe sample, and was subtracted from the data. For further details, see Ref. [37].
2.4.5 X-ray Powder Diffraction
X-ray diffraction measurements at room temperature were performed using a BrukerD3 Advance X-ray diffractometer with Cu-Kα radiation. Powders prepared fromthe polycrystalline samples were covered by Kapton foil to prevent contamination.Rietveld analysis of the diffraction data was performed using the GSAS program [38].

26 Experimental Techniques
Figure 2.8: Illustration of how the angles θ at which constructive interference of scatteredwaves occurs, can be found. Diffracted X-rays are in phase when the path length difference2d sin θ is equal to nλ, with n an integer, i.e. an integral number of wave length λ.
X-ray powder diffraction is a powerful technique used to identify crystal struc-tures of compounds. The principle behind this technique is based on the construc-tive interference of X-rays, scattered from the illuminated sample. The measuredintensity as a function of the scattering angle 2θ yields information on the spacingbetween planes of atoms in the crystal structure, as well as the sites of the atomswithin the unit cell.
In Fig. 2.8 it is illustrated how the Bragg angles θ at which constructive inter-ference of scattered waves occurs, can be found. The diffracted rays will only be inphase if the difference in path length is equal to an integer times the wavelength λ.This is summarized by Bragg’s law
nλ = 2d sin θ (2.45)
where n is the order of diffraction and d the interplanar spacing.The accuracy with which the lattice parameters of a compound can be deter-
mined, depends on the accuracy in the determination of 2θ. In this thesis (Chapter 6)the lattice parameters were measured with an uncertainty of 0.01 A.
The relative intensity of the diffraction peaks is mainly controlled by the struc-ture factor. The structure factor Fhkl is given by
Fhkl =N∑
n=1
fn exp(2πi (hun + kvn + lwn)
)(2.46)
where h, k, and l are the Miller indices of the scattering plane and u, v, and w arethe reduced position indices of the N atoms in the unit cell. The atomic scatteringfactor fn is a measure for the ability of an atom to scatter X-rays, relative to thatof a single electron. The scattered intensity I is proportional to |Fhkl|2.

CHAPTER 3
Theory
his Chapter intends to introduce the basic concepts of the theo-ries relevant to the work described in this thesis and is organized asfollows. First, the nature of the electron correlations between theconduction electrons and the f electrons from the magnetic ions isdescribed by introducing the relevant energy scales. Then the con-cept of a quantum critical point is discussed, followed by a description
of Fermi liquid behavior and non-Fermi liquid behavior. After the introduction ofGruneisen parameters and a review on (magnetic) phase transitions, a few recenttheories about ferromagnetic superconductors will be presented. This discussion isnot aimed to be complete but gives a general overview.
3.1 Heavy Fermions
In the field of strongly correlated electrons systems (SCES), different classes ofcompounds are at the focus in present research. Among them, the intermetalliccompounds known as heavy-fermion compounds have already been studied exten-sively. The known heavy-fermion compounds generally are Ce, Yb, and U basedintermetallics, although Np and Pu compounds are also reported. For these systemsthe term “heavy” is connected to the large characteristic effective masses of the con-duction electrons. Experimentally this is observed in a large electronic contributionto the specific heat at low temperatures. Direct proof of heavy quasiparticles can beobtained by the de Haas-van Alphen effect. Here one measures the cyclotron massesof the quasiparticles in magnetic resonance measurements of the magnetization.
Within the standard description of heavy-fermion physics, the large mass en-hancement is thought to be generated by an exchange interaction between localizedand conduction electrons. This is called the Kondo effect. Originally, the Kondoeffect was established for a single magnetic impurity interacting with the conduction

28 Theory
electrons of a non-magnetic matrix [39]. In a lattice of magnetic ions that stronglyinteract with the conduction electrons, a so-called Kondo lattice is formed.
Anderson Hamiltonian
In order to study the heavy-fermion state, it is useful to start with the single-impurity case. Anderson considered a single magnetic impurity (in this thesis anf -electron impurity will be assumed) within a non-magnetic metallic host lattice [40]and reached at the often used Anderson model to describe magnetic impurities in ahost:
HA =∑kσ
ε(k)nkσ + εf
∑m
nfm +1
2U
∑m�=m′
nfmnfm′
+∑km
(Vmσ(k)f+
mckσ + V ∗mσ(k)c+
kσfm
)(3.1)
The first term represents the energy of the conduction electrons. Here ε(k) is theenergy dispersion relation of the conduction-electron band and nkσ the number op-erator for wave vector k and conduction electron spin σ. The second term accountsfor the energy of the f -electrons localized at the magnetic impurity, where εf is theenergy of the degenerate f -orbital and nfm is the number operator with m the spinindex of the 2j + 1 impurity states. The third term describes the on-site Coulombinteraction between two localized f -states. U is the energy needed to add a secondf -electron to the localized, partially filled, f -orbital. It causes an energy splittingof the valence states fn. If U is high enough, double occupancy is not favorable andone state is pushed above the Fermi level. This leads to a polarized splitting and asa consequence to a magnetic impurity state. The last term in Eq. 3.1 correspondsto the hybridization between the f -states and the conduction electron states. HereVmσ(k) is the hybridization integral that mixes the localized and extended states.The operators f+ and c+ (f and c) are the creation (annihilation) operators opera-tors of the localized and conduction-electron states, respectively.
Kondo interaction
Due to the hybridization both f -states (spin “up” and spin “down”) are broadened.The energy width of the state is defined as Γ = πN(EF)|V |2, where the matrixelements V (k) have been averaged over the Fermi surface. N(EF) denotes thedensity of states at the Fermi level EF. For a weak hybridization and a large enoughU , one impurity f -state is below the Fermi level and the other above, while neitherof them is significantly broadened, i.e. |Γ/(εf −EF)| � 1 and |Γ/(εf +U−EF)| � 1.
For a weak hybridization of the localized f -states and the conduction states theAnderson Hamiltonian can be transformed into the Kondo Hamiltonian [41]
HK = −2J S · σ (3.2)

3.1 Heavy Fermions 29
where S is the localized impurity spin and σ the conduction-electron spin. J is aneffective exchange parameter which originates form the hybridization and can beexpressed as
J = |V |2 U
(εf − EF)(εf − EF + U)< 0. (3.3)
Because of the negative value of J the coupling between the impurity spin and theconduction-electron spin has an antiferromagnetic nature. In the ground state theimpurity spin is found to be completely screened (compensated) by the surroundingconduction electron spins. The ground state of the system is a non-magnetic singlet.This singlet state leads to the formation of a narrow peak in the density of statesclose to the Fermi level, which is known as the Abrikosov-Suhl or Kondo resonance.
Due to the formation of a singlet the energy of the system is lowered. Theenergy gain can be expressed by a characteristic temperature. This is the Kondotemperature TK and can be written as
kBTK = D exp
(− 1
N(EF)|J |
)(3.4)
where D is the bandwidth of the Kondo resonance peak and is of the order ofkBTK. The classical signature of the Kondo effect is a minimum in the temperaturedependence of the electrical resistivity ρ(T ) followed by a logarithmic increase withdecreasing temperature. As a consequence of the enhanced density of states at theFermi level N(EF), a large linear term γ in the electronic specific heat is observedat low temperatures. The scaling behavior corresponds to γ ∝ N(EF) ∝ 1/TK.
From Kondo impurity to Kondo lattice
So far a single magnetic impurity in a non-magnetic matrix has been considered.However, intermetallic compounds without chemical substitution containing e.g. Uor Ce atoms form a periodic array of magnetic impurities. One then speaks of aKondo lattice.
The low-temperature properties of the Kondo lattice differ drastically from thesingle-impurity Kondo case. In the latter case, the resistivity shows a minimumaround T = TK and follows ρ ∝ − ln(T/TK) at low temperatures. In the formercase, however, this upturn changes again into a decrease in ρ(T ) for decreasingtemperatures, with a T 2-temperature dependence at the lowest temperatures.
This behavior can be understood by considering the electron-screening cloudaround a localized moment. For T > TK local magnetic moments are observed,(with Curie-Weiss behavior of the magnetic susceptibility) since thermal fluctuationsbreak the hybridization between the local moment and the conduction electrons.Below T < TK the conduction electrons tend to screen the magnetic moment. Thiselectron-screening cloud has a certain correlation length which grows with decreasingtemperature. Below a certain temperature Tcoh < TK this correlation length is so

30 Theory
Figure 3.1: Schematic picture of the density of states in the Kondo lattice. For hightemperatures (Tcoh < T < TK), a Kondo resonance peak is present around EF. Forlow temperatures (T < Tcoh) the coherent electronic state is characterized by a narrowmany-body band just above EF.
large that the screening clouds show a significant overlap and a coherent many-bodyband with Fermi-liquid characteristics is induced [42].
A schematic picture of the density of states in the Kondo lattice is presented inFig. 3.1 [34, 43]. As the temperature is lowered from high temperatures to belowTK, a broad peak develops around the Fermi level EF, originating from the Kondoresonance, as explained above. In addition there are two peaks from the broadenedf -orbitals of the magnetic ions. These two peaks are separated by the Coulombinteraction U . At these temperatures the characteristics of the system are still gov-erned by the broad f -peak below EF (since the Kondo resonance, which is centeredjust above EF, is not sharp enough to have much influence), resulting in a morelocalized picture. For lower temperatures, the Kondo resonance peak transformsinto a very narrow many-body band just above EF and electronic coherence setsin. This peak now accounts for the observed properties in heavy-fermion systems,resulting in the characteristic Fermi-liquid behavior with a high effective mass forthe conducting quasiparticles.
A very nice example of this behavior is CeCu6 [44]. The resistivity data, pre-sented in Fig. 3.2, clearly indicate the existence of the two energy scales. The hightemperature energy scale is the Kondo temperature TK ≈ 200 K. Below this tem-perature the scattering is enhanced and still incoherent, due to the single-ion Kondoeffect. This results in a logarithmic increase below TK. As the temperature is low-ered, coherence sets in which manifests itself in a maximum in the resistivity atTcoh ≈ 10 K. At low temperatures the resistivity shows a T 2 dependence.

3.1 Heavy Fermions 31
Figure 3.2: Temperature dependence of the electrical resistivity of CeCu6. The logarith-mic increase below 200 K is associated with the incoherent single-ion Kondo effect. Ascoherence sets in, a maximum is observed and the resistivity drops. At low temperaturesthe resistivity shows a T 2 dependence.
RKKY interaction
In a system of well separated, localized magnetic moments there is hardly any di-rect interaction between the moments. However, there does exist an indirect ex-change through the polarization of the conduction electrons. This exchange causesan interaction between the localized moments, called the RKKY interaction (afterRuderman, Kittel, Kasuya, and Yosida [45, 46, 47]). It is based on the electrostaticinteraction in conjunction with the Pauli exclusion principle. Near a localized spinS1 the spins of the conduction electrons are polarized due to an interaction whichcan be described by a Hamiltonian identical to Eq. 3.2. The spin polarization is adamped, oscillatory function in space and extends over a long range. A second spinS2 at distance r is in turn polarized by the conduction-electron polarization. Thisinteraction can lead to magnetic order. The strength is characterized by an energyequal to
kBTRKKY ∝ N(EF) J2 (3.5)
where J is the exchange parameter of the localized moment and the conduction-electron spin.
Doniach phase diagram
The ground state of a Kondo-lattice system mainly depends on the balance of thetwo aforementioned effects, both depending on the same exchange parameter J . Onthe one hand the Kondo effect has the tendency to screen the localized momentsand produce a non-magnetic ground state, on the other hand the RKKY interactionfavors long-range magnetic order. The result of this competition is summarized inthe Doniach phase diagram [42, 48] presented in Fig. 3.3. Within this simple modelthe compounds with stable f moments (characterized by TRKKY > TK) have a smallvalue for J . Long-range magnetic order is observed below the magnetic orderingtemperature TM, which is proportional to TRKKY. For larger values of J the Kondointeraction gains in importance and TM starts to decrease. The system shows a

32 Theory
Figure 3.3: The Doniach phase diagram. The characteristic RKKY and Kondo tempera-tures are represented as functions of the exchange parameter J . Different types of groundstates are also represented. The thick solid line indicates the temperature of the magnetictransition TM.
magnetic instability at a critical value of J = Jc. At this point the Kondo andRKKY interaction strengths are equal. Because the magnetic fluctuations are notthermally driven but quantum mechanical in nature, this point is called a quantumcritical point (QCP). For J > Jc the Kondo effect prevails (TK > TRKKY) and a non-magnetic ground state is observed. Below Tcoh a coherent ground state is found, asexplained above.
Hill’s limit
As can be seen from the preceding discussion, the type of magnetic behavior dependsstrongly on the strength of the interaction between the localized magnetic statesand the conduction electrons. When this interaction is mediated by the conductionelectrons, one speaks about an indirect exchange interaction, of which the RKKYmechanism is an example. However, in the case of a 5f -electron system with a smallseparation of the local moments, overlap between 5f -wave functions can also causea direct interaction.
Hill [49] has performed a systematic study of magnetic properties of intermetallicuranium compounds, known at that time (1970) as a function of the nearest neighbordistance dU−U. It was shown that for dU−U < 3.4 A the uranium compounds hada paramagnetic ground state and were often superconducting at low temperatures.For dU−U > 3.6 A the compounds were generally magnetic. The interpretationfor these observations is that the ground state is a consequence of the extent towhich the 5f -orbitals overlap. For small values of dU−U uranium f -electron orbitals

3.2 Quantum Phase Transitions 33
in the lattice overlap directly with those of the neighboring U ions and produceitinerant f -electron behavior. The f -electrons are delocalized from the U ion tothe conduction band and open the way to superconductivity. On the other hand,for large values of dU−U long-ranged magnetic order sets in with the f -electronslocalized at the uranium ion. At dU−U ≈ 3.5 A, the uranium systems, being on theedge of becoming magnetic, exhibit strong spin fluctuations.
For more than one decade the Hill criterion was remarkable successful. However,when several compounds, among which the heavy-fermion systems, were found toviolate this criterion, it was realized that the overlap of the 5f -orbital with s, p, ord-orbitals of non-uranium neighbors could considerably contribute to the delocal-ization of the U 5f -electrons.
The degree of delocalization of the 5f -orbitals due to f -ligand hybridization(where ligand stands for non-5f atom) has been discussed by Koelling et al. [50].It was shown that not the magnitude of the ligand orbital governs the f -ligandhybridization, but its spatial curvature. A consequence is that the hybridizationis largest for the top of the ligand band i.e. the electron wave functions with thehighest kinetic energy. From the systematic trends in Ce and U compounds it wasconcluded that in heavy-fermion systems it is the f -ligand hybridization, ratherthan the direct f -f orbital overlap, which is the primary mechanism determiningthe magnetic properties of the system.
3.2 Quantum Phase Transitions
Phase transitions occur upon variation of an external control parameter. Theircommon characteristic is a qualitative change in the system properties. Well-knownphase transitions, like paramagnetism to magnetic order or from a metallic stateinto a superconducting one, occur at finite temperature. Here macroscopic orderis destroyed by thermal fluctuations for increasing temperatures. A different classof phase transitions shows a transition at zero temperature. It was pointed out byHertz [51] that when a non-thermal control parameter such as pressure, magneticfield, or chemical composition is varied to access the transition point, long-rangeorder is destroyed solely by quantum fluctuations. Hence, one speaks of a quantumphase transition. Experimental and theoretical developments in the last decadeshave made clear that the presence of such zero-temperature phase transitions playsan important role in the so-far unsolved puzzles in heavy-fermion compounds, seee.g. Refs. [52, 53]. The physical properties of the quantum fluctuations, whichcan destroy long-range order at absolute zero temperature, are quite distinct fromthose of the thermal fluctuations responsible for traditional, finite-temperature phasetransitions [54, 55].
A transition is usually characterized by an order parameter. This is a thermo-dynamic quantity that is zero in the disordered phase and non-zero in the orderedphase. In the case of a ferromagnetic transition, the total magnetization is the or-der parameter. While the thermodynamic average of the order parameter is zero

34 Theory
in the disordered phase, its fluctuations are non-zero. When the critical point isapproached, the spatial correlation of the order parameter fluctuations become long-range. Close to the critical point their typical length scale, the correlation length ξ,diverges as
ξ ∝ |τ |−νcor (3.6)
where νcor is the correlation length critical exponent and τ = |T−TC|/TC. In additionto the long-range correlations in space there are analogous long-range correlations intime. The typical timescale for the decay of a fluctuation is the correlation time τc
which diverges asτc ∝ ξz ∝ |τ |−νcorz (3.7)
where z is the dynamic critical exponent. Close to the critical point there are noother characteristic length and time scale than ξ and τc, respectively.
Since close to the critical point the correlation length ξ is the only relevant lengthscale, the physical properties must be unchanged if all lengths in the system (muchsmaller than ξ) are rescaled by a common factor and at the same time the externalparameters are adjusted in such a way that the correlation length retains its oldvalue. In the case of a magnetic compound the external parameters are the reducedtemperature τ and the applied magnetic field B. This gives rise to the homogeneityrelation for the free energy density in the classically critical regime [56, 57, 58]:
f(τ, B) = b−df(τ b1/νcor , B byB), (3.8)
where yB is a critical exponent, b is an arbitrary positive number, and d the dimen-sion of the system.
In order to address the question whether quantum mechanics influences the criti-cal behavior, the characteristic energy of long-distance order parameter fluctuations,�ωc, has to be compared to the thermal energy kBT . Since τc ∝ |τ |−νcorz, the typicalenergy scale �ωc goes to zero as
�ωc ∝ |τ |νcorz. (3.9)
Quantum mechanics is unimportant as long as �ωc � kBT , which enables a purelyclassical description of the order parameter fluctuations. On the other hand, aquantum mechanical description of the fluctuations is inevitable when �ωc > kBT .
For all finite-temperature phase transitions with a transition temperature Tc atemperature range can be found where �ωc ∝ |τ |νcorz < kBTc. In other words,the critical behavior asymptotically close to the transition is entirely classical. Al-though quantum mechanics can still be important on microscopic scales, the classicalthermal fluctuations dominate on the macroscopic scale, which controls the criticalbehavior. If, however, the transition takes place at zero temperature as a functionof a non-thermal parameter r, like pressure, magnetic field, or chemical substitutionconcentration, the behavior is always dominated by quantum fluctuations.
The interplay of classical and quantum fluctuations leads to an interesting phasediagram in the vicinity of a quantum critical point (see Fig. 3.4). A classical phase

3.2 Quantum Phase Transitions 35
Figure 3.4: Schematic phase diagram in the vicinity of a quantum critical point. Thehorizontal axis represents the control parameter r used to tune the system through thequantum phase transition, and the vertical axis is the temperature T . The solid line marksthe finite-temperature boundary between the ordered and thermally disordered phases.Close to this line, the critical behavior is classical. The dashed lines indicate the boundariesof the quantum critical region. These crossover lines are given by kBT ∝ |r−rc|νcorz. Figuretaken from Ref. [55].
transition is encountered upon variation of T at small r. The quantum criticalpoint can be viewed as the endpoint of the line of finite-temperature transitions.Above this line, the system is thermally disordered. For r > rc at low T , thephysics is dominated by quantum fluctuations. An example is the Kondo effect,discussed in the previous Section. Between these two disordered phases a quantumcritical region exists, where both types of fluctuations are important. It is locatednear the critical point at r = rc. Its boundaries are determined by the conditionkBT > �ωc ∝ |r − rc|νcorz. Physically this means that the system looks critical withrespect to the tuning parameter r, but it is driven away from criticality by thermalfluctuations. The upper boundary is determined as the temperature at which kBTexceeds the characteristic microscopic energy scale, e.g. the exchange energy J formagnetic materials. Since in the quantum critical region the physics is controlledby the thermal excitations of the quantum critical ground state, unusual finite-temperature properties, such as unconventional power laws and non-Fermi liquidbehavior, are observed. In other words, non-Fermi liquid properties arise becauseclose to r = rc the low-temperature thermodynamics is determined by collectivemodes (excitations of the order parameter). This is in contrast to the single-fermionexcitations (quasiparticles) from collective interactions in the Fermi-liquid regime.

36 Theory
Thermodynamic properties are derived from the partition function
Z = Tr e−H/kBT (3.10)
where H = Hkin + Hpot is the Hamiltonian of the system. In a classical systemthe kinetic and potential part of H commute. Since in this case Z = ZkinZpot, thedynamics and statics are decoupled. However, in a quantum mechanical approachHkin and Hpot in general do not commute, and therefore dynamics and statics arecoupled. According to Eq. 3.7, the correlation time scales as the zth power of acorrelation length. For second-order phase transformations the classical homogeneitylaw (Eq. 3.8) for the free energy density can now, be written for the quantummechanical case at zero temperature as [55]
f(δ, B) = b−(d+z)f(δ b1/νcor , B byB), (3.11)
where δ = |r − rc|/rc. This shows that a quantum phase transition in d dimensionsis related to a classical transition in deff = d + z dimensions. With z = 3 forferromagnets, the effective dimension deff = 6. In this case the fluctuations maythen be accounted for in a self-consistent mean field approximation [56].
The search for a second order quantum phase transition in itinerant-electron sys-tems, which is believed to be responsible for exotic quantum phases like magneticallymediated superconductivity and non-Fermi liquid behavior, has become the subjectof many researchers in recent years. The compounds CePd2Si2 and CeIn3 [59] aregood examples of superconductivity emerging around a quantum phase transition.However, also notable differences from standard second order behavior have beenfound. MnSi [60] and ZrZn2 [61] undergo a first order quantum phase transition.UGe2, one of the ferromagnetic compounds studied in this thesis, shows a first or-der quantum phase transition at 1.6 GPa. Theoretical studies [62, 63] suggest thatferromagnetic transitions in clean three-dimensional itinerant ferromagnets are al-ways first order at T = 0 K. However, these compounds show the same behavior(superconductivity and a non-Fermi liquid phase) as expected for materials with asecond order quantum phase transitions. The understanding of the physics of thesefirst order quantum phase transitions is still a challenge for both theoretical andexperimental studies [64].
3.3 Fermi liquid and non-Fermi liquid behavior
In the previous two Sections the terms Fermi liquid and non-Fermi liquid have beenmentioned several times. In this Section these terms will be explained further. First,it is instructive to summarize a few properties of a gas of non-interacting electrons- the Fermi gas.
The specific heat of a system of electrons within a lattice of magnetic ions can bewritten as the sum of three components: c(T ) = cel(T ) + cphonon(T ) + cmag(T ). Thephonon contribution (due to vibrations of the lattice) is often described in terms

3.3 Fermi liquid and non-Fermi liquid behavior 37
of the Debye temperature ΘD and the Debye function [65]. At low temperatures
(T � ΘD) the phonon contribution can be approximated by cphonon = 12π4
5nkB
(T 3
ΘD
),
where n is the number of atoms per mole of formula units. The magnetic contribu-tion (due to the atomic moments) depends strongly on the system under investiga-tion. For a ferromagnet with a gapless magnon dispersion curve [65] one obtains atlow temperatures cmag(T ) ∝ T 3/2, but cmag(T ) ∝ T−1/2e−Δ/kBT if a gap Δ is presentin the dispersion curve [66].
3.3.1 Fermi gas
An electron gas consists of non-interacting, independent electrons. Note that inde-pendent means that there are no interactions with the lattice of magnetic ions andno interactions between the electrons other than the Pauli exclusion principle forFermions. The electrons gas itself has a specific heat of
cel(T ) =π2
3N(EF)k2
B T. (3.12)
This is usually written as cel(T ) = γ T and γ is called the Sommerfeld coefficient.Note that the density of states amounts to N(EF) = (mekF)/(π2
�2), with kF the
Fermi wave vector, is proportional to the electron mass me. Systems for whichthe independent-electron model holds (Fermi gas), typically have values of γ ≈1 mJ/mol K2.
The electrical resistivity is a measure for the scattering probabilities of elec-trons when traveling through a sample. In a model of non-interacting electrons, theFermi gas itself has no resistivity. The electrons only scatter from lattice irregu-larities and magnetic waves. The electrical resistivity can therefore be written asρ(T ) = ρ0 + ρphonon(T ) + ρmag(T ). Interaction of conduction electrons with latticeimperfections (dislocations, stacking faults, vacancies, interstitials) causes a temper-ature independent term ρ0. Thermally excited lattice vibrations yield pronouncedtemperature dependencies. In the Debye model [67] it can be calculated that theresistivity follows ρphonon(T ) ∝ T 5 at low temperatures (T � ΘD). The magneticcontribution again depends on the system. For a magnet above its ordering tem-perature there is a temperature independent contribution due to scattering by themagnetic atomic moments. As the magnetic moments start to show order below theordering temperature, the magnetic contribution decreases for decreasing tempera-tures. For a ferromagnet at low temperatures it can be written as ρ(T ) ∝ T 2.
When a magnetic field is applied to a gas of independent electrons the energyof the electron is raised or lowered depending on its spin. As a consequence, thecorresponding energy bands shift with respect to each other, resulting in a higherpopulation of the up-band than the down-band. The so-called Pauli susceptibilityis essentially temperature independent and can be written as [67]
χP = μ0μ2BN(EF). (3.13)

38 Theory
This susceptibility is usually small compared to the paramagnetic Curie-Weiss be-havior of magnetic ions in the crystal. The Pauli susceptibility can therefore onlybe observed in unordered compounds.
3.3.2 Fermi liquid
Up to now a gas of electrons was considered, i.e. independent electrons with nointeractions with each other or with the lattice (except for Fermi-Dirac statistics).Although this model works for a limited amount of compounds, it is clear thatthis picture does not apply in general. For example, in Sec. 3.1 the Kondo effectwas discussed, which is based on the interaction between a localized moment andthe conduction electrons (hybridization). Taking the Fermi-gas model as a startingpoint, one can imagine gradually turning on the interactions. Then the step is madeto a Fermi liquid, which is a Fermi gas plus interactions.
The arguments leading to a Fermi liquid are very subtle. In the Fermi gas modelthe electrons are independent. Then, quasiparticles are introduced that behaveas independent conduction electrons, with a parabolic energy dispersion. Thesequasiparticles are also called dressed electrons as their properties are modified bythe interaction with the lattice. Analysis of electron-electron and electron-latticeinteractions lead to a substantially modified energy versus wave vector relation forone-electron levels. It is, however, far from clear that there is still any validity intreating the electrons as independent. Nevertheless, Landau has shown [68, 69, 70]that this picture does in fact hold, at least for levels within kBT of the Fermienergy. Since many of the most interesting electronic properties of a metal arealmost completely determined by electrons within kBT of the Fermi energy, the wayis open to a relatively simple description of the electronic states.
However, when interactions are strong, it is not likely that the independentelectron approximation is appropriate. Landau solved this problem by consideringan independent quasiparticle approximation. He showed that by gradually turningon the interactions, the electron states evolve in a continuous way and thereforehave a one-to-one correspondence with the states of the noninteracting system. Anextensive description of the Fermi-liquid theory can be found in Refs. [71, 72].
A consequence of describing heavy-Fermion systems within the framework of theFermi-liquid theory, is the introduction of effective masses m∗ of the quasiparticlesexceeding the free-electron mass by a factor up to several hundred for heavy-fermionsystems, and correspondingly large values of the Sommerfeld coefficient γ and thePauli spin susceptibility χP.
With the correspondence of the quasiparticles of an interacting-electron systemwith a free-electron gas, it can be derived [71, 72] that the low-temperature proper-ties of the Fermi liquid obey the same laws as the Fermi gas, with a renormalizedeffective mass m∗ and a few additional parameters taking into account the residualinteractions among the quasiparticles.

3.3 Fermi liquid and non-Fermi liquid behavior 39
The electronic part of the specific heat is given by
cel(T ) = γT ≡ (m∗/m0)γ0 T (3.14)
where γ0 = 13π2N(EF)k2
B is the Sommerfeld constant of the free-electron gas givenin Eq. 3.12 and m0 the free-electron mass. Therefore, the specific-heat coefficientat low temperatures gives direct information on the effective mass m∗. The Paulisusceptibility of the Fermi liquid is given by
χP =m∗
m0
χ0
1 + F a0
(3.15)
where χ0 is the Pauli susceptibility of the free-electron gas (Eq. 3.13) and F a0 an
antisymmetric Landau parameter [71, 72]. The electrical resistivity ρ(T ) at lowtemperatures is the sum of the residual resistivity ρ0 and an additional quadraticterm that describes the electron-electron interaction:
ρ(T ) = ρ0 + AT 2. (3.16)
The coefficient A is related to γ by the empirical Kadowaki-Woods relation A/γ2 ≈10 μΩ cm K2 mol2 J−2 [73]. As γ ∝ m∗ the coefficient A scales as A ∝ (m∗)2 Itshould be noted that for a ferromagnet below TC the spin waves also give rise to aρ(T ) = afsw T 2 dependence at low temperatures, see Sec. 3.3.1. However, because ofthe coherent Fermi-liquid state, A afsw.
3.3.3 Non-Fermi liquid
The Fermi-liquid theory has been successful in describing the low-temperature be-havior of many compounds. Even many actinide systems with very strong electroniccorrelations are well described in terms of Fermi-liquid theory. In recent years, thecases where the Fermi-liquid scenario does not apply have attracted much attention.
The main macroscopic properties of the systems that have been identified asnon-Fermi liquids are a diverging specific heat divided by temperature, c/T , a di-verging magnetic susceptibility χ and a non-quadratic electric resistivity ρ ∝ T α
with α < 2. At present there is no theoretical model that yields a universal descrip-tion of non-Fermi liquid behavior. Several models have been put forward in order todescribe the microscopic mechanisms that lead to non-Fermi liquid behavior. Themost important models will be discussed below. By comparing the measured tem-perature dependencies of c/T , χ and ρ, it might be possible to determine whichmodel describes the system best.
Multichannel Kondo effect
In this model, M degenerate conduction-electron bands couple with identical ex-change integrals to an impurity with spin SI [74, 75, 76]. When M > 2SI , the

40 Theory
impurity spin is overscreened by the spins of the conduction electrons. As a con-sequence, a non-trivial non-Fermi-liquid critical point governs the low-temperatureproperties of the system. The most likely observable version of this model is the caseof M = 2, SI = 1/2 for rare-earth and actinide systems. This model is primarilyrelevant for diluted heavy-fermion alloys, e.g. Y1−xUxPd3 [77], Th1−xUxRu2Si2 [78],and La1−xCexCu2.2Si2 [79]. The characteristics are summarized as
c(T )
T∝ −a ln T + b
χ(T ) ∝ − ln T (3.17)
ρ(T ) ∝ 1 − c T12
Kondo disorder model
The central idea of the Kondo disorder model is that a moderate disorder in a latticemodel of localized moments is magnified due to the strong local correlations betweenthe moments and the conduction electrons. In particular, a broad distribution of lo-cal energy scales (Kondo temperatures) is generated [80]. A few local sites with verysmall Kondo temperatures are unquenched at low temperatures and dominate thethermodynamic and transport properties, forming a dilute gas of low-lying excita-tions above the disordered metallic ground state. The presence of these unquenchedmoments leads to the formation of a non-Fermi-liquid phase. As in the case of themultichannel Kondo effect, this model is applicable to substitutional system, butonly when the disorder is moderate. The properties of the compound UCu5−xPdx
with x = 1 and 1.5, are reported to be described by this model [81]. The predictionsare
c(T )
T∝ − ln T + a
χ(T ) ∝ − ln T + b (3.18)
ρ(T ) ∝ 1 − c T
Proximity to a quantum critical point
As discussed in Sec. 3.2, a quantum critical point occurs when a critical point, e.g. aferromagnetic phase transition at some temperature Tcr, is tuned to 0 K by an exter-nal parameter r. This can be pressure, magnetic field, or chemical substitution. Atthe quantum critical point, the low-temperature thermodynamics is characterized bycollective modes corresponding to fluctuations of the order parameter, rather thanby single-fermion excitations as in a Fermi liquid. Therefore, non-Fermi-liquid prop-erties arise. The temperature dependencies depend strongly on the dimensionalityd of the system and on the nature of the magnetic interactions. For a ferromagnetz = 3 in Eq. 3.7, for an antiferromagnet z = 2. The dependencies are summarizedin Table 3.1.

3.4 Gruneisen parameters 41
Table 3.1: Predicted scaling behavior of the Millis-Moriya spin-fluctuation model forthe temperature dependence of the linear specific heat coefficient c/T and the electricalresistivity ρ at the QCP at low temperatures [82, 83, 84].
d = 3 d = 2
z = 3 z = 2 z = 3 z = 2
c/T − ln(T/T0) γ0 − β√
T T−1/3 − ln(T/T0)
ρ T 5/3 T 3/2 T 4/3 T
Griffiths phase model
The Griffiths phase model takes into account the effect of disorder near a quantumcritial point [85]. The presence of disorder is considered to lead to the coexistenceof a metallic paramagnetic phase and a granular magnetic phase. In the former,the magnetic moments are quenched by the Kondo interaction, giving rise to Fermi-liquid behavior, while the latter is dominated by the RKKY interaction giving riseto ordered regions.
There is an analogy with a lattice of magnetic atoms diluted with a concentra-tion x of non-magnetic atoms. Long-range order is lost at a certain concentrationxcr when infinite clusters of magnetic moments can no longer be formed.
For small values of x, the RKKY interaction dominates and the system ordersmagnetically. With increasing chemical substitution, the quantum fluctuations growdue to the Kondo effect and the critical temperature, e.g. TC for a ferromagnet,decreases until it vanishes at the critical value xcr. For larger values of x, i.e. in theparamagnetic phase, only finite clusters of magnetic atoms can be found. Amongthese clusters, there are some rare ones that are large and strongly coupled, in whichthe spins behave coherently as a magnetic grain. In this phase, the thermodynamicfunctions show essential singularities with strong effects at low temperatures. Thespecific heat coefficient and the static susceptibility diverge as
c/T ∝ T−1+λ (3.19)
χ ∝ T−1+λ (3.20)
with λ < 1. The Fermi liquid is recovered for λ = 1. In general, non-Fermi-liquidbehavior can be observed over an extended region in the paramagnetic phase nextto a quantum critical point.
3.4 Gruneisen parameters
It is found experimentally that intermetallic compounds with unstable 4f or 5fshells, like the heavy-fermion systems, show an anomalously large volume depen-

42 Theory
dence for variations in temperature, magnetic field, and pressure. The electronicproperties of the heavy-fermion state are described by a certain characteristic tem-perature T ∗. A measure of the volume dependence of this temperature can bedetermined by a phenomenological Gruneisen parameter, that represents the cou-pling between the relevant energy scale for the heavy fermions and the lattice. Theorigin of this coupling lies in the single-ion Kondo or Kondo-lattice effect and thepresence of (paramagnetic) spin fluctuations.
For the volume dependence of the characteristic temperature T ∗ the Gruneisenparameter is defined as [86, 87]
ΓT = −d ln T ∗
d ln V(3.21)
which can be written as
ΓT =V α
κ cV
. (3.22)
Here α = V −1(∂V/∂T ) is the linear volume thermal expansion coefficient, κ =−V −1(∂V/∂P ) the compressibility, and cV the specific heat. Since several processescontribute to the measured α(T ) and cV (T ), one experimentally measures the effec-tive Gruneisen parameter Γeff(T ). If in a certain temperature range a certain energyscale is dominant, Γeff(T ) will be equal to the Gruneisen parameter of this process.For example, at high temperatures the phonon contribution is the largest factor inthe volume dependence and Γeff(T ) ≈ 2 is found. As the temperature is loweredtowards a magnetic transition temperature TC, the magnetic fluctuations will de-termine the value of Γeff(T ). At the lowest temperatures, the physics is dominatedby the heavy-fermion state, characterized by a spin-fluctuation temperature Tsf andtherefore Γeff(T ) = d ln γ/d ln V , since Tsf ∝ N−1(EF) ∝ γ−1.
3.5 Thermodynamic Considerations
For a magnetic sample in an external magnetic field the thermodynamic quantitiescan be derived from the Gibbs free energy
dG = −SdT + V dP − MdB (3.23)
where S is the entropy, T the temperature, V the volume, P the pressure, Mthe magnetization, and B the magnetic field. The equilibrium of the system isdetermined by the variables T , P , and B. The first derivatives of the Gibbs freeenergy, S, V , and M , are found by differentiating G with respect to T , P , and B,respectively, while keeping the other variables constant.
At a phase transition, the Gibbs free energy is continuous, i.e. dG = 0. However,its first or second derivatives do not need to be continuous. When the first derivativesare discontinuous, one speaks of a first-order phase transition. The thermodynamical

3.6 Ferromagnetic Superconductors 43
properties at the phase-transition temperature TC are related by [88]
∂ xi
∂ xj
= −Δ yj
Δ yi
(3.24)
with {x1, x2, x3} = {T, P,B} and {y1, y2, y3} = {−S, V,−M}. Here Δ yi denotesthe step in yi at TC, i.e. the difference between yi(T ↓ TC) and yi(T ↑ TC). Thisequation is known as the Clausius-Clapeyron relation.
In many systems the first derivatives of G are continuous, but the second deriv-atives are not. Hence the name second-order phase transition. Since at TC there areno steps in S, V , and M , the above equation does not apply. By expanding dS interms of T and P one obtains
dS =
(∂S
∂T
)P
d T +
(∂S
∂P
)T
dP. (3.25)
Noting that the entropy just above and below TC are equal (dS+ = dS−), oneobtains, together with the specific heat cP = VmT (∂S/∂T ) and the Maxwell relation(∂S/∂P )T = (∂V/∂T )P , the Ehrenfest relation
dTC
dP=
Δα Vm
Δ(cP /T ). (3.26)
Here α = V −1(∂V/∂T )P is the linear thermal expansion coefficient and Vm is themolar volume.
3.6 Ferromagnetic Superconductors
Since the discovery of superconductivity well within the ferromagnetic phase ofUGe2 [1] and URhGe [2], numerous theoretical studies have tried to answer thequestion what the attractive forces are between the electrons leading to the formationof the Cooper pairs [89, 90, 91, 92, 93, 94, 95, 96, 97, 98, 99]. The general featuresof the proposed models are:
1. The superconducting pairing of the conduction electrons is mediated by spinfluctuations rather than by phonons, as is the case in conventional supercon-ductors.
2. In the superconducting state the quasiparticles form Cooper pairs in whichthe spins are parallel (S = 1) in contrast to conventional superconductorswith opposite spin (S = 0).
3. The ferromagnetism is itinerant and therefore carried by the conduction elec-trons. This arises from a splitting of the spin-up and spin-down band. Aconsequence is that the ferromagnetism and the superconductivity is carriedby the same electrons.

44 Theory
With these assumptions, it was possible to show [93] that for the quasiparticleswith a spin parallel to the ferromagnetic order a gap in the momentum distributionis present, leading to superconductivity, whereas for quasiparticles with antiparal-lel spins this gap is not present, leading to normal, non-superconducting behavior.Moreover, a comparison [94, 95] between the superconducting pairing by ferromag-netic spin fluctuations in the ferromagnetically ordered phase and the pairing inthe paramagnetic phase, indicate that the superconducting transition temperaturesin the ferromagnetically ordered phase are generally significantly higher than thosefound in the paramagnetic phase. This is because the magnetic fluctuations arestronger on the ferromagnetic side of the magnetic phase boundary, which substan-tially enhances the pairing interaction of the conduction electrons. The maximumtransition temperatures are found just below the quantum critical point, in qualita-tive agreement with the temperature-pressure phase diagram of UGe2.
Other studies [100, 101], however, have shown that spin-singlet superconduc-tivity is still feasible under the constraint that conducting electrons involved in thesuperconductivity and localized electrons involved in the ferromagnetic order belongto different subsets of 5f electrons. The pairing mechanism is then based on theinteraction of electron spins via localized magnetic moments. A 73Ge-NQR studyunder pressure [102, 103] clearly showed the existence of unconventional supercon-ductivity with a line node gap, which would normally exclude the possibility ofs-wave (spin-singlet) superconductivity.

CHAPTER 4
UGe2
4.1 Introduction
oexistence of superconductivity and ferromagnetism, atlow temperatures, was found in the binary compound UGe2 [1]. Itcrystallizes in the orthorhombic ZrGa2-type structure (space groupCmmm) [104, 105]. The unit cell, with dimensions a = 4.036 A,b = 14.928 A, and c = 4.116 A, contains four formula units. Thestructure is shown in Fig. 4.1 . The U atoms all occupy the 4j
positions (0, y, 12), whereas the Ge atoms are at the 4i positions (0, y, 0), the 2a
positions (0, 0, 0), and at the 2c positions (12, 0, 1
2). The U atoms are arranged in
zig-zag chains of nearest neighbors in the a direction. The nearest neighbor distancedU−U is equal to dU−U ≈ 3.82 A at zero pressure, but is possibly reduced to about3.5 A at 1.3 GPa, due to a slight flattening of the chains [106]. This would comparewell with the Hill limit of 3.5 A. See Ref. [49] and Sec. 3.1.
In UGe2 ferromagnetic order at ambient pressure is found below the Curie tem-perature TC = 52 K. The magnetic moment is directed along the a axis, with asaturation value of 1.4 μB/U at ambient pressure [107]. Magnetic measurementsindicate a very strong magnetocrystalline anisotropy [108]. TC is suppressed for in-creasing pressures and finally vanishes at a pressure of PC = 1.5− 1.6 GPa. Withinthe ferromagnetic phase, a second transition occurs. At ambient pressure, this tran-sition takes place at TX ≈ 30 K, but is not pronounced. As the pressure is enhanced,TX goes to 0 K, but the transition itself gets better observable. At a pressure ofP ≈ 1.2 GPa, TX = 0. Below TX the magnetic moment is enhanced and thereforethe temperature region between TC and TX was named the weakly polarized phase,whereas the lower temperature region T < TX was called the strongly polarizedphase [109]. The origin of this transition is still not understood. Superconductivityis found only in a limited pressure range between 1.0 and 1.5 GPa with a maximum

46 UGe2
Figure 4.1: The orthorhombic crystallographic structure of UGe2. The uranium atomsare indicated in black and germanium atoms in gray. The figure shows the unit cell ofUGe2 containing four formula units.
transition temperature of Ts ≈ 0.7 K. In this pressure range, the magnetic momentis still appreciable (1 μB/U).
The pressure dependence of the ferromagnetic transition temperature TC, thetransition temperature within the ferromagnetic state TX , and the superconductingtransition temperature Ts, is shown in Fig. 4.2. The data points were obtained frommeasurements with various techniques [1, 110, 111, 112, 113, 114].
In a very small pressure region below PX , the pressure at which TX = 0, thetransition at TX is reported to be first order [102], in contrast to second order atlower pressure. However, Tateiwa et al. [115] found on the basis of specific heatmeasurements that the transition is only weakly first order or even second order.The PM-WP phase transition at TC unambiguously changes from second to firstorder around 1.2 GPa [114, 116].
In this Chapter two techniques are used, namely three-dimensional neutron de-polarization and muon spin relaxation (μSR), to study the ferromagnetic order inUGe2. It is generally accepted that antiferromagnetic order and superconductivitycan coexist, since the superconducting coherence length ξsc is much larger than theperiodicity of the static magnetic order. In contrast to antiferromagnets, for fer-romagnets the reverse is the case. ξsc is much smaller than the periodicity of themagnetic order (i.e. the domain size). However, based on jumps in the magneti-zation at low temperature and at regular intervals of applied magnetic field, it wassuggested that the ferromagnetic domain size in UGe2 is so small, that it is evensmaller than ξsc [117, 118]. This would enable the coexistence of ferromagnetism andsuperconductivity. In this thesis, however, it is shown with the three-dimensionalneutron depolarization technique that the ferromagnetic domain size is much largerthan ξsc, in contrast to Refs. [117, 118].
When superconductivity sets in at low temperatures and high pressures, conduc-tion electrons condense into Cooper pairs. It is of utmost importance to investigatethe magnetic properties of UGe2, and specifically the conduction electrons, in detail.

4.2 Three-Dimensional Neutron Depolarization 47
Figure 4.2: The temperature T versus pressure P magnetic phase diagram of UGe2.Below the Curie temperature TC, there are two ferromagnetic phases, a weakly polarizedphase (WP), and a strongly polarized phase (SP). The transition temperature betweenthese two phases is denoted TX . Above the critical pressure Pc, the system remainsparamagnetic (PM) down to the lowest temperature. Around 1.2 GPa the PM-WP phasetransitions changes from second order (low P ) to first order (high P ). The change inorder for the WP-SP transition is still under discussion (see main text). For clarity thesuperconducting region between 1.0 and 1.6 GPa (shaded area) is exaggerated. The linesare guides to the eye. Figure taken from Ref. [102].
Muons are very sensitive magnetic probes and are sensitive to a time frame which iscomplementary to neutron techniques. The μSR technique thus has the potentialityto yield information on the question whether the magnetism found in UGe2 is of alocalized or an itinerant nature.
4.2 Three-Dimensional Neutron Depolarization*
4.2.1 Introduction
Until the discovery of coexistence of superconductivity and ferromagnetism in UGe2
[1], only superconducting compounds exhibiting anti ferromagnetic order had been
*Parts of this Section have been published in Physical Review B 71 (2005) 174417.

48 UGe2
known such as DyMo6S8, GdMo6S8, and TbMo6S8 [119, 120, 121]. Later on, coexis-tence of antiferromagnetism and superconductivity was also found in heavy fermioncompounds, of which CeIn3, CePd2Si2, and UPd2Al3 [122, 123, 124] form severalexamples. In these cases, superconductivity and antiferromagnetism appear simul-taneously because the Cooper pairs are insensitive to the internal fields arising fromthe antiferromagnetic ordering, since the superconducting coherence length ξsc ismuch larger than the periodicity of the static antiferromagnetic-ordered structure.However, in a ferromagnetic structure it is expected that the internal fields do notcancel out on the scale of ξsc and therefore influence the Cooper pairs. That ferro-magnetic order excludes superconductivity is nicely demonstrated in ErRh4B4 [5, 6]and HoMo6S8 [7], where standard BCS singlet-type superconductivity is suppressedwhen ferromagnetic order sets in. Alternatively, if one would consider unconven-tional spin-triplet superconductivity mediated by ferromagnetic spin fluctuations,the pairing is relatively insensitive to a local magnetic field and can, therefore, coex-ist with ferromagnetic order. When the ferromagnetic domain size d is much smallerthan the superconducting coherence length ξsc, one effectively also has no internalmagnetic field acting on the Cooper pairs.
The superconducting coherence length ξsc for UGe2 is estimated [1, 125] to be130− 200 A. Interestingly, Nishioka et al. [117, 118] predicted the domain size d tobe of the order of 40 A. The model leading to this prediction will be discussed briefly.The starting point was the observation of jumps in the (macroscopic) magnetizationat regular intervals of applied magnetic field H (parallel to the easy axis a) andtemperatures below 1 K, instead of a continuous M −H curve. The discrete natureof the magnetization occurring only at low temperatures, led the authors to the ideaof a quantum-mechanical effect.
The anisotropy and Zeeman energies for a single domain can be written as [126]
E =(K1 + K2 sin2 φ
)sin2 θ − M0H (1 − cos θ) , (4.1)
where K1 and K2 are anisotropy constants per unit volume, θ and φ denote anglesfor the direction of M and M0 indicates the magnitude of M. Equation 4.1 isillustrated in Fig. 4.3 for different values of H. The potential barrier has a heightU . The corresponding Hamiltonian per domain with volume V is [126]
H = −d1J2‖ + d2J
2⊥ + geffμBJ‖H. (4.2)
Here geff is an effective g factor and J‖ (J⊥) is the component of the total angularmomentum of the domain parallel (perpendicular) to the a axis. Although the d2
term plays a crucial role in generating quantum transitions between two energyminima, it can be neglected when calculating the energy eigenvalues because theanisotropy within the plane perpendicular to the a axis is very small. The energylevels are displayed in Fig. 4.3. Furthermore, K1 = d1J (J + 1) /V and J = N j,where N is the number of spins contained in the domain with volume V and j is thesingle ion total angular momentum. K1 can be approximated by K1 ≈ d1J
2/V =d1 (N2j2) / (Nv) = d1Nj2/v where v = 60 A3/U is the volume per U atom.

4.2 Three-Dimensional Neutron Depolarization 49
Figure 4.3: Illustration of the model describing field-tuned resonant tunneling betweenquantum spin states. The horizontal axis is θ, the angle of the magnetization from the easyaxis. (a) At a magnetic field high enough to obtain magnetic saturation, every domainis assumed to be in the ground state of the left-hand minimum at θ = 0 (parallel tothe field). (b) When H = 0, the two energy minima at θ = 0 and π are degenerate.(c) As the magnetic field is increased, in direction opposite to (a), a tunneling of severalmagnetic domains from the metastable state in the left to the first excited state in theright occurs at a well-defined value of magnetic field. (d) After ∼ 5 times, most of thedomains have tunneled from the left to the right and thus there will be no more jump inthe magnetization. Figure taken from Nishioka et al., Ref. [117].
The energy level of the ground state on the left coincides with the nth excitedlevel on the right when the condition H = n (d1/geffμB) is satisfied. When at theseparticular fields a resonance occurs and the tunneling probability is, as a result,strongly enhanced, sharp and large jumps will be observed in the magnetizationat equidistant values of H. With an estimate for the anisotropy constant K1 =100 T × 1.4 μB/60 A3 (a field in excess of 100 T is needed to align the magneticmoments of 1.4 μB [108, 117]), with the U 5f 2 configuration (geff = 4/5 and j = 4),and with steps occurring about every 0.03 T (depending on pressure), it is foundthat N ≈ 1000. This leads to an estimated ferromagnetic domain size d of the orderof 40 A. The derived values of U ≈ 104 K and ΔE ≈ 10 K seem to be consistentwith the starting point of the model: discrete quantum effects only observed atlow temperatures, where ΔE kBT . The authors indicate that for conventionaldomain sizes of the order of 104 A, the tunneling probability would be too small formacroscopic quantum resonances to occur, since the energy barrier U is proportionalto N2: U � d1J
2 = d1j2N2.

50 UGe2
Since d would be several times smaller than ξsc, it was proposed that the ferro-magnetism can be canceled out on the scale of the coherence length of the Cooperpairs. A boundary such as a ferromagnetic domain wall may in general distort theCooper pair wave function. With a small domain size, one has a relatively largenumber of domain walls, resulting in spatially inhomogeneous superconductivity.
In this Section, three-dimensional neutron depolarization (3DND) measurementsare reported. They are performed on single-crystalline UGe2 at ambient pressurebetween 2 and 80 K. The principal aim was to determine the ferromagnetic domainsize d in UGe2 and compare the value to the ferromagnetic domain size of 40 Aestimated by Nishioka et al. [117] as explained above. Since the neutron is avery sensitive probe to local magnetic fields, neutron depolarization is an excellenttechnique to measure the average domain size and the domain-wall width.
4.2.2 Experimental
The measurements were performed on the poly axis neutron depolarization analyzer(PANDA) at the Interfaculty Reactor Institute (IRI) of the Delft University of Tech-nology. A description of the instrument and the 3DND technique can be found inSec. 2.3. The neutron wave length used was 2.03 A which corresponds to a velocityof 1949 m/s.
The neutron depolarization measurements on UGe2 were performed on a single-crystalline sample with dimensions 4.0 × 0.440 × 3.0 mm3 along the a, b, and caxes respectively. The b axis was oriented along the transmitted neutron beam(x) with a transmission length L and the easy axis for magnetization a along thevertical axis (z) within the plate of the sample. The crystal has been grown froma polycrystalline ingot using a Czochralski tri-arc technique. No subsequent heattreatment was given to the crystal. The illuminated area was a rectangle withdimensions y × z = 1 × 2 mm2 centered at the middle of the sample.
The measurements in zero field were performed during a temperature sweep from2 K up to 80 K and down to 2 K with a low sweep rate of 10 K/hr. The measurementsin nonzero field (4 and 8 mT) were done during a similar temperature sweep with asweep rate of 25 K/hr. The sample was first zero-field cooled, whereafter the fieldwas switched on at the start of the measurements. The subsequent measurementswere performed during heating and cooling in a constant field.
4.2.3 Three-dimensional neutron depolarization
The neutron depolarization (ND) technique is based on the loss of polarization of apolarized neutron beam after transmission through a (ferro)magnetic sample. Eachneutron undergoes only a series of consecutive rotations on its passage through the(ferro)magnetic domains in the sample. It is important to note that the beam crosssection covers a huge number of domains, which results in an averaging over themagnetic structure of the whole illuminated sample volume. This averaging causes a

4.2 Three-Dimensional Neutron Depolarization 51
loss of polarization, which is related to the mean domain size and the mean directioncosines of the domains. The rotation of the polarization during transmission probesthe average magnetization.
In a ND experiment, a 3 × 3 depolarization matrix D expresses the relationbetween the polarization vector P0 before and P1 after transmission through thesample according to [29, 30, 31]
P1 = D P0. (4.3)
A monochromator M selects a fixed neutron wave length of 2.03 A which correspondsto a velocity of 1949 m/s. The polarization of the monochromatic neutron beamis created and analyzed by magnetic multilayer polarization mirrors. In order toobtain the complete matrix D, one polarization rotator is placed before the sampleand another one right after the sample. Each rotator provides the possibility toturn the polarization vector parallel or antiparallel to the coordinate axes x, y,and z. The resultant neutron intensity is finally detected by a 3He detector. Thepolarization rotators enable the measurement of any matrix element Dij with theaid of the intensity of the unpolarized beam IS
IS =Iij + I−i,j
2, (4.4)
where Iij is the intensity for P0 along i and P1 along j. The matrix element Dij isthen calculated according to
Dij =1
P0
IS − Iij
IS
, (4.5)
where P0 is the degree of polarization in the absence of a sample. In the presentcase, P0 = 0.965, which is experimentally determined.
Now the correlation matrix αij is introduced as [29, 30, 31]
αij =
⟨∫ L
0
dx′ΔBi(x, y, z)ΔBj(x′, y, z)
⟩, (4.6)
where ΔB(r) = B(r) − 〈B〉 is the variation of the magnetic induction and angularbrackets denote the spatial average over the sample volume. The integral is takenover the neutron transmission length L through the sample. Assuming αij ≡ 0 fori �= j, the correlation function ξ is defined as
ξ =∑
i
αii. (4.7)
With these quantities it can be shown that if there is no macroscopic magnetization(〈B〉 = 0) the depolarization matrix is diagonal and under the assumption thatαij ≡ 0 for i �= j given by [29, 30, 31]
Dii = e−γ2
v2 L{ξ−αii} i = x, y, z, (4.8)

52 UGe2
where γ = 1.83 × 10⁸ s−1T−1 is the gyromagnetic ratio of the neutron and v =1949 m/s the neutron velocity.
The phenomenon that for magnetically isotropic media the depolarization de-pends on the orientation of the polarization vector with respect to the propagationdirection of the neutron beam, is known as intrinsic anisotropy. The origin of thisintrinsic anisotropy is that the line integral of the demagnetization fields aroundmagnetized volumes in the sample along the neutron trajectory is not isotropic dueto ∇·B = 0. In the following it will be assumed that the demagnetization fields arenegligible for needle-shaped magnetic domains.
When the sample shows a net magnetization, the polarization vector will rotate ina plane perpendicular to the magnetization direction. If the sample shape gives riseto macroscopic stray fields, the rotation angle φ is related to the net magnetization〈M〉 by
φ = ηγ
vLμ0〈M〉 = η
γ
vLμ0MS〈m〉, (4.9)
where η is a geometrically factor given in Eq. 4.51 in the Appendix for a rectangular-shaped sample and 〈m〉 = M/MS the reduced sample magnetization in terms ofthe saturation magnetization MS = MS(T ). If the mean magnetic induction 〈B〉in the sample is oriented along the z axis, the depolarization matrix is, for φ (γ/v)2 |αxx − αyy|L/2 (the weak damping limit), given by [29, 30, 31]
Dxx = Dyy = e−γ2
v2 L{ξ−αxx+αyy2 } cos φ,
Dxy = −Dyx = e−γ2
v2 L{ξ−αxx+αyy2 } sin φ,
Dzz = e−γ2
v2 L{ξ−αzz},
Dxz = Dzx = Dzy = Dyz = 0.
(4.10)
With the net magnetization along the z axis, the rotation angle φ of the beampolarization is obtained from the measurements by
φ = arctan
(Dxy − Dyx
Dxx + Dyy
)(4.11)
and ξ is calculated withξ = −v2 ln {det D} /2γ2L. (4.12)
As mentioned earlier, ND provides information about the mean-square directioncosines of the magnetic induction vector in the (ferro)magnetic domains. These aredirectly given by the quantities γi = αii/ξ (i = x, y, z), and can be estimated fromthe measurements by
γi = 1 − 2 ln {Dii} / ln {det D} . (4.13)
This equation is only valid for those directions that show no net rotation of thebeam polarization.

4.2 Three-Dimensional Neutron Depolarization 53
Figure 4.4: The diagonal elements of the measured depolarization matrix D for increasingand decreasing temperature for UGe2. All other elements of the depolarization matrix arezero within the experimental uncertainty. For Dxx and Dyy the experimental uncertaintyis within the symbol size.
4.2.4 Results
Measurements in zero field
In Fig. 4.4 the diagonal elements of the depolarization matrix are shown for UGe2
measured in zero magnetic field. All off-diagonal elements are zero within the ex-perimental uncertainty in the studied temperature range. The measurements forincreasing temperature are qualitatively the same as those for decreasing tempera-ture, as expected.
The Curie temperature of TC = 52 K is clearly indicated in Fig. 4.4 by the kinkin Dxx and Dyy. Note that Dxx ≡ Dyy below TC indicates that there is no intrinsicanisotropy and hence that the magnetic domains produce virtually no stray fields.Furthermore, Dzz ≈ 1 indicates that all moments are oriented along the a axis.
Measurements in small field
In Fig. 4.5 the determinant of the depolarization matrix detD and the rotationangle φ are shown after passage through the sample for measurements in fields of,respectively, 4 and 8 mT (after zero-field cooling). The data of φ have been correctedby subtracting the mean value above TC, since this rotation is merely due to theapplied field.
At low temperatures the magnetic fields (applied after zero-field cooling) aretoo small to fully align the magnetic domains. Therefore, the measurements forincreasing and decreasing temperature do not yield the same results. Whereas for

54 UGe2
Figure 4.5: The determinant of the measured depolarization matrix detD and the rota-tion angle φ of the beam polarization after passage through the sample of UGe2 in 4 and8 mT for increasing and decreasing temperature.
increasing temperature the rotation shows an increase, for decreasing temperaturethe data represent a monotonous magnetization curve, as expected for a field-cooledferromagnet. Close to TC there is no difference between field cooling or field warming.
Figure 4.5 shows that, below TX, the depolarization for 4 mT is at the samelevel as for 0 mT. Above TX, however, extra depolarization occurs. This meansthe system gets more inhomogeneous, i.e., the domains grow and the magneticcorrelation length increases (ξ in Eq. 4.10), leading to extra depolarization. Close toTC the depolarization disappears because the magnetic moment decreases sharply.For decreasing temperature the determinant has the same shape as in the case of0 mT. At 8 mT the determinant is already reduced below TX, indicating largerdomains.
Again, the Curie temperature of TC = 52 K is clearly indicated by the kink indet D and φ. Also note the abrupt increase in φ around TX ≈ 20 K. Evidently thesystem passes, with increasing temperature, from a strongly polarized phase to aweakly polarized phase, as reported earlier [109].
4.2.5 Discussion
Model
The measurements confirm that UGe2 is a highly anisotropic uniaxial ferromagnet.Furthermore, the magnetic domains are long compared to their (average) width,

4.2 Three-Dimensional Neutron Depolarization 55
because Dxx ≡ Dyy indicates relatively weak stray fields produced by the magneticdomains. This allows the assumption B(r) = μ0M(r) inside the domains. In orderto analyze the data a model is considered where the sample is split into N longneedles along the a axis with a fixed width Δ and a magnetic induction BS = μ0MS
along the a axis. With N↑ (N↓) the number of domains with a magnetic inductionpointing upward (downward), the reduced macroscopic magnetization of the sample,pointing along the z direction, can be defined as
〈mz〉 =N↑ − N↓N↑ + N↓
=〈Bz〉BS
. (4.14)
Each needle will have magnetic induction ↑ or ↓ with probability p↑ = (1 + 〈mz〉)/2and p↓ = (1 − 〈mz〉)/2, respectively. The polarized neutron beam traversing thesample will therefore see a binomial distribution of ↑ and ↓, which results in adepolarization matrix D with elements
Dxx = Dyy = e−γ2
v2
B2SL
2Δ(1−〈mz〉2) cos
(γBSL
v〈mz〉
),
Dxy = −Dyx = e−γ2
v2
B2SL
2Δ(1−〈mz〉2) sin
(γBSL
v〈mz〉
),
Dzz = 1, (4.15)
and all other elements equal to 0. (Note that, since the macroscopic stray fieldshave not been taken into account, the angle φ = γBSL〈mz〉/v should be correctedby the factor of η (Eq. 4.9 and Eq. 4.51 in the Appendix) before calculating 〈mz〉 inEq. 4.15.)
Within this binomial distribution model it is easy to show that for the case〈mz〉 = 0 the average ferromagnetic domain size d is equal to 2Δ. Given a domainwall (i.e., two adjacent needles with an opposite magnetic induction), the proba-bility of forming a domain of n needles is
(12
)nand the average is calculated by∑∞
n=1 n(
12
)n= 2. When a field is applied, one has to distinguish between a domain
(with size d↑) in which the magnetic induction is parallel to the field and a domain(with size d↓) with opposite induction. The probability of forming a domain of sizen is pn−1
↑ p↓ = pn−1↑ (1 − p↑), which leads to d↑/Δ = 1/(1 − p↑) = 2/(1 − 〈mz〉).
Similarly, d↓/Δ = 2/(1 + 〈mz〉).In order to estimate the domain-wall thickness δ it is assumed that mz changes
sinusoidally from +1 to −1 over a distance δ in the form of a Bloch wall. Theconsequence is that Dzz is slightly less than 1 in the ordered state. For such adomain wall it is straightforward to show that the domain-wall thickness δ can beestimated by the mean square direction cosine along z
γz = 〈m2z〉 = 1 − 1
2
(δ
Δ
), (4.16)
which can be determined experimentally by Eq. 4.13.

56 UGe2
Figure 4.6: Calculated values of the reduced macroscopic magnetization 〈mz〉 and theaverage ferromagnetic domain sizes with magnetic induction parallel (d↑) or antiparallel(d↓) to the applied magnetic field of 4 and 8 mT in UGe2 for increasing and decreasingtemperature, respectively.
For the values of BS needed in Eq. 4.15, the experimental magnetic moment ofRef. [114] is used, which is converted to magnetic induction, remembering there arefour formula units per unit cell. For the value of η in Eq. 4.9, η = 0.6 is used.
From Fig. 4.4 it is clear that the data for increasing and decreasing temperaturegive slightly different results for the ferromagnetic domain size d in zero magneticfield. The values found for d = 2Δ are 5.1(2) μm when cooling down slowly and4.4(1) μm when heating up after fast cooling. Both values are independent of tem-perature. These values indicate the domain size perpendicular to the a axis (alongthe b axis). Along the a axis it is assumed that the domain size is much larger.
The magnetic domain-wall thickness δ divided by the magnetic domain size d =2Δ is calculated with Eq. 4.16 from the experimental data in Fig. 4.4 and amountsto δ/d = 0.047(23), independent of temperature. This gives δ = 0.22 μm. The sizeof the domain-wall thickness is thus found to be only a minor fraction of the domainsize.
Analysis of the data in a small magnetic field (Fig. 4.5) with Eq. 4.15 givesthe results shown in Fig. 4.6 and Table 4.1. For 4 mT and increasing temperature(after zero field cooling), the reduced magnetization 〈mz〉 remains equal to 0 upto TX ≈ 20 K. As a consequence d↓ is equal to d↑ and of the same order of thezero-field values. Above TX, however, the system gets magnetically soft and 〈mz〉starts to increase linearly toward 0.7. Domain walls are expelled above TX, sinced↑ increases much faster than d↓. (Note the logarithmic vertical scale.) Althoughd↑ gets of the order of 100 μm, d↓ only reaches 25 μm. When the domains grow

4.2 Three-Dimensional Neutron Depolarization 57
Table 4.1: Ferromagnetic domain sizes in UGe2 for increasing temperature after zero-fieldcooling (ZFC) and decreasing temperature in field (FC). The sizes of the domains withmagnetization parallel to the applied magnetic field is denoted by d↑ and the domains withantiparallel magnetization by d↓. Below TX the domain sizes are temperature independent.Above TX the domains grow. The values shown are at a few Kelvin below TC.
μ0H Temperature d↑ (μm) d↓ (μm) d↑ (μm) d↓ (μm)(mT) incr./decr. T < TX T < TX T ≈ TC T ≈ TC
0 ZFC, incr. 4.4(1) 4.4(1) 4.4(1) 4.4(1)0 FC, decr. 5.1(2) 5.1(2) 5.1(2) 5.1(2)4 ZFC, incr. 3.9(1) 3.8(1) 100(20) 25(5)4 FC, decr. 46.4(8) 9.5(2) 55(10) 13(2)8 ZFC, incr. 17.9(2) 11.4(1) 85(20) 13(2)8 FC, decr. 45(5) 8.2(1) 55(10) 15(5)
in width, at a certain moment it is no longer allowed to assume B(r) = μ0M(r)because stray fields produced by the domains have to be taken into account. Themodel, therefore, is no longer appropriate close to TC.
For field cooling in 4 mT, the system has 〈mz〉 = 0.668(1) for the whole temper-ature range below TC. The values of the domain size are shown in table 4.1.
When after zero-field cooling a field of 8 mT is turned on, the sample does get amacroscopic magnetization, in contrast to the case of 4 mT. Up to TX ≈ 20 K thereduced magnetization 〈mz〉 = 0.221(2) is independent of temperature. Then 〈mz〉starts to increase up to 0.718(3) around 30 K and is constant afterwards up to TC.When cooling down in 8 mT, 〈mz〉 = 0.708(1) over the whole temperature rangebelow TC.
For field warming after zero-field cooling, the calculation of the domain sizesyields unexpected temperature dependencies of the domain sizes above TX. As canbe seen in Fig. 4.6, according to the model the domain sizes grow above TX todecrease in size again at higher temperature. Clearly there is another source ofdepolarization, not accounted for by the model. Since the field is strong enough toovercome the pinning energy (at least partly) of the magnetic domains to crystalsdefects, additional depolarization arises from an inhomogeneous magnetic domainstructure.
If the domain width becomes relatively large compared to its length, stray fieldsbecome important and the simple model assuming B(r) = μ0M(r) is no longervalid. Calculation of the mean-square direction cosine γz along the z direction withEq. 4.13, indeed shows a decrease from unity above TX, indicating that the magneticinduction B is not along the a axis throughout the sample. The model can of coursebe improved if no longer a length/width ratio of infinity (no stray fields) is assumedfor the domains. The simple model together with the present measurements, how-ever, do show that the magnetic domain sizes in zero field are a few micrometers and

58 UGe2
that by applying small fields the domains grow. The measurements in this Sectiontherefore indicate that the domain sizes in UGe2 at ambient pressure and down to2 K are certainly larger than the 40 A predicted by Nishioka et al. [117, 118].
In Fig. 4.4 it is shown that Dzz is less than unity below TC. This can be causedby the domain walls, but can also be accounted for by a misalignment. A simplecalculation shows that a misalignment of 8◦ would fully account for the values of Dzz
below TC. The stated value of δ = 0.22 μm [or δ/d = 0.047(23)] should therefore beregarded as an upper limit.
From the above considerations it is concluded that the domain structure of UGe2
behaves like in a conventional ferromagnet. The magnetic domain size largely ex-ceeds the superconducting coherence ξsc length of the Cooper pair. The magneticdomain boundaries can therefore only give secondary effects on the superconductingorder.
Comparison with Theoretical Predictions
Several interesting predictions have been made about the magnetic domain struc-ture within the superconducting phase of superconducting ferromagnets. Accordingto Sonin [127] there is no equilibrium domain structure when the sample is in itsMeissner state (H < Hc1) and in the spontaneous vortex phase (Hc1 < H < Hc2) theperiod of the domain structure would exceed the period found in the case that thesample were non-superconducting under the same experimental conditions. How-ever, calculations by Faure and Buzdin [128] lead to contradicting conclusions. Theydemonstrated that a domain structure is fully compatible with the Meissner state.It was also shown that the domain structure in the superconducting phase is alwaysmore dense than in the normal state, the density depending on the domain size d,the domain wall thickness δ, and the London penetration depth λ(0) at T = 0 K.Moreover, it was shown that the evolution of the domain size with temperature isnon-monotonous for triplet pairing superconductivity, in contrast to the monoto-nous shrinkage of the domain size for singlet pairing superconductivity. Furtherdiscussions can be found in Refs. [129, 130].
For the present study, the main question is whether a shrinking or growing of theferromagnetic domains in the superconducting phase of UGe2 (and URhGe and UIr)can be observed experimentally. The equilibrium domain size is inversely propor-tional to the saturation magnetization BS: d ≈
√l/BS(T ), were l is the length of the
sample along the domains [131]. Despite of the temperature dependence of BS(T ),the data presented in this Section strongly indicate a temperature independent mag-netic domain structure. This observation can be attributed to the pinning of domainwalls to impurities, dislocations, and other crystal imperfections. If this pinning isstrong enough, it could prevent the domains to shrink or grow when the material iscooled. One could, however, try to use a simple trick to reach equilibrium magneticstate in a sample. By applying a damped, slowly oscillating external magnetic fieldalong the easy axis, the equilibrium state could to be approached.

4.3 Muon Spin Rotation and Relaxation 59
The PANDA, the instrument on which the 3DND measurements were performed(see Sec. 2.3) is not designed for measurements at dilution temperatures or at highpressures. However, it would be interesting enough to perform similar measure-ments on URhGe (superconducting at ambient pressure) at a neutron instrumentwhich does have the needed features (polarizer/analyzer and dilution cryostat). Ifsuccessful, the measurements have the possibility to distinguish between singlet andtriplet pairing superconductivity [128].
4.2.6 Conclusions
The ferromagnetic domain sizes of UGe2 were studied by means of three-dimensionalneutron depolarization at ambient pressure. It is concluded that the existence offield-tuned resonant tunneling between spin quantum states [117, 118] is highly un-likely. The requirement of this model is a ferromagnetic domain size of 40 A, whereasthe measurements presented in this Section indicate a size a factor of 1000 larger.The observed jumps in the magnetization should be attributed to a Barkhauseneffect as discussed by Lhotel et al. [132, 133]. The superconductivity, therefore,exists within a single ferromagnetic domain. The domain walls are not expectedto strongly affect the bulk Cooper pair wave function, as suggested by Nishioka etal. [117, 118], since the domain-wall size is less than a few percent of the averagedomain size.
4.3 Muon Spin Rotation and Relaxation
4.3.1 Introduction
When superconductivity sets in at low temperature, conduction electrons condenseinto Cooper pairs. In the reported ferromagnetic superconductors, the electronicpairing mechanism needed for superconductivity is believed to be magnetic in ori-gin. It is therefore important to investigate the magnetic properties of UGe2 andspecifically of its conduction electrons.
Several theoretical studies have been performed to explain the coexistence ofsuperconductivity and ferromagnetism. Most studies use the itinerant nature ofthe ferromagnetism as a starting point. These have indeed shown the possibilityof (spin-triplet) superconductivity in a ferromagnetic material [89, 90, 91, 92]. Inthese studies the electrons forming the Cooper pairs are also responsible for thestrong ferromagnetism, which can be explained by the spin-triplet nature of thesuperconductivity. Other studies [100, 101], however, have shown that spin-singletsuperconductivity is still feasible under the constraint that conducting electronsinvolved in the superconductivity and localized electrons involved in the ferromag-netic order belong to different subsets of 5f electrons. The pairing mechanism isthen based on the interaction of electron spins via localized magnetic moments.

60 UGe2
In order to determine which pairing mechanism is most probable, it is impor-tant to quantify the magnetic properties of the conduction electrons. As muonslocalize in interstitial sites and are very sensitive to magnetic fields whatever theirorigin (localized or itinerant magnetic moments), the muon spin rotation or relax-ation technique (μSR) yields information on the itinerant electrons and associatedmagnetism.
4.3.2 Experimental
Two different samples were used in the μSR study of UGe2. A new single-crystallinesample of UGe2 has been grown from a polycrystalline ingot using a Czochralski tri-arc technique. Afterwards it was annealed at 800 ◦C for one week. For the highpressure measurements a cylinder with a diameter of 5 mm and a length of 18 mmwas cut from the single crystal. The crystal was oriented in such a way, that theinitial muon polarization Sμ(0) was perpendicular to the easy magnetic axis, thea axis. For measurements at ambient pressure a sphere with a diameter of 4.5 mmwas cut from the cylinder. This sphere was used to measure the muon Knight shift.The applied field Bext = 0.6000 T was perpendicular to the initial muon polarizationSμ(0). For the two angular scans the sphere was rotated around the b or c axis at65 K. For the three temperature scans in the range 65 K to room temperature, Bext
was parallel to the a, b, and c, respectively. Further, the sphere was used to measurethe critical dynamics of UGe2 at ambient pressure on the GPS spectrometer in PSI.This first sample will be referred to as “sample A” in the rest of this Chapter.
The second sample is identical to the one used in the previous Section on three-dimensional neutron depolarization and in Ref. [134]. Here the critical dynamicsof UGe2 were studied at ambient pressure on the EMU spectrometer at ISIS. Thecrystal has been grown from a polycrystalline ingot using a Czochralski tri-arc tech-nique. No subsequent heat treatment was given to the crystal. This second samplewill be referred to as “sample B” in the rest of this Chapter.
For the measurements under pressure a pressure cell was used, made of non-magnetic copper-beryllium (Cu-Be 25 1/2HT). In Fig. 4.7 an overview of the pres-sure cell is shown. Since teflon gives a quite large μSR signal [135], the sample couldnot simple be put in a teflon cup. Therefore a different design was made by D. An-dreica [135]. The teflon cup is still used (in combination with a gasket) in order toprevent leakage of the pressure liquid, but it is kept away from the sample space.In this way, the number of materials giving a background signal is reduced to one,namely the Cu-Be pressure cell. The muons stopped in the cell give a backgroundsignal which is well described by the Kubo-Toyabe function
PKT(ΔG, t) =1
3+
2
3
(1 − Δ2
Gt2)exp
(−1
2Δ2
Gt2)
. (4.17)
This function has its origin in static magnetic fields with a Gaussian field distributionwith a width of ΔG/γμ. The static magnetic field comes from the nuclear magnetic

4.3 Muon Spin Rotation and Relaxation 61
Figure 4.7: Overview of the pressure cell used for the muon experiments under pressure.Different parts of the cell are indicated in the figure. For details, see the main text andRef. [135].
moments of 63Cu, 65Cu, and 9Be. Below 40 K, ΔG is temperature independentand equal to 0.345 (2) μs−1. Above 40 K there is a decrease to 0.333 (3) μs−1 at100 K due to muon diffusion, while above 100 K a fit with Eq. 4.17 is no longercorrect. The pressure was applied with the help of a manual hydraulic press. Thepressure transmitting medium was a 1:1 mixture of n-pentane and isoamyl alcohol.For further details on the pressure cell, see Ref. [135].
The pressure is determined by measuring the a.c. susceptibility χac as a functionof temperature of a piece of lead which is at the bottom of the pressure cell. χac showsa sharp drop as soon as the lead gets superconducting. Here the superconductingtransition temperature Ts, which determines the pressure P by the formula Ts =7.2 − 0.364 × P [136] with P in GPa, is defined as the midpoint of this drop. Anexample is shown in Fig. 4.8. Here it is estimated that P = 0.92 GPa. Measurementsof critical dynamics have been performed at this pressure.
The μSR measurements described in this Section have been performed on theGeneral Purpose Surface-Muon (GPS) and General Purpose Decay-Channel (GPD)spectrometers at the Paul Scherrer Institute (PSI) in Villigen, Switzerland. GPSuses surface muons, obtained from pions decaying at rest near the surface of theproduction target. The beam is fully polarized and monochromatic, with a kineticenergy of 4.1 MeV. Due to this small energy, the beam has a stopping range ofaround 160 − 200 mg/cm2. The GPD is a high-energy muon beam line. Muons aregenerated in bunches at a rate given by the frequency of the accelerator (50.64 MHzat PSI). Although the bunch structure is smeared out during the transport of thebeam to the sample, it is still visible in the μSR spectra as an oscillating accidentalbackground. In the analysis of the spectra additional oscillating terms are required,with frequencies equal to the accelerator frequency and higher harmonics. Thepenetration depth of this type of beam is larger than that of the surface beam andshould therefore be used when studying samples within pressure cells.

62 UGe2
Figure 4.8: The pressure inside the pressure cell is determined by measuring the a.c.susceptibility of a piece of lead at the bottom of the pressure cell, just below the sample.See the main text for details. From this measurement P ≈ 0.92 GPa is found.
4.3.3 Results
Ambient pressure: Knight shift measurements on GPS
The muon frequencies νμ induced by an external magnetic field Bext = 0.6000 Twere measured above the Curie temperature (TC ≈ 52 K) as a function of thetemperature T and the sample rotation angle φ on the GPS spectrometer. Themeasured frequencies differ from νBG = (γμ/2π)Bext = 81.32 MHz where γμ =851.62 Mrad s−1T−1 is the gyromagnetic ratio of the muon. The muon Knightshift K
K =νμ − νBG
νBG
(4.18)
follows from Kμ in Eq. 2.27 by assuming that Bext ‖ Bloc, with Bloc the local mag-netic field at the muon site. The principles of muon Knight shift measurements arediscussed in Sec. 2.2.5. The initial muon polarization Sμ(0) is rotated perpendicularto the longitudinal magnetic field Bext (see Fig. 2.2).
Two angular scans have been performed along the b or c axis. For the choiceof the temperature T > TC a compromise had to be made between maximizationof the Knight shift (closer to TC) and minimization of the depolarization rate λX
of the induced muon frequencies νμ (away from TC). A temperature of T = 55 Kturned out to yield spectra with the best quality. A few Fourier transforms of thespectra recorded during the angular scan around the c axis are shown in Fig. 4.9as an example. Three frequencies are observed in the Fourier transforms. Thebackground signal at νBG is indicated by the vertical dashed line. The two othersignals come from muons stopped in the UGe2 sample and show a strong angular

4.3 Muon Spin Rotation and Relaxation 63
Figure 4.9: Examples of Fourier transforms of recorded μSR spectra. The angulardependence of the muon frequencies was measured at 55 K by rotating a sphere of single-crystalline UGe2 around the c axis in a field of Bext = 0.6 T perpendicular to the rotationaxis. In turn, the initial muon spin polarization Sμ(0) was perpendicular to both the mag-netic field and the rotation axis. Three frequencies are observed in the Fourier transforms.The background signal at νBG = 81.39 MHz is indicated by a dashed line. The other twosignals come from muons stopped in the sample and show a strong angular dependence.For φ = 240◦, the signal of the lower component is mixed with the background signal.

64 UGe2
Table 4.2: Fitted values for ν0,i and Δνi in Eq. 4.20.
rotation around rotation aroundb axis c axis
i = 1 i = 2 i = 1 i = 2
ν0,i (MHz) 81.36 (2) 81.51 (4) 81.24 (3) 81.57 (4)
Δνi (MHz) -0.58 (4) 5.77 (6) -0.44 (5) 5.72 (6)
dependence. This points to two muon stopping sites in UGe2, as confirmed by themeasurements of spontaneous muon frequencies below TC in zero magnetic field.
Since three frequencies are observed for all the spectra, the asymmetry a0PexpZ (t)
as a function of time t could be analyzed as a sum of three components:
a0PexpX (t) =
3∑i=1
ai exp(−λX,it) cos (2πνit − φ) . (4.19)
The ratio of the asymmetries ai is equal to the ratio of the number of muons stoppedat site i. λX,i is the depolarization rate of frequency νi and φ accounts for the anglebetween Sμ(0) and the detector. One frequency accounts for the background, dueto muons stopped e.g. in the sample holder, and is close to νBG = γ/2πBext =81.32 MHz. The stray fields of the magnetized sample as well as a different valuefor Bext can slightly shift this background. In the experiments νBG = 81.39 MHzwas found, which corresponds to a field of 0.6005 T at the muon site. The two otherfrequencies are signals coming from muons stopped in the sample.
In Fig. 4.10 the measured muon frequencies are shown as a function of the ro-tation angle φ around the b or c axis. The background signal shows no angulardependence. The two other signals are 180◦ out of phase. The first signal shows arelatively small and negative frequency shift, whereas the second one is large andpositive. As demonstrated by the full curves in Fig. 4.10, the angular dependenceof these two signals can be described very well by the function
νi = ν0,i + Δνi cos2 (φ − φ0) (4.20)
where φ0 depends on the orientation of the spherically shaped sample when insertedinto the cryostat. The values for the parameters ν0,i and Δνi can be found inTable 4.2. It should be mentioned that, for both angular scans, the values for theasymmetry a1 is always somewhat larger than those for a2 (0.12 vs. 0.10).
In addition to the angular scans, temperature scans have been performed withBext parallel to the a, b, and c axes. In the upper figure of Fig. 4.11 the Knightshift K = (νμ − νBG)/νBG, measured with Bext ‖ a, is presented as a function of

4.3 Muon Spin Rotation and Relaxation 65
Figure 4.10: Angular dependence of the muon frequencies at 55 K. A sphere of single-crystalline UGe2 was rotated around the b and c axis (upper and lower picture, respec-tively) in a field of Bext = 0.6 T perpendicular to the rotation axis. In turn, the initialmuon spin polarization Sμ(0) was perpendicular to both the magnetic field and the rota-tion axis. The full lines are fits to Eq. 4.20. The error bars of the frequencies are withinthe symbol size. The background signal at νBG = 81.39 MHz is shown as well and fit to astraight line.

66 UGe2
the bulk susceptibility χa (a Clogston-Jaccarino plot) for reasons explained belowEq. 2.28. Here the temperature T is an implicit parameter. The susceptibility hasbeen measured on the same spherically shaped sample as the Knight shift measure-ments have been performed on, at the same temperatures and in an applied field of0.6 T parallel to the a axis. The data have been corrected for the demagnetizationfield. As in the case of the angular scans, the asymmetry a1 for the negative Knightshift is slightly larger than a2 for the positive Knight shift, which indicates a largermuon population (55 %) for the first muon site than for the second one (45 %).
The full lines represent linear fits to the data. It is seen that for both signals thedata are very well described by this linear relation, as predicted by Eq. 2.28. Thefirst signal is described by Ka
1 = −0.062 (1) χa − 0.00080 (3) and the second one byKa
2 = 0.591 (4) χa + 0.0010 (2).In the lower two figures of Fig. 4.11 the Knight shifts, measured with Bext ‖ b
or Bext ‖ c, are presented as a function of the bulk susceptibilities χb and χc,respectively, for varying temperature. The susceptibility has been measured onthe same spherically shaped sample as the Knight shift measurements have beenperformed on, at the same temperatures and in an applied field of 0.6 T parallel tothe b axis or c axis. The data have been corrected for the demagnetization field.Comparing the asymmetries of the two signals per direction of Bext, it is possible toidentify which curves stem from one muon site and which from the other. As in allprevious cases the asymmetry a1 for the negative Knight shift is slightly larger thana2 for the positive Knight shift, indicating a larger fraction of the muons coming torest at the first muon site than at the second.
Comparing the horizontal (χi) and vertical (Knight shift) scales in Fig. 4.11, itis clearly seen that there is a two orders of magnitude difference between the valuesfor Bext ‖ b and Bext ‖ c on the one hand and Bext ‖ a on the other hand. The smallvalues for Bext ‖ b and Bext ‖ c make it difficult to obtain an accurate determinationof the Knight shift.
The sharp drop of the Knight shift for Bext ‖ b for low values of χb probablyindicates the start of muon diffusion. This happens at temperatures T > 66 K. ForBext ‖ c it is less clear at which temperature the muon starts to diffuse. It is assumedthat for both directions of Bext the muon starts to diffuse through the sample at thesame temperature. Therefore, the data points for T > 66 K should not be taken intoaccount when fitting the data. In Fig. 4.11 the linear fits are shown. For Bext ‖ b it isfound that Kb
1 = 0.074 (21)χb−0.00066 (7) and Kb2 = 0.081 (17)χb+0.00061 (2). For
Bext ‖ c, Kc1 = −0.080 (37)χc − 0.00207 (1) and Kc
2 = −0.040 (25)χc + 0.00174 (4)is obtained. The larger error bars for Kc
i than for Kbi is caused by the difference in
the amount of data points that could be used in the fit.Since the muon is assumed to start diffusing for T > 66 K, it would be expected
to observe a deviation from the linear relation between the Knight shift K and thesusceptibility χ for B ‖ a, as for the cases B ‖ b and B ‖ c. In the upper panelof Fig. 4.11, the three data points per curve with the smallest χa were measured ata temperature T > 66 K. In contrast to B ‖ b, c, no deviation is observed from a

4.3 Muon Spin Rotation and Relaxation 67
Figure 4.11: Clogston-Jaccarino plot of the muon Knight shift for Bext ‖ i (wherei = a,b, c) as a function of the magnetic susceptibility χ. The muon Knight shift Ki isplotted versus the bulk susceptibility χi with the temperature T as an implicit parameter.Both quantities were measured in a magnetic field of Bext = 0.6 T and on the samespherically shaped sample and for each direction of Bext at the same temperatures.

68 UGe2
linear relation. Including or excluding these data points in the fits does no changethe linear equations found above.
High pressure: spontaneous frequencies νμ and depolarization rates λX
The spontaneous frequencies νμ below TC and the associated depolarization rates λX
were measured in zero magnetic field as a function of temperature T at several pres-sures P . The sample was oriented in such a way, that the initial muon polarizationSμ(0) was perpendicular to the a axis. As explained in Sec. 4.3.2 for measurementsthat are performed on the GPD spectrometer, two oscillating background signalswere present in N(t), the number of detected positrons at time t. N(t) can there-fore be written as (see also Eq. 2.5)
N(t) = N0
{e−t/τμ
[1 + a0P
expX (t)
]+ fbg
[1 +
2∑i=1
fi cos(2πνbg,it − φ)]}
+ b (4.21)
where τμ is the muon life time (Table 2.1), νbg,1 = 50.64 MHz, νbg,2 = 101.28 MHz(higher harmonic), and b is a time independent background. Besides the two in-strumental background signals νbg,1 and νbg,1, a Kubo-Toyabe function PKT(ΔG, t)(Eq. 4.17) accounting for the signal from the pressure cell was observed. The UGe2
sample itself gave two spontaneous frequencies ν1 and ν2 with associated depolar-ization rates λX,1 and λX,2, in accordance with the Knight shift measurements.Therefore, a0P
expZ (t) could be written and analyzed as a sum of three components:
a0PexpX (t) =
2∑i=1
ai exp(−λX,it) cos (2πνit − φ) + a3PKT(ΔG, t). (4.22)
The ratio of the asymmetries ai, i = 1 . . . 3, is equal to the ratio of the number ofmuons responsible for signal i. a3 is roughly 3/4 of a0. a1 and a2 are roughly equal,although it should be mentioned that a1 is slightly but significantly larger than a2
(55 % vs. 45 %), for all measured temperatures and pressures. This indicates thatthe first muon site is more populated by muons than the second site. This wasalso the case for the Knight shift measurements. Therefore, different signals can beassociated with either of the two muon sites.
In Fig. 4.12 the two measured muon frequencies νi and associated depolarizationrates λX,i are shown as a function of temperature for several pressures up to 1 GPa.The frequency curves resemble magnetization data under pressure [114]. In thisSection the Curie temperature TC(P ) is defined as the temperature at which thespontaneous frequencies disappear. Below TC, ν1 and ν2 increase monotonously, toreach a saturation level at low temperatures. At higher pressures it is seen thatthere is a kink in the curve. The temperature at which this kink occurs, is namedTX . The values of TC and TX are in good agreement with the values known fromliterature [114]. At low temperatures, the saturation level of ν2 is strongly dependenton pressure, whereas ν1 remarkably shows no significant pressure dependence.

4.3 Muon Spin Rotation and Relaxation 69
Figure 4.12: The two spontaneous frequencies ν1 and ν2 and associated depolarizationrates λX,1 and λX,2 as a function of temperature and different pressures in UGe2. Theasymmetry for the first signal (a1) is slightly larger than for the second (a2), for alltemperatures and pressures. The frequency ν2 shows a much larger pressure dependencethan ν1. At higher pressures a peak in λX occurs below TC.

70 UGe2
The depolarization rates λX,1 and λX,2 show for all pressures a large increase asTC is approached. Note the logarithmic vertical scales. The curves for 0 GPa lookrather conventional: λX,i decreases with decreasing temperature. However, as thepressure is increased, a peak starts to develop at the temperature TX at which akink in the frequency curve occurs. This development of a peak is particularly clearin λX,2, but less clear in λX,1. For 1.0 GPa, however, the peak is evident for bothdepolarization rates. It should also be noticed that the curves of λX,1 and λX,2 shiftto higher values as pressure increases. In Sec. 4.3.5 the origin of the peak will bediscussed further.
Ambient and high pressure: critical fluctuations
In this Section the data obtained in the critical regime, close to TC, are discussed. Re-member two samples were used in the study of the critical dynamics (see Sec. 4.3.2).Data at ambient pressure, recorded at the EMU spectrometer of the ISIS facilityon sample B, were already published elsewhere by Yaouanc et al. [134]. The datameasured in the pressure cell at ambient pressure on the GPD spectrometer at PSIon sample A and presented in this thesis, yielded qualitatively very similar results,although there were some quantitative differences. Therefore, sample A was remea-sured on GPS at ambient pressure. This was done to check whether the quantitativedifference stems from the fact that measurements were performed on different instru-ments (EMU ↔ GPD) with different, probably not perfectly described backgrounds,or from the fact that sample B used in Ref. [134] was not the same as sample A,the sample newly grown for the μSR measurements described in this thesis. It isimportant to understand what the origin is for this quantitative difference, in orderto reliably compare the ambient and high pressure data obtained in the pressure cellat GPD. For completeness all results, including those published in Ref. [134], willbe discussed here.
Measurements on EMU
The EMU data [134] at ambient pressure are discussed first. All the recorded spectraof the asymmetry a0P
expZ (t) as a function of time t could be analyzed as a sum of
two components:a0P
expZ (t) = asPZ(t) + abg. (4.23)
PZ(t) and P expZ (t) are functions normalized to unity for t = 0. The first component
describes the μSR signal from the sample and the second accounts for the muonscontributing to the background, that were stopped in e.g. the sample holder. Atthe time of the measurements, the fly-past mode was not yet available, leading torelatively high backgrounds. This second component is time independent. In zerofield and for the two orientations of Sμ(0) relative to the easy magnetic axis a, PZ(t)is well described by an exponential function PZ(t) = exp(−λZt), where λZ measures

4.3 Muon Spin Rotation and Relaxation 71
Figure 4.13: Examples of μSR spectra recorded in zero field and in longitudinal magneticfields at T = 52.59 (2) K (above TC = 52.49 (2) K) for Sμ(0) ⊥ a. The solid lines are fitsto Eq. 4.23. Note the field dependence of PZ(t) for small fields. The figure is taken fromRef. [134].
the spin-lattice relaxation rate at the muon site. In non-zero field, PZ(t) can be bestdescribed by PZ(t) = PZ(ΔLor, νf , t). Here it is assumed that the distribution of Bloc
is squared Lorentzian [137]. ΔLor characterizes the width of the field distributionand νf denotes the fluctuation rate of the magnetic field. Examples of the spectrain zero and non-zero field are presented in Fig. 4.13.
The temperature dependence of λZ(T ) in zero field is shown in Fig. 4.14. For bothgeometries, λZ(T ) shows a maximum at TC, which is due to the critical slowing downof the spin dynamics. The Curie temperature TC was defined as the temperatureat which the spontaneous frequencies disappear. This gave TC = 52.49 (2) K. Theanisotropy between the μSR signal for the two orientations is very weak, unlike thestrong anisotropy of the bulk magnetization in UGe2. The solid and dashed lines inthe inserts are fits to the dipolar Heisenberg model in Eq. 4.32 to be discussed inSec. 4.3.4. Note that for magnetic fields as small as 2 mT the depolarization almostcompletely vanishes (see Fig 4.13). For large magnetic moments of 1.4 μB in thecase of UGe2, this is totally unexpected. For such large moments it is expected thatthe fluctuation energy is much larger than the magnetic energy corresponding to anapplied field of 2 mT.
Measurements on GPD
The measurements of the critical paramagnetic spin dynamics at high pressure wereperformed on the GPD spectrometer at P = 0.95 (2) GPa. The pressure was chosen

72 UGe2
Figure 4.14: The spin lattice relaxation rate λZ versus temperature T for Sμ(0) ⊥ a andSμ(0) ‖ a at ambient pressure in zero magnetic field. The measurements were performed onthe EMU spectrometer at the ISIS facility. A very sharp strong increase in λZ is observedat TC = 52.49 (2) K. The inserts display λZ versus reduced temperature τ = (T −TC)/TC.The solid and dashed lines are the results of fits to the model discussed in Sec. 4.3.4.Figure taken from Ref. [134].
to be below 1.2 GPa because the paramagnetic to ferromagnetic phase transitionin UGe2 changes around this pressure from second to first order [116]. Since thetheory used in Sec. 4.3.4 to analyze the critical data is only valid for second orderphase transitions, it was required to be certain to stay below the transition pointwhere the order changes. Unfortunately, only the Sμ(0) ⊥ a orientation could bemeasured in the pressure cell. This prevented a determination of the anisotropy inλZ(T ) at high pressures.
In Fig. 4.15 experimental data are shown at 0.95 (2) GPa for different tempera-tures. All the recorded spectra of the asymmetry a0P
expZ (t) as a function of time t,

4.3 Muon Spin Rotation and Relaxation 73
Figure 4.15: Examples of μSR spectra for Sμ(0) ⊥ a at 0.95 (2) GPa in zero fieldfor T = 39.03 (1) K and T = 36.511 (6) K. With TC = 36.48 (1) K these temperaturescorrespond to reduced temperatures of τ = (T − TC) /TC = 0.0700 (4) (open symbols)and 0.0007 (3) (solid symbols), respectively. The solid lines are fits to Eq. 4.24. Thedashed line shows the background arising from the pressure cell.
recorded under a pressure of 0.95 (2) GPa above TC, could be analyzed as a sum oftwo components:
a0PexpZ (t) = a1 exp (−λZt) + a2PKT(ΔG, t). (4.24)
Here PKT(ΔG, t) is the Kubo-Toyabe function given by Eq. 4.17 and accounts forthe background arising from the pressure cell. The second term stems from theUGe2 sample, where λZ measures the spin-lattice relaxation rate at the muon site.For the fit λZ was free and the other parameters fixed to a1 = -0.073, a2 = -0.183,ΔG = 0.345 μs−1 for the first detector (not shown) and a1 = 0.070, a2 = 0.189, ΔG
= 0.345 μs−1 for the second detector (shown). The ratio of a1 and a2 is equal tothe ratio of the number of muons stopped in the sample and in the pressure cell.The upper solid line in Fig. 4.15 is a fit the data measured at a temperature farabove TC with τ = (T − TC) /TC = 0.0700 (4) and the lower solid line is a fit to datarecorded close to TC with τ = 0.0007 (3). The dashed line shows the temperatureindependent background a2PKT(ΔG, t).
In Fig. 4.16 the temperature dependence of λZ(T ) is displayed. λZ(T ) is mea-sured at ambient pressure (in the pressure cell) and at 0.95 (2) GPa, both in zerofield. For both pressures, λZ(T ) exhibits a maximum at TC. This is due to the criti-cal slowing down of the spin dynamics. As before, TC was defined as the temperatureat which the spontaneous frequencies, which appear below TC, disappear. At am-bient pressure TC = 52.16 (1) K is obtained and TC = 36.48 (1) K at 0.95 (2) GPa.The solid lines in the lower plot of Fig. 4.16 are again fits to the dipolar Heisenberg

74 UGe2
Figure 4.16: (Upper frame) The spin lattice relaxation rate λZ versus temperature forambient pressure and a pressure of 0.95 (2) GPa in zero magnetic field and small fields.In zero field there is a strong increase in relaxation rate just above TC = 52.16 (1) Kat ambient pressure and just above TC = 36.48 (1) K at 0.95 (2) GPa. It is also shownthat for a field as small as 5 mT the relaxation rate drops remarkably for both pressures.(Lower frame) The spin lattice relaxation rate λZ as a function of the reduced temperatureτ = (T − TC) /TC for ambient pressure and a pressure of 0.95 (2) GPa in zero magneticfield. The solid lines are fits to the model discussed in Sec. 4.3.4.
4.3 Muon Spin Rotation and Relaxation 75
model in Eq. 4.32 (see Sec. 4.3.4). The observed plateau for 0.95 (2) GPa is broaderthan for 0 GPa.
The GPD spectra in small magnetic fields could be satisfactorily described bythe same model as for zero field (Eq. 4.24), i.e the sum of a Kubo-Toyabe functionaccounting for the muons stopped in the pressure cell and an exponential functionaccounting for the muons stopped in the UGe2 sample. The qualitative result isthat the relaxation rate is already quenched for very small magnetic fields. This isshown for both pressures in the upper plot of Fig. 4.16. A mere 5 mT is enough tosuppress the relaxation rate.
Note the similarity between the insets of Fig. 4.14 and the lower plot of Fig. 4.16.Both figures show clearly a saturation of λZ close to TC.
Measurements on GPS
The cylindrical sample A (used for the high pressure measurements of the spon-taneous frequencies on GPD) was reshaped into a sphere of 4.5 mm diameter forthe Knight shift measurements as well as for the measurements on GPS of the crit-ical dynamics. For both sample A and B, the recorded spectra of the asymmetrya0P
expZ (t) as a function of time t could be analyzed as a sum of two components, as
indicated in Eq. 4.23. The signal from the UGe2 sample could be described by anexponential function.
The temperature dependence of λZ(T ) in zero field, in the case of Sμ(0) ‖ a,is shown in Fig. 4.17 for both sample A and B. For both samples λZ(T ) shows amaximum at TC, which is due to the critical slowing down of the spin dynamics. TheCurie temperature TC was defined as the temperature at which λZ(T ) is maximum.This gave TC = 52.20 (1) for sample A and TC = 52.27 (1) for sample B. It is clearlyseen that sample A shows a sharper transition than sample B. This may indicatea higher sample quality, although it is surprising that TC is slightly lower, whichsuggests the opposite.
The lower figure in Fig. 4.17 shows a plot of λZ(T ) versus the reduced temper-ature τ = (T − TC)/TC. The solid lines are fits to the dipolar Heisenberg modelof Eq. 4.32 (see Sec. 4.3.4). The transition for sample B is indeed broader thanfor sample A, as noted earlier. Since both samples are measured on the same in-strument, the difference cannot originate from a wrongly modeled background orfrom a difference in thermometry. Although the critical dynamics is qualitativelyreproducible, quantitatively there is a sample dependence.
The temperature dependence of λZ(T ) in zero field is shown in Fig. 4.18 forSμ(0) ⊥ a. Sample A was measured at GPD and at GPS. In the upper plot ofthe figure it is seen that these results do not coincide perfectly. Since it is the samesample, this effect should be considered instrument related. At GPD the backgroundwas large (about 50 % of the total asymmetry) because of the pressure cell. At GPSthe background is much lower.

76 UGe2
Figure 4.17: (Upper frame) The spin lattice relaxation rate λZ as a function of tem-perature for sample A and sample B in zero magnetic field. There is a strong increasein relaxation rate when TC is approached. Sample A shows a sharper transition thansample B. (Lower frame) The spin lattice relaxation rate λZ versus reduced temperatureτ = (T − TC) /TC for sample A and sample B, in zero magnetic field. The solid lines arefits to the model discussed in Sec. 4.3.4.

4.3 Muon Spin Rotation and Relaxation 77
Figure 4.18: (Upper frame) The spin lattice relaxation rate λZ versus temperature forsample A, measured on GPD and GPS, and sample B, measured on EMU, in zero magneticfield. There is a strong increase in relaxation rate when TC is approached. Sample Ashows a sharper transition than sample B. Measuring sample A on GPD or GPS yieldsslightly different results. (Lower frame) The spin lattice relaxation rate λZ versus reducedtemperature τ = (T − TC) /TC for samples A and B, in zero magnetic field. The solidlines are the results of fits to the model discussed in Sec. 4.3.4.

78 UGe2
In the lower plot of Fig. 4.18 λZ(T ) is shown as a function of the reduced temper-ature τ . Here it is seen that the transition for sample B is indeed broader than forsample A. The solid lines are again fits to the dipolar Heisenberg model in Eq. 4.32.
In summary, it has been shown for both directions of Sμ(0) that at ambientpressure there is a large qualitative similarity between the temperature dependenciesof λZ(T ) for sample A used in this thesis and sample B used in Ref. [134]. Measuringthe same sample A at different instruments yields slightly different results. In thenext Section the influence of the sample and instrument dependencies on the dataanalysis will be investigated. In spite of the sample and instrument dependenciesof the results on the critical dynamics in UGe2, the comparison between ambientpressure and a pressure of 0.95 (2) GPa should be considered reliable, since here itconcerns a single experiment on the same sample at the same instrument for differentpressures.
4.3.4 Analysis
Ambient pressure: Knight shift
According to Eq. 2.28 the relation between the muon Knight shift K i and the atomicsusceptibility χi, with i = {a,b, c}, is given by
Ki =
[Cii (q = 0) −N ii +
(rμH
4π
)]χi + APχP. (4.25)
Here C(q = 0) is the tensor that couples the U magnetic moments m to the magneticfield B′
dip + BL (Eq. 2.24) at the muon site. N ii is the demagnetization factor whichdepends on the shape of the sample and the orientation of the external field Bext
with respect to the sample. Because a spherically shaped sample of UGe2 was usedduring the experiments, N ii = 1/3 for all measurements. The experimental valuesfound in Sec. 4.3.3 for dKi/dχi for both muon sites are summarized in Table 4.3.The last term in Eq. 4.25, the Pauli contribution, plays no role in the analysis. Thefirst signal has a slightly larger asymmetry than the second one.
The coupling tensor C(q = 0) has the special property that it has a trace equalto unity. Assuming the contact term rμH/(4π) to be isotropic the following relationholds: ∑
i
dKi
dχi
= 3rμH
4π. (4.26)
With this equation, the contact coupling term (rμH/4π) is calculated and the di-agonal elements of the coupling tensor C(q = 0) can be determined. They arepresented in Table 4.3 for both signals. (rμH/4π) is negative for the first signal, butpositive for the second. A positive contact term is unusual. In e.g DyNi5 [138] andin Fe and Ni [27] it is negative. The values of C(q = 0) should be compared to thecalculated ones in order to be able to determine the muon sites.

4.3 Muon Spin Rotation and Relaxation 79
Table 4.3: Experimental coupling parameters for the two muon sites in UGe2. Thecontact term rμH/(4π) is assumed to be isotropic.
i a b c
dKi/dχi -0.062 (1) 0.074 (21) -0.080 (37)
signal 1 rμH
4π-0.023 (14) -0.023 (14) -0.023 (14)
Cii 0.294 (14) 0.430 (25) 0.276 (40)
dKi/dχi 0.591 (4) 0.081 (17) -0.040 (25)
signal 2 rμH
4π0.211 (10) 0.211 (10) 0.211 (10)
Cii 0.713 (11) 0.203 (20) 0.082 (27)
In UGe2 several interstitial positions with a high symmetry are available. Theseare the best candidates for muon stopping sites. Table 4.4 contains the couplingtensors C (q = 0) for several candidate muon sites, calculated with Eq. 2.22. Thedipolar interaction is very anisotropic and therefore the coupling tensor has a verystrong muon-site dependence. It is clearly seen, that the experimental couplingtensor for the first signal show good agreement with the calculated tensor for thesite 2b.
Even better agreement could possibly be accomplished by assuming a slightlynon-isotropic contact term. This possibility has been addressed in Ref. [139] forseveral compounds, as well as the temperature dependence of (rμH/4π). The tem-perature dependence of the contact term in UGe2 below TC will be discussed shortly.Other possibilities will not be discussed any further in this thesis.
Unfortunately, the second signal is not in agreement with any of the high-symmetric interstitial positions. In order to find the second muon site, a systematicscan through the UGe2 unit cell is required. The corresponding coupling tensorshould be diagonal as well, which can be seen from the angular scans. The fullangular dependence of Ki for the rotation of the external field Bext in the a − cplane can be written, with N ii = 1/3, as [140]
Ki(φ) =
{(Caa − 1
3+
rμH
4π
)χa −
(Ccc − 1
3+
rμH
4π
)χc
}cos2 φ
+
(Ccc − 1
3+
rμH
4π
)χc +
1
2(χa + χc) Cac sin 2φ (4.27)
where φ is the angle between Bext and the a-axis. For the rotation of Bext in the

80 UGe2
Table 4.4: Calculated dipolar coupling tensors C (q = 0) at several candidate stoppingsites for the muon in UGe2. The basis for the tensor is equal to the basis of the crystallo-graphic unit cell.
Site Coupling tensorC (q = 0)
2b (0,12,0)
⎛⎝0.251 0 0
0 0.453 00 0 0.296
⎞⎠
2d (12,0,1
2)
⎛⎝−0.635 0 0
0 2.308 00 0 −0.672
⎞⎠
4e (14,14,0) (3
4,14,0)
⎛⎝ 0.020 ±0.320 0±0.320 0.194 0
0 0 0.785
⎞⎠
4f (14,14,12) (3
4,14,12)
⎛⎝ 0.285 ±1.570 0±1.570 1.758 0
0 0 −1.043
⎞⎠
4i (0,0.1539,0)
⎛⎝−0.677 0 0
0 −0.712 00 0 2.390
⎞⎠
4j (12,0.1922,1
2)
⎛⎝1.615 0 0
0 0.197 00 0 −0.813
⎞⎠
a − b plane it is written as
Ki(φ) =
{(Caa − 1
3+
rμH
4π
)χa −
(Cbb − 1
3+
rμH
4π
)χb
}cos2 φ
+
(Cbb − 1
3+
rμH
4π
)χb +
1
2(χa + χb) Cab sin 2φ (4.28)
The maximum frequency shift was observed when Bext was parallel to the a-axis (seealso Fig. 4.10). Comparison with the above equations leads to the conclusion thatCab and Cac should be zero, or at least quite small. This is supported by the factthat the spontaneous frequencies below TC show a full asymmetry for Sμ(0) ⊥ a,whereas no oscillations are observed for Sμ(0) ‖ a.
Spontaneous frequencies νμ
The experimentally observed values for rμH/4π and C(q = 0) can be used to calcu-late the expected spontaneous frequencies at low temperatures. For a ferromagnetin zero external field, the magnetic field at the muon site (Eq. 2.21) is generally

4.3 Muon Spin Rotation and Relaxation 81
Figure 4.19: Normalized muon frequencies (see Fig. 4.12) averaged over the two ob-served muon sites (filled symbols) and normalized magnetization (open symbols, takenfrom Ref. [114]) versus temperature. The data have been normalized to the lowest tem-perature measured. The figure illustrates the empirical relation in Eq. 4.31. The linessimple link the symbols.
calculated by
Bαloc =
μ0
v
∑β
[Cαβ(q = 0) +
(rμH
4π
)δαβ
]mβ (4.29)
where δαβ is the Kronecker delta and m the moment on the magnetic ions. Sincefor UGe2 the U magnetic moments [107] as well as the local field at the two muonsites (see above) are along the a axis this equation reduces to
Baloc =
μ0
v
[Caa(q = 0) +
(rμH
4π
)]ma. (4.30)
Inserting the values for dKa/dχa = Caa − 13
+ (rμH/4π) from Table 4.3 and thusassuming that the contact term rμH/4π remains constant below TC, yields ν1 =9.68 (4) MHz and ν2 = 32.97 (14) MHz for m = 1.4 μB/U. A comparison with themeasured values, ν1 = 8.526 (5) MHz and ν2 = 49.036 (10) MHz (see Fig. 4.12),shows that there is some discrepancy. This problem can be solved by assuming atemperature dependent contact term. The other term, Caa(q = 0) is independent oftemperature. It turns out that both signals need, in absolute value, a larger contactterm at lower temperatures than at higher temperatures.
In Fig. 4.19 a remarkable scaling of the muon frequencies presented in Fig. 4.12 isshown. The frequencies have been normalized with respect to the lowest temperaturemeasured and compared to the normalized magnetization [114]. For this scaling the

82 UGe2
empirical relation
M(T )
M(0)=
1
a1 + a2
(a1 ·
ν1(T )
ν1(T = 0)+ a2 ·
ν2(T )
ν2(T = 0)
)(4.31)
holds for pressures up to 1.0 GPa. Here a1 and a2 are the asymmetries of therespective frequencies. The population distribution between the two muon sites isabout 55 %-45 %.
According to Eq. 4.30, together with νμ = (γμ/2π)Baloc, the normalized muon
frequencies νi should coincide with the normalized magnetization if and only ifthe contact term rμH/(4π) is temperature independent (assuming Caa(q = 0) istemperature independent). The experiments show they do not coincide. This canbe seen from the fact that the frequencies ν1 and ν2 (Fig. 4.12) are not proportional toeach other. However, Fig. 4.19 and Eq. 4.31 show that the average of the normalizedfrequencies does coincide with the normalized magnetization. Inserting Eq. 4.30into Eq. 4.31, it is clear that the contact terms for both muon sites are intimately
related. To quantify this relation, it can be assumed that, for T < TC,(
rμH
4π
)is
described by the sum of a constant term and a temperature dependent term Δi(T ),
i.e.(
rμH
4π
)i(T ) = const. + Δi(T ). Here the value of const. is taken from Table 4.3
for T > TC and therefore, as an approximation, Δi(T ) ≈ 0 for T > TC. No furtherassumptions are made about the exact temperature dependence of Δi(T ). UsingEq. 4.30 and Table 4.3 for the values of Caa(q = 0), it follows from Eq. 4.31 andνμ = (γμ/2π)Ba
loc that Δ2(T )/Δ1(T ) = −5.8, which is independent of temperature.
This is consistent with(
rμH
4π
)2/(
rμH
4π
)1
= −9.2 (5.9) (see Table 4.3).
From Eq. 4.30 it is clear why the first signal in Fig. 4.12 shows a much smallerpressure dependence than the second signal at low temperatures. From magnetiza-tion data [114] it is known that the saturation magnetic moment hardly changes withpressure up to 1.2 GPa. Therefore, any pressure dependence of the muon frequencies
at low temperatures should come from 1v
(Caa(q = 0) +
(rμH
4π
)). Remember that
Caa(q = 0) has two contributions, see Eq. 2.24. The first contribution is the Lorentzfield BL which originates from the uranium magnetic moments outside the Lorentzsphere. These magnetic moments are treated as a continuous magnetization withthe Lorentz sphere as a non-magnetic cavity. The second contribution is the dipo-lar field B′
dip which is a sum of dipolar fields from the uranium magnetic momentswithin the Lorentz sphere. The volume v can be assumed constant in pressure.With an estimated value for the compressibility κ = 0.01 GPa−1, the volume change
is about 1% up to 1 GPa. For the first signal, Caa(q = 0) +(
rμH
4π
)= 0.271 (1) is
close to 13
(the contribution of the Lorentz field) for the first signal. However, for the
second signal, Caa(q = 0) +(
rμH
4π
)= 0.924 (4) is much larger than 1
3. This means
that the contribution B′dip to Caa(q = 0) and the contact term
(rμH
4π
)is small for
the first signal and large for the second. This implies that any pressure dependence

4.3 Muon Spin Rotation and Relaxation 83
in B′dip or in
(rμH
4π
)will have a much larger influence on the muon frequency ν2 than
on ν1. It should be noted that the pressure dependence of B′dip is probably caused
by a relative displacement of the atoms under pressure [110].
Critical fluctuations at ambient pressure and at 0.95 (2) GPa
The theory of critical phenomena used to explain the data presented in Figs. 4.14,4.16, 4.17, and 4.18 has been developed by Yaouanc et al. [27] and applies to μSRmeasurements of the spin-lattice relaxation rate λZ(T ) in the vicinity of TC. In thenext two paragraphs a few features of this theory will be discussed.
The theory concerns continuous phase transitions, i.e. second order transitions.As the critical temperature is approached, the fluctuations tend to slow down. Thisslowing down process is expected to manifest itself in λZ(T ), which probes the dy-namics, by a maximum at the ordering temperature. Although dipolar interactionsbetween magnetic ions are usually very weak relative to the Heisenberg interaction,they gain importance near TC. This can easily be seen when one considers thatdipolar interactions are long-range in nature. In the critical regime only long wave-length interactions (small q) are of importance. The Hamiltonian of the system isa sum of the Heisenberg and dipole interactions. The temperature dependence ofλZ(T ) in the critical regime has been derived by static and dynamic scaling lawsfrom the mode coupling theory [27, 141, 142]. The model predicts
λZ = W[aLIL(φ) + aT IT (φ)
]. (4.32)
Here L and T refer to the orientation (longitudinal or transversal) of the fluctua-tion mode relative to its wave vector q. W is a non-universal constant. IL,T arescaling functions (shown in Fig. 4.20), which in turn depend on the wave vectordependent susceptibilities χL,T (q) and fluctuation rates ΓL,T (q). They account forthe longitudinal and transversal fluctuations. The temperature dependence followsthrough φ = tan−1 (qDξ). Here ξ = ξ0 (|T − TC| /TC)−ν is the correlation length andqD the dipolar wave vector, which determines the relative strength of the dipolarand exchange interactions. For three-dimensional Heisenberg interactions the crit-ical exponent amounts to ν � 0.69. The weighting factors aL and aT depend onlyon the characteristics of the dipole and hyperfine fields at the muon site and in factdetermine the sensitivity to longitudinal or transversal fluctuation modes. It shouldbe stressed that when the measurements show a saturation in λZ(T ), mostly longi-tudinal fluctuations play a dominant role in λZ [142]. In that case mainly modeswith q ≈ qD are probed.
It is now shown how the dipolar wave vector qD, the magnetic moment μ, andthe magnetic correlation length ξ0 = ξ(T = 2TC) can be determined from theexperiment. For a given muon site, the experimental value of W is known. Thetheoretical value of W is obtained from mode coupling theory [27]:
W =4π
3Pγ2
μ�
√μ0kBTC
q3/2D
2μ(4.33)

84 UGe2
Figure 4.20: The two functions IL,T (φ) versus 1/ tan(φ) = 1/(qDξ). The functions IL(φ)and IT (φ) account for the contributions of the fluctuations, longitudinal and transverseto the wave vector q, respectively, to the muon spin-lattice relaxation. qD is the dipolarwave vector and ξ the correlation length. Only ξ depends on temperature. Figure takenfrom Ref. [143].
where P = 5.1326, kB the Boltzmann constant, and μ is the magnetic moment.From the same theory the fluctuation rate is predicted to be �Γ(q) = Ωq5/2 whereΩ is given in Ref. [27]. In the case mainly longitudinal fluctuations are probed inthe experiment, the observed dynamics is largely driven by fluctuations around qD
[142]. Then the fluctuation rate νf can be written as:
νf � Γ(qD) =P
2π2�
√μ0kBTC (2μ) q
3/2D . (4.34)
Now qD and μ are calculated by
qD =
(3π
2γ2μμ0kBTC
· Wνf
)1/3
and μ =
(8π3
�2γ2
μ
12P 2· νf
W
)1/2
(4.35)
From the calculated value of qD and the measured value of qDξ0, which determinesthe width of the plateau for the longitudinal fluctuations, ξ0 is determined. For thevalue of ξ0 in the case of T > TC, the symbol ξ+
0 will be used, and ξ−0 for T < TC.The data of the relaxation rate λZ as a function of reduced temperature τ in
Figs. 4.14, 4.16, 4.17, and 4.18 have been fitted to Eq. 4.32. These fits are shownin the figures as well. The extracted experimental parameters, the products qDξ+
0 ,qDξ−0 , WaL, and WaT , are summarized in Table 4.5. The reason for measuringboth samples A and B also on GPS, was to explain the difference in fitting values

4.3 Muon Spin Rotation and Relaxation 85
at ambient pressure for Sμ(0) ⊥ a (qDξ+0 = 0.021 (2) versus qDξ+
0 = 0.0052 (7)).Several conclusions can be drawn from Table 4.5. First of all there is a dependenceon instrument. This follows from the fact that for sample B (Sμ(0) ‖ a) the valuesof qDξ+
0 and qDξ−0 are about three times smaller on GPS than on EMU. Also sampleA shows slightly different results on GPD and on GPS. Second of all, there is asample dependence. Looking at the measurements on GPS (Sμ(0) ‖ a) sample Bhas a larger qDξ+
0 than sample A.Similar conclusions can be drawn for the weighting factor WaL and WaT . For
the Sμ(0) ‖ a orientation, the values for WaL seem to be in agreement with eachother. For Sμ(0) ⊥ a the difference is larger. Measuring the sample A at GPD (inthe pressure cell) yields larger values for WaL than at GPS. Sample B on EMU hasan even lower value. Unfortunately, this sample B was not measured at GPS. Ingeneral, however, WaT is much smaller than WaL. Because of the small values forWaT and the limited number of data points, it was difficult to get precise values.
In addition to the zero-field measurements, small longitudinal fields have beenapplied at fixed temperature, i.e. parallel to Sμ(0). The relaxation rate λZ forsample B, measured on EMU, was almost completely suppressed for fields as small2 mT [134]. For sample A, measured at GPD, the relaxation rate was suppressedfor 5 mT at both ambient pressure and at 0.95 (2) GPa (see Fig. 4.16). Accordingto Eq. 2.20 the relaxation rate λZ in an external longitudinal magnetic field Bext isdescribed by
λZ(Bext) =2Δ2νf
(γμBext)2 + ν2
f
=2Δ2τc
1 + γ2μB
2ext τ 2
c
(4.36)
Here Δ is the width of the field distribution at the muon site, νf = 1/τc thefluctuation rate of the fluctuating magnetic field with a correlation time τc, andγμ = 851.62 Mrad s−1T−1 the gyromagnetic ratio of the muon. For zero field thisexpression reduces to λZ(0) = 2Δ2τc. With Eq. 4.36 and the field dependence ofλZ(0), as shown in Fig. 4.16, an estimate of the fluctuation rate νf can be made. InTable 4.5 the field dependencies have been assumed independent of instrument.
Now before analyzing the data further, first the main features of the data in thevicinity of TC will be summarized.
1. UGe2 is known to be a very anisotropic magnetic compound [108]. This is alsoseen from both the angular scans and the temperature scans in the Knightshift measurements. A magnetic field parallel to the a axis induces a largeKnight shift, whereas a field perpendicular to a induces a very small Knightshift. This is illustrated in the Clogston-Jaccarino plots for the magneticsusceptibilities χi. However, the dependence of the relaxation rate λZ(T ) inthe critical regime shows very weak anisotropy for the orientation of Sμ(0)with respect to a. For both orientations, the values of WaL differ only by afactor of 2. This is shown for sample B on EMU and sample A on GPS. μSRis generally very sensitive to the anisotropy of magnetic fluctuations, as wasnicely demonstrated in NdRh2Si2 [144].

86 UGe2
Tab
le4.
5:C
ompa
riso
nof
the
expe
rim
enta
lva
lues
ofq D
ξ+ 0,q D
ξ− 0,W
aL,
andW
aT
for
sam
ples
Aan
dB
mea
sure
don
the
EM
U,
GP
D,an
dG
PS
inst
rum
ents
for
both
dire
ctio
nsof
Sμ(0
)w
ith
resp
ect
toth
ea
axis
,as
obta
ined
from
fits
toE
q.4.
32.
See
the
mai
nte
xtfo
ra
desc
ript
ion
ofth
esy
mbo
ls.
ForS
μ(0
)⊥
aon
lyξ+ 0
exis
ts.
From
mea
sure
men
tsin
long
itud
inal
mag
neti
cfie
ldth
eflu
ctua
tion
rate
ν fca
nbe
calc
ulat
edw
ith
Eq.
4.36
,si
nce
the
expe
rim
enta
lva
lue
for
λ(B
ext)
iskn
own
ata
give
nm
agne
tic
field
Bex
t.T
hese
expe
rim
ents
inm
agne
tic
field
have
not
been
perf
orm
edin
allca
ses.
Ifno
t,th
ena
valu
eof
ν fis
esti
mat
edby
assu
min
gth
esa
me
valu
eas
for
the
case
that
the
sam
ple
was
mea
sure
din
am
agne
tic
field
.T
hees
tim
atio
nis
indi
cate
dby
∼.
From
the
expe
rim
enta
lva
lues
the
mag
neti
cm
omen
tμ,t
hedi
pola
rw
ave
vect
orq D
,and
the
corr
elat
ion
leng
ths
ofth
eflu
ctua
tion
sξ+ 0
and
ξ− 0ar
eca
lcul
ated
wit
hE
q.4.
35.
Inth
iseq
uati
ona
L=
0.85
isus
ed,
asob
tain
edin
the
mai
nte
xt.
The
abbr
evia
tion
“s.”
inth
ehe
ader
sst
ands
for
“sam
ple”
.T
heva
lues
ofW
aT
wer
efix
edto
appr
opri
ate
valu
esdu
ring
the
fitti
ngpr
oced
ure,
beca
use
due
ofit
ssm
allva
lue
itw
asdi
fficu
ltto
obta
ina
prec
ise
valu
e.E
rror
bars
are
ther
efor
eno
tgi
ven
forW
aT,no
rfo
rth
era
tio
aL/a
T.
Sμ(0
)⊥
aS
μ(0
)‖
a
s.B
s.A
onG
PD
s.A
s.B
onEM
Us.
Bon
GPS
s.A
onG
PS
onEM
U0
GPa
0.95
(2)
GPa
onG
PS
T>
TC
T<
TC
T>
TC
T<
TC
T>
TC
T<
TC
q Dξ+ 0
orq D
ξ− 00.
021
(2)
0.00
52(7
)0.
0182
(5)
0.00
80(4
)0.
043
(2)
0.02
0(2
)0.
0150
(8)
0.00
72(4
)0.
0065
(6)
0.00
71(7
)W
aL
(MH
z)0.
317
(4)
0.82
(2)
0.72
(1)
0.56
(2)
0.14
0(4
)0.
20(2
)0.
22(1
)0.
23(1
)0.
27(3
)0.
24(2
)W
aT
(MH
z)0.
014
0.01
00.
027
0.01
50.
005
0.00
70.
005
0.00
50.
010
0.01
5a
L/a
T22
.682
26.7
3728
28.5
4446
2716
ν f(M
Hz)
0.6
(2)
2.8
(4)
1.5
(3)
∼2.
8(4
)0.
6(2
)0.
6(2
)∼
0.6
(2)
∼0.
6(2
)∼
2.8
(4)
∼2.
8(4
)
μ(μ
B)
0.01
1(2
)0.
015
(1)
0.01
1(1
)0.
018
(1)
0.01
6(1
)0.
014
(2)
0.01
3(2
)0.
013
(2)
0.02
5(2
)0.
027
(2)
q D(A
−1)
0.00
12(1
)0.
0027
(1)
0.00
24(1
)0.
0024
(2)
0.00
09(1
)0.
0010
(1)
0.00
10(1
)0.
0011
(1)
0.00
19(1
)0.
0018
(1)
ξ+ 0or
ξ− 0(A
)18
(2)
2.0
(3)
8.0
(7)
3.0
(2)
48(6
)20
(3)
15(2
)7.
0(7
)4.
0(4
)4.
0(5
)

4.3 Muon Spin Rotation and Relaxation 87
2. The measurements in applied magnetic field show that the relaxation rateλZ(B) in the critical regime is suppressed by a magnetic field in the order of2 - 5 mT. Susceptibility data shows that a magnetic field of 5 mT induces amagnetic moment of less than 0.01 μB/U. Therefore it is hard to imagine thatthe fluctuations of the full U moments, which have a saturation magnetizationof 1.4 μB/U at low temperatures, are suppressed by a field of 5 mT. Moreover,a suppression in a field of 5 mT yields a correlation time of τc ≈ 0.4 μs−1. Thiscan be considered to be quasi-static and does not reflect the expected rate forthe large magnetic moments on the U atoms.
3. Since according to Eq. 4.36 the value of λZ in zero field is given by λZ =2Δ2/νf , it follows that Δ ≈ 0.3 mT at the muon site. This indicates a verysmall distribution in local magnetic fields at the muon site.
Based on these observations it is proposed that in these experiments the muonspin is relaxed by the polarization of the conduction electrons. It is expected thatthis polarization is much less anisotropic than localized magnetic moments. Becauseof the strong electronic correlations in UGe2 (reflected by the large value of theSommerfeld coefficient γ in the specific heat) these magnetic fluctuations are slow.Moreover, this assumption could account for the small value of Δ observed.
So far only values for the products WaL and WaT were presented. In order toestimate a value for W appearing in Eq. 4.35, estimates for aL and aT should bemade. Theoretically, they are given by [27]
aL = 12
[(1 − px)
2 + (1 − py)2]
aT = p2x + p2
y Sμ(0) ‖ z (4.37)
with pα = Cαα(q = 0)+rμH/(4π). For the two muon sites (Table 4.3) with differentorientations of Sμ(0) this would give values of the ratio aL/aT in the range of 0.2 to4.0. However, experimentally only aL aT is observed for all orientations of Sμ(0)(see Table 4.5).
In the expression for pα the term Cαα(q = 0) accounts for the fluctuations dueto the localized magnetic moments [27]. However, when the muon only probes theitinerant part of the fluctuating magnetization, this term should be omitted andonly the contact term rμH/(4π) remains. With the data in Table 4.3 aL = 1.05 andaT = 0.001 is obtained for the first muon site, and aL = 0.62 and aT = 0.089 for thesecond muon site. Since both muon sites have nearly equal population, the first sitebeing slightly more populated than the second, the weighted average is aL = 0.85and aT = 0.04, with a ratio of aL/aT = 21, which is close to the ratio obtained bythe data in Table 4.5 considering the uncertainty in the determination of aT .
Now, using Eq. 4.35, the values for the magnetic moment μ, which depolarizes themuon spin, the dipolar wave vector qD and the correlation lengths ξ+
0 and ξ−0 of thefluctuations can be calculated. They are shown in Table 4.5. Clearly, despite of allthe sample and instrument dependencies, the overall picture is that the magnitudeof the fluctuating polarization, that depolarizes the muon spin, is μ = 0.02 (1) μB.

88 UGe2
The correlation lengths ξ+0 and ξ−0 of the magnetic fluctuations is of the order of
a lattice spacing for sample A, but several times larger for sample B. However,here also instrument dependence plays a role. The dipolar wave vector is aboutqD = 0.0010 A−1 for sample B, but about qD = 0.0022 A−1 for sample A.
The main results are given by the pressure experiments on sample A. Theseresults at ambient pressure and at 0.95 (2) GPa are not sample or instrument de-pendent because they were measured under identical conditions. The values forμ show that the polarization may be slightly reduced. The same applies for thedipolar wave vector qD. The main difference, leading to different critical dynam-ics (see Fig. 4.16) is the enhancement of the correlation length ξ+
0 of the magneticfluctuations.
4.3.5 Discussion
High pressure: spontaneous frequencies νμ and depolarization rates λX
By consideration of classical Larmor precession, as in Chapter 2, it can be under-stood that the muon spin is not sensitive to parallel magnetic field fluctuations andtherefore only magnetic excitations are probed which are perpendicular to the muonspin. For Sμ(0) ‖ Bloc, where Bloc is the local magnetic field at the muon site andBloc ‖ a (with a the easy magnetic axis) in the case of UGe2, only excitations alongthe b and c axis are probed. This includes spin waves and magnetic fluctuations.This depolarization is called the spin-lattice relaxation λZ . For Sμ(0) ⊥ a, thedepolarization is due to magnetic excitations along a × Sμ(0) and the a axis, andin addition due to the loss of Larmor phase coherence because of static magneticinhomogeneity (crystal defects, domain structures, etc.). This is called the trans-verse depolarization λX . Unfortunately, because of the orientation of the a axis withrespect to the cylindrical shape of the sample, it was only possible to measure λX .
The measurements in Fig. 4.12 show the development of a peak in λX,i aroundTX which can in principle be attributed to three different cases. First, some extrainhomogeneity like a small spin reorientation or a charge and spin density wave [145,146] can cause the muon spin polarization to decrease. Second, a change in the spinwave spectrum, facilitating the excitation of spin waves, can be responsible. Finally,a slowing down of the fluctuations, similar to a paramagnetic-to-ferromagnetic-statetransition is possible.
Extra inhomogeneity can be ruled out on the basis of neutron scattering exper-iments. Extensive neutron studies [147] have shown no sign of static order due toa charge and spin density wave. It has also been shown [116] that reorientation ofthe magnetic moments when crossing the transition at TX at 1.2 GPa, is unlikely.Measurements of the phonon spectrum [148] indicate no special feature around TX .Moreover, the μSR spectra can all be fitted by the exponentially damped oscilla-tions of Eq. 4.22. If static inhomogeneities would be present, then the dampingwould rather be Gaussian in nature. These findings point in the direction of extradepolarization by magnetic fluctuations or spin waves.

4.3 Muon Spin Rotation and Relaxation 89
A change in the spin wave spectrum at TX that facilitates the excitations couldlead to an increase in λX , but should be considered highly improbable. Althoughperhaps theoretically possible, no experimental report has suggested this exotic pos-sibility up to date. It has been shown that the anomaly shows the usual featuresof a phase transition [115]. The strong resemblance of the peak in λX at TX withthe peak at TC (e.g. Fig. 4.17) also points in this direction. From here on it will beconsidered a phase transition. It should however be stressed that only measurementsof λZ (i.e. Sμ(0) ‖ a) can unambiguously demonstrate that at high pressures extraspin dynamics develop that are normally associated with a phase transition, sinceλZ is not sensitive to inhomogeneity of the magnetic moments.
When TC is approached from high temperatures, the paramagnetic fluctuationstend to slow down. In μSR, the relaxation rate λZ can be described by λZ = 2Δ2τc,where Δ is the width of the field distribution at the muon site and τc is the correlationtime of the fluctuations. Therefore, λZ increases for T ↓ TC. For UGe2 this isdemonstrated in Fig. 4.16 at ambient pressure and at P = 0.95 (2) GPa. Below TC,λX is measured for the orientation of Sμ(0) perpendicular to a. λX decreases attemperatures below TC because less fluctuations (i.e. spin waves) are excited at lowtemperatures.
The slowing down of the magnetic moments as T ↓ TC has also been shown byinelastic neutron scattering [149]. In this study Γq was measured for several q valuesaround TC. For each (fixed value of) q there was a minimum in Γq(T ) as a functionof temperature at T = TC. Because τ−1
c (q) ∝ Γq, the link between μSR and inelasticneutron scattering is roughly indicated by the relation λZ(T ) ∝ Γ−1(T ) with Γ someaverage of Γq over q. A minimum in Γ(T ) therefore corresponds to a maximum inλZ(T ). Unfortunately, no neutron study around TX could be found in literature forhigh pressures.
The present μSR data were in fact performed around TX and at high pressure.As TX is approached from high temperatures, λX ≈ Γ−1(T ) increases, indicating aslowing down of the spin dynamics, as discussed above. (At the moment, however,this remains somewhat speculative since only λZ can prove this slowing down un-ambiguously.) If so, this means that a minimum in Γ(T ) at T = TX would be found,just like at ambient pressure around TC. As suggested in Ref. [149], and theoreti-cally supported by numerical calculations [150], a decrease of Γ (∝ λ−1
X ) enhancesthe superconducting transition temperature Tsc. The transition at TX vanishes atthe same pressure as where Tsc is maximum and therefore it seems likely that the ob-served slowing down of the magnetic fluctuations could play a role in the formationof Cooper pairs.
High pressure: critical fluctuations
All the data in the critical regime of UGe2 unambiguously show that the spin-lattice relaxation rate λZ(T ) increases as TC is approached from above, but does notdiverge. This is explained by taking into account the dipolar interactions between

90 UGe2
the magnetic moments and by assuming that the muon spin is only relaxed byfluctuations that are longitudinal to their wave vector q [27]. The reason whyhardly any transversely polarized fluctuations are detected by the muon, is givenin the paragraph below Eq. 4.37. The assumption that the muon only probes theitinerant part of the magnetic fluctuations, automatically leads to aL aT . Aconsequence of the high sensitivity to especially longitudinal fluctuations is that themuon spin is for the greater part relaxed by fluctuation modes with q ≈ qD [142],where qD is the dipolar wave vector and determines the relative strength of thedipolar and exchange interactions in the system. From the measurements it followsthat qD ≈ 0.002 A−1. The μSR technique probes fluctuations with very small qvalues, that are largely inaccessible to (neutron) scattering techniques.
A fully consistent analysis of the experimental critical dynamics is obtained byassuming an itinerant nature of the magnetism that relaxes the muon spin. It ex-plains the low anisotropy in the data for different directions of Sμ(0). From thecalculations a small effective moment of μ ≈ 0.02 (1) μB follows, which is consistentwith the quasi-static nature as observed from measurements in magnetic field. Fi-nally, it explains why at ambient as well as at high pressures λZ can be describedsatisfactorily by the Heisenberg model with dipolar interactions, whereas UGe2 isan Ising system.
The anisotropy of λZ for different directions of Sμ(0) can be explained by apossible anisotropy of the contact coupling term rμH/(4π). See Sec. 4.3.4 for a dis-cussion. Recently it has been acknowledged for several compounds that the contactterm is indeed anisotropic [139].
The μSR result that the polarization of the conduction electrons in UGe2 is assmall as μ ∼ 0.02 (1) μB at ambient pressure as well as at high pressure, is sup-ported by polarized neutron experiments. Since this is a diffraction technique, thepolarization of the delocalized electrons can not be determined directly. Delocalizedstates possess a form factor that falls rapidly to zero by about 0.1 A−1 in (sin θ)/λand thus are hard to observe in a neutron experiment. The polarization of thesestates can, however, be determined by the difference between the uranium momentdeduced from bulk measurements and the moment derived from the form factormeasurements (localized states). For UGe2, at ambient pressure [107] an inverseFourier technique shows that the magnetization distribution is concentrated at theU sites. Also, the diffuse magnetic contribution is estimated to be ≈ 0.05 (3) μB/U,which is small compared to the ordered magnetic moment of ≈ 1.4 μB/U. Thismeans that the polarization of the conduction electrons in UGe2 should be small.For UPd2Al3 [151] it was found that 0.140 (4) μB is localized at each U atom witha diffuse part of 0.020 (4) μB. This implies that 12 % of the total magnetizationis delocalized. In U2Co2Sn [152] a localized magnetic moment of 0.118 (3) μB wasobtained and a delocalized part of 0.021 (4) μB. Thus 15 % is diffuse. With a diffusepart of about only 1 %, UGe2 contrasts these two compounds, but is comparable toe.g. USb0.8Te0.2 [153] and in agreement with previous μSR results [134].
The data therefore suggest that UGe2 is a dual system where itinerant magnetism
4.3 Muon Spin Rotation and Relaxation 91
coexists with localized 5f magnetism. Within this model the weakly anisotropicmagnetic fluctuations probed by μSR arise from the small polarization of the con-duction electrons. The large anisotropy of the bulk magnetization arises from thelocalized 5f states. No depolarization due to these states is detected in the presentμSR experiments. This can be understood from a simple estimation of fluctuationrate νf ≈ kBTC/�, which leads to a fluctuation rate of the order of THz instead ofthe observed MHz. The relaxation rate λZ corresponding to such a large fluctuationrate is too small to be observed because of strong motional narrowing. In contrast,URhGe, with a Curie temperature 4 to 5 times smaller than UGe2 (depending onpressure) is a compound in which a relaxation of both localized and delocalizedstates is observed. A thorough discussion of URhGe follows in Chapter 5.
Returning to the polarized neutron experiments, at high pressures and low tem-peratures (1.2 GPa [116] and 1.4 GPa [154]) it is found that both C2 (the ratiobetween the orbital and total uranium magnetic moment) and RL (the ratio be-tween the orbital and spin moment) are almost the same as at ambient pressure.Although the measured RL is reduced compared to the value for free U3+ or U4+
ions, indicating a certain degree of delocalization of the 5f electrons, it should beconcluded that also at higher pressures the magnetic moments are mainly localized,with a small itinerant polarization.
The idea of a system of two more or less separated magnetic subsets has beenpresented in literature before. Several techniques, among which μSR, have shownanomalous behavior in UPd2Al3 [124, 155, 156, 157, 158], UCu5 [159], and USb [160],which was attributed to two different types of magnetism.
If in UGe2 indeed localized magnetism coexists together with itinerant 5f stateswith small polarization, as strongly suggested by the μSR data presented in thisChapter and supported by polarized neutron scattering, this has implications forthe nature of the Cooper pairs in the superconducting state. Assuming an itin-erant nature of the ferromagnetism, theoretical studies have shown the possibilityof spin-triplet superconductivity [89, 90, 91, 92]. In this case the electrons form-ing the Cooper pairs are also responsible for the strong ferromagnetism. Otherstudies [100, 101], however, have shown that spin-singlet superconductivity is stillfeasible under the constraint that conducting electrons involved in the superconduc-tivity and localized electrons involved in the ferromagnetic order belong to differentsubsets of 5f electrons. The pairing mechanism is then based on the interactionof electron spins via localized magnetic moments. The μSR data presented in thisChapter suggest the latter case of Cooper pairs of itinerant electrons with small po-larization in a frame of magnetic U ions. Whether the Abrikosov-Suhl mechanismis indeed the true pairing mechanism or not, can not be concluded from the presentdata. However, the other theoretical models [89, 90, 91, 92] seem to contradict thepresent results.

92 UGe2
4.3.6 Conclusions
The results from the data in the critical regime, presented in this Chapter, suggest acoexistence of two subsystems with localized 5f states responsible for the magneticordering and delocalized states responsible for the superconducting properties. It islikely that electrons do not participate in both phenomena simultaneously, but areseparated either in real space and/or in reciprocal space, i.e. different parts of theFermi surface.
The depolarization of the spontaneous frequencies exhibit a peak at temperatureTX . It is shown that the peak could possibly develop because of the slowing downof magnetic fluctuations. As the transition at TX vanishes at the same pressure aswhere Tsc is maximum, it is likely that the observed slowing down of the magneticfluctuations plays an important role in the formation of Cooper pairs. The μSR datashow that it seems likely that the observed slowing down of the magnetic fluctuationscould play a role in the formation of Cooper pairs.
Appendix: Effect of stray fields induced by a homo-
geneously magnetized sample on 3D neutron depo-
larization measurements
In this appendix the magnetic induction B, generated by a uniformly magnetizedsample with length l, width w, and thickness t (see Fig. 4.21), will be calculated.Moreover, analytical expressions will be given for the line integrals of B along thepath of a neutron. The center of the sample is taken as the origin of the referenceframe.
The starting point of the calculations is the Biot-Savart law
B(x, y, z) =μ0
4π
∫S
(M × n) × r
r3dS +
μ0
4π
∫τ
(∇× M) × r
r3dτ, (4.38)
where μ0 = 4π×10−7 H/m, M is the magnetization, n the unit vector perpendicularto the surface S of the sample, r the vector pointing from the surface S to the point(x, y, z), and τ the volume of the sample. Since the sample has a homogeneous

Appendix 93
Figure 4.21: Schematic layout of a homogeneously magnetized rectangular sample.
magnetization, the second term vanishes and, with m = M/M ,
B =μ0M
4π
∫S
(m × n) × r
r3dS. (4.39)
is obtained.A straightforward but tedious calculation shows that
Bx = −μ0M
4π
∑ε1,ε2,ε3=±1
ε1ε2ε3 ln [S − (2y + ε2w)]
By = −μ0M
4π
∑ε1,ε2,ε3=±1
ε1ε2ε3 ln [S − (2x + ε1t)] (4.40)
Bz =μ0M
4π
∑ε1,ε2,ε3=±1
ε1ε2ε3 arctan
(2z + ε3l
(2x + ε1t) (2y + ε2w)S)
,
where
S =
√(2x + ε1t)
2 + (2y + ε2w)2 + (2z + ε3l)2. (4.41)
The rotation of the polarization of a neutron beam depends on the line in-tegral of the magnetic field along the neutron path. From the Larmor equationddtP(t) = γP(t) × B(t), or equivalently d
dxP(x) = (γ/v)P(x) × B(x) where γ =
1.83 × 10⁸ s−1T−1 the gyromagnetic ratio of the neutron and v its velocity, thegeneral solution
P(x, y, z) =
{exp
(γ
v
∫ x
−∞B(x′, y, z)dx′
)}P(−∞, y, z) (4.42)
is obtained, where the magnetic-field tensor B is defined as
B(x, y, z) =
⎛⎝ 0 Bz −By
−Bz 0 Bx
By −Bx 0
⎞⎠ (x, y, z). (4.43)

94 UGe2
Thus, in order to calculate the rotation of the neutron-beam polarization becauseof a homogeneously magnetized sample, the following line integrals are required
X(y, z) =
∫ ∞
−∞Bx(x
′, y, z)dx′ = 0
Y (y, z) =
∫ ∞
−∞By(x
′, y, z)dx′ =
−tμ0M
4π
∑ε2,ε3
ε2ε3 ln((2y + ε2w)2 + (2z + ε3l)
2)
Z(y, z) =
∫ ∞
−∞Bz(x
′, y, z)dx′ =
tμ0M
2π
∑ε2,ε3
ε2ε3 arctan
(2z + ε3l
2y + ε2w
)
(4.44)
For completeness the line integrals in the case that the neutron beam is alongthe z direction are given:
X ′(x, y) =
∫ ∞
−∞Bx(x, y, z′)dz′ = 0
Y ′(x, y) =
∫ ∞
−∞By(x, y, z′)dz′ = 0
Z ′(x, y) =
∫ ∞
−∞Bz(x, y, z′)dz′ = μ0M l. (4.45)
From Eq. 4.42 and the above line integrals it is obtained for the final polarization
that P(∞, y, z) = D(y, z) × P(−∞, y, z) with
D(y, z) =1
Σ
⎛⎜⎜⎝
Σ cos a√
Σ Z√
Σ sin a√
Σ −Y√
Σ sin a√
Σ
−Z√
Σ sin a√
Σ Z2 cos a√
Σ + Y 2 Y Z(1 − cos a
√Σ)
Y√
Σ sin a√
Σ Y Z(1 − cos a
√Σ)
Y 2 cos a√
Σ + Z2
⎞⎟⎟⎠ , (4.46)
where Σ(y, z) = Y 2(y, z) + Z2(y, z) and a = γ/v.Now Eq. 4.46 relates the initial polarization to the final polarization for a beam
passing through the sample at (y, z). For a neutron beam with finite cross section,
the matrix D should be integrated over the beam cross section. If the integration issymmetric relative to the origin, then one can make use of the fact that
By(ε1x, ε2y, ε3z) = ε2ε3 By(x, y, z), (4.47)
where ε1, ε2, ε3 = ±1. This means that By(x, y, z) and, therefore, Y (y, z) are an-tisymmetric with respect to y and z. Therefore, from Eq. 4.46, one only has to

Appendix 95
integrate the matrix
1
Σ
⎛⎝ Σ cos a
√Σ Z
√Σ sin a
√Σ 0
−Z√
Σ sin a√
Σ Z2 cos a√
Σ + Y 2 0
0 0 Y 2 cos a√
Σ + Z2
⎞⎠ (4.48)
over the cross section of the neutron beam.An infinitely narrow neutron beam passing exactly through the middle of the
sample will only have its polarization rotated by Bz(x, 0, 0) since Bx(x, 0, 0) andBy(x, 0, 0) vanish. As long as Y 2(y, z) is small compared to Z2(y, z), which is validif (y, z) is sufficiently far from the edges, Eq. 4.48 is a pure rotation matrix.
It is now possible to calculate the magnetization of the sample from the measuredrotation angle (Eq. 4.11). If no stray fields were present, the rotation angle would begiven by tμ0Mγ/v. However, the stray fields reduce the rotation angle to γ/vZ(y, z)with Z(y, z) given in Eq. 4.44. Therefore the geometrical factor η can be defined as
φ = ημ0Mtγ/v, (4.49)
where η(y, z) is given by
η(y, z) =1
2π
∑ε2,ε3
ε2ε3 arctan
(2z + ε3l
2y + ε2w
). (4.50)
Since η(0, 0) is a saddle point (η(0, z) has a local maximum and η(y, 0) a localminimum), an average over the cross section of the neutron beam, centered aroundthe middle of the sample, will yield a result very close to the value of η(0, 0), whichis given by
η =2
πarctan
(l
w
). (4.51)

96

CHAPTER 5
URhGe
5.1 Introduction
he second uranium based compound discovered to show super-conductivity within its ferromagnetic state is the ternary intermetal-lic URhGe [2]. It crystallizes in the orthorhombic TiNiSi-type struc-ture with space group Pnma [161, 162]. The unit cell, with dimensionsa = 6.87 A, b = 4.33 A, and c = 7.51 A, contains four formula units.The structure is shown in Fig. 5.1. The U, Rh, and Ge atoms each
occupy 4c positions (x, 14, z), with distinct parameters x and z. The U atoms are
arranged in zig-zag chains of nearest neighbors in the a direction. The nearest neigh-bor distance of the uranium atoms is equal to dU−U ≈ 3.44 A [163], which compareswell with the Hill limit of 3.5 A [49]. However, the shortest U-Rh and U-Ge distancedU−Rh ≈ 2.99 A and dU−Rh ≈ 2.94 A suggest that the hybridization between theuranium atom and the ligands plays an important role in the delocalization of U 5fstates. Theoretical work [164, 165] has supported this hypothesis.
Neutron diffraction experiments on single-crystalline URhGe [2, 163, 166] re-vealed a collinear ferromagnetic order below TC = 9.6 K with ordered U moments of0.35 - 0.42 μB along the c axis. No component of the ordered moment was observedalong the a axis, which acts as the hard magnetic direction for the magnetiza-tion. In addition to the neutron-diffraction experiments, the ferromagnetic order insingle-crystalline URhGe was studied by specific-heat, magnetization, and electricalresistivity [163, 167], which showed a sizeable influence of applied magnetic fields onthe ferromagnetic order and on the ferromagnetic spin fluctuations in the b−c plane.In the low-temperature limit, the specific heat is characterized by the electronic con-tribution of the ferromagnetic spin fluctuations with a moderately enhanced linearterm of γ = 164 mJ/mol K2. The magnetic properties of single-crystalline URhGeare in good agreement with the results from earlier measurements on polycrystalline

98 URhGe
Figure 5.1: The orthorhombic crystallographic structure of URhGe. Uranium atoms areblack, rhodium atoms light gray, and germanium atoms dark gray. The uranium nearestneighbors are connected. The unit cell, containing four formula units, is indicated as well.
and powder samples [168, 162, 169, 170, 171, 172], which have been reviewed bySechovsky and Havela [161]. Recently, band-structure calculations were performedby Divis and co-workers [164] and Shick [165] to study the origin of the magneticorder in URhGe. These calculations suggest a substantial hybridization betweenthe U-5f and Rh-4d states and a relatively small uranium magnetic moment of0.3 μB originating from a partial cancelation of the spin and orbital components.The calculated moments are in good agreement with the measured values.
URhGe has attracted much attention because of the unusual coexistence of super-conductivity (Tc =0.25 K) and ferromagnetism (TC =9.5 K) [2]. From the beginningit was believed that ferromagnetic spin fluctuations, which are strongly enhancednear a quantum critical point, are the “glue” between the electrons forming a Cooperpair. Indeed, field induced superconductivity was found [173] at the magnetic fieldat which a spin reorientation takes place (12 T), inducing new fluctuations.
In this Chapter two techniques are used, namely dilatometry and muon spin re-laxation (μSR), to study the ferromagnetic order in URhGe. Pressure-dependent ex-periments on UGe2 and UIr suggest that in these systems superconductivity emergesnear a ferromagnetic quantum critical point. One may therefore expect that ferro-magnetic order in URhGe is also very sensitive to pressure. The volume dependenceof several electronic quantities can be determined by thermal expansion measure-ments at ambient pressure. When superconductivity sets in at low temperature,conduction electrons condense into Cooper pairs. It is therefore of interest to inves-tigate the magnetic properties of URhGe and specifically of the conduction electronsin detail. Muons are very sensitive magnetic probes and thus have the potentialityto yield information on the question whether the magnetism found in URhGe is ofa localized or an itinerant nature.

5.2 Dilatometry 99
5.2 Dilatometry*
5.2.1 Introduction
In this Section thermal expansion measurements of single-crystalline URhGe in thetemperature range from T = 2 to 200 K are reported. The principal aim was todetermine the pressure dependence of the ferromagnetic transition temperature TC.For a second-order phase transition, the uniaxial pressure dependence of TC (at am-bient pressure) can be determined with the Ehrenfest relation from the anomalies inthe specific heat and the linear coefficient of thermal expansion. The initial pressuredependence may give an estimate of the critical pressure needed to suppress theferromagnetic order and reach the quantum critical point at TC = 0 K. In addition,the electronic Gruneisen parameter, which characterizes the volume dependence ofthe ferromagnetic spin fluctuations at low temperatures, has been determined.
5.2.2 Experimental
The dilatometry experiments were performed on a single-crystalline URhGe samplewith dimensions a × b × c = 2.4 × 5.0 × 2.4 mm3. The sample was cut from thematerial used in earlier specific-heat measurements performed by Hagmusa and co-workers [167]. The crystal has been grown from a stoichiometric melt of at least99.95 % pure materials by means of the Czochralski technique in a tri-arc furnacewith a continuous gettered Ar atmosphere. No subsequent heat treatment was givento the crystal. Due to the relatively high residual resistivity at low temperaturesno superconductivity was observed in this particular crystal [163]. The coefficientof linear thermal expansion α(T ) = (1/L)(dL/dT ) was measured using a sensitiveparallel-plate capacitance dilatometer [34] along the orthorhombic a, b, and c axes.From these measurements the volume expansion αv = αa +αb +αc was determined.
5.2.3 Results
In Fig. 5.2 the coefficient of linear thermal expansion α along the a, b, and c axisof single-crystalline URhGe is shown as a function of temperature in the rangefrom T = 2 to 200 K. The temperature dependence of the volume expansion αv =αa + αb + αc is shown for comparison (notice the figure shows αv/3). At hightemperatures the thermal expansion is governed by the phonon contribution forall three orientations. Around a temperature of 25 K a remarkable crossing of thecurves for the thermal expansion along the a, b, and c axis is observed. This crossingis a clear sign for the development of an additional contribution from ferromagneticspin fluctuations at low temperatures. It is interesting to note that this additionalcontribution from ferromagnetic spin fluctuations mainly affects the anisotropy ofthe thermal expansion in the b − c plane, which acts as the easy plane for the
*Parts of this Section have been published in Physical Review B 67 (2003) 144407.

100 URhGe
Figure 5.2: The coefficients of linear thermal expansion α of URhGe as a function oftemperature T along the orthorhombic a, b, and c axis. For comparison the volumeexpansion divided by a factor 3 (αv/3) is also shown. The high-temperature behavior isgoverned by the phonon contribution, while the anomaly at TC = 9.7 K reflects the onsetof ferromagnetic order.
magnetization. At TC = 9.7 K the ferromagnetic order sets in and a peak in thecoefficient of linear thermal expansion is observed for all three directions.
The low-temperature behavior of the coefficients of linear thermal expansionalong the a, b, and c axis is shown in more detail in Fig. 5.3. The observed steps inthe coefficients of linear thermal expansion have the same sign but different sizes forthe three orthorhombic axes of single-crystalline URhGe. The values of the stepsare listed in Table 5.1. In Fig. 5.4 the low-temperature volume expansion dividedby temperature (αv/T ) is shown as a function of temperature and compared withthe specific heat divided by temperature (c/T ) measured on a sample prepared fromthe same single-crystalline batch [167].
5.2.4 Discussion
The temperature dependence of the thermal expansion at high temperatures is gov-erned by the phonon contribution and closely resembles a Debye curve. The esti-mated Debye temperature of θD ≈ 200 K is in good agreement with the specific heatdata [163, 167]. At low temperatures the Debye curve for the phonon contributionis expected to show a T 3 temperature dependence. Below T = 30 K the thermal

5.2 Dilatometry 101
Figure 5.3: The coefficients of linear thermal expansion α of URhGe as a function oftemperature T along the orthorhombic a, b, and c axis at low temperatures. The anomalyat TC = 9.7 K reflects the onset of ferromagnetic order. The large linear term at lowtemperatures is due to spin fluctuations.

102 URhGe
Figure 5.4: The volume expansion divided by temperature (αv/T ) of URhGe as a func-tion of temperature T at low temperatures. For comparison the specific heat divided bytemperature (c/T ) of a sample prepared from the same single-crystalline batch is shown[167]. The bottom frame shows the effective Gruneisen parameter Γeff , determined fromthe experimental data of the volume expansion and the specific heat (see main text).

5.2 Dilatometry 103
Table 5.1: Step anomalies in the coefficients of linear thermal expansion of single-crystalline URhGe along the orthorhombic a, b, and c axis. The corresponding pressuredependence of the Curie temperature, dTC/dp, was deduced from the Ehrenfest relation(see text).
Δα dTC/dp(10−6 K−1) (K/kbar)
a axis 3.4(1) 0.052(3)b axis 1.7(1) 0.026(2)c axis 2.7(1) 0.041(2)volume 7.8(2) 0.119(6)
expansion along the a axis shows a clear deviation of this behavior, which is evenmore pronounced along the b axis. This deviation indicates the development of anadditional contribution due to ferromagnetic spin fluctuations. This additional con-tribution was also observed in the specific heat measurements and described in termsof an enhanced electronic contribution [163]. In the ferromagnetically ordered statebelow TC = 9.7 K, the temperature dependence of the volume expansion closelyresembles that of the specific heat, as shown in Fig. 5.4. In line with the analysisof the specific heat measurements [163], three different contributions to the thermalexpansion can be identified in the ferromagnetically ordered state, namely, contribu-tions due to phonons, ferromagnetic spin waves, and ferromagnetic spin fluctuations.As discussed, the phonon contribution shows a T 3 power-law behavior at low tem-peratures. The ferromagnetic spin-wave contribution is expected to obey a T 3/2
power-law behavior, while the ferromagnetic spin fluctuations lead to an enhancedlinear term at low temperatures. Both the phonon and spin-wave contributions tothe volume expansion divided by temperature (αv/T ) [and the specific heat dividedby temperature (c/T )] vanish at low temperatures and, as a consequence, the ex-trapolated value of αv/T = 5.8 (2) × 10−7 K−2 at T = 0 K is solely due to thecontribution of the ferromagnetic spin fluctuations.
In order to determine the uniaxial and hydrostatic pressure dependence of theferromagnetic transition temperature, the Ehrenfest relation can be applied. Fora second-order phase transition, the uniaxial pressure dependence of the transitiontemperature is directly related to the step anomalies in the coefficient of linearthermal expansion and the specific heat by the Ehrenfest relation
dTC
dpi
=VmΔαi
Δ (c/T ), (5.1)
where the index i refers to the orthorhombic axis, Vm = 3.36 × 10⁻⁵ m3/mol isthe molar volume, and Δ (c/T ) = 0.22 (1) J/mol K2 is the anomaly in the specificheat divided by temperature [163]. By applying this relation to the experimentalstep anomalies in the coefficients of linear thermal expansion, the uniaxial pressure

104 URhGe
dependence of TC along the a, b, and c axis is obtained. The calculated values arelisted in Table 5.1. The hydrostatic pressure dependence of TC can be obtained byinserting the volume expansion for the coefficient of linear expansion in Eq. 5.1, orby summing the three contributions of the uniaxial pressure dependence. The differ-ent pressure dependencies of TC as listed in Table 5.1 are all positive. This stronglysuggests that the ferromagnetic order cannot be suppressed by moderate mechanicalhydrostatic or uniaxial pressures, like in the case of UGe2 and UIr. Instead a negativeuniaxial pressure is needed to suppress TC for all crystallographic directions. Usinga simple linear extrapolation of the initial pressure dependence calculated from theEhrenfest relation, a negative critical hydrostatic pressure of pcr ≈ −8.0 GPa isobtained. It is important to note that this value should be regarded as an upperbound for the negative critical pressure as the pressure dependence of TC is expectedto show significant non-linear corrections to the initial pressure dependence at am-bient pressure. A negative critical pressure of the order of pcr ≈ −8.0 GPa might beachieved by suitable chemical substitutions. A detailed study on which substitutionis appropriate in tuning TC to 0 K, is presented in Chapter 6.
In order to characterize the volume dependence of the electron correlations,the effective Gruneisen parameter of URhGe has been calculated. The thermalGruneisen parameter ΓT is defined as
ΓT = −d ln T ∗
d ln V(5.2)
where T ∗ is a characteristic temperature that reflects the dominant energy scale ofthe system. The effective thermal Gruneisen parameter Γeff can be calculated fromthe measured temperature-dependent volume expansion αv(T ) and specific heat c(T )by [86]
Γeff(T ) =Vm αv(T )
κ c(T ), (5.3)
where κ = -(1/V )(dV/dp) is the isothermal compressibility. As the compressibilityof URhGe is unknown an estimated value κ = 0.8 Mbar−1 is used. Experimen-tal values for the compressibility of other UTX compounds vary from κ = 0.6 to1.0 Mbar−1 [174]. In Fig. 5.4 the effective Gruneisen parameter Γeff , calculatedfrom the experimental volume expansion and the reported specific heat [167], isshown as a function of temperature. At high temperatures the effective Gruneisenparameter shows a small constant value of Γph = 2 and describes the volume depen-dence of the characteristic energy scale for the phonons. Below 30 K the effectiveGruneisen parameter rapidly increases and reaches a value of Γeff ≈ 14 just aboveTC. Below TC a slow increase of the effective Gruneisen parameter is observed fordecreasing temperatures. In the low-temperature limit Γeff corresponds to the en-hanced electronic Gruneisen parameter Γsf = d ln γ/d ln V ≈ 14 of the ferromagneticspin fluctuations. The corresponding relative pressure dependence of the electronicspecific heat amounts to d ln γ/dp = −κΓsf ≈ −11 Mbar−1.
The relation between the magnetic order and the spin fluctuations can be studiedby comparing the volume dependence of the energy scales for the ferromagnetic order

5.2 Dilatometry 105
Figure 5.5: Temperature versus pressure phase diagram of URhGe. The lines are guidesto the eyes. The Curie temperature TC increases monotonically up to 14.0 GPa and thesuperconducting transition temperature Ts decreases continuously and vanishes around3.0 GPa. (Figure taken from Ref. [176].)
(TC) and the ferromagnetic spin fluctuations (Tsf). It turns out that the Gruneisenparameter for the ferromagnetic order ΓF = −d ln TC/d ln V = (1/κTC)(dTC/dp) ≈16 is of the same order of magnitude and has the same sign as the Gruneisen parame-ter for the ferromagnetic spin fluctuations Γsf = −d ln Tsf/d ln V = d ln γ/d ln V ≈14. This last equation holds because γ ∝ N(EF) ∝ T−1
sf . The situation here isin strong contrast to pressure-induced antiferromagnetic superconductors such asCePd2Si2 [175], where the antiferromagnetic order competes with the spin fluctua-tions with an opposite scaling behavior with volume. It can therefore be expectedthat the spin-mediated superconductivity of URhGe exists over a wide pressurerange. This in contrast to the situation in the ferromagnetic superconductor UGe2 [1]and UIr [3], where superconductivity is only observed in a small pressure region closeto the critical pressure where the ferromagnetic order is suppressed.
Comparison with other measurements
F. Hardy et al. have succeeded in growing a single crystal of URhGe which issuperconducting at low temperatures [176, 177]. The temperature versus pressurephase diagram is shown in Fig. 5.5. The observed Curie temperature TC increaseslinearly up to 14.0 GPa with an estimated slope of dTC/dp ≈ 0.065 K kbar−1. Thisis roughly comparable to the value of 0.119 K kbar−1 estimated from the dilatometrymeasurements presented in this Section. The difference can originate from errors inthe determination of the values of Δα and Δc/T . Another possibility is that this

106 URhGe
value only represents the slope of TC versus p for p = 0 GPa. It might be possiblethat at low pressures TC is not perfectly linear with p.
In Fig. 5.5 the superconducting transition temperature Ts is shown as well. Itis seen that Ts vanishes at an estimated pressure of p = 3.0 GPa. In comparisonwith UGe2, in which compound the superconductivity is only found between 1.0 and1.6 GPa, or with UIr, with 2.6-2.7 GPa as superconducting pressure region, this isa very broad pressure range, especially because the diagram is expected to extendbelow p = 0 to negative pressures. This is consistent with the fact that ΓF and Γsf
are equal in sign and have the same order of magnitude.Further comparison can be made between the dilatometry data and the mea-
surement of Hardy [176, 177].The coefficient A in the electrical resistivity ρ(T ) =ρ0 + AT 2 was measured as well as a function of pressure [178]. Since A ∝ m∗2 andγ ∝ m∗, where m∗ is the enhanced effective mass of the heavy quasiparticles, anestimation can be made for d ln γ/dp. The reduction of A with pressure results inΔm∗/m∗ = −0.23 for Δp = 2.0 GPa. This gives d ln γ/dp = −13 Mbar−1 whichcompares well with a value of -11 Mbar−1 as estimated from our thermal expansionmeasurements.
5.2.5 Conclusions
Thermal expansion measurements on a single-crystalline sample of the itinerantferromagnet URhGe have been performed. Below the ferromagnetic ordering tem-perature of TC = 9.7 K an increase in the coefficient of linear thermal expansion wasobserved along all three orthorhombic axes. The uniaxial pressure dependence of theferromagnetic transition temperature was determined by the Ehrenfest relation fromthe anomalies in the coefficients of linear thermal expansion and the specific heat.Positive values of dTC/dp are found for all principal axes. Consequently, the hydro-static pressure dependence is also positive and amounts to dTC/dp = 0.119 K/kbar.This positive pressure dependence contrasts the behavior reported for UGe2 andUIr. In addition, the effective Gruneisen parameter was determined. The resultinglow-temperature behavior points to an enhanced volume dependence of the ferro-magnetic spin fluctuations at low temperatures and an equal volume scaling of theenergy scales for the ferromagnetic order and the ferromagnetic spin fluctuations.
5.3 Muon Spin Rotation and Relaxation
5.3.1 Introduction
When superconductivity sets in at low temperature, the conduction electrons con-dense into Cooper pairs. In ferromagnetic superconductors, the pairing mechanismof the conduction electrons needed for superconductivity is believed to be magneticin origin. It is therefore of utmost importance to investigate the magnetic propertiesof URhGe and specifically of its conduction electrons.

5.3 Muon Spin Rotation and Relaxation 107
Several theoretical studies have been performed to explain the coexistence ofsuperconductivity and ferromagnetism. Most studies consider an itinerant nature ofthe ferromagnetism as a starting point and indeed have shown the possibility of su-perconductivity in a ferromagnetic material. See e.g. Refs. [89, 90, 91, 92]. In thesecases the electrons forming the Cooper pairs are also responsible for the ferromag-netism, which can be explained by the spin-triplet nature of the superconductivity.Other studies [100, 101], however, have shown that spin-singlet superconductivityis still feasible under the constraint that conducting electrons involved in the su-perconductivity and localized electrons involved in the ferromagnetic order belongto different subsets of 5f electrons. The pairing mechanism is then based on theinteraction of electron spins via localized magnetic moments.
In order to determine which type of pairing is most probable, it is importantto quantify the magnetic properties of the conduction electrons. These are difficultto be measured directly by diffraction techniques, since the magnetic scatteringdue to the polarization of delocalized electrons will only be significant at small Q.However, as muons localize at interstitial sites and are very sensitive to magneticfields whatever their origin (localized or itinerant magnetic moments), the muon spinrotation or relaxation technique (μSR) does have the possibility to yield informationon the itinerant electrons and associated magnetism.
5.3.2 Experimental
A single-crystalline sample of URhGe with a diameter of 5 mm and a length of 2.5 cmhas been grown from a polycrystalline ingot using a Czochralski tri-arc technique.The ingot was prepared by arc melting the constituents U, Rh, (all 3N purity)and Ge (5N) under a high-purity argon atmosphere. No subsequent heat treatmentwas given to the single crystal. The single-crystalline nature was checked by X-rayLaue diffraction. The single-phase nature of the crystal was checked by electronprobe micro-analysis (EPMA) which showed no sign of impurity phases within theresolution, except for a small amount of uranium oxide (less than 1 volume %).
For the experiments two samples with a different orientation were cut from thesingle crystal. The first sample consisted out of platelets with the a axis perpendicu-lar to the platelet. In the second sample the c axis was perpendicular to the platelet.The initial muon polarization Sμ(0) was directed perpendicular to the platelets ofthe samples. A total surface area with a diameter of about 2 cm of sample was re-alized by wrapping several platelets next to one another in an aluminium foil. Thethickness of the platelets was 0.3 mm.
The experiments were performed at the EMU spectrometer of the ISIS facil-ity at the Rutherford Appleton Laboratory in the United Kingdom. The fly-pastmode [179] was used to reduce background. In this mode, the muons which do nothit the sample, fly past and do not contribute to the signal. However, some muonsare stopped in the walls of the cryostat and these cause a small, but observable,well-defined background. A blue Oxford Instruments cryostat was used for tem-

108 URhGe
peratures above 2 K, whereas at lower temperatures a 3He cryostat was used. Themeasurements were performed in the temperature range from 0.5 to 300 K and inmagnetic fields up to 0.45 T, oriented parallel to Sμ(0).
5.3.3 Results
The first step in the study of the critical spin dynamics of compounds is an accuratedetermination of the Curie temperature TC. In the sample for which the initial muonpolarization Sμ(0) was parallel to the hard magnetic axis (a) and perpendicular tothe easy magnetic axis (c), the full asymmetry for the wiggles in the signal wasfound, resulting from a spontaneous muon spin precession. Defining TC as thetemperature at which the wiggles disappear, TC = 9.51 (6) K is obtained. Thisvalue is consistent with the maximum of the relaxation rate for the second sample,in which Sμ(0) ‖ c. Since the spontaneous muon precession has the full asymmetryfor Sμ(0) ‖ a, whereas no precession is observed for Sμ(0) ‖ c, it can be concludedthat the local field Bloc at the muon site is parallel to the easy magnetic axis c: i.e.Bloc ‖ c.
Examples of the measured spectra during a field scan in the paramagnetic stateof URhGe are given in the upper panel of Fig. 5.6. All the spectra of the asymmetrya0P
expZ (t) as a function of time t, taken in the paramagnetic state (and for Sμ(0) ‖ c
also in the ferromagnetic state), could be analyzed as a sum of two components:
a0PexpZ (t) = a1 exp(−λZt) + a2P
KTZ (t, ΔKT, Bext). (5.4)
Here P expZ (t) and PKT
Z (t, ΔKT, Bext) are functions which are normalized to unityfor t = 0. The first component in Eq. 5.4 describes the μSR signal from thesample where λZ measures the spin-lattice relaxation rate at the muon site. Thesecond term accounts for the muons stopped in the background, e.g., the cryostatwalls. It can be modeled by a time and field dependent static Kubo-Toyabe functionPKT
Z (t, ΔKT, Bext) where ΔKT is the width of the static magnetic field distribution atthe muon site and Bext the external magnetic field. For each sample, the asymmetrya2 and ΔKT were fixed to appropriate and temperature independent values. Thesevalues were obtained by iteratively searching for those values of a2 and ΔKT whichgave on average the best fits for all temperatures. Since the fly-past mode was used,low background asymmetries with maximum of a2 = 0.01 were found.
In the lower panel of Fig. 5.6 a decomposition into the two components of Eq. 5.4is given for the fit to the data measured in 0 mT. The Kubo-Toyabe function issmall compared to the exponential function. For t > 5 μs the exponential functionis almost indistinguishable from the total fit function.
In Fig. 5.7 the temperature dependence of the spin-lattice relaxation rate λZ inthe paramagnetic state of URhGe is displayed. It is measured in zero field withSμ(0) parallel to the hard magnetic axis a. Above T ∼ 100 K the relaxation is tem-perature independent. The decrease at temperatures above 200 K can be attributedto muon diffusion. Below T ∼ 100 K the relaxation λZ(T ) starts to increase. Two

5.3 Muon Spin Rotation and Relaxation 109
Figure 5.6: (Upper panel) Examples of μSR spectra a0PexpZ (t) as a function of time t
recorded at ISIS. The figure shows spectra taken at different values of the applied magneticfield in the paramagnetic state of URhGe (TC = 9.51 (6) K). The initial muon polarizationSμ(0) as well as the external magnetic field Bext were oriented parallel to the a axis. Thesolid lines are fits to Eq. 5.4. For 0, 0.47, and 10 mT it is found that λZ = 0.0171 (5),0.0094 (5), and 0.0045 (5) μs−1, respectively. The background Kubo-Toyabe function wasassumed constant with parameters a2 = 0.0100 and ΔKT = 0.300 μs−1. The effect of Bext
on the Kubo-Toyabe function was taken into account. For the sake of clarity, the curvefor 0.47 mT is shifted upwards by of 0.01. (Lower panel) Decomposition of the fit to the0 mT data into the two components of Eq. 5.4.

110 URhGe
Figure 5.7: Temperature dependence of the muon relaxation rate λZ in the paramagneticstate of URhGe (TC = 9.51 K). The initial muon polarization Sμ(0) was oriented parallelto the a axis. Above T ∼ 100 K λZ is constant. The decrease above 200 K is attributed tomuon diffusion. Below T ∼ 100 K the depolarization increases in two steps. Between 100 Kand 11.5 K λZ increases relatively slowly with decreasing temperature. Between 11.5 Kand TC = 9.51 K a very sharp increase is observed. The dashed line below T = 100 K isa guide to the eye. Above T = 100 K, the line has a constant value.
temperature regions can be distinguished. Between 100 and 11.5 K λZ(T ) increasesrelatively slowly with decreasing temperature, followed by a very sharp increase be-tween 11.5 and TC = 9.51 (6) K. A zoom of λZ(T ) below 100 K is shown in Fig. 5.8as a function of the reduced temperature τ = (T − TC)/TC. Note the logarithmicscales. Here it is seen that below T = 11.5 K (τ = 0.2) a second term in λZ(T )develops. The dashed line is a guide to the eye.
In order to study the anisotropy in URhGe, it is necessary to measure the tem-perature dependence of λZ in zero field for Sμ(0) parallel to the easy axis for magne-tization, Sμ(0) ‖ c, as well. In Fig. 5.9 λZ(T ) is displayed for the temperature rangefrom 0.4 to 300 K. Note the logarithmic temperature scale. Above T ∼ 15 K the re-laxation rate is temperature independent. As in the previous paragraph, the decreaseat higher temperatures (T > 200 K) can be attributed to muon diffusion. BelowT ∼ 15 K the relaxation increases and shows a maximum at TC = 9.51 (6) K. Thismaximum is a factor 2 lower than the maximum for Sμ(0) ‖ a. For Sμ(0) ‖ a twotemperature regions of increasing λZ could clearly be distinguished. Here, however,the situation is less clear. Below TC the relaxation shows a monotonous decreasewith decreasing temperature down to 0.6 K. At the lowest temperatures, however,λZ(T ) seems to increase below T = 0.5 K.
Also shown in Fig. 5.9 is the specific heat divided by temperature, C/T , of a pieceof the μSR sample, measured in zero field between 3 and 20 K. A transition temper-

5.3 Muon Spin Rotation and Relaxation 111
Figure 5.8: The dependence of the muon relaxation rate λZ on the reduced temperatureτ = (T −TC)/TC in the paramagnetic state of URhGe (TC = 9.51 (6) K). The initial muonpolarization Sμ(0) was oriented parallel to the a axis. The dashed line is a guide to theeye.
ature of TC = 9.52 K is observed. Linear extrapolation of C/T to zero temperatureyields an enhanced linear electronic specific heat term of γ = 160 mJ/mol·K2. Theseresults are in good agreement with previously published data [163, 167], confirmingthe quality of the sample.
In order to further characterize the spin-lattice relaxation, longitudinal field mea-surements were performed at a fixed temperature close to TC for the two orientationsof Sμ(0) relative to easy magnetic axis c. These measurements give information onthe frequency scale and magnitude of the fluctuations.
In Fig. 5.10 the field dependence of the relaxation rate λZ in the paramagneticstate of URhGe is shown for the case that the initial muon polarization Sμ(0) aswell as the external magnetic field Bext were parallel to the a axis. The temperaturewas equal to T = 9.693 (5) K. The relaxation rate λZ(Bext) is field dependent atextremely small external fields Bext. Within 1 mT λZ(Bext) has reduced to about1/3 of its value in zero field. In the insert in Fig. 5.10 a zoom is given for smallfields. Once λZ(Bext) has dropped sharply, it is very weakly dependent on the field.
Figure 5.11 shows the dependence of the relaxation rate λZ(Bext) on the externallongitudinal magnetic field Bext parallel to the c axis in the paramagnetic state ofURhGe. The temperature was equal to T = 10.46 (1) K. Just like in the previouscase λZ(Bext) shows a sharp decrease to about 1/3 of its initial value for very smallfields. For higher fields λZ(Bext) continues to decrease, but at a lower rate. For fieldsof 10 mT and above the relaxation is λZ(Bext) = 0 μs−1 within the uncertainty.The insert shows that for the whole field range up to 450 mT, λZ(Bext) = 0 μs−1
is obtained within the uncertainty. This is in contrast to the case for Sμ(0) ‖ a

112 URhGe
Figure 5.9: (Above) Muon relaxation rate λZ versus temperature T . The initial muonpolarization Sμ(0) was oriented parallel to the c axis. Note the logarithmic scale. AboveT ∼ 15 K the relaxation rate is constant. The decrease at higher temperatures (T > 200 K)can be attributed to muon diffusion. Below T ∼ 15 K the relaxation increases and showsa maximum at TC = 9.51 (6) K. The solid line below TC is a fit to Eq. 5.6. (Below)Specific heat measured on the same sample. A sharp peak occurs at the same transitiontemperature as in the μSR data.
(Fig. 5.10) where a non-zero relaxation is measured up to 450 mT.
5.3.4 Analysis
Magnetic Field Scans
In order to analyze the data in longitudinal field of Figs. 5.10 and 5.11, a comparisonwith Nuclear Magnetic Resonance (NMR) is made. For this technique it can beshown that the 1/T1 relaxation rate (equal to λZ in μSR) is proportional to the

5.3 Muon Spin Rotation and Relaxation 113
Figure 5.10: Field dependence of the muon relaxation rate λZ in the paramagnetic stateof URhGe (TC = 9.51 K). The initial muon polarization Sμ(0) as well as the externalmagnetic field Bext were parallel to the hard magnetic a axis. The solid line is a fit to thesum of two Lorentzian functions (Eq. 5.5). See the main text for the extracted parameters.The insert shows a zoom at low fields.
Figure 5.11: Field dependence of the muon relaxation rate λZ in the paramagnetic stateof URhGe (TC = 9.51 K). The initial muon polarization Sμ(0) as well as the externalmagnetic field Bext were parallel to the easy magnetic c axis. The solid line is a fit to thesum of two Lorentzian functions (Eq. 5.5). See the main text for the extracted parameters.The insert shows the whole field range. For fields of 10 mT and above λZ = 0 μs−1 isobtained within the uncertainty.

114 URhGe
Table 5.2: Fit parameters, as extracted from a fit of the muon data to Eq. 5.5. Listed arethe field width Δ and the relaxation time τ of the fluctuating field at the muon site in theparamagnetic state of URhGe, close to TC = 9.51 (6) K, for the two different directionsof the initial muon polarization Sμ(0). The parameters of the first Lorentzian differ by afactor 2.5 for the two directions, whereas the second Lorentzian is much more anisotropic.
Sμ(0) ‖ a Sμ(0) ‖ c
Δ (mT) τ (μs) Δ (mT) τ (μs)
1st Lor. 0.048 (3) 3.5 (3) 0.021 (2) 9.0 (1.4)
2nd Lor. 1.2 (2) 0.0022 (6) 0.068 (13) 0.36 (10)
time average of the square of the local field multiplied by the spectral density ofthe field fluctuations at a certain frequency ω. The spectral density has the form ofJ(ω, τc) = τc
1+ω2τ2c
where τc is the correlation time of the fluctuations [180, 181].
In fact this model is a special case of the more general formula in Eq. 5.7 (tobe discussed in the next Section) without imposing ωμ = 0. With the assumptionthat the spectral density is Lorentzian, the q integration can be decoupled fromthe ωμ = γμBext dependence and the same result as for NMR (explained above) isobtained.
The data in Figs. 5.10 and 5.11 suggest there are two independent relaxationchannels. The first contribution can be suppressed in longitudinal fields smallerthan 1 mT for both directions of Sμ(0) with respect to the easy magnetic axis c,whereas the second contribution can be suppressed in fields which are significantlyhigher. Further, the second contribution strongly depends on the orientation of thefield. Therefore, a fit is made to a model of two independent relaxation processes.Each is due to magnetic field fluctuations with a correlation time τi and a timeaveraged square of the local magnetic field Δ2
i . The formula for this model is
λZ(Bext) =2∑
i=1
2 γ2μΔ2
i τi
1 + (γμBext)2τ 2i
(5.5)
where γμ = 851.6 Mrad s−1T−1 is the gyromagnetic ratio of the muon.The extracted values for the field distribution width Δi at the muon site and the
relaxation time τi of the fluctuating field are shown in Table 5.2 for the two differentdirections of Sμ(0) in the paramagnetic state of URhGe. When the parameters ofthe first Lorentzian are compared for the two geometries, it is seen that Δ and τdiffer by a factor 2.5. The second Lorentzian however is much more anisotropic.While Δa
2 and Δc2 differ by a factor of 18, the ratio between τ c
2 and τa2 amounts
to 160.Comparing the two Lorentzian functions per geometry, it is seen that the cor-
relation time for the first component is much larger than for the second one. For

5.3 Muon Spin Rotation and Relaxation 115
Sμ(0) ‖ a, τa1 is of the order of μs, whereas τa
2 is in the ns regime. For Sμ(0) ‖ c thedifference is smaller but still amounts to a factor 25. Looking at the field distribu-tion width Δ, it is seen that Δa
2 is 25 times larger than Δa1 and that Δc
2 is about 3times larger than Δc
1.
Spin-lattice relaxation in the ferromagnetically ordered state
The spin-lattice relaxation λZ(T ) below TC for Sμ(0) ‖ c (Fig. 5.9) can be fitted inthe temperature region 0.6 to 8 K to the empirical logarithmic function
λZ = a + b ln
(T
TC
). (5.6)
The fit yields a = 0.00357 (22) μs−1 and b = 0.00082 (8) μs−1 for TC = 9.51 (6) Kand is shown in Fig 5.9. In the next Section the spin-lattice relaxation λZ(T ) belowTC will be discussed in more detail.
5.3.5 Discussion
In the previous Section two different types of magnetic field fluctuations at the muonsite have been identified, through the signature of their relaxation processes. Onetype is nearly isotropic, has long relaxation times, and causes small fluctuations inthe local magnetic field at the muon site, whereas the other type is highly anisotropic,has short relaxation times, and causes much larger magnetic field fluctuations.
Measurements of the magnetic susceptibility and specific heat in field [163] in-dicate that the magnetic order in URhGe is almost of an easy-plane type, i.e., theanisotropy between the b-c plane and the a axis is large, whereas the anisotropybetween the b and c axes is small. It should however be noted that the sponta-neous magnetic moment below TC is along the c axis. Also, for URhGe the localmagnetic field Bloc at the muon site is parallel to the c axis. With Sμ(0) ‖ Bloc ‖ c,the magnetic excitations along the a and b axes are probed and for Sμ(0) ‖ a themagnetic excitations along the b and c axes are measured. This can be understoodby the consideration of classical Larmor precession, as in Chapter 2: the muon spinis not sensitive to parallel magnetic field fluctuations. It is therefore expected thatλZ(Bext) also shows the anisotropy between the a and c axis. That μSR is capableof measuring the anisotropy of critical magnetic fluctuations, if present, is nicelyshown in the rare-earth compound NdRh2Si2 [144], a uniaxial antiferromagnet. Thevalues of λZ(T ) for Sμ(0) parallel and perpendicular to the easy axis, differ by afactor 100 in the critical regime above TC. In Table 5.2 the anisotropy of URhGe isfound for the second Lorentzian. For the system it is much more difficult to excitea fluctuation along a than along c, giving rise to longer correlation times τ andsmaller field distribution widths Δ for Sμ(0) ‖ c. Although some anisotropy is alsoobserved for by the first Lorentzian in Table 5.2, it is far too small to account for themacroscopically observed anisotropic behavior. The two components are thereforeexpected to have a different origin.

116 URhGe
The present results can be compared to the proposed models, described in theIntroduction. It can be assumed that the ferromagnetism is itinerant in nature [89,90, 91, 92], or localized [100, 101]. Here it is shown that the latter model is ableto explain the μSR data presented in this Chapter. The existence of two subsets ofU 5f magnetism is assumed. The first subset is composed of an itinerant electrondensity with a small, quasi-static, and slowly fluctuating polarization. The secondsubset consists of an electron density localized at the U atoms, resulting in large,anisotropic, and fast fluctuating magnetic moments.
A justification of this model is given by the relaxation times in Table 5.2. Thereare several indications that itinerant magnetic moments fluctuate slower than local-ized ones. The fluctuation rate for itinerant moments with ferromagnetic correlationsis given, in lowest order, by Γ(q) ∝ q [182], or by Γ(q) ∝ q5/2 [27] when dipolarinteractions are taken into account close to TC. When mainly longitudinal fluctua-tions are probed by the muon, Γ(q) is essentially probed at qD [142]. (ComparingFig. 5.8 with Fig. 4.20 shows that this is in fact the case for URhGe.) Since thedipolar interactions in itinerant systems is smaller than in localized systems [142],qD is smaller for itinerant systems than for localized systems. Γ(q) is a growingfunction of q which leads to a smaller value of Γ(q) for itinerant systems than forlocalized systems. That Γ(q) is a growing function of q, is nicely demonstrated byquasi-elastic neutron scattering for UGe2 [149]. These measurements show unam-biguously a growing Γ(q) with increasing q. With τ ∝ Γ−1(q) it follows that thelonger the relaxation time, the more itinerant the magnetism behaves. A heuristicargument for URhGe, in which large electronic correlations are present as indicatedby the large linear electronic term γ in the specific heat, is that correlations tend toslow down the spin dynamics at low temperatures. The large differences in the widthΔ of the fluctuating field at the muon site (Table 5.2) indicate a large difference inpolarization of the two components. Furthermore, the large anisotropy is expectedfor localized moments due to the strongly anisotropic hybridization, whereas bandstructures are usually less anisotropic.
Zwicknagl et al. [183, 184] have developed a theory for the electronic excitationsin UPt3, assuming the localization of two of the 5f electrons and the delocalizationof the remaining 5f electrons. With this dual ansatz the authors could reproduce thede Haas-van Alphen data on UPt3 and UPd2Al3. Furthermore, LDA calculationsshow that the hopping matrix elements for different 5f orbitals vary, leading toa difference in behavior for the 5f electrons in the system. For UPd2Al3 varioustechniques, including photoemission, inelastic neutron scattering, and μSR, indicatethe same dual nature of 5f electrons [156, 157, 158, 185]. Of course, the dual modelshould allow for a rather natural description of heavy-fermion superconductivitycoexisting with 5f magnetism. This has indeed been shown to be the case forUPt3 [183]. The mass enhancements of the quasiparticles are shown to follow fromthe local exchange interaction of the delocalized 5f electrons with localized 5f 2
configurations. The data on URhGe, presented in this Chapter, fit well into thispicture.

5.3 Muon Spin Rotation and Relaxation 117
The present results can be compared to the magnetic form factor of URhGe.These measurements were performed by Prokes et al. using polarized neutron scat-tering at 2 K in a field of 6 T [186]. The recorded flipping ratios could be fitted to theordered moment μ multiplied by the magnetic form factor f(Q) = [〈j0〉 + C2 〈j2〉]where C2 is related to the ratio of the spin and orbital contribution to the magneticmoment, and 〈jn〉 are averages of the spherical Bessel functions jn(Qr) over thesquared radial wave-functions for the unpaired electrons in the atom. Within thedipolar approximation the magnetic form factor agrees well with the theoretical 5fform factors for free U3+ and U4+ ions. Because of the strong similarity betweenthe form factor of both ions it was not possible to distinguish them within errorbars. Moreover, a magnetic moment of 0.41 (1) μB/U was found. This value isfully consistent with magnetic bulk measurements. In summary, polarized neutronmeasurements indicate that the magnetic moments are localized on the U sites andthat a complementary itinerant magnetic moment falls within the uncertainty of thedetermination of μ.
If indeed localized magnetism coexists together with itinerant 5f states with asmall polarization, as strongly suggested by the μSR data presented in this Chapterand supported by polarized neutron scattering, this has implications for the natureof the Cooper pairs in the superconducting state. Assuming an itinerant nature ofthe ferromagnetism, theoretical studies have shown the possibility of spin-triplet su-perconductivity [89, 90, 91, 92]. In this case the electrons forming the Cooper pairsare also responsible for the strong ferromagnetism. Other studies by Abrikosovand Suhl [100, 101], however, have shown that spin-singlet superconductivity is stillfeasible under the constraint that conducting electrons involved in the superconduc-tivity and localized electrons involved in the ferromagnetic order belong to differentsubsets of 5f electrons. The pairing mechanism is then based on the interactionof electron spins via localized magnetic moments. The μSR data presented in thisChapter suggest the latter case of Cooper pairs formed by itinerant electrons coupledby the spin fluctuations of the magnetic U ions.
Measurements of the upper critical field for magnetic fields along the three crys-tallographic axes for a superconducting single crystal of URhGe [177] suggest theexistence of odd-parity, spin triplet superconductivity. This observation would ruleout the mechanism of Abrikosov and Suhl [100, 101]. However, the μSR measure-ments presented in this Section show that it is improbable that the ferromagnetismbelow TC is carried by the same electrons as those forming the Cooper pairs. Furthertheoretical studies are needed to clarify this apparent discrepancy.
A similar μSR study on UGe2 at ambient pressure [134] and at 0.95 GPa (Chap-ter 4) shows the same picture as for URhGe. The relaxation rate λZ just above TC
is suppressed in very small magnetic fields. However, the localized component is notobserved, probably because the fluctuations are too fast (motional narrowing limit).Again, polarized neutron scattering indicates that almost all the magnetism is local-ized at the U atoms. As mentioned earlier, also UPt3 and UPd2Al3 are thought toshow a coexistence of localized magnetism and itinerant 5f states. The conclusion

118 URhGe
drawn in this Chapter might therefore be more general than for URhGe alone.
Spin-lattice relaxation at high temperatures
For a paramagnetic system the static wave vector dependent susceptibility χQ0(q),where Q0 is the wave vector of the magnetic structure, is a key quantity. Note thatfor a ferromagnet Q0 ≡ 0. For temperatures much higher than TC, χQ0(q) becomeswave vector independent (i.e. the pair-correlations are negligible) and shows Curie-Weiss behavior (χ ∝ (T − θCW)−1). In the same limit the linewidth Γ(q) of theparamagnetic fluctuations becomes temperature independent [187] for ferromagnets.Since [143]
λZ ∝∫ ∑
β,γ
Aβγ(q) Λβγ(q, ωμ = 0)d3q
(2π)3, (5.7)
where Aβγ are constants accounting for the coupling between the muon spin andthe spins of the sample and since Λβγ corresponds to:
Λαα(q, ωμ = 0) ∝ kBTχαα(q)
Γα(q), (5.8)
it is easily seen that λZ becomes temperature independent for T θCW for lo-calized as well as for itinerant systems. Note that antiferromagnets maintain thetemperature dependence of Γ(q) and that λZ ∝ T 1/2 for T TN [143, 188].
If the exchange interaction would play an important role at higher temperatures,λZ(T ) would not be temperature independent [143]. For instance, when mainlyantiferromagnetic fluctuations drive the relaxation, λZ(T ) would increase at hightemperatures. If crystal electric field (CEF) effects play a role (i.e. higher CEF en-ergy levels start to get involved in the excitations relaxing the muon spin), λZ wouldshow a significant drop at higher temperatures [189]. (For experimental examples onmuon relaxation rates in systems with CEFs, see Ref. [190].) Therefore, the constantλZ at temperatures up to 200 K indicates that for T TC the spin-correlations arenegligible and that the higher CEF levels are above 200 K. It is most likely that thedrop in λZ at 200 K is due to muon diffusion, because the decrease occurs at thesame temperatures for both directions of Sμ(0).
Spin-lattice relaxation in the ferromagnetically ordered state
In Section 5.3.4 it has been shown that λZ(T ) can be fitted to a logarithmic functionbelow TC. A priori, two possible sources of relaxation contribute to λZ : magnons(spin wave excitations of the ordered part of the magnetic moment) and magneticfluctuations (unordered part of the magnetic moments). For magnons with a simpleferromagnetic dispersion relation �ωq = Dmq2+Δ, where Dm is the magnon stiffnessconstant and Δ the anisotropy energy, it can be shown that [191]
λZ ∝ T 2 ln
(kBT
Δ
). (5.9)
5.3 Muon Spin Rotation and Relaxation 119
This equation is only valid for ferromagnets with small anisotropy, i.e. Δ � kBT .The T 2 ln T behavior is nicely demonstrated for the rare-earth compound GdNi5 [18].Clearly, for URhGe λZ(T ) does not show this T 2 ln(T ) behavior. The contributionof the magnetic fluctuations should be further investigated in order to explain theempirical λZ(T ) = a + b ln(T/TC) behavior, e.g. by magnetic field scan in theferromagnetic state. At this stage, a mathematical derivation of this behavior andthe contribution of magnetic spin fluctuations to λZ(T ) is unknown.
Extrapolation of the fit to Eq. 5.6 in Fig. 5.9 to λZ = 0 yields a temperature ofT = 0.12 K. This would implicate that temperatures lower than 0.12 K correspond toenergies too small to excite magnetic fluctuations. This may indicate the existenceof a gap in the fluctuation spectrum
Spin-lattice relaxation at the lowest temperature
In Fig. 5.9 it is seen that below 0.6 K the relaxation λZ(T ) increases with decreas-ing temperature. The limited number of data points showing this trend prohibitsdrawing strong conclusions. Clearly, more research is needed to provide a startingpoint of understanding the spin dynamics in URhGe at the lowest temperatures.
Assuming the increase is not an artefact, e.g., a change in background due to the3He cryostat, the result could be very interesting. Below Ts ∼ 0.3 K superconduc-tivity sets in [2]. The glue between the electrons forming Cooper pairs, is thoughtto be ferromagnetic fluctuations. It is therefore necessary that λZ �= 0, which isshown by the data. Possibly, the increase of λZ(T ) with decreasing temperaturecould even enhance the attractive forces that bind electrons into a pair, since thefluctuations get larger. This conjecture and the confirmation of the upturn of λ(T )can be verified by additional experiments at temperatures below 0.3 K.
5.3.6 Conclusions
In this Section μSR data on URhGe have been presented. Field scans in the para-magnetic state clearly show two different magnetic contributions, which can be iden-tified as localized and itinerant magnetism. This fact strongly suggests that the 5felectrons responsible for both magnetic order and superconductivity do not par-ticipate in both phenomena simultaneously but are separated either in real spaceand/or in reciprocal space, i.e. different parts of the Fermi surface.

120

CHAPTER 6
URh1−xRuxGe
6.1 Introduction
ecently, URhGe has attracted significant attention because ferro-magnetism (Curie temperature TC = 9.5 K) and superconductivity(Ts = 0.25 K) were found to coexist at ambient pressure [2]. The su-perconducting state is believed to have its origin in the proximity to aferromagnetic instability: near the quantum critical point (QCP) en-hanced ferromagnetic spin fluctuations would mediate spin-parallel
Cooper pairing. The QCP is reached when TC is tuned to TC = 0. That magneticfluctuations play an important role, is indicated by the field-induced superconduc-tivity found in URhGe for a magnetic field of 12 T along the b-axis [173]. At this fielda spin reorientation takes place and magnetic fluctuations reappear. It is thereforeof interest to establish how far URhGe is from the QCP and to study these fluctua-tions in the vicinity of the QCP. In the vicinity of this point the Fermi liquid theorybreaks down and new physics is expected to manifest itself (non-Fermi liquid physics(NFL)). An enhanced Sommerfeld coefficient (linear term in the electronic specificheat) of γ = 160 mJ/mol K2 and a small ordered magnetic moment of ∼ 0.4 μB/U-atom indicate that URhGe is close to a quantum phase transition. In the groupof UTGe compounds, with T a transition metal, URhGe is surrounded by para-magnetic compounds (UCoGe and URuGe) and magnetically ordered compounds(UIrGe and UPdGe) [161].
Unlike UGe2 [1] and UIr [3], neither hydrostatic pressure (up to 13.0 GPa) noruniaxial pressure is effective in tuning URhGe to a quantum critical point, as pres-sure enhances TC [192, 176]. TC can be reduced by appropriate chemical substi-tutions, but it is clear that these substitutions reduce the mean free path of theelectrons and thereby destroy the superconductivity. However, the magnetic fluc-tuation spectrum is generally less sensitive to the crystal quality. Chemical substi-

122 URh1−xRuxGe
tution leads to a loss of translational symmetry, but this does not necessarily in-hibit quantum critical behavior, as demonstrated in, e.g., the substitutional systemCeCu6−xAux [53]. This opens up the possibility to study a ferromagnetic quantumcritical point in chemically substituted URhGe. For other examples of materials thatexhibit non-Fermi liquid behavior induced by chemical substitution, see Ref. [193].
In principle, one has the choice of substituting any of the three elements U,Rh, or Ge by another element. U is the only magnetic ion in the compound andsubstituting U by, e.g., Th, would result in a decrease in the number of magnetic 5fions in the system. One would rather like to alter TC in a way which has the sameunderlying mechanism as external pressure, namely tuning the lattice parametersand the f -ligand hybridization (either the f -d or f -p hybridization). This is achievedby substituting Rh (f -d) or Ge (f -p).
The choice of elements to substitute on the Rh site with the aim to reduce TC
is limited [161, 172]. UPdGe is a ferromagnet with TC = 30 K and therefore thesubstitution of Rh by Pd is not expected to decrease TC. UNiGe, UPtGe, andUIrGe are antiferromagnets. It has been shown by Chevalier et al. [171] that inthe URh1−xIrxGe series a sudden transition occurs from a ferromagnetic to an an-tiferromagnetic ground state near x = 0.45 − 0.50. Introducing T = Ni, Pt, orIr is therefore expected to introduce competing antiferromagnetic correlations inU(Rh,T )Ge. UFeGe is not isostructural to URhGe, unlike the aforementioned com-pounds. A structural transition is therefore expected at a certain Fe concentration.Since URuGe and UCoGe are both paramagnetic and isostructural to URhGe, itwas decided to investigate the effect of substituting Rh by Ru and Co.
A similar screening can be made for substitution on the Ge site. URhSi andURhSn have TC = 9.5 K and TC = 16.5 K, respectively. Chemical substitution ofGe for Si or Sn is not expected to decrease TC. A few samples were prepared tocheck this expectation for URhGe1−xSix.
It should be noted that chemical substitution of Rh and Ge by Co or Si, re-spectively, is isoelectronic. Hence there will only be an effect because of the sizedifference. In the case of substitution of Rh by Ru, however, there is also a changein valence changes since Ru has one electron less than Rh. In this case both sizeand valence will influence the hybridization.
A comparison of the lattice parameters a, b, and c and the unit-cell volume Vfor the systems of interest is made in table 6.1. The UTSi and UTGe compoundswere first reported to crystallize in the CeCu2 crystal structure (space group Imma)in which U occupies the Ce position and T and Si or Ge are randomly distributedover the Cu sites. Later, a careful analysis of neutron and X-ray diffraction datahowever indicated the TiNiSi structure (space group Pnma) [161, 162]. The TiNiSistructure is the ordered variant of the CeCu2 structure where T and Si or Ge occupyinequivalent positions. To enable a straightforward comparison of lattice constantsmeasured by different authors the TiNiSi notation will be used in table 6.1, i.e., aand b are interchanged with respect to the CeCu2 notation.
URhGe has the largest unit-cell volume V , followed by URuGe and URhSi.

6.1 Introduction 123
Table 6.1: Lattice parameters a, b, c, unit-cell volume V , and some magnetic proper-ties of URhGe, URuGe, UCoGe, and URhSi. The lattice parameters are determined atroom temperature, except in Ref. [194], where they were determined at 80 K. The TiNiSistructure notation is used, i.e. a and b are interchanged with respect to the notation inthe CeCu2 structure. See the main text for details. γ is the coefficient of the electronicspecific heat, TC the Curie temperature, and μS the ordered magnetic uranium moment.WTDP stands for weakly temperature dependent paramagnet and PM for paramagnet.
Ref. a b c V γ TC μS
(A) (A) (A) (A3) (mJ/mol·K2) (K) (μB)
URhGe [2] 9.5 0.42[161] 6.898 4.340 7.536 225.61[167] 164 9.6[195] 6.876 4.333 7.513 223.84[163] 6.875 4.331 7.508 223.56 155 9.6 0.35
URuGe [172] 6.678 4.359 7.539 219.46 WTDP -[170] 35 WTDP -[196] 6.687 4.343 7.559 219.53 WTDP -
UCoGe [172] 6.843 4.205 7.227 207.96 PM -[170] 65 PM -[197] 6.852 4.208 7.226 208.34 46 ?
URhSi [194] 6.986 4.113 7.427 213.40 180.9 9.5[196] 7.023 4.121 7.458 215.85 9.5 0.11[162] 7.002 4.121 7.451 215.00 0.50
UCoGe has by far the smallest V . Chemical substitution of Rh by Ru mainly affectsthe a-axis, whereas substitution by Co affects the b and, primarily, the c-axis. Withthe introduction of Si the a-axis increases and the b- and c-axes decrease.
Some magnetic properties are listed in table 6.1 as well. URhGe and URhSi havethe same Curie temperature of 9.5 K. URuGe is a weakly temperature dependentparamagnet. Measurements down to 1.2 K suggest that UCoGe is a paramagnet aswell, although Canepa et al. [197] reported TC = 46 K, deduced from resistivity data.Magnetization measurements at low temperatures in fields up to 35 T, suggest thatUCoGe is relatively close to ferromagnetic order, because data taken on a powdersample show, compared to other paramagnetic systems like URuGe, a relativelylarge field-induced magnetic moment (0.58 μB/f.u. at 35 T) [170]. URhGe andURhSi have relatively high γ values, whereas UCoGe and URuGe have moderateones.
In this paper, dc magnetization measurements performed on the three seriesURh1−xRuxGe, URh1−xCoxGe, and URhGe1−xSix are reported. It was found thatsubstitution by Co leads to an increase of TC up to TC = 20 K for x = 0.60, beyondwhich TC drops to 0 for x close to 1. Samples in which Ge is chemically substituted

124 URh1−xRuxGe
by Si did not show any change in TC up to x = 0.20. The U(Rh,Ru)Ge system,however, does show a complete suppression of the ferromagnetism for low x. Afteran initial increase, TC decreases linearly and vanishes at a critical Ru concentrationof xcr ≈ 0.38, suggesting a quantum critical point. The U(Rh,Ru)Ge system isinvestigated further by electrical resistivity, X-ray powder diffraction, specific heat,and magnetization under hydrostatic pressure to study the role of the f -ligandhybridization in decreasing TC and to look for possible non-Fermi liquid behavioras the quantum critical point is approached. A brief preliminary account of theseresults was reported in Ref. [198].
6.2 Experimental
Polycrystalline samples of U(Rh,Ru)Ge, U(Rh,Co)Ge, and URh(Ge,Si) with Ru,Co, and Si concentrations x of 0.0 ≤ x ≤ 1.0 were prepared by arc melting theconstituents U, Rh, Ru, Co (all 3N purity) and Ge (5N) under a high-purity argonatmosphere. Each sample was melted several times and turned over after each meltto improve the homogeneity. The as-cast buttons were wrapped in Ta foil and putin quartz ampoules together with a uranium getter. After evacuating and sealingthe quartz ampoules, the samples were annealed for ten days at 875 ◦C. The single-phase nature of the samples was checked by electron probe micro-analysis (EPMA)and by X-ray powder diffraction. The X-ray diffraction patterns and the EPMAmeasurements showed no signs of impurity phases within the resolution of less than5 vol.% and 2 vol.%, respectively.
The dc magnetization at ambient pressure was measured in a MPMS XL-5 Quan-tum Design SQUID magnetometer. Temperature scans were performed between 1.8and 20 K in a field of 0.01 T and between 2 and 300 K in a field of 1 T. In both casesthe samples were zero-field cooled. Field scans of the magnetization were made infields up to 5.5 T at several temperatures.
Magnetization measurements at a pressure of 0.43 GPa were performed using anOxford Instruments MagLab vibrating sample magnetometer (VSM). The pressureclamp cell was made of Cu alloyed with Be. Temperature scans were made in fieldsof 0.01 T and 1 T. Magnetic field scans were performed in fields up to 12 T at sev-eral temperatures. The pressure was determined by measuring the superconductingtransition temperature Ts of a piece of lead inside the pressure cell (Ts = 7.2 K atambient pressure). The pressure transmitting medium was a mixture of methanoland ethanol (1 : 4).
Electrical resistivity, ρ(T ), measurements were performed using a standard fourprobe ac technique in zero field from 2 to 300 K in a MagLab system of OxfordInstruments.
X-ray diffraction measurements at room temperature were performed using aBruker D3 Advance X-ray diffractometer with Cu-Kα radiation. Powders made fromthe polycrystalline samples were covered by Kapton foil to prevent contamination.Rietveld analysis of the diffraction data was performed using the GSAS program [38].

6.3 Results 125
Figure 6.1: Temperature dependence of the dc magnetization of URh1−xRuxGe for vari-ous values of x. The samples were zero-field cooled and measured in a field of 0.01 T. Thelower part of the figure shows the derivative of the magnetization. Note that the x = 0.10sample has a higher TC than the pure URhGe sample.
The specific heat Cp(T ) was measured using the semi-adiabatic method in com-bination with a mechanical heat switch in a 3He cryostat. The mass of the samplesamounted to 3 - 4 grams.
6.3 Results
6.3.1 Magnetization at ambient pressure
The influence of the chemical substitution of Rh by Ru on the Curie temperatureTC was studied by dc magnetization M(T ) at ambient pressure. The results areshown in Fig. 6.1. Also shown, in the lower part of the figure, is the derivativedM(T )/dT . TC is defined as the temperature at which dM(T )/dT has a minimum.The magnetization was measured after zero-field cooling in a small field of 0.01 T,because a larger field will move the inflection point (dM(T )/dT )min to higher tem-peratures [163] and bias the determination of TC. On the other hand, a small fieldof 0.01 T will most probably not significantly expel the magnetic domains when thesample is zero-field cooled.
In addition to M(T ), the magnetization as a function of magnetic field M(B) hasbeen measured up to 5.5 T at several fixed temperatures. From these measurementsArrott plots are derived. In Fig. 6.2 the results for x = 0.25 are shown as anexample. The Curie temperatures deduced from the Arrott plots agree very well

126 URh1−xRuxGe
Figure 6.2: Arrott plots (M2 versus μ0H/M) of the magnetization of URh1−xRuxGewith x = 0.25 measured between T = 2 and 14 K. The isotherm through the origindetermines TC = 6 K.
with the temperature at which (dM(T )/dT )0.01T is minimum.It is clearly seen in Fig. 6.1 that the pure URhGe compound has a TC of about
9.6 K, in accordance with the literature value [2]. When Rh is chemically substitutedwith a small amount of Ru, TC of URh1−xRuxGe shifts upwards to 10.4 K forx = 0.10. Subsequently, there is a monotonic decrease of the Curie temperature forincreasing x. At x = 0.15, TC has reached roughly the same value as for x = 0. Forthe samples with x = 0.35, 0.375, 0.40, and 0.60 no transition was observed in themeasured temperature range (T > 1.8 K). However, the Arrott plots (not shown)clearly indicate a paramagnetic ground state for x = 0.40 and 0.60, whereas theydo suggest ferromagnetism for x = 0.35 below TC ≈ 1.3 K. This is estimated byextrapolating the points of intersection of the Arrott isotherms for temperaturesabove T = 1.8 K with the horizontal μ0H/M axis.
Figure 6.1 indicates that for increasing Ru concentrations the transition broad-ens. The peak in (dM(T )/dT ) looses height but gains in width, indicating an in-crease in disorder caused by chemical substitution. X-ray measurements (Sec. 6.3.3)clearly indicate a single-phase structure. A variation in the local Ru concentrationx can therefore only exist on an atomic scale. A higher annealing temperature couldpossibly sharpen the transition.
In Fig. 6.3 the temperature dependence of the reciprocal susceptibilities is shownfor the URh1−xRuxGe series. The susceptibility is measured in a field of 1 T. Thetemperature dependence of the reciprocal susceptibility of metallic compounds nor-mally exhibits deviations from the linear Curie-Weiss behavior, which can be ac-counted for by fitting the data to the modified Curie-Weiss (MCW) law χ(T ) =C/(T − θ)+χ0, where χ0 represents a temperature-independent contribution. How-

6.3 Results 127
Figure 6.3: Inverse susceptibility 1/χ of URh1−xRuxGe as a function of temperature ina field of 1 T for different values of x.
ever, in polycrystalline samples of materials with strongly anisotropic magnetic prop-erties pronounced deviations from the MCW behavior are often observed. Therefore,no attempt was made to model the susceptibility with the MCW law. Note thatfor single crystals of URhGe the susceptibility does follow a MCW behavior withθ ≈ TC, as demonstrated in Ref. [2] for the easy-axis susceptibility.
In Fig. 6.4 the magnetization measured in 0.01 T as a function of temperatureis shown for the URh1−xCoxGe series. The Curie temperatures as deduced from(dM(T )/dT )min agree with those deduced from Arrott plots. Figure 6.5 shows theresults for x = 0.60 as an example. TC increases monotonically up to 20 K forx = 0.60. For higher values of x, TC decreases and vanishes somewhere betweenx = 0.90 and x = 1.0.
As in the case of Ru-substitution the transition broadens, probably due to thevariation on the atomic scale of the Rh and Co concentrations. If this is the case, oneexpects an equal width of the dM/dT peak at TC for two compounds symmetricwith respect to x = 0.50, since compounds with this substitution concentrationhave the highest degree of disorder. In fact, after vertical scaling and horizontaltranslation the peaks for x = 0.40 and x = 0.60 are indeed identical. The decreaseof the measured magnetization is probably caused by a smaller ordered magneticmoment. Susceptibility measurements in 1 T (see Fig. 6.6) indicate a smaller orderedmagnetic moment for x = 0.60 than for x = 0.40.
In Fig. 6.7 the magnetization measured in 0.01 T as a function of temperatureis shown for the URhGe1−xSix series. The Curie temperatures as deduced from(dM(T )/dT )min agree with those deduced from the Arrott plots. Figure 6.8 showsthe Arrott plots for x = 0.20. TC remains constant up to x = 0.20. The transitionseems to be slightly broadened for x = 0.20, compared to x = 0, as in the case of

128 URh1−xRuxGe
Figure 6.4: Temperature dependence of the dc magnetization of URh1−xCoxGe for vari-ous values of x. The samples were zero-field cooled and measured in a field of 0.01 T. Thelower part of the figure shows the derivative of the magnetization.
Figure 6.5: Arrott plots (M2 versus μ0H/M) of the magnetization of URh1−xCoxGewith x = 0.60 measured between T = 4 and 22.5 K. The isotherm through the origindetermines TC = 20 K.

6.3 Results 129
Figure 6.6: Inverse susceptibility 1/χ of URh1−xCoxGe as a function of temperature ina field of 1 T for different values of x.
substitution of Rh by Ru. However, the peak in dM/dT for x = 0.20 is also higherthan for x = 0. Vertical scaling shows that the peaks are in fact equally sharp.Here the same is true as for substitution by Co. The ordered magnetic moment at2 K in 1 T (Fig. 6.9) for x = 0.20 is larger than for x = 0. In summary, chemicalsubstitution of Ge by Si up to x = 0.20 tends to enhance the ordered magneticmoment, but does not significantly change TC. Note that this seems to indicate thatin table 6.1 the value of μs taken from Ref. [162] is more reliable than the valuereported in Ref. [196].
6.3.2 Electrical resistivity
The URh1−xRuxGe series is further investigated by measuring the temperature de-pendence of the electrical resistivity ρ(T ). In Fig. 6.10 the low-temperature ρ(T )is shown for URhGe. Also shown is the derivative dρ/dT . The Curie temperatureTC is defined as the intercept of the linear fits above and below TC. For URhGeTC = 9.4 K is obtained, in agreement with the magnetization results. Some authorsdefine TC differently, i.e. as the inflection point of the sharp increase in dρ/dTaround TC, yielding a slightly higher value for TC. The absolute values of ρ(T ) re-ported here are somewhat smaller than the ones found by Tran and Troc [168] forpolycrystals, but somewhat larger than reported by Prokes et al. for a single crys-tal [163]. The residual resistance ratio (RRR) for the URhGe sample is 6, whereasfor all the measured chemically substituted samples RRR ≈ 2 is obtained.
In Fig. 6.11 the temperature dependence of the electrical resistivity ρ(T ) forU(Rh,Ru)Ge is shown. In the high-temperature region ρ(T ) increases with de-creasing temperature. At lower temperatures, the increase gradually changes to

130 URh1−xRuxGe
Figure 6.7: Temperature dependence of the dc magnetization of URhGe1−xSix for variousvalues of x. The samples were zero-field cooled and measured in a field of 0.01 T. Thelower part of the figure shows the derivative of the magnetization.
Figure 6.8: Arrott plots (M2 versus μ0H/M) of the magnetization of URhGe1−xSix withx = 0.20 measured between T = 2 and 14 K. The isotherm through the origin determinesTC = 9.5 K.

6.3 Results 131
Figure 6.9: Inverse susceptibility 1/χ of URhGe1−xSix as a function of temperature in afield of 1 T for different values of x.
Figure 6.10: Low temperature part of the electrical resistivity ρ(T ) of URhGe and thederivative dρ/dT . The construction to determine TC is shown.
a decrease, for different concentrations x at different temperatures, leading to abroad maximum. For URhGe it is seen that at TC there is a sharp drop, causedby a decrease in spin-disorder scattering. For x > 0, the transition becomes lesspronounced, in agreement with the magnetization data. Arrows indicate the Curietemperatures determined as mentioned above. For x ≥ 0.35 no transition was foundin the measured temperature range.
Below TC, ρ(T ) follows the behavior ρ0 + AT n. In table 6.2, values found forρ0, A, and n are listed for a few samples. The fitting region is 2 K < T < 6.5 K.

132 URh1−xRuxGe
Figure 6.11: Temperature dependence of the electrical resistivity ρ measured onURh1−xRuxGe for various values of x. The Curie temperatures determined from themagnetization data are indicated by an arrow.
Since the parameters have been determined over a rather small T interval, thevalues are not very precise. However, it is possible to look for trends. The residualresistivity ρ0 increases with increasing x reflecting the atomic disorder caused bythe Ru substitution. The exponent n also increases with increasing x, and attainsvalues close to the Fermi-liquid value n = 2. Above the critical concentration analmost linear temperature dependence of ρ(T ) is found with n = 1.19. A similarbehavior is reported for UIr [199]. In order to investigate the full x-dependence of
Table 6.2: Obtained fitting values of the low-temperature electrical resistivity to theexpression ρ = ρ0 + ATn for a few samples. The fitted temperature range is 2 K < T <6.5 K. Since the parameters have been determined over a rather small T interval, thevalues are not very precise.
x = 0 x = 0.10 x = 0.15 x = 0.20 x = 0.60
ρ0 (μΩ cm) 76.5 368.1 299.8 416.5 472.5A (μΩ cm/Kn) 6.9 1.85 0.90 0.51 3.36
n 1.94 2.10 2.18 2.41 1.19

6.3 Results 133
Figure 6.12: Lattice parameters a (•), b (�), and c (�) of URh1−xRuxGe as a functionof the Ru concentration x determined by X-ray powder diffraction at room temperature.The lines are fits to the data. It is clearly seen that substitution of Rh by Ru mainlyaffects the a-axis, whereas the b-axis can be considered to be constant.
n, experiments at lower temperatures (T < 2 K) are obviously required.
6.3.3 X-ray powder diffraction
Since URhGe and URuGe are isostructural but do not have the same unit-cell di-mensions (the unit-cell volume of URuGe is slightly smaller), it is interesting tocompare the volume effect of Rh substitution by Ru and of external pressure. Espe-cially the x = 0.10 sample could give valuable information about the nature of themechanism leading to the observed increase of TC. For this purpose X-ray powderdiffraction measurements have been performed at room temperature on some of thesamples.
The X-ray data confirm the orthorhombic Pnma structure of URhGe and showthe same structure for URh1−xRuxGe for all x > 0 measured. The deduced lat-tice parameters are shown in Fig. 6.12. No secondary phase was observed withinexperimental uncertainty. Note that the relative scales on the left-hand side aswell as on the right-hand side in Fig. 6.12 are equal. It is clear that the a-axisis by far most affected by the substitution of Rh by Ru. The c-axis shows aslight increase with increasing x, whereas the b-axis remains practically constant.A linear fit describes the data well and shows that the lattice parameters of theURh1−xRuxGe series follow Vegard’s law [200]. The a-axis can be described bya = (6.887 (3) − 0.217 (8) · x) A, the b-axis by b = (4.334 (1) − 0.010 (3) · x) A, andthe c-axis by c = (7.513 (2)+0.031 (5)·x) A. This leads to a unit-cell volume which islinear in x well within experimental uncertainty: V = (224.25 (13)−6.66 (34) ·x) A3.

134 URh1−xRuxGe
The value for URhGe (x = 0) agrees with literature (table 6.1). The extrapolatedvalue for URuGe, V = 217.59 A3 for x = 1, is slightly smaller than found in table 6.1,but compares well with literature values as well.
Although substituting Rh by Ru mainly affects the a-axis, the reduction of thenumber of d-electrons and the substitution by a slightly smaller atom also affects thehybridization and thereby the magnetic properties. This will be further elaboratedon in the discussion (Sec. 6.4).
Concerning the TC maximum around x = 0.10. As can be seen in Fig. 6.12, thelattice parameters of URh1−xRuxGe show no special feature around x = 0.10 withinthe experimental error. Likewise, the X-ray data do not show any anomaly in thelattice parameters in the region around x = xcr = 0.38.
6.3.4 Specific heat
In the investigation of enhanced magnetic correlations as a quantum critical pointis approached, knowledge of the linear electronic specific heat coefficient at lowtemperatures, γ, is essential. In Fig. 6.13 the temperature dependence of the specificheat divided by temperature (Cp/T ) in zero field is shown for a few characteristicsamples of the URh1−xRuxGe series. Note the logarithmic temperature axis.
For temperatures above ∼ 20 K, the curves coincide. In this region, the specificheat is dominated by the phonon contribution. Fits to the equation C/T = γ +β T 2
for temperatures between T = 15 and 22 K lead to β = 0.60 (1) mJ/mol K4 forall values of x. From this value of β a Debye temperature θD of about 210 K isobtained, in accordance with the value obtained by Prokes et al. [163]. Values forγ range from 115 (3) mJ/mol K2 for x = 0 to 91 (3) mJ/mol K2 for x = 0.50. Thefit has been restricted to temperatures below 22 K because above this temperaturethe C/T curves start to deviate from the T 2 dependence. For temperatures up to40 K (the highest temperature measured) no indication of crystal field effects wasobserved.
Below ∼ 15 K short-range magnetic correlations start to play a role. At lowertemperatures, a pronounced peak is observed, indicating the ferromagnetic transi-tion. For x = 0, a Curie temperature of 9.5 K is obtained. The compound withx = 0.10 has a slightly higher TC. For x > 0.10, TC drops. For x = 0.38 and 0.50,no peak is observed down to the lowest temperature. The deduced Curie tempera-tures are consistent with the magnetization and electrical resistivity data. Also, thetransition broadens, as it has been shown before for magnetization and resistivitydata.
Note that the temperature dependence of the magnetic specific heat for 0 < T <TC changes from character in the case of chemical substitution. For URhGe it isfound that Cp = γT + AT 3/2, where the second term (a power law) corresponds tothe contribution of ferromagnetic spin waves [65]. For finite x the spin-wave termbecomes exponential, indicating the opening of a gap in the spin-wave excitationspectrum [65]. A detailed analysis will be published elsewhere [201].

6.3 Results 135
Figure 6.13: Specific heat divided by temperature (C/T ) of URh1−xRuxGe as a functionof temperature for various values of x. Note the logarithmic horizontal scale. The solidline is a fit to C/T = −b ln (T/T0).
The most interesting information is found at the lowest temperatures. For pureURhGe, a linear electronic coefficient of γ = 167 mJ/mol K2 is found, consistentwith literature (see table 6.1). As x is increased, γ decreases. For x = 0.10, γ =136 mJ/mol K2; for x = 0.15, γ = 127 mJ/mol K2; for x = 0.20, γ = 136 mJ/mol K2;for x = 0.50, γ = 181 mJ/mol K2. The compound with the concentration x =0.38 shows non-Fermi-liquid behavior. This confirms that xcr = 0.38 is the criticalconcentration as deduced previously from the magnetization measurements. A lineardependence of C/T on ln T is found in the temperature region between 0.57 K and2 K: C/T = −b ln (T/T0) with b = 0.061 J/mol K2 and T0 = 46 K.
6.3.5 Magnetization under pressure
The purpose of measuring magnetization under pressure on compounds with oneelement substituted for another, is twofold. First of all, one may obtain the pres-sure dependence of TC for the chemically substituted compound. This value can

136 URh1−xRuxGe
Figure 6.14: Arrott plots (M2 versus μ0H/M) of the magnetization of URh1−xRuxGewith x = 0.325 measured between T = 1.88 and 5.0 K at a pressure of p = 0.43 GPa. Theextrapolated isotherm through the origin determines TC = 2.8 K.
be compared to the (hydrostatic) pressure dependence of the pure compound. Sec-ondly, the data might separate the two contributions leading to the change in TC:the hybridization dependence on volume and on the number of electrons in the d-band. Combined concentration/pressure experiments have been carried out on, e.g.,CeCu6−xAux [53].
A pressure of 0.43 GPa was applied to URh0.675Ru0.325Ge which is close to thequantum critical point, with TC = 2.8 K at ambient pressure (see figure below).In Fig. 6.14 the Arrott plot is shown, constructed from the magnetization measure-ments M(T ). Although field sweeps were performed up to 12 T, here only the (mostinteresting) low-field part is shown. The data have been corrected for the contribu-tion of the Cu-Be pressure cell. Unfortunately the curves do not continue down toμ0H/M = 0, because for low fields the measurements were disturbed by the signalof the piece of lead used for the pressure determination.
Linear extrapolation of the curves to lower values of μ0H/M unmistakably showsthat the T = 2.6 K curve intersects the M2 axis, the T = 3.0 K curve the μ0H/Maxis, and the T = 2.8 K curve passes through the origin (within uncertainty),indicating that TC = 2.8 K. This value is the same as for ambient pressure. Itis remarkable that a pressure of 0.43 GPa does not alter the Curie temperature,especially since the compound is close to a quantum phase transition. In Ref. [176]it is shown that dTC/dp ≈ 0.065 K/kbar for URhGe, when fitting TC(p) with alinear function over the whole pressure range up to 14.0 GPa, whereas dTC/dp =0.119 (6) K/kbar is found by dilatometry as the pressure dependence for p → 0 [192].

6.4 Analysis and Discussion 137
A pressure of 0.43 GPa would thus lead to an enhancement ΔTC in the range 0.28−0.51 K in URhGe. However, ΔTC is essentially negligible for URh0.675Ru0.325Ge.The apparent strong dTC/dp dependence on Ru substitution should be checked forother values of x.
In addition it should be mentioned that in a field of 1 T and at 2.5 K (thelowest temperature measured in 1 T) a moment of M = 0.065 μB/f.u. is found atp = 0.43 GPa. This can be compared to the larger value of M = 0.078 μB/f.u.observed in the same field at ambient pressure.
6.4 Analysis and Discussion
Ru substitution
The main results for the Ru-substitution are reported in Fig. 6.15a, where the Curietemperature TC of the URh1−xRuxGe series is shown as a function of Ru concen-tration x, deduced from the magnetization and electrical-resistivity measurements.The values of TC obtained by both techniques are equal within the experimentalerror and coincide with specific-heat results.
For the pure URhGe sample TC = 9.5 K is found, in agreement with the literaturevalue [2]. Remarkably, when substituting small amounts of Rh by Ru, the Curietemperature shows an initial increase up to 10.5 K for x = 0.10. At higher Ruconcentrations TC is reduced and a linear decrease with a slope of −0.43 K/at.% Ruis observed from x = 0.20 onwards. For samples with x = 0.35, 0.375, 0.40, and 0.60no ferromagnetism was detected in the measured temperature interval (T > 1.8 K).The Arrott plots clearly indicate a paramagnetic ground state for x = 0.40 and 0.60.Extrapolation of the Arrott plots for the x = 0.35 sample suggest that TC ≈ 1.3 K(indicated in the figure by a filled square). This is consistent with the linear decreaseof TC. A linear extrapolation of TC(x) leads to a critical concentration for thesuppression of ferromagnetic order xcr ≈ 0.38. This is confirmed by the non-Fermi-liquid behavior observed in the specific heat for x = 0.38 (Fig. 6.13).
In Fig. 6.15b the Ru concentration dependence x of the specific heat divided bytemperature, C/T , at 0.6 K is shown as well as the literature value of the Sommer-feld coefficient γ for URuGe (see table 6.1). Clearly there is a minimum at x = 0.15.This is consistent with the initial increase of TC. At x = 0.38, C/T (0.6 K) is twiceas high as for x = 0.15, followed by a decrease up to x = 0.50. This indicatesthat as the critical concentration is approached, magnetic correlations tend to be-come stronger. (Note that while the data do suggest a maximum of C/T near thequantum critical point, the exact form is speculative at this point.) In fact, rhelow-temperature part for x = 0.38 can be fitted to the non-Fermi-liquid functionC/T = −b ln (T/T0) with T0 = 46 K. This is exactly the function predicted by Mil-lis [82] for a three dimensional ferromagnet at the quantum critical point. Here T0
is the spin-fluctuation temperature, i.e. a measure of the strength of the magneticinteractions. Specific-heat measurements on U(Rh,Ru)Ge compounds with x close
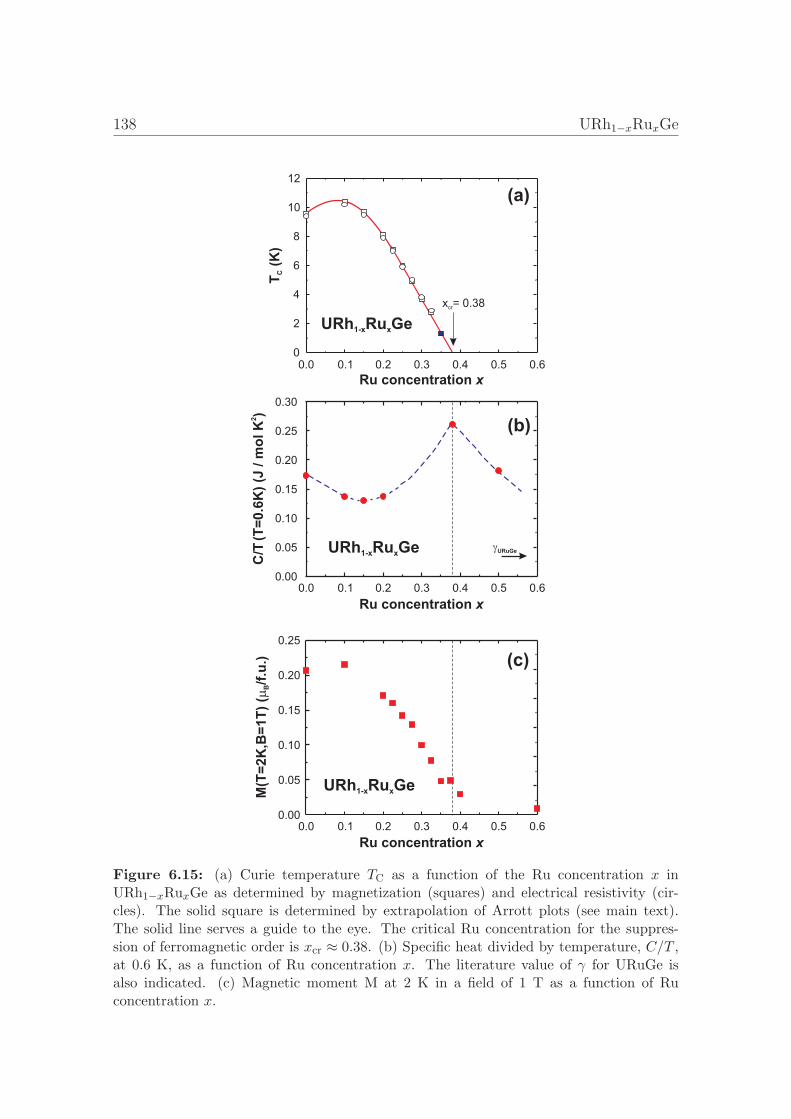
138 URh1−xRuxGe
Figure 6.15: (a) Curie temperature TC as a function of the Ru concentration x inURh1−xRuxGe as determined by magnetization (squares) and electrical resistivity (cir-cles). The solid square is determined by extrapolation of Arrott plots (see main text).The solid line serves a guide to the eye. The critical Ru concentration for the suppres-sion of ferromagnetic order is xcr ≈ 0.38. (b) Specific heat divided by temperature, C/T ,at 0.6 K, as a function of Ru concentration x. The literature value of γ for URuGe isalso indicated. (c) Magnetic moment M at 2 K in a field of 1 T as a function of Ruconcentration x.

6.4 Analysis and Discussion 139
to the critical value should yield important information about the evolution fromFermi-liquid to non-Fermi-liquid behavior.
In Fig. 6.15c the magnetization at 2 K in a field of 1 T is shown as a functionof Ru concentration x. Clearly it has a similar dependence on x as TC, as expected.First an increase of M is observed, followed by a decrease for x > 0.10. Around xcr
a little hump is present in M(2 K, 1 T, x). It might be possible that this hump isthe signature of the critical point in fact being first order. For ZrZn2 a first ordertransition is signalled at the critical pressure by a jump in the Curie temperature TC
as well as in the magnetization M with increasing pressure p [61]. A similar anomalyin the magnetization M is observed for UGe2 [114]. Unfortunately, the number ofdata points in the vicinity of xcr is too limited to draw definite conclusions on thenature of the transition at the critical point for URh1−xRuxGe at this stage.
The suppression of magnetism in 4f -electron metals close to an electronic insta-bility is often discussed in terms of a simple Doniach picture [48], i.e., the compe-tition between the on-site Kondo interaction and inter-site RKKY interaction. Thecontrol parameter - the exchange interaction J - increases with increasing hybridiza-tion. For weak hybridization, i.e. low Kondo temperature, the RKKY interaction isfavored, while a large J favors the nonmagnetic Kondo-singlet ground state. Hencethe generic TC(p) passes over a maximum as observed, e.g., for the pressure depen-dence of TC in ferromagnetic CeAg [202]. This might be the case for URhGe aspressure enhances TC [192, 176]. On the other hand, more sophisticated models,like the one proposed by Sheng and Cooper [203] obtain an increase of the mag-netic ordering temperature with pressure for compounds like UTe by incorporatingthe change in the f -density spectral distribution under pressure in LMTO band-structure calculations. Such a model could in principle also explain the increase ofTC in URhGe under pressure and the initial increase of TC in U(Rh,Ru)Ge. How-ever, similar band-structure calculations for URhGe have not been performed yet,but would be highly desirable.
The decrease of TC beyond x = 0.10 is likely to be attributed to the effect ofemptying the d-band, since Ru has one electron less than Rh. In a simple model,extracting electrons from the d-band of the “electron sea” gives the opportunityto the U f -electrons to fill the holes thus created in the d-band. This results ina strengthening of the f -d hybridization, which in turn leads to a larger exchangeparameter J , favoring the Kondo interaction. Apparently, this effect dominates thevolume effect for x > 0.10. Disorder is expected to play a secondary role becauseTC of URh1−xCoxGe samples with similar disorder gradually increases up to 20 Kfor x = 0.60.
For x > 0.20 the Curie temperature TC shows a linear dependence on the controlparameter, the Ru concentration x: TC ∼ |x − xc|. In the magnetic phase diagramproposed by Millis [82] the magnetic ordering temperature for itinerant fermion sys-tems varies as TM ∼ |δ − δc|z/(d+z−2), with δ some control parameter driving themagnetic-to-nonmagnetic transition (e.g., pressure, magnetic field, chemical substi-tution concentration), δc the critical value of the control parameter, d the dimension

140 URh1−xRuxGe
of the system, and z the dynamic critical exponent (z = 2 for antiferromagnets andz = 3 for ferromagnets). In the present case (d = 3) TC ∼ |x− xc|3/4 would thus beexpected, in contrast with the observed TC ∼ |x−xc|. A possible explanation couldbe that the critical region does not extend all the way to x = 0.20. In this studyTC might not have been determined accurately and close enough to xcr. An alterna-tive explanation might be that the effective dimension for the magnetic correlationsis reduced from d = 3 to d = 2. This idea is supported by the strong magneticanisotropy that essentially confines the magnetic moment to the b − c plane. How-ever, the theoretical model then does not predict a logarithmic difference of C/T ,as observed (Fig. 6.13), but a power law (C/T ∼ T−1/3).
It is interesting to compare the volume effect due to substitution by Ru anddue to pressure in URhGe. URhGe and URuGe are isostructural, the unit-cellvolume of URuGe being slightly smaller. X-ray powder diffraction data on someof the samples show that the lattice parameters of the URh1−xRuxGe series followVegard’s law (see Sec. 6.3.3). With an estimated isothermal compressibility κ =−V −1(dV/dp) of 0.8 Mbar−1 [192], 10 at.% substitution of Rh by Ru (x = 0.10)corresponds to a pressure of 0.37 GPa. With dTC/dp = 0.065 K/kbar [176] thispressure results in a small increase of TC to 9.8 K, while TC ∼ 10.5 K for 10 at.%Ru substitution would suggest a much larger dTC/dp ≈ 0.24 K/kbar, if attributedsolely to a volume effect. The divergence may arise because the unit-cell reductionupon Ru substitution is strongly anisotropic and dominated by the decrease of thelattice parameter a, whereas hydrostatic pressure is expected to give a much moreisotropic unit-cell reduction. Since uniaxial pressure along any direction enhancesTC [192], hydrostatic pressure will enhance TC even more. This can be seen fromthe fact that, in first approximation, dTC/dpi ≈ (1/3) dTC/dp.
Furthermore, the effect of external pressure with the shrinkage of the a-axis dueto Ru-substitution, a change of volume, affects the overlap of f - and d-orbitals, andtherefore, leads to a change in energy of the f -band. The number of electrons in thesystem is however constant, and therefore − in a rigid-band picture − also the Fermilevel. The change in Curie temperature is determined by the change in proximityof the f -band to the Fermi level. In the case of Ru substitution, on the other hand,the cause is the removal of electrons from the d-band. U f -electrons are able to fillthe space of the so created holes. This enhances the f -d hybridization and TC isaffected. The Fermi level is lowered and approaches the f -band. As a side effect, areduction in unit-cell volume is observed.
Hydrostatic pressure of 0.43 GPa on URh0.675Ru0.325Ge does not affect TC asshown in Sec. 6.3.5, but does lower the magnetization in 1 T at low temperatures.This reduction could be explained by an increased delocalization of the electrons.This would however normally decrease TC. For URhGe pressure along any of thethree crystallographic axes enhances TC [192]. In URh0.675Ru0.325Ge the a-axis ismuch smaller than for URhGe, whereas the b- and c-axes are comparable. Possiblythe uniaxial pressure dependence along the a-axis changes sign with increasing Ruconcentration x. The x = 0.325 compound would be at the crossover between a

6.4 Analysis and Discussion 141
positive and a negative uniaxial pressure dependence of TC. It would be interestingto measure other concentrations and at higher pressures.
The URh1−xRuxGe series deserves further investigation by measurements atlower temperatures and other Ru concentrations x in order to prove that the ob-served non-Fermi-liquid (NFL) behavior at xcr = 0.38 is an effect of the proximityto a zero-temperature phase transition, and not due to disorder, like proposed in theKondo disorder model [80] and the Griffiths phase model [85]. In the Kondo disordermodel a distribution of Kondo temperatures TK can arise if a Kondo-lattice materialhas significant disorder. Around each magnetic impurity, antiferromagnetically cou-pled to the conduction electrons, the Kondo effect will occur at different values ofTK. Averaging over such a distribution can produce thermodynamic and transportproperties with NFL-like dependencies. In the Griffiths phase model the presence ofdisorder is considered to lead to the coexistence of a metallic paramagnetic phase anda granular magnetic phase. In the paramagnetic phase the moments are quenchedby the Kondo interaction, giving rise to FL behavior, while the magnetic phase isdominated by the RKKY interaction giving rise to ordered regions.
Co and Si substitution
The main results from the Co and Si substitution study are reported in Fig. 6.16a,where the Curie temperature TC of the URh1−xCoxGe and URhGe1−xSix series areshown as a function of Co and Si concentration x, deduced from the magnetizationmeasurements. In Fig. 6.15b the magnetization at 2 K in a field of 1 T is shown.
Substituting Rh by Co in URhGe increases TC considerably to a maximum of20 K at x = 0.60. The Co concentration xcr for which TC = 0 is close to 1. HenceUCoGe is close to a magnetic instability, easily reachable by substituting a few at.%Co by Rh. Although Canepa et al. [197] found a magnetic transition around 46 Kfor UCoGe, the results presented here are in accordance with other studies [172, 170]for temperatures down to 1.2 K and indicate no ferromagnetic order.
The number of d-electrons remains constant when substituting Rh by Co. Hence,any change in TC should be an effect of a volume change. Assuming the latticeparameters of URh1−xCoxGe to follow Vegard’s law, x = 0.60 corresponds to apressure of 5.4 GPa (with κ = 0.8 Mbar−1). With dTC/dp = 0.065 K/kbar [176]this pressure results in a small increase of ΔTC = 3.5 K. Chemical substitutionmainly affects the c-axis and the b-axis to a lesser extent, whereas the a-axis ishardly influenced. This is very different from hydrostatic pressure.
For the URhGe1−xSix series TC does not vary up to x = 0.20 although there aresignificant changes in length for the a-, b-, and c-axes. It is however interesting thatthe magnetic moment at 2 K in 1 T is enhanced by 25 % for x = 0.20. This is anindication of the localization of magnetic moments, due to changes in hybridization.

142 URh1−xRuxGe
Figure 6.16: (Above) Curie temperature TC as a function of the Co and Si concentration xin URh1−xCoxGe and URhGe1−xSix as determined by magnetization measurements. Thesolid lines serve a guide to the eye. The critical Co concentration xcr for the suppressionof ferromagnetic order is close to 1. Si doping on the Ge site does not affect TC. (Below)Magnetic moment M at 2 K in a field of 1 T as a function of Co and Si concentration x.

6.5 Conclusions 143
6.5 Conclusions
In summary, the evolution of ferromagnetism in URhGe, in which atoms were substi-tuted by Ru, Co, and Si, have been investigated. For substitution by Ru, TC initiallyincreases, which is attributed to a volume effect. For x > 0.10, TC decreases, whichsuggests that emptying the d-band governs the hybridization phenomena. Ferro-magnetism is completely suppressed for xcr ≈ 0.38. At this critical concentrationnon-Fermi-liquid (NFL) behavior is observed in the specific heat. At low temper-atures it is found that the specific heat can be described by C/T ∼ − ln T . Forsubstitution by Co, TC increases up to 20 K for x = 0.60 and ferromagnetism issuppressed for x close to 1. This means that UCoGe is close to a quantum criticalphase transition and provides a good candidate to study a ferromagnetic quantumcritical point. Finally, substituting Ge by Si is found not to affect TC up to x = 0.20.

144

CHAPTER 7
UIr
7.1 Introduction
he first report of the existence of UIr was made in 1968when it was found that UIr melts congruently at 1743 K [204]. It tooknearly another twenty years to appear in literature again. WhereasUPt was studied rather well, little attention was paid to UIr. In 1987Dommann et al. even wrote [205]: “Our motivation for preparing UIrwas the hope to find a non-trivial superconductor and we were rather
disappointed by the discovery of its ferromagnetism.” Besides the determination ofits crystal structure and magnetic structure [205, 206, 207] only electrical resistivityat ambient pressure was reported by Brandle et al. [208], while Onuki et al. [209]mentioned that the electrical resistivity, thermoelectric power, Hall coefficient, mag-netic susceptibility, and magnetization resemble the data for URh. Here the storyof UIr ends for about ten years.
After the study of UIr by electrical resistivity under pressure and specific heat atambient pressure [210], the non-trivial superconductivity Dommann et al. had beenlooking for in UIr was finally found in the year 2004. After UGe2 [1] and URhGe [2],UIr is the third uranium based compound to show coexistence of ferromagnetismand superconductivity [3]. Just like in UGe2, the coexistence in UIr occurs within alimited pressure range (2.6-2.7 GPa), which is the critical pressure region in whichthe Curie temperature TC is tuned to zero. With the coexistence of ferromagnetismand superconductivity UIr belongs to a class of materials, which exhibit unconven-tional ground state properties close to a quantum critical point. In this class ofmaterials UIr even holds a special place because it is a system in which the crystalstructure lacks inversion symmetry.
UIr crystallizes in the monoclinic PbBi-type structure (space group P21) withoutinversion symmetry. The unit cell, with dimensions a = 5.62 A, b = 10.59 A, and

146 UIr
Figure 7.1: The monoclinic crystallographic structure of UIr. The uranium atoms areindicated in black and iridium atoms in gray. The figure shows the unit cell of UIrcontaining eight formula units.
c = 5.60 A (α = 90◦, β = 98.9◦, γ = 90◦), contains eight formula units withfour inequivalent U and Ir sites [205]. The unit cell is shown in Fig. 7.1. UIris a ferromagnet with a Curie temperature of TC = 46 K at ambient pressure.Magnetization measurements on a single crystal [211] revealed that the easy axis isparallel to [1 0 1] and that the anisotropy with the hard axes [1 0 1] and [0 1 0] is large.Along the easy direction, the average saturated moment is equal to 0.5 μB/U-atom.The coefficient of the linear electronic specific heat c/T = 50 mJ/mol K2 indicatesa moderate enhancement of the electron correlations at ambient pressure.
The pressure dependence of the ferromagnetic transition temperature was mea-sured by magnetization and electrical resistivity [3]. As shown in Fig. 7.2, TC is con-tinuously suppressed for increasing pressures until the magnetic structure collapsesat a pressure of about 1.7 GPa and again around 2.1 GPa into a new ferromag-netic structure with a higher TC. For even higher pressures the ferromagnetic orderis finally completely suppressed at a critical pressure of about 2.6-2.7 GPa. Thesaturated moment deduced from the magnetization measurements shows a strongreduction in the ordered moment at the transition from the low-pressure orderedstructure to the high-pressure ordered moment. Close to the critical pressure su-perconductivity can be found below Tsc = 0.14 K with an upper critical field ofμ0Hc2(0) = 26 mT.
The first compound found to have a coexistence of magnetic order, supercon-ductivity, and a lack of crystallographic inversion symmetry is CePt3Si [213]. An-

7.1 Introduction 147
Figure 7.2: Magnetic phase diagram of UIr. (a) Pressure dependence of the Curietemperatures TC1, TC2, and TC3 and superconducting transition temperature Tsc. Thephase boundaries are determined by resistivity, magnetization, and ac-susceptibility. (b)Pressure dependence of the ordered along the [1 0 1] direction. In the FM2 and FM3 phasesthe ordered moment is less than 0.05 μB/U. The figure is taken from Ref. [212].
tiferromagnetism sets in at TN = 2.2 K and superconductivity at Tc = 0.75 K. Thelack of inversion symmetry in the crystal is believed to exclude spin-triplet pairing,since in the absence of inversion symmetry the necessary set of degenerate electronstates cannot be provided for this type of pairing [214]. However, a high value forthe upper critical field μ0Hc2(0) seems to exclude spin-singlet pairing [213]. It wasproposed that a triplet-pairing state is still possible because the absence of the mir-ror z → −z would yield a Rashba-type spin-orbit coupling [215]. Later it was shownthat the antisymmetric spin-orbit coupling, which is present due to the lack of in-version symmetry in CePt3Si, leads to a lifting of the degeneracy in a special formwhich influences the Cooper pairing is such a way that the classification in even andodd parity or spin singlet and triplet state is obsolete [216]. The superconductingstate may be viewed as a superposition of an s-wave and p-wave state which yieldsa particular gap form with accidental line nodes.

148 UIr
UIr, on the other hand, is a ferromagnet and it is thought that superconductivitytherefore cannot be of a spin-singlet type due to the absence of a degeneracy between|k, ↑> and |−k, ↓> states. An inversion symmetry guarantees [214] the degeneracyof |k, ↑> and | − k, ↑> states, which is essential for spin-triplet pairing. UIr is veryinteresting, since the lack of inversion symmetry prohibits this degeneracy and asa result spin-triplet pairing, while the ferromagnetism is thought to prohibit spin-singlet pairing.
As shown in Fig. 7.2 there are three ferromagnetic phases separated by tran-sitions in the pressure range from 1.7 to 2.1 GPa. The superconductivity can beassociated with the quantum critical point of the third phase. Akazawa et al. [199]discusses the possibility of a structural transition from the monoclinic P21 structureto a structure with inversion symmetry in addition to the magnetic transition. Sincethe temperature dependence of the electrical resistivity ρ(T ) is continuous and sincea structural change to the space group which is closest already requires huge dis-placements of atom positions, it is likely that UIr keeps lacking inversion symmetryup to 3.1 GPa. The transitions at high pressure are expected to be magnetic ratherthan structural transitions.
In this Chapter several ambient pressure measurements on single-crystalline sam-ples of UIr are reported. The first experiment consisted of measuring the magne-tization in magnetic fields up to 52 T, to search for a field-induced metamagnetictransition in UIr. Secondly, specific heat measurements down to 3 K in fields upto 14 T are discussed. Finally, thermal expansion and magnetostriction data arepresented.
7.2 Magnetization in High Magnetic Fields*
7.2.1 Introduction
Since UIr is close to a quantum critical point it is interesting to investigate themagnetic interactions at play. A metamagnetic transition is a transition from onemagnetic state to another by the application of a magnetic field μ0H. In com-pounds with a strong competition between the Kondo effect and the RKKY inter-action (see Chapter 3), so-called strongly correlated systems characterized by anenhanced linear electronic specific heat coefficient, the ordered magnetic moment issmall and is accompanied by large magnetic fluctuations. These fluctuations can besuppressed by a magnetic field leading to a metamagnetic transition. Such a tran-sition characterizes the electronic interactions. Two examples of compounds with ametamagnetic transition are UPt3 [217, 218] with a transition at a field of 21 T andURu2Si2 [219, 220, 221, 222] with several transitions around 35 T.
Magnetization measurements [211] show a small ordered magnetic moment of0.5 μB/U-atom in 0 T and about 0.58 μB/U-atom in 7 T along the easy axis. These
*Parts of this Section have been submitted to Journal of Magnetism and Magnetic Materials.

7.2 Magnetization in High Magnetic Fields 149
Figure 7.3: High-field magnetization M of single-crystalline UIr in a pulsed magneticfield μ0H up to 52 T along the [1 0 1], [1 0 1], and [0 1 0] directions at 4.2 K.
values are much smaller than the 3.6 μB/U-atom for free U-atoms. Up to 7 T nometamagnetism was observed. De Haas-van Alphen measurements up to 17 T [223]have shown no special features either. High magnetic fields are therefore requiredin the search for a metamagnetic transition.
7.2.2 Experimental
A single-crystalline sample of UIr was grown by the Czochralski technique in a tri-arcfurnace. No subsequent heat treatment was applied to the crystal. From this crystala cube with dimensions 1×1×1 mm3 and a mass of 13.2 mg was cut along the [1 0 1],[1 0 1], and [0 1 0] axes of the monoclinic crystal structure. It was possible to cut acube since the [1 0 1] and [1 0 1] directions are almost perpendicular (see Sec. 7.4.4).High field magnetization measurements up to a field of 52 T were performed at 4.2 Kat the pulsed field facility LNCMP in Toulouse. After each magnetic pulse, thebackground was measured under the same experimental conditions by removing thesample out of the pick-up coil. Initial tests were performed in continuous magneticfields up to 30 T at the magnet facility HFML in Nijmegen.
7.2.3 Results
In Fig. 7.3 the high field magnetization at a temperature of T = 4.2 K in UIr isshown for pulsed magnetic fields along the [1 0 1], [1 0 1], and [0 1 0] directions. Inagreement with the low field magnetization measurements in fields up to 7 T [211],

150 UIr
a linear increase in the magnetization is observed for the [0 1 0] direction and aweak spin rotation followed by a linear increase in the magnetization for the [1 0 1]direction. Along the [1 0 1] direction, which is the easy axis for the magnetization,a sharp increase in magnetization is observed in low applied magnetic fields. Thisjump in magnetization of 0.5 μB/U-atom is caused by a domain repopulation ofthe ferromagnetic domains. For increasing magnetic fields the magnetization slowlyincreases. Up to the maximum applied field of 52 T no field-induced metamagnetictransition, related to a quenching of the magnetic interactions, is observed. Thefield dependence of the magnetization M(H) is accurately described by an empiricalexponential function of the form
M(H) = M(0) + ΔM(1 − e−μ0H/B0
)(7.1)
with values of M(0) = 0.5101 (2) μB/U-atom, ΔM = 0.440 (1) μB/U-atom, andB0 = 42.6 (2) T. The fit is indistinguishable from the data points.
7.2.4 Discussion
The estimated high magnetic field moment M(H = ∞) = M(0) + ΔM ≈ 1 μB/U-atom is significantly smaller than the free uranium 5f 2 (3.58 μB) or 5f 3 (3.62 μB)moments. High temperature susceptibility measurements on polycrystalline sam-ples [205] showed Curie-Weiss behavior for temperatures between room tempera-ture and 1200 K with an effective moment of 3.61 μB/U-atom and an unusuallylarge antiferromagnetic Curie-Weiss temperature of θCW = −430 K. High temper-ature magnetization measurements on a single crystal [211] indicated an effectivemoment of 3.57 μB/U-atom and antiferromagnetic Curie-Weiss temperatures rang-ing from −300 to −1000 K depending on the orientation. The deviations fromthe Curie-Weiss behavior observed below a temperature of about 500 K signals alevel splitting caused by crystalline electric field (CEF) effects, which is responsiblefor the strong magnetocrystalline anisotropy. At low temperatures only the lowestCEF level is occupied. This could explain the strongly reduced magnetic momentof ≈ 1 μB/U-atom.
The interaction field B0 = 42.6 (2) T, characteristic for the increase in magneti-zation along the easy axis, probes a magnetic interaction of the order of MB0/kB ≈29 K, which is somewhat smaller than the ferromagnetic ordering temperature ofTC = 46 K.
7.2.5 Conclusions
No sign of a field-induced metamagnetic transition was found in UIr for fields upto 52 T. For high magnetic fields the magnetic moment saturates at a value of≈ 1 μB/U-atom. This is strongly reduced compares to ≈ 3.6 μB/U-atom for free Uatoms. The field dependence of the magnetization is characterized by an interactionfield of B0 = 42.6 (2) T. The probed magnetic interactions are of the order of 29 K.

7.3 Specific Heat 151
7.3 Specific Heat
7.3.1 Introduction
In the investigation of enhanced magnetic correlations in the neighborhood of aquantum critical point, knowledge of the specific heat is essential. In particular thelinear specific heat coefficient γ at low temperatures gives direct information aboutthe effective mass enhancement of the correlated electrons. A (moderate) heavy-fermion compound can often be tuned to a quantum critical point by applyingpressure. In some cases this can also be achieved by applying high magnetic fields.The study of correlated systems in magnetic fields opens up a new dimension in the(magnetic) phase diagram. A suppression of the magnetic order, i.e. a lowering ofthe magnetic ordering temperature, or a suppression of e.g. the non-Fermi-liquidstate into a Fermi-liquid state of a compound belong to the possibilities. In thisSection a study of the specific heat of UIr in magnetic fields up to 14 T parallel tothe easy axis for magnetization and in the temperature range from 3 to 300 K isreported.
7.3.2 Experimental
For the specific heat measurements the same single-crystalline batch of UIr was usedas for the high-magnetic field measurements discussed in the previous Section. Thebatch was grown by the Czochralski technique in a tri-arc furnace. No subsequentheat treatment was applied to the crystal. From this crystal a plate with dimensionsroughly 2.5 × 2.5 × 0.5 mm3 and a mass of 66.4 mg was cut with the [1 0 1] axesperpendicular to the plane. Specific heat measurements in fields up to 14 T wereperformed in the temperature range 3 − 300 K on a commercially available Physi-cal Property Measurement Systems (PPMS) of Quantum Design at the Institut furFestkorperphysik (IFP) of the Forschungszentrum Karlsruhe (FZK). The measure-ments were performed by the heat relaxation method. Heat capacity was obtainedby fitting a heat relaxation curve recorded after a heat pulse caused a temperatureincrease of approximately 2 %. The heat capacity of the addenda (Apiezon N grease)had been measured in a separate run without the sample, and was subtracted fromthe data. For further details, see Ref. [37].
7.3.3 Results and Discussion
In Fig. 7.4 the temperature dependence of the specific heat divided by temperature(c/T ) is shown in magnetic fields of 0, 2, 5, and 14 T. The insert shows a zoom ofthe data near the maximum in c/T . The zero-field data are in good quantitativeagreements with previous measurements on polycrystalline UIr [210]. In zero field,a jump in the specific heat is observed at the ferromagnetic transition temperatureTC = 45.0 (2) K. This jump has a height of 34.3 (2) mJ/mol K2 and is obtained by theequal-entropy method. Unfortunately, the specific heat in this temperature region

152 UIr
Figure 7.4: Specific heat c of UIr divided by temperature T (c/T ) as a function oftemperature for fields up to 14 T in the temperature range of from 3 to 300 K. The insetshows a zoom of c/T near the maximum.
is dominated by the phonon contribution. However, from the insert the effect of amagnetic field is clear. The sharp peak in zero field is considerably broadened andshifted to higher temperature. Measurements in fields smaller than 1 T (not shown)indicate that the peak is already broadened for relatively small fields of 0.1 T.
The data at temperatures below 12 K can be fitted to c/T = γ + βT 2, where γis the electronic specific heat coefficient and β = 12π4rR/(5θ3
D) the coefficient forthe phonon contribution, with r = 2 the number of atoms per formula unit, R theuniversal gas constant, and θD is the Debye temperature. The data can be fittedsatisfactorily for all magnetic fields with γ = 46 (1) mJ/mol K2 and θD = 181 K.These values compare well with the values γ = 40 mJ/mol K2 and θD = 173 K foundin Ref. [210] for a polycrystal. Figure 7.4 clearly shows that a magnetic field of 14 Tonly causes a broadening of the peak at TC.
Bauer et al. [210] have measured besides UIr also a polycrystal of ThIr to ap-proximate the phonon contribution to c/T for UIr. In contrast to e.g. CePd2Si2,for which compound the c/T curve coincides with the c/T curve for LaPd2Si2 attemperatures above ≈ 25 K [224], the c/T values for UIr and ThIr keep differingabout 38.5 mJ/mol K2 up to at least 75 K. Since the specific heat data for UIr inmagnetic fields up to 14 T remain the same as for 0 T, the same conclusions canbe drawn with respect to ThIr. If γ remains constant up to 70 K in zero field, theKondo temperature TK can be estimated to be at least 70 K. A rough estimation

7.4 Thermal Expansion and Magnetostriction 153
through kBTK = μBB∗, where kB is the Boltzmann constant and B∗ as magneticfield characterizing the magnetic interactions, shows that B∗ ≈ 100 T. This is con-sistent with the result that γ is constant in fields up to 14 T. It also explains theabsence of a field-induced metamagnetic transition in the magnetization measuredin fields up to 52 T (see Sec. 7.2).
7.4 Thermal Expansion and Magnetostriction
7.4.1 Introduction
Thermal expansion is a fundamental thermodynamic property and is closely tiedto the specific heat. It probes how the entropy of the system responds to volumechanges and thus yields pressure dependencies of several thermodynamic properties.A big advantage of thermal expansion is that it probes the anisotropy in a system,since it can be measured along different directions. Remarkable uniaxial pressuredependencies of the Neel temperature TN have been found for e.g. CeCu6−xAux [225]and CePd2Si2 [175]. In addition, comparison of the thermal expansion data withspecific heat measurements gives the so-called Gruneisen parameter. It is a measurefor the volume dependence of the dominant energy scale at a certain temperature.
In this Section thermal expansion and magnetostriction measurements on single-crystalline UIr are reported. The uniaxial pressure dependencies of the Curie tem-perature TC at zero pressure have been determined.
The considerations in the Appendix of this Chapter show that with very highaccuracy the [1 0 1], [1 0 1], and [0 1 0] directions can be used as an orthogonal basisof the unit cell of UIr. Therefore the linear volume thermal expansion coefficient αV
is simply a sum of the three coefficients αi, with i equal to one of the three directions[1 0 1], [1 0 1], or [0 1 0].
7.4.2 Experimental
High-precision measurements of the variation in the sample length L as a functionof temperature T or as a function of magnetic field B have been performed onsingle-crystalline samples. The samples were prepared from the same batch as thesamples for magnetization in high magnetic fields (Sec. 7.2) and for specific heat(Sec. 7.3). The batch was grown by the Czochralski technique in a tri-arc furnace.No subsequent heat treatment was applied to the crystal. From this crystal sampleswere cut with lengths of 1.287 mm for [1 0 1], 2.10 mm for [1 0 1], and 3.68 mm for[0 1 0]. Thermal expansion measurements in 0 and 5 T, applied along the easy axisfor magnetization, have been performed in the temperature range from 5 to 250 K.The thermal expansion along [1 0 1], [1 0 1], and [0 1 0] was measured as a functionof temperature T . In addition, magnetostriction measurements were performed at4, 45, and 150 K for magnetic fields between -10 and 10 T. Again the dilatation
154 UIr
was measured along [1 0 1], [1 0 1], and [0 1 0] with the magnetic applied parallel to[1 0 1].
The data have been collected using a home-built measuring cell at the Insti-tut fur Festkorperphysik (IFP) of the Forschungszentrum Karlsruhe (FZK). Themeasurements are based on the parallel-plate capacitance method. For the thermalexpansion experiments the temperature was slowly raised at a reproducible rate of20 mK/s over the whole temperature range. Averages are made every 0.1 K. Thecoefficient of thermal expansion α is calculated by α = (1/L)(dL/dT ). For furtherdetails, see Sec. 2.4.2.
7.4.3 Results
Thermal expansion
In Fig. 7.5 the coefficient of linear thermal expansion α along the [1 0 1], [1 0 1], and[0 1 0] directions of single-crystalline UIr is shown as a function of temperature T inthe range from 5 to 250 K. The temperature dependence of the volume expansionαv = α[1 0 1] + α[1 0 1] + α[0 1 0] is shown for comparison (notice the figure shows αv/3).See Sec. 7.4.4 for a justification of this formula. At high temperatures the thermalexpansion is governed by the phonon contribution for all three orientations. Forzero field the ferromagnetic order sets in at TC = 45.0 K and a sharp negative peakin the coefficient of linear thermal expansion is observed for all three directions. For5 T the transition is considerably broadened. However, far below and far above TC
the curves for 0 and for 5 T coincide for a given direction. For all directions andboth magnetic fields, the thermal expansion extrapolates to 0 K−1 as temperaturegoes to 0 K, as expected.
In the zero field case the data show some remarkable results below TC. Firstly,the easy axis for the magnetization [1 0 1] behaves qualitatively different than the[1 0 1] and [0 1 0] directions. Whereas the latter two are positive for temperatureslower than a certain temperature below TC, the former remains negative below TC.Secondly, all three directions pass below TC through a maximum (or minimum).This is different than for URhGe (see Fig. 5.3), where αi decreases monotonouslytowards 0 K−1 with decreasing temperature. In 5 T a large shoulder is present inthe data, indicating that this feature is not suppressed in a magnetic field up to 5 T.
The observed steps in the coefficients of linear thermal expansion have the samesign but different sizes for the three directions. The values of the steps are listed inTable 7.1.
Magnetostriction
In Figs. 7.6, 7.7, and 7.8 the coefficient of magnetostriction λ = (1/L)dL/dB isshown for fields between -10 and 10 T applied along the [1 0 1] direction. Theexpansion is measured along the [1 0 1], [1 0 1], and [0 1 0] directions, respectively,for 4, 45, and 150 K. Basically all the figures show qualitatively the seem features.

7.4 Thermal Expansion and Magnetostriction 155
Figure 7.5: The coefficients of linear thermal expansion α of UIr as a function of temper-ature T along the [1 0 1], [1 0 1], and [0 1 0] directions in zero magnetic field (upper frame)and in an applied field of 5 T (lower frame). For comparison the volume expansion dividedby a factor 3 (αv/3) is also shown.

156 UIr
Table 7.1: Step anomalies in the coefficients of linear thermal expansion of single-crystalline UIr along the [1 0 1], [1 0 1], and [0 1 0] directions. The corresponding pressuredependence of the Curie temperature, dTC/dp, was deduced from the Ehrenfest relation(see text).
Δα dTC/dp(10−6 K−1) (K/kbar)
[1 0 1] -3.0(3) -0.22(2)[1 0 1] -14(1) -1.10(8)[0 1 0] -7.6(5) -0.55(4)
volume -24.6(1.2) -1.87(9)
Figure 7.6: The magnetostriction coefficient λ = (1/L)dL/dB of UIr for applied magneticfields B between -10 and 10 T at various temperatures. The magnetic field was appliedparallel to [1 0 1] direction and the dilatation was measured along the [1 0 1].

7.4 Thermal Expansion and Magnetostriction 157
Figure 7.7: The magnetostriction coefficient λ = (1/L)dL/dB of UIr for applied magneticfields B between -10 and 10 T at various temperatures. The magnetic field was appliedparallel to [1 0 1] direction and the dilatation was measured along the [1 0 1].
Figure 7.8: The magnetostriction coefficient λ = (1/L)dL/dB of UIr for applied magneticfields B between -10 and 10 T at various temperatures. The magnetic field was appliedparallel to [1 0 1] direction and the dilatation was measured along the [0 1 0].

158 UIr
At 150 K the magnetostriction effect is small, as expected since UIr is far in theparamagnetic regime. At 45 K λ decreases quite rapidly because of the broadeningof the ferromagnetic transition at this temperature. At 4 K the magnetostrictioncoefficient has a step around 0 T and increases slowly afterwards. The big differencebetween the figures is the scale. By applying a magnetic field along the [1 0 1]direction, the largest magnetostriction occurs in the [1 0 1] direction, followed by[0 1 0]. It should be noted that all value for λ are positive for positive fields andnegative for negative fields. This means that the crystal always expands whenapplying a magnetic field.
7.4.4 Discussion and Conclusions
In order to determine the uniaxial pressure dependence of the ferromagnetic transi-tion temperature, the Ehrenfest relation can be applied. For a second-order phasetransition, the uniaxial pressure dependence of the transition temperature is directlyrelated to the step anomalies in the coefficient of linear thermal expansion and thespecific heat by the Ehrenfest relation
dTC
dpi
=VmΔαi
Δ (c/T ), (7.2)
where the index i refers to the [1 0 1], [1 0 1], or [0 1 0] directions, Vm = 2.48 ×10⁻⁵ m3/mol is the molar volume, and Δ (c/T ) = 0.0343 (2) J/mol K2 is the anom-aly in the specific heat divided by temperature (Sec. 7.3). By applying this relationto the experimental step anomalies in the coefficients of linear thermal expansion,the uniaxial pressure dependence of TC along the [1 0 1], [1 0 1], and [0 1 0] directionsis obtained. The calculated values are listed in Table 7.1. The hydrostatic pressuredependence of TC can be obtained by inserting the volume expansion for the coef-ficient of linear expansion in Eq. 7.2, or by summing the three contributions of theuniaxial pressure dependence. The different pressure dependencies of TC as listed inTable 7.1 are all negative. This means that uniaxial pressure along any of the threemeasured directions will lower TC. It is clear from the Table that for hydrostaticpressure, the component along [1 0 1] accounts for more than half of the reductionof TC.
The calculated hydrostatic pressure dependence of dTC/dp = −1.87 (9) K/kbarcan be compared to the directly measured values. From Ref. [210] dTC/dp =−1.1 K/kbar is estimated and from Ref. [199] dTC/dp = −1.5 K/kbar. The thermalexpansion data yield a comparably high value. The difference can only partly beexplained by the uncertainty in the determination of the step in α.
The shoulder in the data below TC is remarkable. For URhGe (Sec. 5.2) αi
below TC goes to 0 K−1 monotonously. However, for UGe2 an unusual temperaturedependence of αi was found as well [226]. For UGe2 an anomaly below TC at ambientpressure was only seen in the thermal expansion. At high pressures, a transition wasseen as well in magnetization and resistivity (see Refs. in Chapter 4). Because of its
Appendix 159
very high sensitivity, thermal expansion was able to show this additional transitionat ambient pressure. The shoulder in the data for UIr can indicate the existence of a- so far unknown - energy scale which competes with the magnetic order appearing atTC = 45 K. This competition leads to a hump in α around 30 K. The data thereforesuggest the existence of an additional energy scale with T ∗ ≈ 30 K, competing withthe energy scale for magnetic order TC = 45 K. Possibly it is the signature of TC2
in Fig. 7.2 that may extrapolate to 30 K at p = 0 GPa. In any case it is interestingto note that the magnetization in fields up to 52 T (Sec. 7.2) showed a magneticinteraction of ≈ 29 K.
Through the thermodynamic Maxwell relation
λi =1
Li
dLi
dB= −dM
dpi
(7.3)
with i equal to [1 0 1], [1 0 1] and [0 1 0], the magnetostriction data show that theapplication of pressure along any direction decreases the magnetization. This isconsistent with Fig. 7.2 for hydrostatic pressure.
Appendix: Geometrical Considerations of Mono-
clinic Unit Cells
Crystals belonging to a monoclinic space group consist of unit cells having threeaxes (a, b, and c) of unequal lengths of which b is perpendicular to a and c, but aand c are not perpendicular to each other. The angle between a and c is denotedβ. According to the monoclinic symmetry, all the parameters a, b, c, and β varywith temperature. In first instance it is therefore necessary to perform at leastfour different measurements in order to find the temperature dependence of all fourparameters. Here the influence of β(T ) on the coefficients of linear thermal expansionα along the [1 0 1] and [1 0 1] directions is investigated.
In Fig. 7.9 the basal plane of a unit cell of UIr is shown. The b axis is perpendic-ular to the plane. The angle δ between the two diagonals [1 0 1] and [1 0 1] is given

160 UIr
Figure 7.9: Basal plane of the monoclinic unit cell of UIr.
by
cos δ =a2 − c2{
(a2 + c2)2 − (2ac cos β)2} 12
. (7.4)
The two diagonals are perpendicular if and only if a = c. Furthermore, δ is temper-ature dependent, since a, c, and β are temperature dependent.
Let X be the unit cell volume, the basal plane area, or any axis length in themonoclinic crystal, depending on a set of parameters p1, p2, . . . pN . The generalformula
αX (p1, p2, . . . , pn) =1
|X|∑
i
pi∂|X|∂pi
αpi(7.5)
is useful in determining the linear thermal expansion coefficient αX .The exact volume of the unit cell is Vex = abc sin β. If δ (Fig. 7.9) is close to 90◦,
then V can be approximated by
Vapprox =1
2b∣∣∣[101]
∣∣∣ · ∣∣∣[101] ∣∣∣ =
1
2b{(
a2 + c2)2 − (2ac cos β)2
} 12. (7.6)
Shortly it will be shown that for the particular case of UIr this approximation willyield an αV which is accurate within 0.6 %. With Eq. 7.5 the following expressionsare obtained:
αVex = αa + αb + αc − αβπ
180β tan (β − 90◦) , (7.7a)
αVapprox = αa2a2 (a2 − c2 cos 2β)
(a2 + c2)2 − (2ac cos β)2 + αb + αc2c2 (c2 − a2 cos 2β)
(a2 + c2)2 − (2ac cos β)2
+ αβπ
180
2 β a2c2 sin 2β
(a2 + c2)2 − (2ac cos β)2 .
(7.7b)

Appendix 161
Table 7.2: Lattice parameters and angle β as determined by neutron scattering. Datataken from A. Dommann et al. [205].
T (K) a (A) b (A) c (A) β (deg) V (A3)
16 5.605 (3) 10.552 (3) 5.576 (3) 99.12 (2)◦ 325.6 (4)
55 5.604 (4) 10.550 (4) 5.573 (4) 99.12( 3)◦ 325.3 (5)
293 5.620 (3) 10.590 (3) 5.598 (3) 98.93 (3)◦ 329.1 (5)
Here αβ is defined as αβ = (1/β) dβ/dT .The coefficients of linear thermal expansion for the two diagonals, with lengths∣∣∣ [10 ± 1]
∣∣∣ = {a2 + c2 ± 2ac cos β}12 are calculated to be
α(10±1) = aa ± c cos β
a2 + c2 ± 2ac cos βαa + c
c ± a cos β
a2 + c2 ± 2ac cos βαc
∓ π
180β
ac sin β
a2 + c2 ± 2ac cos βαβ.
(7.8)
It is easily checked that
α(101) + α(101) = αVapprox − αb. (7.9)
The lattice parameters as well as the angle β for UIr were determined by neutronscattering [205] and are shown in Table 7.2 at several temperatures. These valuesenable an estimation of how well αVex is approximated by αVapprox . Filling in thenumbers yields
αVex = αa + αb + αc − 0.2713 · αβ
αVapprox = αa + αb + αc − 0.2713 · αβ + 0.00402 · (αa − αc)
}at T = 293 K,
(7.10a)
αVex = αa + αb + αc − 0.2777 · αβ
αVapprox = αa + αb + αc − 0.2777 · αβ + 0.00569 · (αa − αc)
}at T = 55 K.
(7.10b)This shows that Eq. 7.9 is indeed a very good approximation to Vex for the particularcase of UIr.

162

Summary
nconventional ground state properties are found in the stronglycorrelated systems of UGe2, URhGe, and UIr. These compoundsbelong to a class of materials in which two phenomena - long thoughtto be mutually exclusive - appear simultaneously. UGe2 was the firstof these three compounds to attract considerable attention becauseof the emergence of superconductivity well within the ferromagnetic
state, followed by URhGe. UIr is special since its crystallographic structure lacksinversion symmetry.
The coexistence of ferromagnetism and superconductivity in the vicinity of aferromagnetic quantum critical point, is the main motivation that the related com-pounds are investigated thoroughly. The fact that magnetic fluctuations are en-hanced near a quantum critical point, just where superconductivity is found, stronglysuggests that the attractive force between the electrons forming the Cooper pair,originates from the magnetic fluctuations. This thesis has the intention to contributeto the understanding of the role of ferromagnetism and ferromagnetic spin fluctua-tions in their coexistence with superconductivity, by employing several techniques.
Chapter 4: UGe2
The ferromagnetic domain sizes of UGe2 were studied by means of three-dimensionalneutron depolarization at ambient pressure. It is concluded that the existence offield-tuned resonant tunneling between spin quantum states [117, 118] is highly un-likely. The requirement of this model is a ferromagnetic domain size of 40 A, whereasthe neutron depolarization measurements indicate a size a factor of 1000 larger. Thesuperconductivity, therefore, exists within a single ferromagnetic domain. The do-main walls are not expected to strongly affect the bulk Cooper pair wave function,as suggested by Nishioka et al. [117, 118], since the domain-wall size is less than afew percent of the average domain size.
The μSR data taken in the critical regime of UGe2 suggest a coexistence oftwo subsystems with localized 5f states responsible for the magnetic ordering and

164 Summary
delocalized states responsible for the superconducting properties. It is likely thatelectrons do not participate in both phenomena simultaneously, but are separatedeither in real space and/or in reciprocal space, i.e. different parts of the Fermisurface. This seems to contradict theoretical models [89, 90, 91, 92] in which thesuperconductivity and the ferromagnetism are assumed to be carried by the sameelectrons.
The depolarization of the spontaneous frequencies exhibit a peak at temperatureTX . It is shown that the peak could possibly develop because of the slowing downof magnetic fluctuations. This could play a role in the formation of Cooper pairs.
Chapter 5: URhGeThermal expansion measurements on a single-crystalline sample of the itinerantferromagnet URhGe show that below the ferromagnetic ordering temperature ofTC = 9.7 K the coefficient of linear thermal expansion increases along all threeorthorhombic axes. The uniaxial pressure dependence of the ferromagnetic transi-tion temperature was determined by the Ehrenfest relation from the anomalies inthe coefficients of linear thermal expansion and the specific heat. Positive valuesof dTC/dp are found for all principal axes. Consequently, the hydrostatic pressuredependence is also positive and amounts to dTC/dp = 0.119 K/kbar. This positivepressure dependence contrasts the behavior reported for UGe2 and UIr. In addition,the effective Gruneisen parameter was determined. The resulting low-temperaturebehavior points to an enhanced volume dependence of the ferromagnetic spin fluc-tuations at low temperatures and an equal volume scaling of the energy scales forthe ferromagnetic order and the ferromagnetic spin fluctuations.
μSR measurements on URhGe have been performed by recording the spin-latticerelaxation λZ as a function of externally applied magnetic field Bext for two direc-tions of the initial muon spin Sμ(0). Since both Sμ(0) ‖ c and Sμ(0) ⊥ c, with cthe easy axis for the magnetization, the anisotropy of the spin dynamics could bemeasured. The magnetic field scans in the paramagnetic state, close to TC, clearlyshow two different magnetic contributions, which can be identified as localized anditinerant magnetism. This fact strongly suggests that the 5f electrons responsiblefor both magnetic order and superconductivity do not participate in both phenom-ena simultaneously but are separated either in real space and/or in reciprocal space,i.e. different parts of the Fermi surface.
Chapter 6: URh1−xRuxGeSince ferromagnetism in URhGe cannot be suppressed by applying external pressure(Ref. [176] and Sec. 5.2) the evolution of ferromagnetism in URhGe has been inves-tigated by chemical substitution. In this study Rh atoms were substituted by Ruand Co whereas Ge made place for Si. For substitution by Ru, TC was found to ini-tially increase for increasing values of x in URh1−xRuxGe. This was attributed to avolume effect. For x > 0.10, TC decreases, which suggests that emptying the d-bandgoverns the hybridization phenomena. Ferromagnetism is completely suppressed for

Summary 165
xcr ≈ 0.38. At this critical concentration non-Fermi-liquid (NFL) behavior was ob-served in the specific heat. At low temperatures it was found that the specific heatcan be described by C/T ∼ − ln T . For substitution by Co, TC increases up to 20 Kfor x = 0.60 and ferromagnetism is suppressed for x close to 1. This means thatUCoGe is close to a quantum critical phase transition and provides a good candidateto study a ferromagnetic quantum critical point. Finally, substituting Ge by Si wasfound not to affect TC up to x = 0.20.
Chapter 7: UIrNo sign of a metamagnetic transition was found in UIr for pulsed fields up to 52 T.For high magnetic fields the magnetic moment saturates at a value of ≈ 1 μB/U-atom. This is strongly reduced compares to ≈ 3.6 μB/U-atom for free U atoms,possibly by crystalline electric fields. The field dependence of the magnetizationis characterized by an interaction field of B0 = 42.6 (2) T. The probed magneticinteractions are therefore of the order of 29 K.
Fits of the low-temperature specific heat data in fields up to 14 T show that theparameters at play remain constant. The data can be fitted satisfactorily for allmagnetic fields with γ = 46 (1) mJ/mol K2 and θD = 181 K. Therefore it was clearlyshown that application of a magnetic field of 14 T has little influence on the specificheat (and thus the magnetic correlations) except for a broadening of the peak atTC.
Thermal expansion data showed that uniaxial pressure along any direction inUIr will lower TC. For hydrostatic pressure, the component along [1 0 1] accountsfor more than half of the reduction of TC. A remarkable shoulder is present in thecurves of the linear thermal expansion coefficient α around T ∗ ≈ 30 K. It can beexplained by the existence of an energy scale which competes with the magneticorder appearing at TC = 45 K. This competition leads to a hump in α around30 K. It is at this moment unclear whether there is a connection with the magneticinteractions which where probed in the high-magnetic field measurements.

166

Samenvatting
nconventionele eigenschappen van de grondtoestand wordenaangetroffen in de sterk gecorreleerde systemen UGe2, URhGe enUIr. Deze verbindingen behoren tot een klasse materialen waarintwee verschijnselen - die lang gedacht werden elkaar uit te sluiten -tegelijkertijd optreden. UGe2 was de eerste van deze drie verbindin-gen die aanzienlijke aandacht genoot vanwege het optreden van su-
pergeleiding, diep in de ferromagnetische toestand, gevolgd door URhGe. UIr isspeciaal omdat de kristallografische structuur inversie symmetrie ontbeert.
Het tegelijkertijd bestaan van ferromagnetisme en supergeleiding in de buurt vaneen ferromangetisch quantum kritisch punt, is de belangrijkste motivatie waarom debetreffende verbindingen zo intensief worden bestudeerd. Het feit dat magnetischefluctuaties versterkt zijn in de buurt van een quantum kritisch punt, precies waarsupergeleiding wordt gevonden, suggereert sterk dat de aantrekkende kracht tussende electronen die het Cooper paar vormen, zijn oorsprong heeft in de magnetischefluctuaties. Dit proefschrift heeft de intentie door middel van enkele meettechniekeneen bijdrage te leveren aan het begrijpen van de rol van ferromagnetisme en ferro-magnetische spin fluctuaties in hun coexistencie met supergeleiding.
Hoofdstuk 4: UGe2
De ferromagnetische domein groottes van UGe2 werd bestudeerd door middel vandrie-dimensionale neutronen depolarisatie bij kamerdruk. De conclusie is dat hetbestaan van resonante tunneling, door een magnetisch veld geınduceerd, tussen spinquantum toestanden [117, 118] hoogst onwaarschijnlijk is. De voorwaarde voor ditmodel is en ferromagnetische domein grootte van 40 A, terwijl de neutronen depo-larisatiemetingen wijzen op een grootte die duizend keer groter is. De supergeleidingbestaat daarom binnen een enkel ferromagnetisch domein.
De domeinwanden worden niet verwacht een groot effect te hebben op de bulkCooper paar golffuncties, zoals gesuggereerd door Nishioka et al. [117, 118], terwijlde breedte van de domeinwand minder is dan enkele procenten van de gemiddelde

168 Samenvatting
domeingrootte.De μSR data die in het kritische temperatuurgebied van UGe2 zijn gemeten,
suggereren een coexistentie van twee subsystemen met gelocaliseerde 5f toestanden,verantwoordelijk voor de magnetische ordening, en gedelocaliseerde toestanden, ve-rantwoordelijk voor de supergeleidende eigenschappen. Het is waarschijnlijk datelectronen niet deelnemen in beide fenomenen tegelijkertijd, maar gesepareerd zijnin reele ruimte en/of in reciproke ruimte, dat wil zeggen verschillende delen van hetFermi oppervlak. Dit lijkt in strijd met theoretische model [89, 90, 91, 92] waarinde supergeleiding en het ferromagnetisme verondersteld worden te worden gedragendoor dezelfde electronen.
De depolarisatie van de spontane frequencies vertonen een piek bij temperatuurTX . Er wordt uiteengezet dat de piek zou kunnen ontstaan door het langzamerworden van magnetische fluctuaties. Dit zou een rol kunnen spelen in de formatievan Cooper paren.
Hoofdstuk 5: URhGeMetingen van de thermische uitzettingen aan een eenkristal van de itinerante ferro-magneet URhGe laten zien dat onder de ferromagnetische ordeningstemperatuur vanTC = 9.7 K de coefficient van de lineaire thermische uitzetting toeneemt langs alledrie de orthorhombische assen. De uniaxiale drukafhankelijk van de ferromagnetis-che overgangstemperatuur werd bepaald door de Ehrenfest relatie van de anomalienin de coefficient van de lineaire thermische uitzetting en de soortelijke warmte. Posi-tieve waarden van dTC/dp werden gevonden langs alle principale assen. Daarom isde hydrostatische drukafhankelijk ook positief en bedraagt dTC/dp = 0.119 K/kbar.Deze positieve drukafhankelijk is anders dan het gedrag voor UGe2 en UIr. Ook is deeffective Gruneisen parameter bepaald. Het resulterende lage temperatuur gedragduidt op een versterkte volume afhankelijk van de ferromagnetische spin fluctuatiesbij lage temperaturen en een even grote volume schaling van de energieschalen voorde ferromagnetische ordening en de ferromagnetische spin fluctuaties.
μSR metingen aan URhGe zijn uitgevoerd door het bepalen van de spin-kristalrelaxatie λZ als functie van het externe aangelegde magnetische veld Bext voortwee richtingen van de initiele muon spin Sμ(0). Aangezien zowel Sμ(0) ‖ c alsSμ(0) ⊥ c, met c de makkelijke as voor de magnetisatie, kon de anisotropie van despindynamica worden gemeten. De magnetische veld scans in de paramagnetischetoestand, dicht bij TC, laten duidelijk twee verschillende magnetische contributieszien, die geıdentificeerd kunnen worden als gelocaliseerd en itinerant magnetisme.Dit feit suggereert sterk dat de 5f niet deelnemen aan beide fenomenen tegelijker-tijd, maar gesepareerd zijn in reele ruimte en/of in reciproke ruimte, dat wil zeggenverschillende delen van het Fermi oppervlak. Dit lijkt in strijd met theoretischemodel [89, 90, 91, 92] waarin de supergeleiding en het ferromagnetisme veronder-steld worden te worden gedragen door dezelfde electronen.

Samenvatting 169
Hoofdstuk 6: URh1−xRuxGeAangezien het ferromagnetisme in URhGe niet onderdrukt kan worden door externedruk aan te leggen (Ref. [176] en Sec. 5.2), is de evolutie van ferromagnetisme inURhGe onderzocht door chemische substitutie. In dit onderzoek zijn Rh atomengesubstitueerd door Ru en Co terwijl Ge plaats maakte voor Si. Bij de substitutievan Ru is gevonden dat TC in het begin hoger werd met toenemende waarden vanx in URh1−xRuxGe. Dit werd toebedeeld aan een volume effect. Voor x > 0.10,neemt TC af, wat suggereert dat het leegmaken van de d-band de hybridisatie fenome-nen domineert. Ferromagnetisme wordt volledig onderdrukt voor xcr ≈ 0.38. Bijdeze kritische concentratie wordt non-Fermi-liquid (NFL) gedrag geobserveerd in desoortelijke warmte. Bij lage temperaturen werd gevonden dat de soortelijke warmtebeschreven kan worden door C/T ∼ − ln T . Voor substitutie door Co neemt TC toetot aan 20 K voor x = 0.60 en ferromagnetisme wordt onderdrukt voor waarden vanx dicht bij 1. Dit betekent dat UCoGe dicht bij een quantum kritische fase overgangis en verschaft een goede kandidaat om een ferromagnetisch quantum kritisch puntte bestuderen. Tot slot, substitutie van Ge door Si had geen effect op TC tot aanx = 0.20.
Hoofdstuk 7: UIrGeen teken van een metamagnetische overgang is gevonden in UIr voor gepulstevelden tot aan 52 T. Voor hoge magnetische velden satureert het magnetische mo-ment bij een waarden van ≈ 1 μB/U-atoom. Dit is sterk gereduceerd vergeleken met≈ 3.6 μB/U-atoom voor vrije U atomen, waarschijnlijk vanwege kristallijne elec-trische velden. De veld afhankelijkheid van de magnetisatie wordt gekarakteriseerddoor een interactie veld van B0 = 42.6 (2) T. The waargenomen magnetische veldenzijn daarom van de orde van 29 K.
Een fit van soortelijke warmte data bij lage temperaturen in magnetische veldentot aan 14 T laat zien dat de parameters die een rol spelen, constant blijven. Dedata kunnen naar tevredenheid worden gefit voor alle magnetische velden met γ =46 (1) mJ/mol K2 en θD = 181 K. Daarom is het duidelijk dat het aanleggen vaneen magnetisch veld van 14 T weinig effect heeft op de soortelijk warmte (en dus demagnetische correlaties) afgezien van een verbreding van de piek bij TC.
Thermische uitzetting data laten zien dat uniaxiale druk langs welke richtingdan ook de temperatuur TC in UIr verlaagt. Voor hydrostatische druk neemt decomponent langs [1 0 1] meer dan de helft van de reductie van TC voor zijn reken-ing. Een opmerkelijke schouder is aanwezig in de curves van de lineaire thermischeuitzettingscoefficient α rondom T ∗ ≈ 30 K. Dit kan verklaard worden door hetbestaan van een energieschaal die in competitie is met de magnetische ordeningdie bij TC = 45 K te voorschijn komt. Deze competitie leidt tot een schouder inα rondom 30 K. Het is op dit moment niet duidelijk of er een verband is met demagnetische interacties die waargenomen zijn in de hoge magnetische veld metingen.

170
BIBLIOGRAPHY
[1] S. S. Saxena, P. Agarwal, K. Ahilan, F. M. Grosche, R. K. W. Haselwimmer, M. J. Steiner,E. Pugh, I. R. Walker, S. R. Julian, P. Monthoux, G. G. Lonzarich, A. Huxley, I. Sheikin,D. Braithwaite, and J. Flouquet, Nature (London) 406 (2000) 587
[2] D. Aoki, A. Huxley, E. Ressouche, D. Braithwaite, J. Flouquet, J.-P. Brison, E. Lhotel, andC. Paulsen, Nature (London) 413 (2001) 613
[3] T. Akazawa, H. Hidaka, T. Fujiwara, T. C. Kobayashi, E. Yamamoto, Y. Haga, R. Settai,and Y. Onuki, J. Phys.: Condens. Matter 16 (2004) L29
[4] J. Bardeen, L. N. Cooper, and J. R. Schrieffer, Phys. Rev. 108 (1957) 1175
[5] W. A. Fertig, D. C. Johnston, L. E. DeLong, R. W. McCallum, M. B. Maple, and B. T.Matthias, Phys. Rev. Lett. 38 (1977) 987
[6] D. E. Moncton, D. B. McWhan, P. H. Schmidt, G. Shirane, W. Thomlinson, M. B. Maple,H. B. MacKay, L. D. Woolf, Z. Fisk, and D. C. Johnston, Phys. Rev. Lett. 45 (1980) 2060
[7] M. Ishikawa and Ø. Fischer, Solid State Comm. 23 (1977) 37
[8] F. Steglich, J. Aarts, C. D. Bredl, W. Lieke, D. Meschede, W. Franz, and H. Schafer, Phys.Rev. Lett. 43 (1979) 1892
[9] J. G. Bednorz and K. A. Muller, Z. Phys. B 64 (1986) 189
[10] K. Miyake, S. Schmitt Rink, and C. M. Varma, Phys. Rev. B 34 (1986) 6554
[11] M. T. Beal-Monod, C. Bourbonnais, and V. Emery, Phys. Rev. B 34 (1986) 7716
[12] A. A. Menovsky and J. J. M. Franse, J. Crystal Growth 65 (1983) 286
[13] C. Marın and E. Dieguez, Orientation Of Single-Crystals By Back-Reflection Laue PatternSimulation, World Scientific (1999)
[14] http://www.ccp14.ac.uk/tutorial/lmgp/orientexpress.htm
[15] A. Schenck, Muon Spin Rotation Spectroscopy: Principles and Applications in Solid StatePhysics, Adam Hilger Ltd, Bristol and Boston (1985)
[16] S. L. Lee, S. H. Kilcoyne, and R. Cywinski (eds.), Muons Science, Institut of PhysicsPublishing Bristol (1999)
[17] S. Sakarya, Master’s thesis, Delft University of Technology, (2002)

172 BIBLIOGRAPHY
[18] P. Dalmas de Reotier and A. Yaouanc, J. Phys.: Condens. Matter 9 (1997) 9113
[19] A. Schenck and F. N. Gygax, Handbook of Magnetic Materials, volume 9, p. 60, Ed. K. H.J. Buschow, North-Holland, Amsterdam (1995)
[20] A. Amato, Rev. Mod. Phys. 69 (1997) 1119
[21] J. Chappert, Muons and Pions in Materials Research, Chap. 3, Ed. J. Chappert and R. I.Grynszpan, Elsevier, Amsterdam (1984)
[22] R. Kubo and T. Toyabe, Magnetic Resonance and Relaxation, p. 810, North-Holland,Amsterdam (1967)
[23] R. S. Hayano, Y.J. Uemura, J. Imazato, N. Nishida, T. Yamazaki, and R. Kubo, Phys. Rev.B 20 (1979) 850
[24] P. Dalmas de Reotier and A. Yaouanc, J. Phys.: Condens. Matter 4 (1992) 4533
[25] C. P. Slichter, Principles of Magnetic Resonance, Springer-Verlag, Berlin (1996)
[26] A. Abragam, The Principles of Nuclear Magnetism, Oxford University Press, London (1961)
[27] A. Yaouanc, P. Dalmas de Reotier, and E. Frey, Phys. Rev. B 47 (1993) 796
[28] R. Feyerherm, A. Amato, A. Grayevsky, F. N. Gygax, N. Kaplan, and A. Schenck, Z. Phys.B 99 (1995) 3
[29] M. Th. Rekveldt, Z. Phys. 259 (1973) 391
[30] R. Rosman and M. Th. Rekveldt, Z. Phys. B 79 (1990) 61
[31] R. Rosman and M. Th. Rekveldt, Phys. Rev. B 43 (1991) 8437
[32] M. McElfresh, Fundamentals of Magnetism and Magnetic Measurements, Quantum Design,Inc. (1994)
[33] N. H. van Dijk, PhD thesis, University of Amsterdam, (1994)
[34] A. de Visser, PhD thesis, University of Amsterdam, (1986)
[35] C. Meingast, B. Blank, H. Burkle, B. Obst, T. Wolf, H. Wuhl, V. Selvamanickam, andK. Salama, Phys. Rev. B 41 (1990) 11299
[36] R. Pott and R. Schefzyk, J. Phys. E 16 (1983) 444
[37] J. C. Lashley, M. F. Hundley, A. Migliori, J. L. Sarrao, P. G. Pagliuso, T. W. Darling,M. Jaime, J. C. Cooley, W. L. Hults, L. Morales, D. J. Thoma, J. L. Smith, J. Boerio-Goates, B. F. Woodfield, G. R. Stewart, R. A. Fisher, and N. E. Phillips, Cryogenics 43(2003) 369
[38] A. C. Larson and R. B. V. Dreele, GSAS, Technical Report NM87545, Los Alamos NationalLaboratory (1994)
[39] J. Kondo, Prog. Theor. Phys. Jpn. 32 (1964) 37
[40] P. W. Anderson, Phys. Rev. 124 (1961) 41
[41] J. R. Schrieffer and P. A. Wolff, Phys. Rev. 149 (1966) 491
[42] M. A. Continentino, G. M. Japiassu, and A. Troper, Phys. Rev. B 39 (1989) 9734
[43] T. Koyama and M. Tachiki, Phys. Rev. B 34 (1986) 3272–3287
[44] T. Penney, F. P. Milliken, S. von Molnar, F. Holtzberg, and Z. Fisk, Phys. Rev. B 34 (1986)5959
BIBLIOGRAPHY 173
[45] M. A. Ruderman and C. Kittel, Phys. Rev. 96 (1954) 99
[46] T. Kasuya, Prog. Theor. Phys. 16 (1956) 45
[47] K. Yosida, Phys. Rev. 106 (1957) 893
[48] S. Doniach, Physica B 91 (1977) 213
[49] H. H. Hill, Plutonium 1970 and Other Actinides, p. 1, AIME, New York (1970)
[50] D. D. Koelling, B. D. Dunlap, and G. W. Crabtree, Phys. Rev. B 31 (1985) 4966
[51] J. Hertz, Phys. Rev. B 14 (1976) 1165
[52] P. Coleman, Physica B 259-261 (1999) 53
[53] H. von Lohneysen, J. Phys.: Condens. Matter 8 (1996) 9689
[54] C. M. Varma, Z. Nussinov, and W. van Saarloos, Phys. Rep. 361 (2002) 267
[55] M. Vojta, Rep. Prog. Phys. 66 (2003) 2069
[56] S. K. Ma, Modern Theory of Critical Phenomena, Benjamin, Reading (1976)
[57] B. Widom, J. Chem. Phys. 43 (1965) 3892
[58] K. G. Wilson, Phys. Rev. B 4 (1971) 3174
[59] N. D. Mathur, F. M. Grosche, S. R. Julian, I. R. Walker, D. M. Freye1, R. K. W. Haselwim-mer, and G. G. Lonzarich, Nature 394 (1998) 39
[60] C. Pfleiderer, G. J. McMullan, S. R. Julian, and G. G. Lonzarich, Phys. Rev. B 55 (1997)8330
[61] M. Uhlarz, C. Pfleiderer, and S. M. Hayden, Phys. Rev. Lett. 93 (2004) 256404
[62] D. Belitz, T. R. Kirkpatrick, and T. Vojta, Phys. Rev. Lett. 82 (1999) 4707
[63] D. Belitz and T. R. Kirkpatrick, Phys. Rev. Lett. 89 (2002) 247202
[64] C. Pfleiderer, J. Phys.: Condens. Matter 17 (2005) S987
[65] A. Tari, The Specific Heat of Matter at Low Temperatures, Imperial College Press, London(2003)
[66] N. H. van Dijk, F. Bourdarot, J. C. P. Klaasse, I. H. Hagmusa, E. Bruck, and A. A. Menovsky,Phys. Rev. B 56 (1997) 14493
[67] N. W. Ashcroft and N. D. Mermin, Solid State Physics, Harcourt College Publishers (1976)
[68] L. D. Landau, Sov. Phys. JETP 3 (1957) 920
[69] L. D. Landau, Sov. Phys. JETP 5 (1957) 101
[70] L. D. Landau, Sov. Phys. JETP 8 (1957) 70
[71] D. Pines and P. Nozieres, The Theory of Quantum Liquids, Addison-Wesley, New York(1989)
[72] G. Baym and C. J. Pethick, Landau Fermi Liquid Theory, John Wiley, New York (1991)
[73] K. Kadowaki and S. B. Woods, Solid State Comm. 58 (1986) 507
[74] P. Nozieres P and A. Blandin, J. Physique 41 (1980) 193
[75] D. L. Cox, Phys. Rev. Lett. 59 (1987) 1240
[76] D. L. Cox and M. Jarrel, J. Phys.: Condens. Matter 8 (1996) 9825

174 BIBLIOGRAPHY
[77] C. L. Seaman, M. B. Maple, B. W. Lee, S. Ghamaty, M. Torikachvili, J.-S. Kang, L. Z. Liu,J. W. Allen, and D. L. Cox, Phys. Rev. Lett. 67 (1991) 2882
[78] H. Amitsuka, T. Hidano, T. Honma, H. Mitamura, and T. Sakakibara, Physica B 186-188(1993) 337
[79] B. Andraka, Phys. Rev. B 49 (1994) 3589
[80] E. Miranda, V. Dobrosavljevic, and G. Kotliar, J. Phys.: Condens. Matter 8 (1996) 9871
[81] B. Andraka and G. R. Stewart, Phys. Rev. B 47 (1993) 3208
[82] A. J. Millis, Phys. Rev. B 48 (1993) 7183
[83] T. Moriya and T. Takimoto, J. Phys. Soc. Jpn. 64 (1995) 960
[84] H. von Lohneysen, J. Magn. Magn. Mat. 200 (1999) 532
[85] A. H. Castro Neto, G. Castilla, and B. A. Jones, Phys. Rev. Lett. 81 (1998) 3531
[86] A. de Visser, J. J. M. Franse, and J. Flouquet, Physica B 161 (1989) 324
[87] P. E. Brommer, Physica B 112B (1982) 343
[88] A. B. Pippard, The Elements of Classical Thermodynamics, Cambridge University Press,Cambridge (1964)
[89] K. Machida and T. Ohmi, Phys. Rev. Lett. 86 (2001) 850
[90] R. Roussev and A. J. Millis, Phys. Rev. B 63 (2001) 140504
[91] A. B. Shick and W. E. Pickett, Phys. Rev. Lett. 86 (2001) 300
[92] K. G. Sandeman, G. G. Lonzarich, and A. J. Schofield, Phys. Rev. Lett. 90 (2003) 167005
[93] N. I. Karchev, K. B. Blagoev, K. S. Bedell, and P. B. Littlewood, Phys. Rev. Lett. 86 (2001)846
[94] T. R. Kirkpatrick, D. Belitz, T. Vojta, and R. Narayanan, Phys. Rev. Lett. 87 (2001) 127003
[95] T. R. Kirkpatrick and D. Belitz, Phys. Rev. B 67 (2003) 024515
[96] V. P. Mineev, Phys. Rev. B 66 (2002) 134504
[97] V. P. Mineev and T. Champel, Phys. Rev. B 69 (2004) 144521
[98] D. V. Shopova and D. I. Uzunov, Phys. Rev. B 72 (2005) 024531
[99] A. Nevidomskyy, Phys. Rev. Lett. 94 (2005) 097003
[100] H. Suhl, Phys. Rev. Lett. 87 (2001) 167007
[101] A. A. Abrikosov, J. Phys.: Condens. Matter 13 (2001) L943
[102] Y. Kitaoka, H. Kotegawa, A. Harada, S. Kawasaki, Y. Kawasaki, Y. Haga, E. Yamamoto,Y. Onuki, K. M. Itoh, E. E. Haller, and H. Harima, J. Phys.: Condens. Matter 17 (2005)S975
[103] H. Kotegawa, A. Harada, S. Kawasaki, Y. Kawasaki, Y. Kitaoka, Y. Haga, E. Yamamoto,Y. Onuki, K. M. Itoh, E. E. Haller, and H. Harima, J. Phys. Soc. Jpn. 74 (2005) 705
[104] P. Boulet, A. Daoudi, M. Potel, H. Noel, G. M. Gross, G. Andre, and F. Bouree, J. AlloysComp. 247 (1997) 104
[105] K. Oikawa, T. Kamiyama, H. Asano, Y. Onuki, and M. Kohgi, J. Phys. Soc. Jpn. 65 (1996)3229

BIBLIOGRAPHY 175
[106] D. Aoki, A. Huxley, E. Ressouche, I. Sheikin, J. Flouquet, J.-P. Brison, and C. Paulsen, J.Phys. Chem. Solids 63 (2002) 1179
[107] N. Kernavanois, B. Grenier, A. Huxley, E Ressouche, J. P. Sanchez, and J. Flouquet, Phys.Rev. B 64 (2001) 174509
[108] Y. Onuki, I. Ukon, S. W. Yun, I. Umehara, K. Satoh, T. Fukuhara, H. Sato, S. Takayanagi,M. Shikama, and A. Ochiai, J. Phys. Soc. Jpn. 61 (1992) 293
[109] A. Huxley, I. Sheikin, and D. Braithwaite, Physica B 284-288 (2000) 1277
[110] A. Huxley, I. Sheikin, E. Ressouche, N. Kernavanois, D. Braithwaite, R. Calemczuk, andJ. Flouquet, Phys. Rev. B 63 (2001) 144519
[111] T. C. Kobayashi, K. Hanazono, N. Tateiwa, K. Amaya, Y. Haga, R. Settai, and Y. Onuki,J. Phys.: Condens. Matter 14 (2002) 10779
[112] Y. Haga, M. Nakashima, R. Settai, S. Ikeda, T. Okubo, S. Araki, T. C. Kobayashi,N. Tateiwa, and Y. Onuki, J. Phys.: Condens. Matter 14 (2002) L125
[113] N. Tateiwa, K. Hanazono, T. C. Kobayashi, K. Amaya, T. Inoue, , K. Kindo, Y. Koike,N. Metoki, Y. Haga, R. Settai, and Y. Onuki, J. Phys. Soc. Jpn 70 (2001) 2876
[114] C. Pfleiderer and A. D. Huxley, Phys. Rev. Lett. 89 (2002) 147005
[115] N. Tateiwa, T. C. Kobayashi, K. Amaya, Y. Haga, R. Settai, and Y. Onuki, Phys. Rev. B69 (2004) 180513(R)
[116] A. Huxley A, E. Ressouche, B. Grenier, D. Aoki, J. Flouquet, and C. Pfleiderer, J. Phys.:Condens. Matter 15 (2003) S1945
[117] T. Nishioka, G. Motoyama, S. Nakamura, H. Kadoya, and N. K. Sato, Phys. Rev. Lett. 88(2002) 237203
[118] T. Nishioka, G. Motoyama, S. Nakamura, H. Kadoya, and N. K. Sato, Phys. Rev. Lett. 91(2003) 209702
[119] D. E. Moncton, G. Shirane, W. Thomlinson, M. Ishikawa, and Ø. Fischer, Phys. Rev. Lett.41 (1978) 1133
[120] C. F. Majkrzak, G. Shirane, W. Thomlinson, M. Ishikawa, Ø. Fischer, and D. E. Moncton,Solid State Comm. 31 (1979) 773
[121] W. Thomlinson, G. Shirane, D. E. Moncton, M. Ishikawa, and Ø. Fischer, Phys. Rev. B 23(1981) 4455
[122] I. R. Walker, F. M. Grosche, D. M. Freye, and G. G. Lonzarich, Physica C 282 (1997) 303
[123] F. M. Grosche, S. J. S. Lister, F. V. Carter, S. S. Saxena, R. K. W. Haselwimmer, N. D.Mathur, S. R. Julian, and G. G. Lonzarich, Physica B 239 (1997) 62
[124] N. K. Sato, N. Aso, K. Miyake, R. Shiina, P. Thalmeier, G. Varelogiannis, C. Geibel,F. Steglich, P. Fulde, and T. Komatsubara, Nature (London) 410 (2001) 340
[125] N. Tateiwa, T. C. Kobayashi, K. Hanazono, K. Amaya, Y. Haga, R. Settai, and Y. Onuki,J. Phys.: Condens. Matter 13 (2001) L17
[126] E. M. Chudnovsky and L. Gunther, Phys. Rev. Lett. 60 (1988) 661
[127] E. B. Sonin, Phys. Rev. B 66 (2002) 100504(R)
[128] M. Faure and A. I. Buzdin, Phys. Rev. Lett. 94 (2005) 187202
[129] E. B. Sonin, Phys. Rev. Lett. 95 (2005) 269701

176 BIBLIOGRAPHY
[130] M. Faure and A. I. Buzdin, Phys. Rev. Lett. 95 (2005) 269702
[131] S. Chikazumi, Physics of Ferromagnetism, Oxford University Press (1997)
[132] E. Lhotel, C. Paulsen, and A. D. Huxley, Phys. Rev. Lett. 91 (2003) 209701
[133] E. Lhotel, C. Paulsen, and A. D. Huxley, J. Magn. Magn. Mat. 272-276 (2004) 179
[134] A. Yaouanc, P. Dalmas de Reotier, P. C. M. Gubbens, C. T. Kaiser, A. A. Menovsky,M. Mihalik, and S. P. Cottrel, Phys. Rev. Lett. 89 (2002) 147001
[135] D. Andreica, PhD thesis, ETH-Zurich, (2001), Chapter 5
[136] B. Bireckhoven and J. Wittig, J. Phys. E 21 (1988) 841
[137] L. R. Walker and R. E. Walstedt, Phys. Rev. B 22 (1980) 3816
[138] A. M. Mulders, C. T. Kaiser, S. J. Harker, P. C. M. Gubbens, A. Amato, F. N. Gygax,A. Schenck, P. Dalmas de Reotier, A. Yaouanc, K. H. J. Buschow, and A. A. Menovsky,Phys. Rev. B 67 (2003) 014303
[139] A. Schenck and G. Solt, J. Phys.: Condens. Matter 16 (2004) S4639
[140] A. Schenck A, M. Pinkpank, F. N. Gygax, K.-U. Neumann, K. R. A. Ziebeck, and A. Amato,J. Phys.: Condens. Matter 10 (1998) 8059
[141] E. Frey and F. Schwabl, Adv. Phys. 43 (1994) 577
[142] P. Dalmas de Reotier, A. Yaouanc, and E. Frey, Phys. Rev. B 50 (1994) 3033
[143] P. Dalmas de Reotier, P. C. M. Gubbens, and A. Yaouanc, J. Phys.: Condens. Matter 16(2004) S4687
[144] P. C. M. Gubbens, P. Dalmas De Reotier, A. Yaouanc, A. A. Menovsky, and C. E. Snel,Hyperfine Interactions 85 (1994) 245
[145] S. Watanabe and K. Miyake, J. Phys. Soc. Jpn. 71 (2002) 2489
[146] S. Watanabe and K. Miyake, Physica B 312-313 (2002) 115
[147] J. Flouquet, A. Huxley, I. Sheikin, N. Kernavanois, D. Braithwaite, E. Ressouche, S. Watan-abe, and K. Miyake, J. Phys. Soc. Jpn. Suppl. A 70 (2001) 14
[148] S. Raymond and A. Huxley, Phys. Rev. B 73 (2006) 094420
[149] A. D. Huxley, S. Raymond, and E. Ressouche, Phys. Rev. Lett. 91 (2003) 207201
[150] P. Monthoux and G. G. Lonzarich, Phys. Rev. B 59 (1999) 14598
[151] L. Paolasini L, J. A. Paixao, G. H. Lander, A. Delapalme, N. Sato, and T. Komatsubara, J.Phys.: Condens. Matter 5 (1993) 8905
[152] J. A. Paixao, L. C. J. Pereira, P. Estrela, M. Godinho, M. Almeida, L. Paolasini, M. Bonnet,J. Rebizant, and J. C. Spirlet, J. Phys.: Condens. Matter 11 (1999) 2115
[153] J. Rossat-Mignod, Handbook of the physics and chemistry of Actinides, volume 1, p. 60,North-Holland, Amsterdam (1984)
[154] K. Kuwahara, H. Sagayama, K. Iwasa, M. Kohgi, Y. Haga, Y. Onuki, K. Kakurai, M. Nishi,K. Nakajima, N. Aso, and Y. Uwatoko, Physica B 312-313 (2002) 106
[155] R. Caspary, P. Hellmann, M. Keller, G. Sparn, C. Wassilew, R. Kohler, C. Geibel, C. Schank,F. Steglich, and N. E. Phillips, Phys. Rev. Lett. 71 (1993) 2146
[156] R. Feyerherm, A. Amato, F. N. Gygax, A. Schenck, C. Geibel, F. Steglich, N. Sato, andT. Komatsubara, Phys. Rev. Lett. 73 (1994) 1849

BIBLIOGRAPHY 177
[157] N. Metoki, Y. Haga, Y. Koike, and Y. Onuki, Phys. Rev. Lett. 80 (1998) 5417
[158] N. Bernhoeft, N. Sato, B. Roessli, N. Aso, A. Hiess, G. H. Lander, Y. Endoh, and T. Ko-matsubara, Phys. Rev. Lett. 81 (1998) 4244
[159] A. Schenck A, P. Birrer, F. N. Gygax, B. Hitti, E. Lippelt, M. Weber, P. Boni P, P. Fischer,H. R. Ott, and Z. Fisk, Phys. Rev. Lett. 65 (1990) 2454
[160] H. Kumigashira, T. Ito, A. Ashihara, H. D. Kim, H. Aoki, T. Suzuki, H. Yamagami, andT. Takahashi, Phys. Rev. B 61 (2000) 15707
[161] V. Sechovsky and L. Havela, Handbook of Magnetic Materials, volume 11, p. 1, Ed. K. H.J. Buschow, North-Holland, Amsterdam (1998)
[162] V. H. Tran, R. Troc, and G. Andre, J. Magn. Magn. Mater. 186 (1998) 81
[163] K. Prokes, T. Tahara, Y. Echizen, T. Takabatake, T. Fujita, I. H. Hagmusa, J. C. P. Klaasse,E. Bruck, F. R. de Boer, M. Divis, and V. Sechovsky, Physica B 311 (2002) 220
[164] A. B. Shick, Phys. Rev. B 65 (2002) 180509R
[165] M. Divis, L. M. Sandratskii, M. Richter, P. Mohn, and P. Novak, J. Alloys Comp. 337(2002) 48
[166] K. Prokes, T. Tahara, Y. Echizen, T. Takabatake, T. Fujita, I. H. Hagmusa, J. C. P. Klaasse,E. Bruck, F. R. de Boer, M. Divis, and V. Sechovsky, Physica B 334 (2003) 272
[167] I. H. Hagmusa, K. Prokes, Y. Echizen, T. Takabatake, T. Fujita, J. C. P. Klaasse, E. Bruck,V. Sechovsky, and F. R. de Boer, Physica B 281–282 (2000) 223
[168] V. H. Tran and R. Troc, Phys. Rev. B 57 (1998) 11592
[169] F. R. de Boer, E. Bruck, V. Sechovsky, L. Havela, and K. H. J. Buschow, Physica B 163(1990) 175
[170] K. H. J. Buschow, E. Bruck, R. G. van Wierst, F. R. de Boer, L. Havela, V. Sechovsky,P. Nozar, E. Sugiura, M. Ono, M. Date, and A. Yamagishi, J. Appl. Phys. 67 (1990) 5215
[171] B. Chevalier, E. Hickey, and J. Etourneau, J. Magn. Magn. Mater. 90-91 (1990) 499
[172] R. Troc and V. H. Tran, J. Magn. Magn. Mater. 73 (1988) 389
[173] F. Levy, I. Sheikin, B. Grenier, and A. D. Huxley, Science 309 (2005) 1343
[174] L. Havela, M. Divis, V. Sechovsky, A.V. Andreev, F. Honda, G. Oomi, Y. Meresse, andS. Heathman, J. Alloys Comp. 322 (2001) 7
[175] N. H. van Dijk, B. Fak, T. Charvolin, P. Lejay, and J. M. Mignot, Phys. Rev. B 61 (2000)8922
[176] F. Hardy, A. Huxley, J. Flouquet, B. Salce, G. Knebel, D. Braithwaite, D. Aoki, M. Uhlarz,and C. Pfleiderer, Physica B 359–361 (2005) 1111
[177] F. Hardy and A. D. Huxley, Phys. Rev. Lett. 94 (2005) 247006
[178] F. Hardy, PhD thesis, CEA, Grenoble, (2004)
[179] M. C. Lynch, S. P Cottrell, P. J. C King, and G. H. Eaton, Physica B 326 (2003) 270
[180] N. Bloembergen, E. M. Purcell, and R. V. Pound, Phys. Rev. 73 (1948) 679
[181] C. P. Slichter, Principles of Magnetic Resonance, Springer Verlag (1992)
[182] G. G. Lonzarich and L. Taillefer, J. Phys. C: Solid State Phys. 18 (1985) 4339
[183] G. Zwicknagl A. N. Yaresko and P. Fulde, Phys. Rev. B 65 (2002) 081103(R)

178 BIBLIOGRAPHY
[184] G. Zwicknagl and P. Fulde, J. Phys.: Condens. Matter 15 (2003) S1911
[185] T. Takahashi, N. Sato, T. Yokoya, A. Chainani, T. Morimoto, and T. Komatsubara, J. Phys.Soc. Jpn 65 (1995) 156
[186] K. Prokes, A. Gukasov, T. Takabatake, T. Fujita, and V. Sechovsky, Acta Phys. Pol. B 34(2003) 1473
[187] S. W. Lovesey, Theory of neutron scattering from condensed matter, volume 2, OxfordUniversity Press, Oxford (1984)
[188] A. Yaouanc, P. Dalmas de Reotier, P. C. M. Gubbens, S. Sakarya, G. Lapertot, A. D. Hillier,and P. J. C. King, J. Phys.: Condens. Matter 17 (2005) L129
[189] P. Dalmas de Reotier, A. Yaouanc, and P. Bonville, J. Phys.: Condens. Matter 8 (1996)5113
[190] P. Dalmas de Reotier, A. Yaouanc, P. C. M. Gubbens, S. Sakarya, E. Jimenez, P. Bonville,and J. A. Hodges, Hyperfine Interactions 158 (2004) 131
[191] P. Dalmas de Reotier and A. Yaouanc, Phys. Rev. B 52 (1995) 9155
[192] S. Sakarya, N. H. van Dijk, A. de Visser, and E. Bruck, Phys. Rev. B 67 (2003) 144407
[193] G. R. Stewart, Rev. Mod. Phys. 73 (2001) 797
[194] K. Prokes, E. Bruck, K. H. J. Buschow, F. R. de Boer, V. Sechovsky, P. Svoboda, X. Hu,H. Maletta, and T. J. Gortenmulder, J. Appl. Phys. 79 (1996) 5221
[195] B. Chevalier, B. Lloret, P. Gravereau, B. Buffat, and J. Etourneau, J. Magn. Magn. Mat.75 (1988) 13
[196] V. Sechovsky and L. Havela, Ferromagnetic Materials, volume 4, p. 309, Ed. E. P. Wohlfarthand K. H. J. Buschow, North-Holland, Amsterdam (1988)
[197] F. Canepa, P. Manfrinetti, M. Pani, and A. Palenzona, J. Alloys Comp. 234 (1996) 225
[198] S. Sakarya, N. H. van Dijk, N. T. Huy, and A. de Visser, Physica B 378-380 (2006) 970
[199] T. Akazawa, H. Hidaka, H. Kotegawa, T. Kobayashi, T. Fujiwara, E. Yamamoto, Y. Haga,R. Settai, and Y. Onuki, J. Phys. Soc. Jpn. 73 (2004) 3129
[200] L. Vegard, Z. Phys. 5 (1921) 17
[201] N. T. Huy et al., in preparation
[202] A. Eiling and J. S. Schilling, Phys. Rev. Lett. 46 (1981) 364
[203] Q. G. Sheng and B. R. Cooper, J. Appl. Phys. 75 (1985) 7035
[204] J. J. Park and L. R. Mullen, J. Res. NBS 72A (1968) 19
[205] A. Dommann, F. Hulliger, and T. Siegrist, J. Magn. Magn. Mat. 67 (1987) 323
[206] T. Siegrist, Y. Le Page, V. Gramlich, W. Petter, A. Dommann, and F. Hulliger, J. Less-Common Metals 125 (1987) 167
[207] P. H. Frings, C. Vettier, A. Dommann, F. Hulliger, and A. Menovsky, Physica B 156-157(1989) 832
[208] H. Brandle, J. Schoenes, and F. Hulliger, Helvetica Physica Acta 61 (1988) 833
[209] Y. Onuki, S. W. Yun, I. Ukon, A. Kobori, I. Umehara, K. Satoh, T. Fukuhara, H. Sato, andS. Takayanagi, J. Phys. Soc. Jpn. 61 (1992) 1751

179
[210] E. D. Bauer, E. J. Freeman, C. Sirvent, and M. B. Maple, J. Phys.: Condens. Matter 13(2001) 5675
[211] A. Galatanu, Y. Haga, E. Yamamoto, T. D. Matsuda, S. Ikeda, and Y. Onuki, J. Phys. Soc.Jpn. 73 (2004) 766
[212] T. C. Kobayashi, S. Fukushima, H. Hidaka, H. Kotegawa, T. Akazawa, E. Yamamoto,Y. Haga, R. Settai, and Y. Onuki, Physica B 375-380 (2006) 355
[213] E. Bauer, G. Hilscher, H. Michor, Ch. Paul, E. W. Scheidt, A. Gribanov, Yu. Seropegin,H. Noel, M. Sigrist, and P. Rogl, Phys. Rev. Lett. 92 (2004) 27003
[214] P. W. Anderson, Phys. Rev. B 30 (1984) 4000
[215] L. P. Gorkov and E. I. Rashba, Phys. Rev. Lett. 87 (2001) 037004
[216] R. P. Kaur, D. F. Agterberg, and M. Sigrist, Phys. Rev. Lett. 94 (2005) 137002
[217] P. H. Frings, J. J. M. Franse, F. R. de Boer, and A. Menovsky, J. Magn. Magn. Mater.31-34 (1983) 240
[218] K. Bakker, A. de Visser, A. A. Menovsky, and J. J. M. Franse, Phys. Rev. B 46 (1992) 544
[219] J.-G. Park, K. A. McEwen, S. de Brion, G. Chouteau, H. Amitsuka, and T. Sakakibara, J.Phys.: Condens. Matter 9 (1997) 3065
[220] K. Sugiyama, M. Nakashima, H. Ohkuni, K. Kindo, Y. Haga, T. Honma, E. Yamamoto, andY. Onuki, J. Phys. Soc. Jpn. 68 (1999) 3394
[221] F. R. de Boer, J. J. M. Franse, E. Louis, A. A. Menovsky, J. A. Mydosh, T. T. M. Palstra,U. Rauchschwalbe, W. Schlabitz, F. Steglich, and A. de Visser, Physica B 138 (1986) 1
[222] A. de Visser, F. R. de Boer, A. A. Menovsky, and J. J. M. Franse, Sol. State Comm. 64(1987) 527
[223] E. Yamamoto, Y. Haga, H. Shishido, H. Nakawaki, Y. Inada, R. Settai, and Y. Onuki,Physica B 312 (2002) 302
[224] I. Sheikin, Y. Wang, F. Bouquet, P. Lejay, and A. Junod, J. Phys.: Condens. Matter 14(2002) L543
[225] P. Estrela, A. de Visser, O. Stockert, K. Grube, and H. v. Lohneysen, J. Magn. Magn. Mat.272-276 (2004) 23
[226] G. Oomi, K. Nishimura, Y. Onuki, and S. W. Yun, Physica B 186-188 (1993) 758

180

Acknowledgements
irst of all I would like to thank all the members of my committeefor the approval of my thesis and for giving me the opportunity tobring four years of scientific research to a successful end.
De meeste dank ben ik verschuldigd aan Niels van Dijk. Nietalleen vanwege het vertrouwen dat hij in mij heeft gesteld om vanafmei 2002 aan een promotietraject te beginnen, maar ook vanwege
de begeleiding die hij in de vier daaropvolgende jaren gaf op zowel theoretisch alsexperimenteel gebied. Ignatz de Schepper wil ik bedanken voor het feit dat hijmijn promotor wilde zijn en dit proefschrift heeft goedgekeurd. Ik ben hem zeererkentelijk voor de belangstelling die hij op diverse gebieden in mij heeft getoond.Paul Gubbens bedank ik voor alles wat hij voor mij heeft gedaan. Marianne vanBaaren ben ik dankbaar voor het voortreffelijk organiseren van al mijn buitenlandsetrips, maar vooral ook voor de gezelligheid in de groep.
Het Van der Waals-Zeemaninstituut van de Universiteit van Amsterdam heefteen grote rol gespeeld tijdens de vier jaar van mijn promotie. De kritische blik vanAnne de Visser heeft altijd voor verbetering gezorgd in al mijn werk. Chapter 6originated in strong collaboration with Nguyen Than Huy. All the single crystalsused in this thesis were made by Yingkai Huang and Ekkes Bruck. I would like tothank all of them for their contribution to this thesis. Speciale dank gaat naar TonGortenmulder, voor de prettige ontvangst wanneer ik weer eens in Leiden langskwamom kristallen te orienteren.
I am very grateful to my two French collaborators Pierre Dalmas de Reotier andAlain Yaouanc from Grenoble. Without you the many μSR experiments describedin Chapters 4 and 5 would not have been as successful as they are now. Apartfrom this, I have learned tremendously much about science in general and μSR inparticular. I am honored to have worked together with such good scientists as theyare. I will never forget the most interesting scientific discussions during my PhD.These discussions with Pierre somehow always took place somewhere between twoand three o’clock in the night in the GPS cabin at PSI or the EMU cabin at ISIS.

182 Acknowledgements
During the autumn of 2005 I spent three months in Karlsruhe for a part of myresearch. This visit was kindly enabled by Prof. von Lohneysen. The magneti-zation measurements under pressure were performed together with Marc Uhlarz.Although the specific heat measurements at the University didn’t work out exactlyas desired, Tobias Gorlach should be mentioned for his enormous efforts. At theForschungszentrum, Christoph Meingast and William Knafo were of great help forthe thermal expansion measurements described in Chapter 7. I would like to thankall of them for the great time I had in Karlsruhe!
The technical support given by Adrian Hillier, when measurements on the EMUspectrometer at ISIS were running, was really marvelous. His interest and concernfor the experiments have contributed to the μSR results of Chapter 5. Probably thebiggest challenge of all was to get the uranium samples into the cryostat in the firstplace. I thank him for his great help!
The measurements on UGe2 at high pressure, described in Chapter 4, would nothave been possible without the great support of Daniel Andreica. His pressure cellenabled me to perform the desired measurements. At this place Alex Amato shouldbe thanked for the Knight shift measurements performed in his own beamtime.
The high-field measurements in Chapter 7 were performed at the LNCMP inToulouse with the great support of Harisson Rakoto and Jean-Marc Broto. Thanksto them the experiments were a success! Preliminary measurements were performedin Nijmegen together with Jos Perenboom. I would like to thank all of them fortheir kind help.
During the four years of my PhD I had the pleasure to meet other PhD stu-dents from all over the world. First of all I will never forget the great times Ihad with Enrique. Whether in Villigen during muon measurements or high in themountains in Zuoz in Switzerland, in Manzanares in Spain for his wedding, in Romefor a magnetism conference or just in Delft, it was always a pleasure to meet eachother. Iulian and Jerome have been my two roommates at the IRI for a few years.The discussions about their home countries, Romania and the Philippines, and thephilosophical conversations were always very interesting.
De muziek en het hele gebeuren daaromheen heeft een belangrijke rol in mijnleven gespeeld. Mijn dank gaat uit naar de leden van het Zuid-Hollands SymphonieOrkest met speciale dank aan Eunice en de andere kroegmaatjes. Verder bedank ikmijn muziekdocenten voor hun inspirerende lessen: Alfred Snel voor de pianolessen,Els Boerendonk voor de vioollessen en Aarnoud de Groen voor de orgellessen.
Zeer veel dank ben ik verschuldigd aan Peronik Amons. Zijn ondersteuning tij-dens onze gesprekken was voor mij onontbeerlijk en maakte een wereld van verschil.Hierdoor ben ik in staat geweest de vele tegenslagen waarmee ik te kampen kreeg,te overwinnen.
Tot slot dank ik mijn broer Serhat voor zijn interesse, Madelon voor de kaft vandit proefschrift en mijn moeder voor alles wat zij voor mij betekend heeft met haarkracht en haar steun door alle omstandigheden in de loop der tijd heen.

Curriculum Vitae
erdar Sakarya werd geboren op 10 maart 1979 in Den Haag. Nain 1997 het Gymnasium Haganum te Den Haag te hebben afgerond,ging hij Techische Natuurkunde studeren aan de Technische Univer-siteit Delft. Een jaar later behaalde hij zijn propedeuse cum laude.Tijdens zijn afstuderen maakte hij deel uit van de vakgroep Neu-tronenverstrooiing en Mossbauerspectroscopie aan het Interfacultair
Reactor Instituut van de Technische Universiteit Delft. In april 2002 studeerde hijcum laude af. Bovendien was hij de beste afstudeerder van het studiejaar 2001- 2002 en ontving hij de Natuurkundeprijs 2002 voor bijzondere afstudeerscriptie.Aansluitend volgde een vierjarig promotietraject aan hetzelfde Reactor Instituut,waarvan dit proefschrift het uiteindelijke resultaat is. Tijdens zijn promotie ginghij regelmatig naar het buitenland, zowel om onderzoek te doen aan diverse buiten-landse instituten, te weten ISIS (Oxford, Engeland), PSI (Villigen, Zwitserland),BENSC/HMI (Berlijn, Duitsland), en LNCMP (Toulouse, Frankrijk), als voor di-verse cursussen zoals de HERCULES cursus (Higher Education Research Course forUsers of Large Experimental Systems) in Grenoble (Frankrijk) en een zomerschoolin Zuoz (Zwitserland). In het najaar van 2005 verbleef hij drie maanden aan de“Universitat Karlsruhe (TH)” in Duitsland. In het kader van onderwijsverplichtin-gen was hij begeleider van practica voor de cursussen Stralingshygiene niveau 4 enniveau 5.
Tijdens zijn studie was Serdar bijlesleraar wiskunde, natuurkunde en scheikundevoor leerlingen van het Gymnasium Haganum te Den Haag. Tevens bekleedde hij defuncties van algemeen bestuurslid, secretaris en ten slotte voorzitter van het Zuid-Hollands Symfonie Orkest. Met dit orkest heeft hij op 24 april 2004 als solist hetderde pianoconcert van Beethoven uitgevoerd.
Thans is Serdar werkzaam bij Hewitt Associates als actuarieel medewerker. Inhet kader hiervan studeert hij naast zijn werk Actuariele Wetenschappen aan deUniversiteit van Amsterdam.

184

List of publications
A. Yaouanc, P. Dalmas de Reotier, P. Bonville, J. A. Hodges, P. C. M. Gubbens,C. T. Kaiser, and S. Sakarya, Spin dynamics in geometrically frustrated compounds,Physica B 326 (2003) 456-459
S. Sakarya, N. H. van Dijk, A. de Visser, and E. Bruck, Dilatometry study of theferromagnetic order in single-crystalline URhGe, Phys. Rev. B 67 (2003) 144407
S. Sakarya, N. H. van Dijk, A. de Visser, and E. Bruck, Thermal expansion mea-surements on a ferromagnetically ordered single-crystal URhGe, J. Magn. Magn.Mater. 272-276 (2004) e15-e16
E. Jimenez, P. C. M. Gubbens, S. Sakarya, G. A. Stewart, P. Dalmas de Reotier,A. Yaouanc, J. Isasi, R. Saez-Puche, and U. Zimmermann, Interplay between Tm3+
and Cr5+ magnetic sublattices in TmCrO4, J. Magn. Magn. Mater. 272-276 (2004)568-570
O. Roubeau, P. C. M. Gubbens, D. Visser, M. Blaauw, P. Dalmas de Reotier,A. Yaouanc, J. G. Haasnoot, J. Reedijk, S. Sakarya, U. A. Jayasooriya, S. P. Cot-trel, and P. J. C. King, Observation of the spin-crossover in [Fe(btr)2(NCS)2·H2O(btr=4,4’-bis-1,2,4-triazole) with μSR, Chem. Phys. Letters 395 (2004) 177-181
P. Dalmas de Reotier, A. Yaouanc, P. C. M. Gubbens, S. Sakarya, E. Jimenez,P. Bonville, and J. A. Hodges, Thermal Behaviour of the μSR Relaxation Rate atHigh Temperature in Insulators, Hyperfine Interactions 158 (2004) 131
A. Yaouanc, P. Dalmas de Reotier, P. C. M. Gubbens, S. Sakarya, G. Lapertot,A. D. Hillier, and P. J. C. King Testing the self-consistent renormalization theoryfor the description of the spin-fluctuation modes of MnSi at ambient pressure, J.Phys.: Condens. Matter 17 (2005) L129
S. Sakarya, N. H. van Dijk, and E. Bruck, Determination of the ferromagneticdomain size in UGe2 by three-dimensional neutron depolarization, Physica B 359-

186 List of publications
361 (2005) 1120
S. Sakarya, N. H. van Dijk, and E. Bruck, Determination of the magnetic domainsize in the ferromagnetic superconductor UGe2 by three-dimensional neutron depo-larization, Phys. Rev. B. 71 (2005) 174417
A. Yaouanc, P. Dalmas de Reotier, V. Glazkov, C. Marin, P. Bonville, J. A. Hodges,P. C. M. Gubbens, S. Sakarya, and C. Baines, Magnetic Density of States at LowEnergy in Geometrically Frustrated Systems, Phys. Rev. Lett. 95 (2005) 047203
P. Dalmas de Reotier, G. Lapertot, A. Yaouanc, P. C. M. Gubbens, S. Sakarya, andA. Amato, Evidence for an antiferromagnetic component in the magnetic structureof ZrZn2, Phys. Lett. A 349 (2006) 513
P. C. M. Gubbens, M. Wagemaker, S. Sakarya, M. Blaauw, A. Yaouanc, P. Dalmasde Reotier, and S. P. Cottrell Muon spin relaxation in Li0.6TiO2 anode material,Solid State Ionics 177 (2006) 145
P. Dalmas de Reotier, V. Glazkov, C. Marin, A. Yaouanc, P. C. M. Gubbens,S. Sakarya, P. Bonville, A. Amato, C. Baines, and P. J. C. King Studies of R2Ti2O7
(R = Gd and Yb); new results, Physica B 374-375 (2006) 145
S. Sakarya, N. H. van Dijk, N. T. Huy, and A. de Visser, Suppression of ferromag-netism in URhGe doped with Ru, Physica B 378-380 (2006) 970
E. Jimenez-Melero, P. C. M. Gubbens, M. P. Steenvoorden, S. Sakarya, A. Goosens,P. Dalmas de Reotier, A. Yaouanc, J. Rodrıguez-Carvajal, B. Beuneu, J. Isasi,R. Saez-Puche, U. Zimmerman and J. L. Martınez A combined study of the magneticproperties of GdCrO4, J. Phys.: Condens. Matter 18 (2006) 7893
S. Sakarya, N. H. van Dijk, A. de Visser, E. Bruck, Y. Huang, J. A. A. J Peren-boom, H. Rakoto, J.-M. Broto High field magnetization measurements on UIr in theferromagnetic state, submitted to J. Magn. Magn. Mater.
S. Sakarya, N. T. Huy, N. H. van Dijk, A. de Visser, J. C. P. Klaasse, M. Wagemaker,T. J. Gortenmulder, M. Uhlarz and H. v. Lohneysen Search for the ferromagneticquantum critical points in URhGe by chemical substitution, to be submitted