magnetic ground state and spin fluctuations in mnge chiral
TRANSCRIPT
PHYSICAL REVIEW B 93, 174405 (2016)
Magnetic ground state and spin fluctuations in MnGe chiral magnet as studiedby muon spin rotation
N. Martin,1 M. Deutsch,2 F. Bert,3 D. Andreica,4 A. Amato,5 P. Bonfa,6 R. De Renzi,6 U. K. Roßler,7 P. Bonville,8
L. N. Fomicheva,9 A. V. Tsvyashchenko,9,10 and I. Mirebeau1,*
1Laboratoire Leon Brillouin, CEA, CNRS, Universite Paris-Saclay, CEA Saclay 91191 Gif-sur-Yvette, France2Universite de Lorraine, Laboratoire CRM2,UMR UL-CNRS 7036, 54506 Vandoeuvre-les-Nancy, France
3Laboratoire de Physique du Solide, UMR CNRS 8502, Universite Paris Sud, FR-91140 Orsay, France4Faculty of Physics, Babes-Bolyai University, 400084 Cluj-Napoca, Romania
5Laboratory for Muon Spin Spectroscopy, PSI, CH-5232 Villigen PSI, Switzerland6Dipartimento di Fisica e Scienze della Terra and Unita CNISM di Parma, Universita di Parma, 43124 Parma, Italy
7Leibnitz Institute for Solid State and Material Research, IFW Dresden D-01069, Germany8SPEC, CEA, CNRS, Universite Paris-Saclay, CEA-Saclay, 91191 Gif-sur-Yvette, France
9Vereshchagin Institute for High Pressure Physics, Russian Academy of Sciences, 142190 Troitsk, Moscow, Russia10Skobeltsyn Institute of Nuclear Physics, MSU, Vorob’evy Gory 1/2, 119991 Moscow, Russia
(Received 2 February 2016; revised manuscript received 19 April 2016; published 5 May 2016)
We have studied by muon spin resonance (μSR) the helical ground state and fluctuating chiral phase recentlyobserved in the MnGe chiral magnet. At low temperature, the muon polarization shows double-period oscillationsat short-time scales. Their analysis, akin to that recently developed for MnSi [A. Amato et al., Phys. Rev. B89, 184425 (2014)], provides an estimation of the field distribution induced by the Mn helical order at themuon site. The refined muon position agrees nicely with ab initio calculations. With increasing temperature,an inhomogeneous fluctuating chiral phase sets in, characterized by two well-separated frequency ranges whichcoexist in the sample. Rapid and slow fluctuations, respectively, associated with short-range and long-rangeordered helices, coexist in a large temperature range below TN = 170 K. We discuss the results with respectto MnSi, taking the short helical period, metastable quenched state, and peculiar band structure of MnGe intoaccount.
DOI: 10.1103/PhysRevB.93.174405
I. INTRODUCTION
Spin fluctuations in itinerant systems have attracted strongattention since the pioneering work of Moriya [1], pro-viding a unified theory for the Curie-Weiss dependence ofthe spin susceptibility. Such fluctuations, either thermal orquantum, are usually a precursor of a transition towards amagnetically ordered ground state. In critical phenomena,low-energy fluctuations of the order parameter, extendingover increasing length scales, yield a second-order transitionobeying Ginzburg-Landau universality laws. Such a second-order phase transition could be avoided if the fluctuations arestrong enough, with the system evading the associated entropyby undergoing a first-order transition without any divergenceof the correlation length.
In B20 itinerant chiral magnets such as MnSi, FeGe,or MnGe, the crucial role of the spin fluctuations appearsalready in the ground state, when applied pressure inducesa first-order quantum transition from the ordered helicalstate to a non-Fermi-liquid state with partial magnetic order,involving chiral fluctuations of local magnetic moments [2–5].At finite temperature and under magnetic field, an intermediatechiral phase (also called fluctuation disordered regime) isstabilized between the ordered and paramagnetic phases. Thenature of this phase has been discussed in the literature.One explanation invokes chiral mesophases in analogy with
chiral nematics, including disordered liquid phases composedof skyrmionic double-twisted or multiply twisted spin tex-tures [4–7]. Another scenario assumes fluctuating helices [8,9]with finite length scale, isotropically distributed in space, and afluctuation-induced first-order transition [10] as explained byBrazovskii universality [11]. The chiral fluctuations could bethe source of soft modes, stabilizing a skyrmion lattice phasein MnSi and FeGe just below the ordering transition [3,8,12].
In this series, MnGe stands out as a highly topical magnet,still poorly understood. Synthesized under high pressure andtemperature [13], MnGe exists in a metastable and powderedstate only. The strong exchange interaction yields a hightransition temperature (TN = 170 K) and ordered Mn momentm0 = mord(T → 0) = 1.8(1) μB [14], whereas the strongspin-orbit coupling results in the shortest helix pitch (29 A atlow temperature) of the B20 series [15]. The giant topologicalHall effect (THE) and the Nernst effect [16,17] make MnGepromising for spintronic applications. In bulk MnGe in a zerofield, a helical multidomain ground state was inferred frommagnetic neutron diffraction, although a more complex groundstate involving a cubic lattice of skyrmions and antiskyrmionswas also proposed to account for the THE [18]. With increasingtemperature, a fluctuating inhomogeneous chiral phase settlesin, extending over an exceptionally broad temperature rangeTN ± 70 K. Fluctuations below TN are a unique feature inthe B20 series, where they usually extend over a few degreesabove TN.
In MnGe, these fluctuations, revealed by a broad suscep-tibility peak versus temperature, were studied by neutron
2469-9950/2016/93(17)/174405(12) 174405-1 ©2016 American Physical Society
N. MARTIN et al. PHYSICAL REVIEW B 93, 174405 (2016)
diffraction and Mossbauer spectroscopy [19,20]. These mea-surements suggest a qualitative picture of the chiral inhomo-geneties. Below TN, long-range ordered (LRO) helices coexistwith short-range ordered (SRO) fluctuating ones. Above TN,the static LRO helices disappear, but SRO helices remain.Ferromagnetic correlations persist up to about 250 K, with acoherence length below the typical helical wavelength. Low-field magnetic irreversibilities are seen even above, up to 300 Kat least, showing that some sort of slow dynamics coexists withrapid spin fluctuations deeply in the paramagnetic regime.
The nature and origin of the spin fluctuations in MnGe andthe intrinsic inhomogeneity of its chiral order are a matterof debate. The peculiar band structure of MnGe yields threepossible states for the Mn moment, namely, high spin, lowspin, and zero spin (called HS, LS, and ZS, respectively) [21],which can be stabilized depending on the interatomic distance.Therefore, the transition between spin states can be driven byan applied pressure. High-pressure neutron diffraction [14]shows that the collapse of the ordered Mn moment in theground state occurs in two steps, around 7 GPa and above13 GPa, respectively. X-ray data measured up to 30 GPa [22]suggest that the same scenario is at play for the local momentin the paramagnetic phase at 300 K. Altogether, the pressuredata suggest a first-order transition line between the HS and LSstates, stabilized in a very large T range. This scenario yields apossible route for unconventional Invar-like spin fluctuations,needed to accommodate HS and LS regions with differentspecific volumes.
We have investigated MnGe by muon spin resonance(μSR). At low temperature (T = 10 K) when the frozenhelical order is stabilized, we observe a complex oscillatingasymmetry as in MnSi [23]. Following Ref. [23], we accountfor it by calculating the distribution of dipolar fields at themuon sites. Our analysis allows us to identify the muonstopping site in good agreement with an ab initio model and todetermine the contact field on the muon site. With increasingtemperature, we use μSR to probe the spin fluctuations at alonger time scale (10−6 s) than the Mossbauer (10−8 s) orneutron (10−11 to 10−12 s) probes. We deduce from our resultsthe fluctuating fraction and relaxation rate versus temperature,describing the spin dynamics of the chiral fluctuations over abroad temperature range (10–300 K) and time window. Thewhole results are discussed with respect to the model MnSicase.
II. EXPERIMENTAL DETAILS
Polycrystalline MnGe was synthesized under 8 GPa in atoroidal high-pressure apparatus by melting reaction with Mnand Ge. The purity of the constituents was 99.9% and 99.999%for Mn and Ge, respectively. The pellets of well-mixedpowdered constituents were placed in rock-salt pipe ampoulesand then directly electrically heated to T � 1600 ◦C. Then thesample was quenched to room temperature before releasingthe applied pressure [13]. The sample was the same as forthe neutron experiments of Refs. [14,19]. It was checked byneutron and x-ray diffraction, yielding an amount of impuritiessmaller than 2%. For the purpose of the μSR experiment, itwas sintered in a pellet of 13 mm diameter and 2 mm thickness,wrapped in a thin Al foil and placed in a silver sample
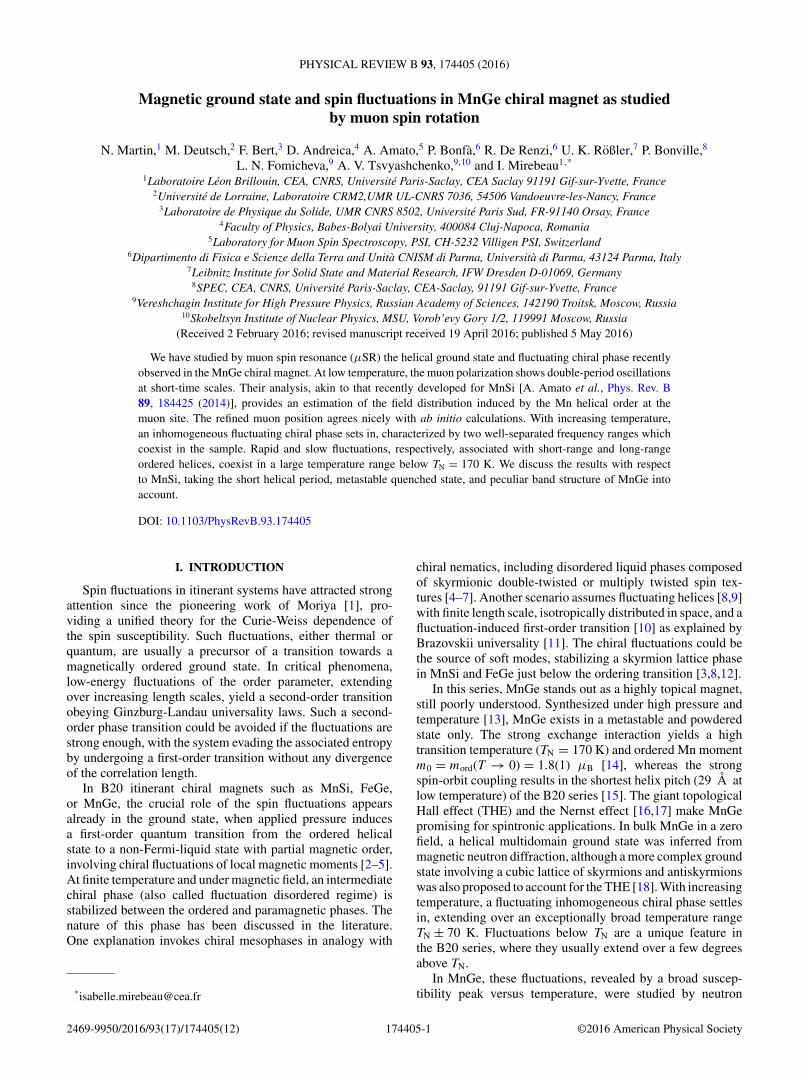
FIG. 1. Magnetic structure of MnGe deduced from neutron pow-der diffraction as seen along (a) [1,1,1] and (b) [0,0,1] crystallographicdirections. The latter picture consists of six consecutive unit cells,stacked along the c axis.
holder. The μSR experiments were performed on the general-purpose surface-muon (GPS) instrument at the Paul ScherrerInstitut (PSI, Villigen, Switzerland), in the temperature range10–300 K. In order to study the spin fluctuations, we usedlongitudinal field μSR (LF-μSR) in a small field of 20 Gto decouple the contribution of nuclear dipolar fields [24].Measurements at selected temperatures in the range 1.5 �T � 115 K were performed with a shorter time window(5 μs) and high statistics to extract the polarization oscillationsinduced by the helical order. Transverse-field measurements(TF-μSR) were performed above 170 K and the frequencyshift was compared with the bulk magnetization to evaluatethe contact field at the muon site in the paramagnetic region.To measure the magnetization, we used the same sample batch,magnetic field value (0.4 T), and cooling procedure as for theTF-μSR.
III. RESULTS AND ANALYSIS
A. Helical order at low temperature
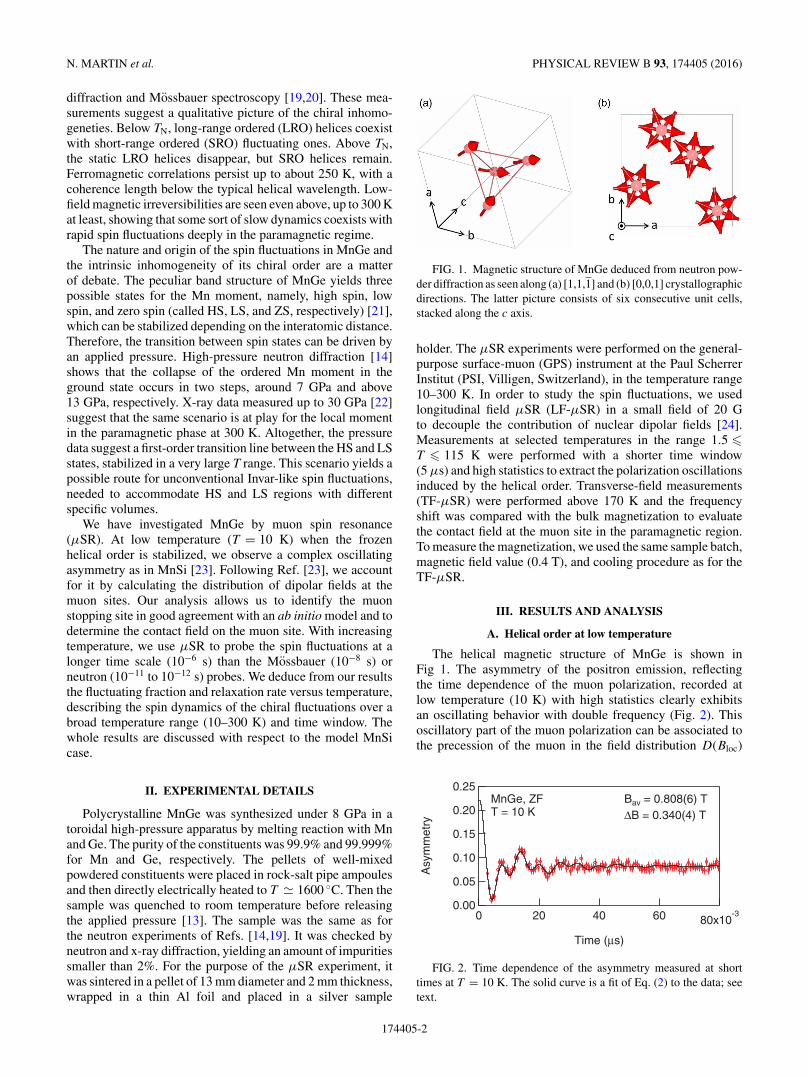
The helical magnetic structure of MnGe is shown inFig 1. The asymmetry of the positron emission, reflectingthe time dependence of the muon polarization, recorded atlow temperature (10 K) with high statistics clearly exhibitsan oscillating behavior with double frequency (Fig. 2). Thisoscillatory part of the muon polarization can be associated tothe precession of the muon in the field distribution D(Bloc)
0.25
0.20
0.15
0.10
0.05
0.00
Asy
mm
etry
80x10-36040200
Time (μs)
MnGe, ZFT = 10 K
Bav = 0.808(6) TΔB = 0.340(4) T
FIG. 2. Time dependence of the asymmetry measured at shorttimes at T = 10 K. The solid curve is a fit of Eq. (2) to the data; seetext.
174405-2
MAGNETIC GROUND STATE AND SPIN FLUCTUATIONS . . . PHYSICAL REVIEW B 93, 174405 (2016)
TABLE I. Coordinates of the muon and its nearest Mn neighbors in the cubic unit cell.
4a site I II III IV
Muon position (xμ,xμ,xμ)(
12 − xμ,xμ, 1
2 + xμ
) (12 + xμ, 1
2 − xμ,xμ
) (xμ, 1
2 + xμ, 12 − xμ
)1
(12 − x,1 − x, 1
2 + x)
(x,x − 1,x + 1) (x + 1,x,x − 1) (x − 1,x + 1,x)
Mn nearest neighbors 2(
12 + x, 1
2 − x,1 − x) (
x − 12 ,x − 1
2 ,1 − x) (
32 − x,x,x − 1
2
) (x − 1
2 ,1 − x,x − 12
)3
(1 − x, 1
2 + x, 12 − x
) (x,x − 1
2 , 32 − x
) (1 − x,x − 1
2 ,x − 12
) (x − 1
2 , 32 − x,x
)
induced by the helical order through
P (t) =∫ Bmax
loc
Bminloc
D(Bloc)
[1
3+ 2
3· cos(γμBloc t)
]dBloc, (1)
where Bminloc (Bmax
loc ) is the minimum (maximum) cutoff fieldvalue (see below) and γμ = 2π · 135.5 MHz T−1 is the muongyromagnetic ratio.
In a first step, P (t) was fitted by the following analyticalexpression, similar to that discussed in Eq. (17) of Ref. [23],which catches the essential features of the field distributionsensed by the muon:
P (t) = A(t) − b
A0 − b
= 2
3J0
(γμ �B t
)cos (γμBav t + ψ) e−λa t + 1
3e−λbt ,
(2)
where A0 = A(t → 0) is the effective initial asymmetry, b =0.007 is a temperature-independent background, J0 is a Besselfunction of the first kind, and ψ is a phase term. Bav and�B are, respectively, the average field and width of the fielddistribution at the muon site.
The two terms of the sum stem from the powder natureof the sample. Assuming random orientation of the helicaldomains and of the corresponding fields at the muon sites, onaverage, two-thirds of the implanted muons precess around afield perpendicular to their spin, whereas one-third of themexperience a field along the initial muon polarization and donot precess. The relaxation rates λa and λb reflect, as usual,static or dynamic effects, which will be discussed in detail inthe next section by considering the full time scale. As in MnSi,the muon is assumed to stop at the Wyckoff position 4a of thespace group P 213 : I , located on the threefold rotation axisand the equivalent II, III, and IV linked by this rotation (seeTable I). This will be justified below by ab initio calculations.According to neutron diffraction data for MnGe, the helicalorder propagates along the [001] (or equivalent) direction,and not the [111] direction as found in MnSi. Therefore,in contrast to MnSi where the muon site 4a-I experiencesa narrower field distribution than the others, the four muonsites are magnetically equivalent in MnGe, with each of themfeeling basically the same local-field distribution.
The width of the field distribution �B stems from thevariation of the Mn moment direction from one cell to anotherinduced by the helical order. A distance equivalent to thehelical wavelength, λH = 2π/|k|, where k is the wave vectorof the helix, is necessary to recover the same local magneticenvironment at a muon site. It corresponds to about six unitcells for MnGe and 40 unit cells for MnSi.
As shown in Fig. 2, Eq. (2) yields a good fit of theexperimental asymmetry. The fast Fourier transform (FFT)of the fitted curve, plotted in Fig. 3, shows the experimental
(a)
(b)
(c)
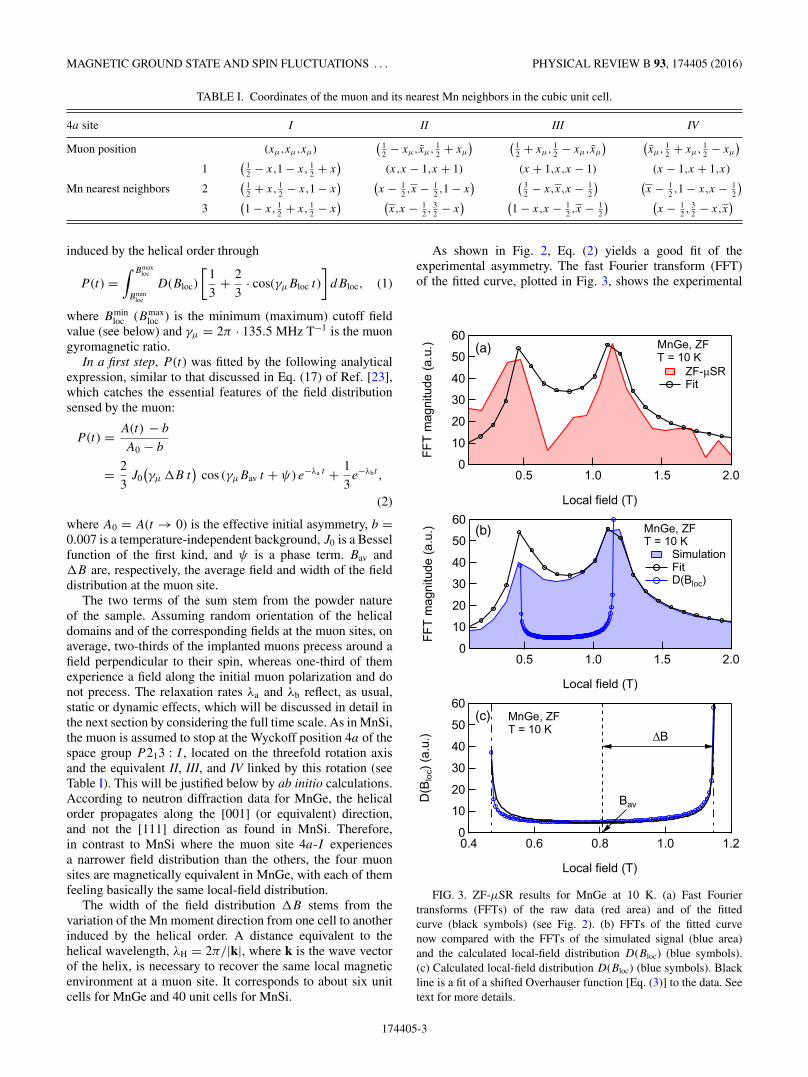
FIG. 3. ZF-μSR results for MnGe at 10 K. (a) Fast Fouriertransforms (FFTs) of the raw data (red area) and of the fittedcurve (black symbols) (see Fig. 2). (b) FFTs of the fitted curvenow compared with the FFTs of the simulated signal (blue area)and the calculated local-field distribution D(Bloc) (blue symbols).(c) Calculated local-field distribution D(Bloc) (blue symbols). Blackline is a fit of a shifted Overhauser function [Eq. (3)] to the data. Seetext for more details.
174405-3
N. MARTIN et al. PHYSICAL REVIEW B 93, 174405 (2016)
distribution of internal fields deduced from this analysis.Following Ref. [23], this distribution can be approximatedby a shifted Overhauser function,
D(Bloc) = 1
π
1√�B2 − (Bloc − Bav)2
, (3)
where Bav = (Bmax + Bmin)/2 and �B = (Bmax − Bmin)/2,with Bmin and Bmax the respective minimum and maximumcutoff values of the local-field distribution. The peak width ofthe experimental field distribution arises from the limited timewindow of the FFT and the disorder inherent to the magneticstructure.
In a second step, the parameters of the field distributionwere refined by performing a numerical calculation of the localfield Bloc at the muon site. The method we used for determiningBloc in MnGe is explained in full detail in Appendix A. For thesake of simplicity, here we reproduce only the main steps.
For a given Rμ vector joining the muon site to a Mn ion,the total field is defined as
Bloc(Rμ) = Bdip(Rμ) + Bcont(Rμ), (4)
where Bdip and Bcont are the dipolar and contact field,respectively. The dipolar field can be expressed as
Bdip(δ) = Cdip · cos δ + Sdip · sin δ, (5)
where the lattice sums Cdip and Sdip are performed over asphere of radius greatly overcoming the helical wavelength(involving typically 106 unit cells) and δ = 2πk · Rμ cantake all values between 0 and 2π for an incommensuratestructure, simulating all possible local environments alongthe spin helices for the muon. The contact field Bcont can beexpressed as
Bcont = Acont
N·
N∑i=1
mi, (6)
where Acont is the contact coupling constant, N = 3 is thenumber of Mn ion’s nearest neighbors of the muon, and mi istheir magnetic moment,
mi = mord · (cos ϕ · a − sin ϕ · b), (7)
where mord is the ordered moment, with a and b being unit basevectors of the cubic unit cell and the minus sign accounting forthe left handedness of the magnetic spirals of MnGe [25]. Thephase term ϕ = 2πk · Rij, where Rij is a Mn-Mn vector, allowscalculating the relative orientation of the Mn moments in the(a,b) plane, perpendicular to the helical wave vector k. Suchan approach yields large canting angle between neighboringMn ions in MnGe (�30◦ between site 4a-I and 4a-II ), asexpected by the strong spin-orbit coupling, while this angleis extremely small in MnSi (�2◦). Weak antiferromagneticmodes induced by the Dzyaloshinskii-Moriya interaction,considered theoretically in Refs. [26,27], could lead to smallout-of-plane tilts of the magnetic moments. They have notbeen detected yet by neutron diffraction and their existencewould not change the conclusions of this paper.
The harmonic approximation of Eq. (7) leads to the samedependence for the dipolar and contact contributions at the
muon site, namely,
Bcont = Ccont · cos δ + Scont · sin δ. (8)
Inserting Eq. (7) in Eq. (6) allows one to calculate the vectorialsums Ccont and Scont, performed over three Mn near neighborsof the muon site (their coordinates are given in Table I).
Experimentally, the distribution of local fields at the muonsite D(Bloc) can be accessed through the real part of a fastFourier transform (FFT) of the early-time zero-field μSR (ZF-μSR) signal [see Eq. (1)]. The result obtained at 10 K is shownin Fig. 3(a) and compared with the FFT of the fit of Eq. (3) tothe data.
In order to check the origin of the derived spectrum,mainly composed of two maxima, we have computed theexpected D(Bloc) in MnGe by setting the magnetic and crystalparameters from the neutron data [14,15] measured on thesame sample at the same temperature (T = 10 K), namely,the lattice constant a = 4.769 A, the fractional coordinate ofthe Mn ions x = 0.138 r.l.u., the helical wavelength λH =28.7 A, and the ordered Mn magnetic moment mord = 1.83μB. For these values, the local-field distribution is calculatedby sampling 104 values of δ, and optimized by a stepwisevariation of the muon site coordinate xμ and the value of thecontact coupling constant Acont. The contact contribution tothe total field is found to be larger than the dipolar one and ithas opposite sign. On average, we evaluate Bcont = −1.08 Tand Bdip = 0.27 T.
In Fig. 3(b), we plot the calculated D(Bloc), which is inexcellent agreement with the experimental one. In addition,we display a simulation of the expected ZF-μSR signal,generated by using the calculated D(Bloc) and consideringthe limited time frame, as well as the observed fast dampingof the measured asymmetry induced by the disorder inherentto the magnetic structure [λa term in Eq. (2)]. These combinedeffects lead to a broadening of the Fourier transform, nicelyreproducing the experimental spectrum [Fig. 3(b)].
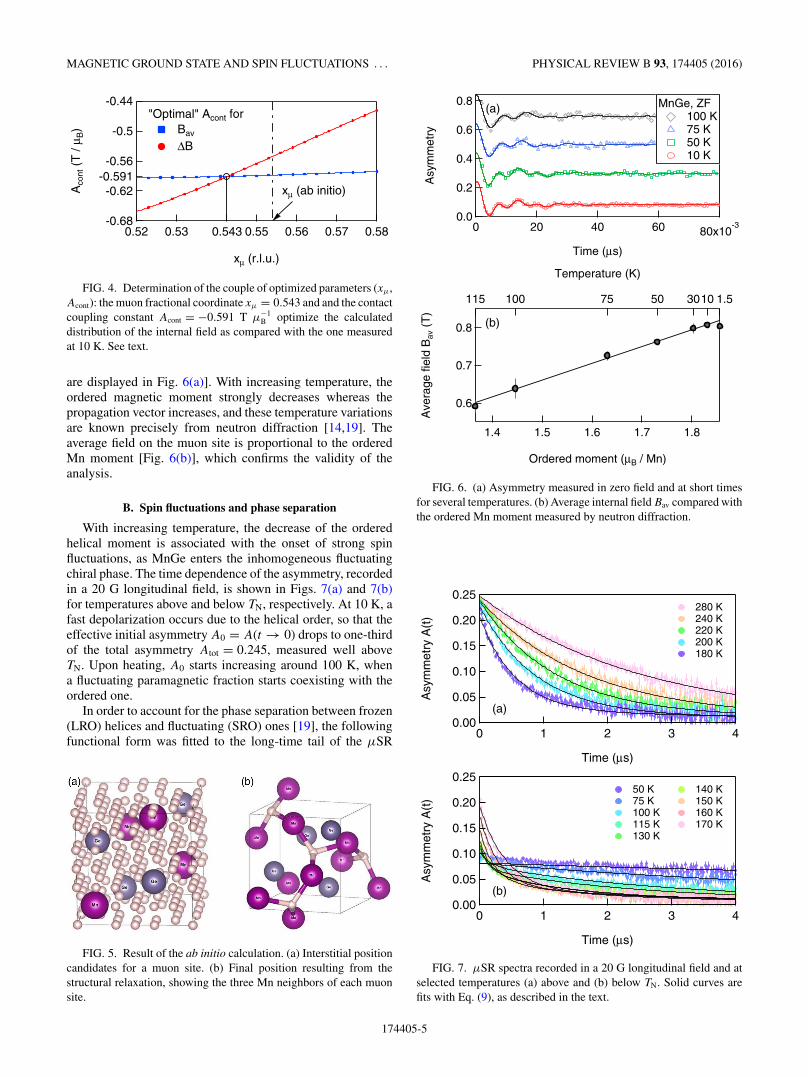
In summary, we find the same field distribution for the fourmuon sites, which is quite close to the Overhauser function[Fig. 3(c)]. The agreement between the calculated distributionand the experimental one deduced by FFT of the μSR signalis very sensitive to the position of the muon site and thevalue of the coupling constant. We find only one couple ofparameters optimizing both the width and average value forthe field distribution (Fig. 4), with values xμ = 0.543 andAcont = −0.591 T μ−1
B . The average field and field distributionare, respectively, B = 0.808(6) T and �B = 0.340(5) T.
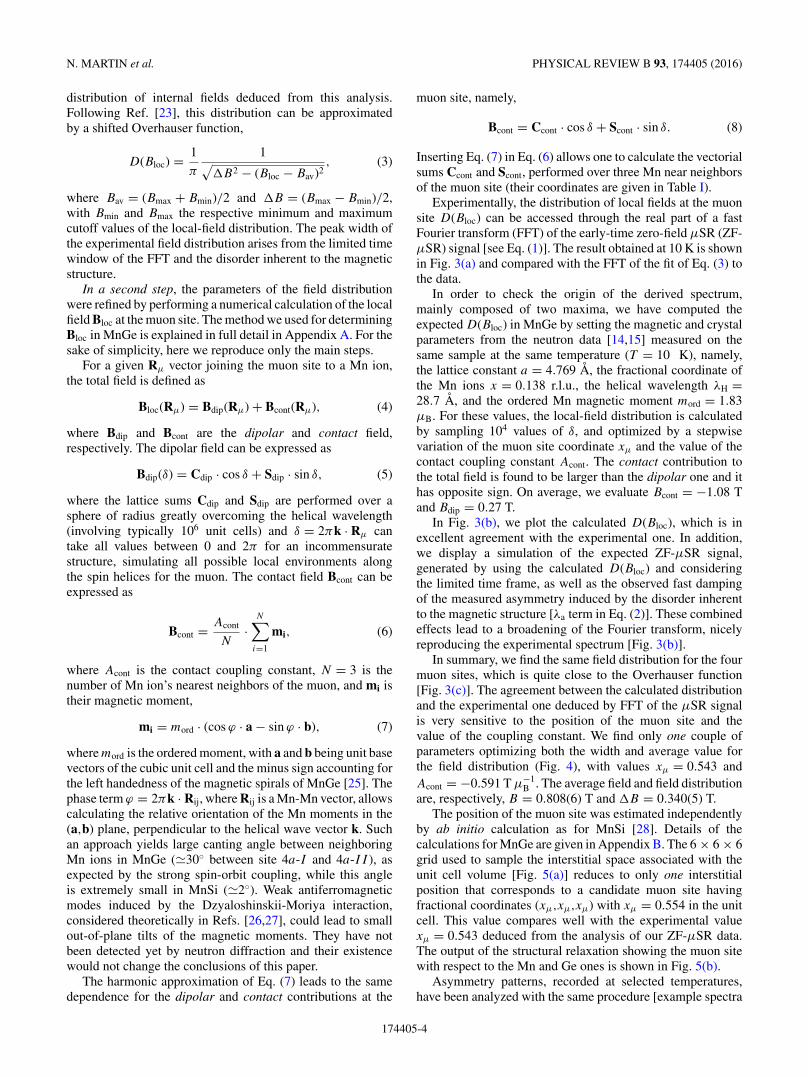
The position of the muon site was estimated independentlyby ab initio calculation as for MnSi [28]. Details of thecalculations for MnGe are given in Appendix B. The 6 × 6 × 6grid used to sample the interstitial space associated with theunit cell volume [Fig. 5(a)] reduces to only one interstitialposition that corresponds to a candidate muon site havingfractional coordinates (xμ,xμ,xμ) with xμ = 0.554 in the unitcell. This value compares well with the experimental valuexμ = 0.543 deduced from the analysis of our ZF-μSR data.The output of the structural relaxation showing the muon sitewith respect to the Mn and Ge ones is shown in Fig. 5(b).
Asymmetry patterns, recorded at selected temperatures,have been analyzed with the same procedure [example spectra
174405-4
MAGNETIC GROUND STATE AND SPIN FLUCTUATIONS . . . PHYSICAL REVIEW B 93, 174405 (2016)
-0.68
-0.62-0.591
-0.56
-0.5
-0.44
Aco
nt (
T /
μ B)
0.52 0.53 0.543 0.55 0.56 0.57 0.58
xμ (r.l.u.)
xμ (ab initio)
"Optimal" Acont for Bav
ΔB
FIG. 4. Determination of the couple of optimized parameters (xμ,Acont): the muon fractional coordinate xμ = 0.543 and and the contactcoupling constant Acont = −0.591 T μ−1
B optimize the calculateddistribution of the internal field as compared with the one measuredat 10 K. See text.
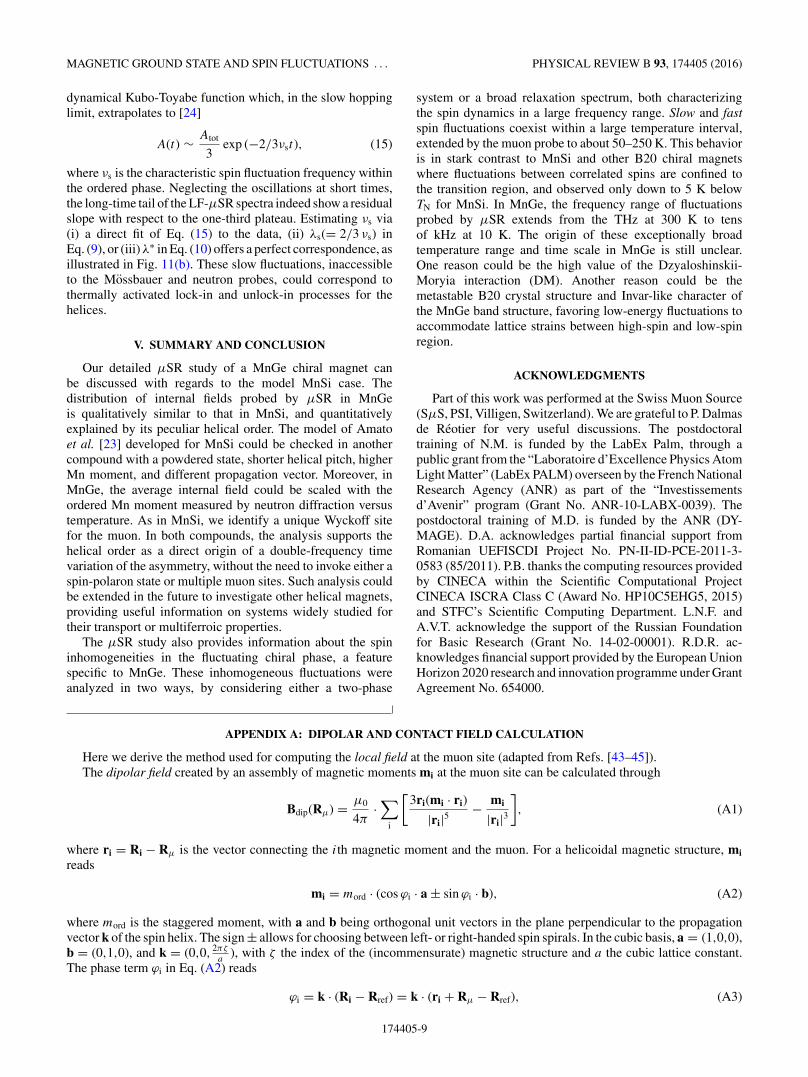
are displayed in Fig. 6(a)]. With increasing temperature, theordered magnetic moment strongly decreases whereas thepropagation vector increases, and these temperature variationsare known precisely from neutron diffraction [14,19]. Theaverage field on the muon site is proportional to the orderedMn moment [Fig. 6(b)], which confirms the validity of theanalysis.
B. Spin fluctuations and phase separation
With increasing temperature, the decrease of the orderedhelical moment is associated with the onset of strong spinfluctuations, as MnGe enters the inhomogeneous fluctuatingchiral phase. The time dependence of the asymmetry, recordedin a 20 G longitudinal field, is shown in Figs. 7(a) and 7(b)for temperatures above and below TN, respectively. At 10 K, afast depolarization occurs due to the helical order, so that theeffective initial asymmetry A0 = A(t → 0) drops to one-thirdof the total asymmetry Atot = 0.245, measured well aboveTN. Upon heating, A0 starts increasing around 100 K, whena fluctuating paramagnetic fraction starts coexisting with theordered one.
In order to account for the phase separation between frozen(LRO) helices and fluctuating (SRO) ones [19], the followingfunctional form was fitted to the long-time tail of the μSR
FIG. 5. Result of the ab initio calculation. (a) Interstitial positioncandidates for a muon site. (b) Final position resulting from thestructural relaxation, showing the three Mn neighbors of each muonsite.
0.8
0.7
0.6
Ave
rage
fiel
d B
av (
T)
1.81.71.61.51.4
Ordered moment (μB / Mn)
1.510305075100115
Temperature (K)
(b)
0.8
0.6
0.4
0.2
0.0
Asy
mm
etry
80x10-36040200
Time (μs)
MnGe, ZF 100 K 75 K 50 K 10 K
(a)
FIG. 6. (a) Asymmetry measured in zero field and at short timesfor several temperatures. (b) Average internal field Bav compared withthe ordered Mn moment measured by neutron diffraction.
0.25
0.20
0.15
0.10
0.05
0.00
Asy
mm
etry
A(t
)
43210
Time (μs)
50 K 140 K 75 K 150 K 100 K 160 K 115 K 170 K 130 K
(b)
0.25
0.20
0.15
0.10
0.05
0.00
Asy
mm
etry
A(t
)
43210
Time (μs)
280 K 240 K 220 K 200 K 180 K
(a)
FIG. 7. μSR spectra recorded in a 20 G longitudinal field and atselected temperatures (a) above and (b) below TN. Solid curves arefits with Eq. (9), as described in the text.
174405-5

N. MARTIN et al. PHYSICAL REVIEW B 93, 174405 (2016)
1.0
0.8
0.6
0.4
0.2
0.0
Flu
ctua
ting
frac
tion
(a)
μSR Mössbauer
10
8
6
4
2
0μ+ r
elax
atio
n ra
te (
MH
z)
50 100 150 TN 200 250 280
Temperature (K)
λf
λs
(b)0.4
0.2
0.0
λ s (
MH
z)
50 75 100 115T (K)
FIG. 8. (a) Fluctuating phase fraction derived from a fit of Eq. (9)to the μSR spectra, in comparison with the paramagnetic fractiondeduced from Mossbauer spectroscopy on a 57Fe-doped MnGesample [19]. (b) Fast and slow relaxation rates obtained through thesame analysis. Inset: Slow fluctuations are observed at a small butfinite rate λs, down to the lowest temperatures. In all panels, lines areguides to the eye.
spectra (t > 0.1 μs) at each temperature:
A(t) = (Atot − b)
[1 − f
3e−λst + f e−λft
]+ b, (9)
where 1 − f and f are the volume fractions of the long-rangeordered and short-range ordered phases, and λs and λf
are the corresponding relaxation rates, associated with slowand fast relaxations, respectively. b is a small temperature-independent background arising from the muons falling intothe sample holder, which was measured and subsequentlyfixed to 7 × 10⁻³. In Eq. (9), one neglects the oscillationsat short times (t < 0.1 μs) discussed in Sec. III A. As shownin Fig. 7, good fits were obtained in the whole temperaturerange. The temperature dependence of the volume fractionf and relaxation rates λs and λf is displayed in Fig. 8. Thevolume fraction associated with the fast relaxation is in goodqualitative agreement with the paramagnetic fraction deducedfrom published Mossbauer data [19]. Below 100 K, the latterbecomes very small (f → 0) and the associated relaxation rateλf becomes less reliable. However, the persistence of magneticfluctuations down to the lowest temperatures is shown by theobservation of a finite value for λs (see inset of Fig. 8).
Instead of a discrete relaxation spectrum composed oftwo well-defined rates, we alternatively considered a broaddistribution of independent relaxation channels, as considered,for instance, in spin glasses [29–31], superparamagnetic parti-cles [32,33], or some frustrated pyrochlore magnets [34–36].In such case, the asymmetry can be described by a continuous
5
4
3
2
1
0
λ* (
MH
z)
50 100 150 TN 200 250 280
Temperature (K)
(b)
0.5
0.75
1
β
50 170 280 T (K)
1.0
0.8
0.6
0.4
0.2
0.0
Fluctuating fraction
0.24
0.20
0.16
0.12Initi
al a
sym
met
ry A
0 (a)
μSR Mössbauer
2.5
2.0
1.5
1.0
0.5
0.0
P( λ
,β)
0.01 0.1 1 10
λ (MHz)
50 K 160 K 75 K 170 K 100 K 180 K 115 K 200 K 130 K 220 K 140 K 240 K 150 K 280 K
(c)
FIG. 9. (a) Effective initial asymmetry of the μSR signal asa function of temperature. The sharp increase of A0 upon heat-ing reflects the melting of the long-range helimagnetic order.(b) Characteristic relaxation rate λ∗ obtained from a fit of Eq. (10) tothe data (main panel), along with the stretching exponent β (inset).(a),(b) Lines are guide to the eye. (c) Calculated relaxation ratesdistribution computed with the help of experimentally found valuesfor λ∗ and β (see text).
sum of exponential decays, usually modeled as a stretchedexponential,
A(t) = (A0 − b)e−(λ∗t)β + b, (10)
where λ∗ is the characteristic muon relaxation rate, β is astretching exponent, and b is defined as explained above.Note that the effective initial asymmetry A0 is now refined,as opposed to Atot which was fixed in Eq. (9). This choiceallows focusing on the spin dynamics of the system onlyby filtering out the fast decay of the measured asymmetryinduced by the magnetic order at low temperature. FittingEq. (10) to the data in the range 50 � T � 280 K yields anequally good statistical agreement as compared with the twofractions model. The parameters derived from this procedureare displayed in Figs. 9(a) and 9(b).
The thermal evolution of A0 is known to be very sensitiveto the onset of long-range magnetic order [37]. Indeed, inMnGe, A0 is found to saturate at a value A0(T > TN) = Atot =
174405-6

MAGNETIC GROUND STATE AND SPIN FLUCTUATIONS . . . PHYSICAL REVIEW B 93, 174405 (2016)
0.245 above TN, and to drop to about one-third of this valuein a 70 K interval below TN, in perfect agreement with theneutron diffraction results of Ref. [19]. In order to describe theoverall muon relaxation spectrum described by Eq. (10), wefollow the procedure detailed in Ref. [38] where the probabilitydistribution function P (λ) is introduced and defined as
1
λ∗
∫ ∞
0P (λ,β)e−λ t dλ = e−(λ∗t)β . (11)
Since 0.5 � β � 1 [see inset of Fig. 9(b)], λ∗ can be regardedas an accurate estimate of the median of P (λ,β) in the wholetemperature range. We thus retain this value as representativeof the probed physics and will use it in our evaluation ofthe electronic spin fluctuation frequencies (Sec. IV). Forthe sake of completeness, we display calculated P (λ,β) inFig. 9(c), allowing one to follow the evolution of the shape ofthe relaxation spectrum as a function of temperature. Whilebroadened spectra are observed up to about 220 K, a Dirac δ
function—corresponding to a single-frequency spectrum—isrecovered at higher temperatures, when magnetic correlationsare becoming small with respect to the thermal energy.
As a partial conclusion, we stress that irrespective of themodel used to describe the long time LF-μSR spectra, ourdata strongly indicate that spin fluctuations are surviving deepinside the magnetically ordered phase, at odds with otherknown cubic Dzyaloshinskii-Moriya helimagnets.
C. Transverse-field measurements in the paramagnetic regime
In a magnetic field H perpendicular to its initial momentum,the muon spin precesses with a frequency ν related tothe susceptibility of the bulk material. A typical spectrummeasured in MnGe in the paramagnetic regime with a fieldof 0.4 T is shown in the inset of Fig. 10. The frequency shiftν0 − ν with respect to the frequency ν0 = 54.2 MHz in the Agsample holder can be expressed as
ν0 − ν = γμ
2π〈Bloc〉, (12)
0
0.1
0.2
0.3
χM (em
u.mol -1.O
e-1)
300280260240220200180Temperature (K)
0
0.2
0.4
Rel
ativ
e fr
eque
ncy
shift
(ν 0
- ν)/
ν 0
MnGe, H = 0.4 T
-0.2
0.0
0.2
Asy
mm
etry
0.30.20.10.0Time (μs)
FIG. 10. Relative frequency shift (ν0 − ν)/ν0 (red squares, leftscale) deduced from TF-μSR spectra measured in the paramagneticregime, in comparison with the macroscopic susceptibility (bluecircles, right scale). Both sets of data were measured at 0.4 T. Atypical TF-μSR spectrum taken at 240 K is shown in the inset.
where the local field
Bloc = Bext + Bcont + Bdip + BLor + Bdem (13)
involves terms corresponding to the applied, contact, dipolar,Lorentz, and demagnetizing fields, respectively, which must beaveraged over all orientations. Due to this average, the contri-bution of the dipolar term cancels, and the contact term reducesto Bcont = Acont χM H , where χM is the isotropic susceptibilityof a MnGe mole of volume VM, and Acont is the isotropicaverage of the hyperfine contact tensor. The demagnetizing andLorentz fields are, respectively, equal to Bdem = −4π N
χM
VMH
and BLor = 4π3
χM
VMH . As shown in Fig. 10, the temperature
dependence of the μSR shift compares well with that ofthe macroscopic susceptibility. Assuming a demagnetizationfactor corresponding to the shape of the sintered pellet used inour experiment (N � 0.8), we obtain a contact coupling con-stant Acont = −0.45(11) T μ−1
B from the measured frequencyand macroscopic susceptibility (ν = 48.7 MHz and χM =8.3 × 10⁻² emu mol−1 Oe−1 at 240 K). On the other hand, ifwe consider a distribution of individual grain shapes within thesample, with 0 � N � 1 in the extreme case, we end up withAcont = −0.6(2) T μ−1
B , a value in even closer agreement withour experimental determination by ZF-μSR (see Sec. III A).
IV. DISCUSSION
The origin of multiple frequency oscillations in μSR spectrais usually ascribed to magnetic unequivalent muon stoppingsites, as it occurs, for instance, in a Cu2OSeO3 helical mag-net [39,40]. An alternative explanation previously proposed inMnSi considers the formation of a spin-polaron state, made bya localized electron state mediating ferromagnetic interactionswith the neighboring magnetic ions, and inducing two differentstates for the muon [41]. Here we can exclude the presence ofcrystallographic unequivalent muon sites. The two-frequencyasymmetry observed in ZF-μSR is attributed to the fielddistribution on a given muon site induced by the helical order,and the approach of Ref. [23] in a MnSi single crystal issupported in MnGe with polycrystalline form, shorter helicalperiod, higher moment, and different local symmetry inducedby the propagation vector. In MnGe, the magnetic environmentof the Mn neighbors is also far from the ferromagnetic dropletrequired to localize an electron because of the large cantingbetween near-neighbor Mn moments.
In contrast with MnSi where the muon sitting at the site 4a I
Wickoff site experiences a unique field, in MnGe the muonson the four 4a Wickoff sites feel the same field distribution.The fitted position of the muon site xμ = 0.543 compareswell with the value xμ = 0.554 deduced from the ab initiomodel. At low temperature (T TN), the average field andwidth of the field distribution in MnGe can be compared withthe values relative to the sites II, III, and IV in MnSi (seeTable II). The average field is much larger in MnGe thanin MnSi (BMnGe
av /BMnSiav ∼ 5), roughly reflecting the ratio of
dipolar contributions mord/a3 ∼ 4. On the other hand, the
relative widths of the field distributions η = �B/Bav are onlyslightly different, namely, ηMnGe/ηMnSi � 1.15. Indeed, if wewould expect measuring a broader local-field distribution fora magnetic structure having a longer periodicity, we must alsoaccount for the different ordered moment values. This implies
174405-7

N. MARTIN et al. PHYSICAL REVIEW B 93, 174405 (2016)
TABLE II. Comparison of structural, magnetic, and ZF-μSR datafor MnGe and MnSi. In the case of MnSi, Bav and �B are consideredfor site II only (see Ref. [23]).
MnGe (10 K) MnSi (5 K)
TN (K) 170 29.5a (A) 4.769 4.558λH (A) 28.7 180mord (μB/Mn) 1.83 0.4|Bav| (T) 0.808(6) 0.152�B (T) 0.340(5) 0.056�B/|Bav| 0.42 0.37Acont
(T μ−1
B
) −0.591 −0.518xμ (r.l.u) 0.543 0.532
a scaling of the form η ∝ 1/(mord · λH) which, given thematerial-specific parameters in Table II, yields ηMnGe/ηMnSi �1.37, in agreement with the experimental value.
In both MnGe and MnSi, the dominant contribution to thelocal field measured by LF-μSR is played by the contact term.As for the contact coupling constants Acont, we find very similarvalues in MnGe and MnSi (∼−0.55 T μ−1
B ) from the analysisof the LF-μSR spectra measured in the ordered state at lowtemperature. The value found for MnGe by TF-μSR in the ap-plied field in the paramagnetic state (∼−0.45 T μ−1
B ) is slightlysmaller, but entailed by a large error bar due to the uncertaintyon the demagnetization factor for a powdered sample.
The time dependence of the asymmetry in the full timewindow reflects the spin fluctuations in the inhomogeneouschiral phase. Assuming a dynamical phase separation inMnGe, μSR probes two different electronic relaxation ratesfor the Mn moments, reflected in typical values of the muonrelaxation rates differing by more than an order of magnitude.The phase ratio between the slow and fast fluctuating fractionscan be compared with the ratio of “frozen” to “paramagnetic”fractions deduced from Mossbauer spectroscopy. The latterprobes a shorter and narrower time window (10−7 to 10−9 s)than μSR, but the qualitative agreement is very good. A morephenomonological description, assuming a broad distributionof frequencies with a shape evolving with temperature [astraced by the change of stretching exponent β(T ) in Fig. 9(b)]is also compatible with the μSR data, and it might explainwhy in the Mossbauer spectroscopy with narrow time window,one does not observe any relaxing behavior. The plateau valuereached by the stretched exponent below TN (β = 0.5) has beenobserved both in dilute spin glasses due to random fields [42]and in geometrically frustrated magnets [36].
Altogether, fast and slow spin fluctuations can coexistover a temperature range extended by the muon probe toabout 50–250 K, which is a huge range with respect toother chiral magnets. We relate the slow dynamics to LROhelices and the fast one to SRO helices or ferromagneticcorrelations (namely, incomplete helices), recalling that bothhave been observed, coexisting in the same temperature range,by neutron diffraction [19] and small-angle scattering [20]. Wetentatively attribute the origin of this magnetic inhomogeneityin a chemically pure compound to the peculiar MnGe bandstructure and quenched state, inducing metastable low-spinstates in a dominant high-spin state.
0.8
0.6
0.4
0.2
0.0
ν s (
MH
z)100806040200
Temperature (K)
3/2 λs
λ* Kubo-Toyabe
(b)
2.5
2.0
1.5
1.0
0.5
0.0
ν f (
TH
z)
150 TN 200 250 280
Temperature (K)
From Eq. 14 with λ = λf
λ = λ*
(a)
FIG. 11. (a) Thermal evolution of the fast spin fluctuationfrequency νf , derived from our LF-μSR measurements by virtue ofEq. (14). (b) Slow fluctuations frequency as a function of temperatureobtained in the low-temperature limit. Solid line are guides to the eye.
In the paramagnetic regime, in the limit of fast fluctuations,the muon relaxation rate λ is related to the typical electronicspin fluctuation frequency νf by
λ = 2γ 2μ〈B2〉νf
, (14)
where 〈B2〉 is the second moment of the distribution offluctuating field experienced by the muons [24]. In the simplestcase, the random fluctuations of the magnetic moments wellabove TN yield an average field 〈B〉 = 0 and a width ofthe field distribution 〈B2〉 � B2
av, where Bav � 0.8 T is theinternal field measured at low temperature. This yields atypical frequency of the fluctuations νf ∼ 2.5 THz at 300 K,a frequency range which could be probed, e.g., by inelasticneutron scattering. With decreasing temperature, the increaseof λf [Fig. 8(b)] or λ∗ [Fig. 9(b)] reflects the slowing down ofthe fluctuations when approaching the transition. The evolutionof the fluctuation frequency derived from Eq. (14) is illustratedin Fig. 11. In the paramagnetic regime, νf is a monotonouslyincreasing function of temperature [Fig. 11(a)]. Below TN,the μSR signal becomes quickly dominated by the growingordered fraction within the sample. In order to get deeperinsight into the critical dynamics of MnGe, one should usespace-resolved techniques which allows determining the Q
dependence of the relaxation spectrum in contrast to localprobes such as μSR or Mossbauer, where all length scalescontribute to the signal.
Conversely, in the ordered regime at low temperature,the residual fluctuations probed by the muon in an almoststatic distribution of internal fields can be modeled by the
174405-8
MAGNETIC GROUND STATE AND SPIN FLUCTUATIONS . . . PHYSICAL REVIEW B 93, 174405 (2016)
dynamical Kubo-Toyabe function which, in the slow hoppinglimit, extrapolates to [24]
A(t) ∼ Atot
3exp (−2/3νst), (15)
where νs is the characteristic spin fluctuation frequency withinthe ordered phase. Neglecting the oscillations at short times,the long-time tail of the LF-μSR spectra indeed show a residualslope with respect to the one-third plateau. Estimating νs via(i) a direct fit of Eq. (15) to the data, (ii) λs(= 2/3 νs) inEq. (9), or (iii) λ∗ in Eq. (10) offers a perfect correspondence, asillustrated in Fig. 11(b). These slow fluctuations, inaccessibleto the Mossbauer and neutron probes, could correspond tothermally activated lock-in and unlock-in processes for thehelices.
V. SUMMARY AND CONCLUSION
Our detailed μSR study of a MnGe chiral magnet canbe discussed with regards to the model MnSi case. Thedistribution of internal fields probed by μSR in MnGeis qualitatively similar to that in MnSi, and quantitativelyexplained by its peculiar helical order. The model of Amatoet al. [23] developed for MnSi could be checked in anothercompound with a powdered state, shorter helical pitch, higherMn moment, and different propagation vector. Moreover, inMnGe, the average internal field could be scaled with theordered Mn moment measured by neutron diffraction versustemperature. As in MnSi, we identify a unique Wyckoff sitefor the muon. In both compounds, the analysis supports thehelical order as a direct origin of a double-frequency timevariation of the asymmetry, without the need to invoke either aspin-polaron state or multiple muon sites. Such analysis couldbe extended in the future to investigate other helical magnets,providing useful information on systems widely studied fortheir transport or multiferroic properties.
The μSR study also provides information about the spininhomogeneities in the fluctuating chiral phase, a featurespecific to MnGe. These inhomogeneous fluctuations wereanalyzed in two ways, by considering either a two-phase
system or a broad relaxation spectrum, both characterizingthe spin dynamics in a large frequency range. Slow and fastspin fluctuations coexist within a large temperature interval,extended by the muon probe to about 50–250 K. This behavioris in stark contrast to MnSi and other B20 chiral magnetswhere fluctuations between correlated spins are confined tothe transition region, and observed only down to 5 K belowTN for MnSi. In MnGe, the frequency range of fluctuationsprobed by μSR extends from the THz at 300 K to tensof kHz at 10 K. The origin of these exceptionally broadtemperature range and time scale in MnGe is still unclear.One reason could be the high value of the Dzyaloshinskii-Moryia interaction (DM). Another reason could be themetastable B20 crystal structure and Invar-like character ofthe MnGe band structure, favoring low-energy fluctuations toaccommodate lattice strains between high-spin and low-spinregion.
ACKNOWLEDGMENTS
Part of this work was performed at the Swiss Muon Source(SμS, PSI, Villigen, Switzerland). We are grateful to P. Dalmasde Reotier for very useful discussions. The postdoctoraltraining of N.M. is funded by the LabEx Palm, through apublic grant from the “Laboratoire d’Excellence Physics AtomLight Matter” (LabEx PALM) overseen by the French NationalResearch Agency (ANR) as part of the “Investissementsd’Avenir” program (Grant No. ANR-10-LABX-0039). Thepostdoctoral training of M.D. is funded by the ANR (DY-MAGE). D.A. acknowledges partial financial support fromRomanian UEFISCDI Project No. PN-II-ID-PCE-2011-3-0583 (85/2011). P.B. thanks the computing resources providedby CINECA within the Scientific Computational ProjectCINECA ISCRA Class C (Award No. HP10C5EHG5, 2015)and STFC’s Scientific Computing Department. L.N.F. andA.V.T. acknowledge the support of the Russian Foundationfor Basic Research (Grant No. 14-02-00001). R.D.R. ac-knowledges financial support provided by the European UnionHorizon 2020 research and innovation programme under GrantAgreement No. 654000.
APPENDIX A: DIPOLAR AND CONTACT FIELD CALCULATION
Here we derive the method used for computing the local field at the muon site (adapted from Refs. [43–45]).The dipolar field created by an assembly of magnetic moments mi at the muon site can be calculated through
Bdip(Rμ) = μ0
4π·∑
i
[3ri(mi · ri)
|ri|5− mi
|ri|3], (A1)
where ri = Ri − Rμ is the vector connecting the ith magnetic moment and the muon. For a helicoidal magnetic structure, mireads
mi = mord · (cos ϕi · a ± sin ϕi · b), (A2)
where mord is the staggered moment, with a and b being orthogonal unit vectors in the plane perpendicular to the propagationvector k of the spin helix. The sign ± allows for choosing between left- or right-handed spin spirals. In the cubic basis, a = (1,0,0),b = (0,1,0), and k = (0,0,
2πζ
a), with ζ the index of the (incommensurate) magnetic structure and a the cubic lattice constant.
The phase term ϕi in Eq. (A2) reads
ϕi = k · (Ri − Rref) = k · (ri + Rμ − Rref), (A3)
174405-9

N. MARTIN et al. PHYSICAL REVIEW B 93, 174405 (2016)
where Rref is the position of a reference magnetic ion (i.e., for which α = 0). Thus, the cosine and sine terms in (A2) can berewritten owing to trigonometric identities,
Bdip(Rμ
) = mord · μ0/4π
× cos(k · Rμ
)⎧⎪⎪⎪⎪⎨⎪⎪⎪⎪⎩
∑i
cos (k · [ri − Rref]) ·[
3ri · (a · ri)
|ri|5− a
|ri|3]
±∑
i
sin (k · [ri − Rref]) ·[
3ri · (b · ri)
|ri|5− b
|ri|3]
︸ ︷︷ ︸Cdip
⎫⎪⎪⎪⎪⎬⎪⎪⎪⎪⎭
+ sin(k · Rμ
)⎧⎪⎪⎪⎪⎨⎪⎪⎪⎪⎩
±∑
i
sin (k · [ri − Rref]) ·[
3ri · (a · ri)
|ri|5− a
|ri|3]
±∑
i
cos (k · [ri − Rref]) ·[
3ri · (b · ri)
|ri|5− b
|ri|3]
︸ ︷︷ ︸Sdip
⎫⎪⎪⎪⎪⎬⎪⎪⎪⎪⎭
(A4)
Owing to the fact that we are dealing with an incommensurate structure, one can replace the argument k · Rμ by the continuousvariable δ, taking all values between 0 and 2π . The dipolar field at the muon site eventually reads
Bdip(Rμ) = Cdip · cos δ + Sdip · sin δ. (A5)
The advantage in using this form is that the lattice sums Cdip and Sdip in Eq. (A4) need to be computed only once. A directnumerical application will converge to better than 0.1% within a sphere containing more than �105 unit cells, or even faster bymaking use of Ewald’s summation method.
For computing the contact field, we make use of Eq. (6) from the main text. Using Eq. (A2) for describing the magneticmoments of the three Mn ions nearest neighbors of the muon (see also Table I), we end up with a similar expression as Eq. (A5),namely,
Bcont(Rμ) = (Ccont · cos δ + Scont · sin δ), (A6)
with
Ccont = Acont · mord
N
{N∑
i=1
cos (k · [ri − Rref]) · a ±N∑
i=1
sin (k · [ri − Rref]) · b
},
(A7)
Scont = Acont · mord
N
{±
N∑i=1
sin (k · [ri − Rref]) · b ±N∑
i=1
cos (k · [ri − Rref]) · a
},
where Acont is the contact coupling constant. The sums inEq. (A7) run over the N Mn ions, which are the nearestneighbors of the muon. In the case of MnGe, where bothmuons and Mn ions are sitting on the 4a site of the spacegroup P 213, N = 3.
Note that Acont is given in T μ−1B throughout the paper.
For comparison with data reported in Ref. [23], it is, however,possible to express it in mol emu−1 via Acont[mol emu−1] =104/(NA · μB) · Acont[T μ−1
B ] � 1.791 · Acont[T μ−1B ], where
we have used the Avogadro numberNA = 6.022 × 10²³ mol−1
and the Bohr magneton μB = 9.274 × 10⁻²¹ emu. The factor104 is due to conversion from the SI to the CGS unit system(i.e., 1 T = 104 G).
The (total) local field will finally be obtained as
Bloc(Rμ) = Bdip(Rμ) + Bcont(Rμ)
= (Cdip + Ccont) · cos δ + (Sdip + Scont) · sin δ.
(A8)
Note that for our numerical calculations, we have sampled104 values of δ, which results in the distribution displayed inFig. 3.
APPENDIX B: AB INITIO CALCULATIONS
We have estimated the electronic structure of MnGe withdensity functional theory (DFT) as implemented in the ab initiopackage QUANTUM ESPRESSO [46], which uses a plane-wave basis set and the pseudopotential approach to removechemically inactive core electrons from the description. Thegeneralized gradient approximation [47] (GGA) was used toestimate the exchange and correlation potential, and the ultra-soft pseudopotentials [48] of the GBRV library [49] providedan optimal compromise between efficiency and accuracy. Thebasis set was expanded up to a kinetic energy cutoff of 70 Ryand 60 Ry for the unit cell and the supercell simulations,respectively, and up to 500 Ry for the charge density. Thereciprocal space was sampled with a 8 × 8 × 8 Monkhorst-
174405-10

MAGNETIC GROUND STATE AND SPIN FLUCTUATIONS . . . PHYSICAL REVIEW B 93, 174405 (2016)
Pack (MP) grid [50]. The reciprocal space of the supercellscontaining 32 formula units (f.u.) was sampled with theBaldereshi point [51] when performing structural relaxations.A 4 × 4 × 4 MP grid was used when analyzing the effect ofthe impurity on the magnetic properties of the system (videinfra). The relaxed unit cell obtained with these parametershas a lattice constant of 4.763 A, in very good agreementwith experimental estimations. DFT simulations also correctlyaccounted for the high-spin to low-spin transition discussedin Ref. [21]. The magnetic moment per f.u. in the high-spinconfiguration is 2.02 μB, while it reduces to about 1 μB inthe low-spin state, in agreement with previously publishedresults [21].
The identification of the muon site was conducted with themethod discussed in Refs. [28,52–54]. The muon was modeledas a hydrogen atom. A supercell containing 32 f.u. was usedto identify the candidate muon sites, which are provided bythe structural relaxation of the system containing the impurity.In order to sample the interstitial space of the unit cell, asalready mentioned in Sec. III, we first set up a 6 × 6 × 6grid of interstitial positions for the impurity to be used as astarting configuration for the structural relaxation. We laterremoved the positions that were too close (less than 1 A) toone of the atoms of the hosting material and we finally got ridof all symmetry-equivalent initial positions. This eventuallyled to a set of 14 initial positions for the impurity. Thelocation of the atoms and of the impurity were optimized(keeping the lattice parameter fixed) until forces were lower
than 0.5 × 10⁻³ Ry/Bohr and the total-energy differencebetween self-consistent field steps was less than 1 × 10⁻⁴ Ry.All 14 structural relaxations converged to one symmetryequivalent position, which is described in the text and shown inFig. 5.
Recent DFT results [55] brought back the attention on the“passivity” of the muon probe, showing that in some peculiarcompounds, the muon can conceal the material response asa result of the perturbation introduced by its positive charge.We have verified that this is not the case for MnGe. Indeed,differently from the striking effect of pressure discussed above,in the supercell simulations the muon’s perturbation producesdetectable structural displacements that, however, are morepronounced for Ge and are always smaller than 0.12 A [56].These small dislocations lead to negligible modifications ofthe magnetic moment of the Mn atoms surrounding the muon,confirming the validity of μSR results.
Using the double adiabatic approximation [28], we esti-mated the muon’s ground-state motion energy and the corre-sponding wave function. We used both Dirichlet and periodicboundary conditions to solve the Schrodinger equation for themuon in the potential obtained from the interpolation of apoint cloud surrounding the muon and we obtained, with bothapproaches, EGS = 0.57 eV. Since the energy barrier betweenthe neighboring muon sites is twice as high, the expected ratefor a thermally activated muon diffusion process is negligible,in agreement with the experimental results performed up toroom temperature.
[1] T. Moriya and A. Kawabata, J. Phys. Soc. Jpn. 34, 639 (1973).[2] C. Pfleiderer, D. Reznik, L. Pintschovius, H. v. Lohneysen, M.
Garst, and A. Rosch, Nature (London) 427, 227 (2004).[3] P. Pedrazzini, H. Wilhelm, D. Jaccard, T. Jarlborg, M. Schmidt,
M. Hanfland, L. Akselrud, H. Q. Yuan, U. Schwarz, Y. Grinet al., Phys. Rev. Lett. 98, 047204 (2007).
[4] C. Pappas, E. Lelievre-Berna, P. Falus, P. M. Bentley, E.Moskvin, S. Grigoriev, P. Fouquet, and B. Farago, Phys. Rev.Lett. 102, 197202 (2009).
[5] A. Hamann, D. Lamago, T. Wolf, H. v. Lohneysen, and D.Reznik, Phys. Rev. Lett. 107, 037207 (2011).
[6] U. K. Roßler, A. N. Bogdanov, and C. Pfleiderer, Nature(London) 442, 797 (2006).
[7] H. Wilhelm, M. Baenitz, M. Schmidt, C. Naylor, R. Lortz, U. K.Roßler, A. A. Leonov, and A. N. Bogdanov, J. Phys. Condens.Matter 24, 294204 (2012).
[8] S. Muhlbauer, B. Binz, F. Jonietz, C. Pfleiderer, A. Rosch, A.Neubauer, R. Georgii, and P. Boni, Science 323, 915 (2009).
[9] S. V. Grigoriev, S. V. Maleyev, E. V. Moskvin, V. A. Dyadkin,P. Fouquet, and H. Eckerlebe, Phys. Rev. B 81, 144413 (2010).
[10] M. Janoschek, M. Garst, A. Bauer, P. Krautscheid, R. Georgii,P. Boni, and C. Pfleiderer, Phys. Rev. B 87, 134407 (2013).
[11] S. A. Brazovskii, Sov. Phys. JETP 41, 85 (1975).[12] X. Z. Yu, Y. Onose, N. Kanazawa, J. H. Park, J. H. Han, Y.
Matsui, N. Nagaosa, and Y. Tokura, Nature (London) 465, 901(2010).
[13] A. Tsvyashchenko, J. Less Common Metals 99, L9 (1984).[14] M. Deutsch, O. L. Makarova, T. C. Hansen, M. T. Fernandez-
Diaz, V. A. Sidorov, A. V. Tsvyashchenko, L. N. Fomicheva, F.
Porcher, S. Petit, K. Koepernik et al., Phys. Rev. B 89, 180407(2014).
[15] O. L. Makarova, A. V. Tsvyashchenko, G. Andre, F. Porcher,L. N. Fomicheva, N. Rey, and I. Mirebeau, Phys. Rev. B 85,205205 (2012).
[16] N. Kanazawa, Y. Onose, T. Arima, D. Okuyama, K. Ohoyama,S. Wakimoto, K. Kakurai, S. Ishiwata, and Y. Tokura, Phys. Rev.Lett. 106, 156603 (2011).
[17] Y. Shiomi, N. Kanazawa, K. Shibata, Y. Onose, and Y. Tokura,Phys. Rev. B 88, 064409 (2013).
[18] N. Kanazawa, J.-H. Kim, D. S. Inosov, J. S. White, N.Egetenmeyer, J. L. Gavilano, S. Ishiwata, Y. Onose, T. Arima,B. Keimer et al., Phys. Rev. B 86, 134425 (2012).
[19] M. Deutsch, P. Bonville, A. V. Tsvyashchenko, L. N. Fomicheva,F. Porcher, F. Damay, S. Petit, and I. Mirebeau, Phys. Rev. B90, 144401 (2014).
[20] E. Altynbaev, S.-A. Siegfried, V. Dyadkin, E. Moskvin, D.Menzel, A. Heinemann, C. Dewhurst, L. Fomicheva, A.Tsvyashchenko, and S. Grigoriev, Phys. Rev. B 90, 174420(2014).
[21] U. K. Rossler, J. Phys.: Conf. Ser. 391, 012104 (2012).[22] N. Martin, I. Mirebeau, M. Deutsch, J.-P. Itie, J.-P. Rueff, U.
Rossler, K. Koepernik, L. Fomicheva, and A. Tsvyashchenko,arXiv:1601.05332v1.
[23] A. Amato, P. Dalmas de Reotier, D. Andreica, A. Yaouanc,A. Suter, G. Lapertot, I. M. Pop, E. Morenzoni, P. Bonfa, F.Bernardini et al., Phys. Rev. B 89, 184425 (2014).
[24] R. S. Hayano, Y. J. Uemura, J. Imazato, N. Nishida, T. Yamazaki,and R. Kubo, Phys. Rev. B 20, 850 (1979).
174405-11

N. MARTIN et al. PHYSICAL REVIEW B 93, 174405 (2016)
[25] S. V. Grigoriev, N. M. Potapova, S.-A. Siegfried, V. A. Dyadkin,E. V. Moskvin, V. Dmitriev, D. Menzel, C. D. Dewhurst, D.Chernyshov, R. A. Sadykov et al., Phys. Rev. Lett. 110, 207201(2013).
[26] V. A. Chizhikov and V. E. Dmitrienko, Phys. Rev. B 85, 014421(2012).
[27] V. E. Dmitrienko and V. A. Chizhikov, Phys. Rev. Lett. 108,187203 (2012).
[28] P. Bonfa, F. Sartori, and R. D. Renzi, J. Phys. Chem. C 119,4278 (2015).
[29] I. A. Campbell, A. Amato, F. N. Gygax, D. Herlach, A. Schenck,R. Cywinski, and S. H. Kilcoyne, Phys. Rev. Lett. 72, 1291(1994).
[30] A. Keren, P. Mendels, I. A. Campbell, and J. Lord, Phys. Rev.Lett. 77, 1386 (1996).
[31] R. M. Pickup, R. Cywinski, C. Pappas, B. Farago, and P.Fouquet, Phys. Rev. Lett. 102, 097202 (2009).
[32] R. I. Bewley and R. Cywinski, Phys. Rev. B 58, 11544(1998).
[33] T. J. Jackson, C. Binns, E. M. Forgan, E. Morenzoni, C.Niedermayer, H. Gluckler, A. Hofer, H. Luetkens, T. Prokscha,T. M. Riseman et al., J. Phys. Condens. Matter 12, 1399 (2000).
[34] F. Bert, P. Mendels, A. Olariu, N. Blanchard, G. Collin, A.Amato, C. Baines, and A. D. Hillier, Phys. Rev. Lett. 97, 117203(2006).
[35] P. Dalmas de Reotier, A. Yaouanc, L. Keller, A. Cervellino, B.Roessli, C. Baines, A. Forget, C. Vaju, P. C. M. Gubbens, A.Amato et al., Phys. Rev. Lett. 96, 127202 (2006).
[36] H. Guo, H. Xing, J. Tong, Q. Tao, I. Watanabe, and Z. an Xu,J. Phys. Condens. Matter 26, 436002 (2014).
[37] P. D. de Reotier and A. Yaouanc, J. Phys. Condens. Matter 9,9113 (1997).
[38] D. C. Johnston, Phys. Rev. B 74, 184430 (2006).[39] A. Maisuradze, Z. Guguchia, B. Graneli, H. M. Rønnow, H.
Berger, and H. Keller, Phys. Rev. B 84, 064433 (2011).
[40] T. Lancaster, R. C. Williams, I. O. Thomas, F. Xiao, F. L. Pratt,S. J. Blundell, J. C. Loudon, T. Hesjedal, S. J. Clark, P. D. Hattonet al., Phys. Rev. B 91, 224408 (2015).
[41] V. G. Storchak, J. H. Brewer, R. L. Lichti, T. A. Lograsso, andD. L. Schlagel, Phys. Rev. B 83, 140404 (2011).
[42] Y. J. Uemura, T. Yamazaki, D. R. Harshman, M. Senba, and E.J. Ansaldo, Phys. Rev. B 31, 546 (1985).
[43] D.-A. Andreica, Ph.D. thesis, ETH Zurich, 2001.[44] A. Schenck, D. Andreica, F. N. Gygax, and H. R. Ott, Phys. Rev.
B 65, 024444 (2001).[45] A. Schenck, F. N. Gygax, and Y. Onuki, Phys. Rev. B 68, 104422
(2003).[46] P. Giannozzi, S. Baroni, N. Bonini, M. Calandra, R. Car, C.
Cavazzoni, D. Ceresoli, G. L. Chiarotti, M. Cococcioni, I. Daboet al., J. Phys. Condens. Matter 21, 395502 (2009).
[47] J. P. Perdew, K. Burke, and M. Ernzerhof, Phys. Rev. Lett. 77,3865 (1996).
[48] D. Vanderbilt, Phys. Rev. B 41, 7892 (1990).[49] K. F. Garrity, J. W. Bennett, K. M. Rabe, and D. Vanderbilt,
Comput. Mater. Sci. 81, 446 (2014).[50] H. J. Monkhorst and J. D. Pack, Phys. Rev. B 13, 5188 (1976).[51] A. Baldereschi, Phys. Rev. B 7, 5212 (1973).[52] J. S. Moller, P. Bonfa, D. Ceresoli, F. Bernardini, S. J. Blundell,
T. Lancaster, R. D. Renzi, N. Marzari, I. Watanabe, S. Sulaimanet al., Phys. Scr. 88, 068510 (2013).
[53] J. S. Moller, D. Ceresoli, T. Lancaster, N. Marzari, and S. J.Blundell, Phys. Rev. B 87, 121108 (2013).
[54] S. J. Blundell, J. S. Moller, T. Lancaster, P. J. Baker, F. L. Pratt,G. Seber, and P. M. Lahti, Phys. Rev. B 88, 064423 (2013).
[55] F. R. Foronda, F. Lang, J. S. Moller, T. Lancaster, A. T.Boothroyd, F. L. Pratt, S. R. Giblin, D. Prabhakaran, and S.J. Blundell, Phys. Rev. Lett. 114, 017602 (2015).
[56] The displacements obtained from supercell simulations areroughly of the order of magnitude of the accuracy of thecalculation.
174405-12