magnetic alignment and phase behavior of nanoclay...
TRANSCRIPT

Magnetic alignment and phase behavior ofnanoclay dispersions after in situ salt formation
YUMAN LI
Division of Applied Surface ChemistryDepartment of Chemical and Biological EngineeringCHALMERS UNIVERSITY OF TECHNOLOGYGothenburg, Sweden, 2014


MASTER’S THESIS
Magnetic alignment and phase behavior ofnanoclay dispersions after in situ salt formation
by Yuman Li
30 hp Master’s thesis within the Nanotechnology program
Division of Applied Chemistry
Department of Chemical and Biological Engineering,
Chalmers University of Technology, Gothenburg,
Sweden, August, 2014
Supervisor: Christoffer Abrahamsson (PhD student), Applied Chemistry,
Department of Chemical and Biological Engineering,
Chalmers University of Technology
Examiner: Michael Persson (Adjunct Professor), Department of Chemical
and Biological Engineering, Applied Chemistry, Chalmers University of
Technology and Innovation Manager, Akzo Nobel PPC


AbstractNanotechnology with application in nanomaterials and colloidal dispersions is of growingrelevance both in fundamental as well as applied research. Anisotropic particles such as claysheets have been especially promising as these can improve the mechanical and gas/liquidpermeability properties when dispersed in a matrix material to form a composite. Due to suchparticles enormous surface to volume ratios and large aspect ratios, they are commonrheological modifiers in processes ranging from food production to oil well drilling. Thisthesis aimed to find the relationship between magnetic alignment, and clay and saltconcentration. In this study, the clay concentration did not determine which sample thataligned in the investigated concentration range (0-0.8 vol%). Instead salt concentration wasthe factor dominating the alignment. At a salt concentration of 10-3 M NH3HCO3 and belowthe samples could align in an 11.7 Tesla magnetic field. Above this salt concentration thesamples did not align or aligned very slowly. The rheological properties, as indicated by aninverted tube test, were poor predictors of which samples would magnetically align. Oneimportant conclusion is therefore that it is not possible to say that a more viscous clay samplewill magnetically align slower than a less viscous sample.
The thesis work also aimed to formulate new types of latex-clay composite films to study theeffect of clay alignment in the film on the film permeability. Unfortunately the formulation ofthe latex/clay composites failed as it was hard to achieve reproducible gelation.
Keywords: nanocomposite, nontronite clay, exfoliated clay, magnetic alignment, phasebehavior


Table of content
1 Introduction………………………………………….…………….…………................1
1.1 Aim………………………………………………………………............……….….....1 1.2 Limitation………………………………………………………………............……....1
2 Background ……………………..........……………………….…….……………….....2
2.1 Colloidal particles and dispersions……………………………........…............…….....2 2.2 Interaction between charged particles……………………………………….................2 2.2.1 Charges on the surface…………………………………..…………….................2 2.2.2 DLVO Theory……………………………………...…………………..................3 2.2.3 Colloidal stability……………………………………………..…......…...............4 2.3 Interaction between clay and water molecules…………………………...….................4 2.4 Clay plates alignment in magnetic field………………………………….….........,.......5 2.5 Characterization of clay and suspension…………………………………….................5 2.6 Clay dispersion and gel phase behavior……………………………............…..…........6
3 Techniques description……….......……………………………………………….....7
3.1 Cross polarizer observations…….......………………………………..…………......7 3.2 Inverted tube test ………………........…………………………………..……...…....8 3.3 Resistivity measurements…………......………………………………………...…...9
4 Experimental parts……………………...………..…………………….............…........9
4.1 Methods used for the clay-urea/urease system…..……….....………………….......9 4.1.1 Clay preparation………………………………..…………………………..….........9 4.1.2 Sample formulation……………………………..………………………….….........9 4.1.3 Sample imaging, magnetic alignment and optical birefringence observations10 4.1.4 Resistivity measurements………………………………......…………….......10 4.2 Results ……………………………………..........…………………………….....…..11 4.2.1 Clay – urea/urease system.…………………………………………………..........11 4.2.2 Phase behavior - Color differences, aggregates and crack formation.……............11 4.2.3 Sample rheology and phase separation .……...……………………………..........14 4.2.4 Magnetic alignment and optical birefringence.………………...…………….......16 4.2.5 Resistivity measurements.………………………………………………...............16 4.2.6 Latex/clay composite .………………………….…………………………............16 4.2.7Destabilization with urea/urease method...…………………………………......….17 4.2.8 Destabilization with CaCO3/GDL method………………………….….....…...….19
5 Discussions……………………...........……………………...……….….……………..20
5.1 Dispersion color and rheology as a function of clay and salt concentration…..............20 5.2 Magnetic alignment and rheology……………………............………………….…….21 5.3 Resistivity measurements………………………………............………………….…..23 5.4 Latex/clay composite …………………………………………....…………………….23

6 Conclusion ……..............................................................................................................24
7 Future work…………………....…….……………..……………….......………...….....24
8 References………………………………………………………………............……....25

1
1 IntroductionNanotechnology with application to nanomaterials is of growing relevance both infundamental as well as applied research. Nanoparticles have enormous surface to volumeratios which gives them very different properties compared to a bulk structure made from thesame material [1-3]. Moreover, these nanoparticles can be designed to self-assemble intonanostructures with unique material characteristics [4]. The introduction of nanostructuredanisotropy that spans into the macroscale is a powerful way of enhancing certain materialproperties, for example mechanical strength [5, 6], diffusion and flow of liquid throughporous materials [7] and optical properties [8].
A group of nanostructured materials that occur in nature is the clays. Clay consists ofinorganic crystalline sheets of mixed shapes that are a few nanometer thick and up to2000-3000 nm wide [9, 10]. Clay sheets in liquid dispersions are typically stacked and packedlike pages in a book, yet under certain conditions the individual sheets can be dispersed intoindividual sheets, forming an exfoliated dispersion [11]. In the oil industry clay dispersionsplay an important role as lubricants and sealants of oil wells when oil and gas is to beextracted from underground reservoirs. For such applications a good understanding of thecolloidal stability and especially the rheology is essential. The ground around the wellscontains regions of varied pH and salt concentration, all of which affect the colloidal behavior.A better understanding of the clays response to factors present in such environments istherefore of interest [12].
1.1AimThe first aim of the project was to investigate how clay-clay interactions within aqueousnontronite clay dispersions and gels are affected by clay and salt concentration. This was doneby observing: the overall sample colloidal phase behavior, the bulk rheology by an “invertedtube test”, and the microrheology by investigating the magnetic alignment of samples instrong magnetic fields.
The second aim was to use a sol-gel method to synthesize composite films from colloidalnontronite clay and latex particles in the presence or absence of a magnetic field. These filmswere then to be used to study the influence of different states of clay alignment on liquidpermeability of the films.
1.2 LimitationsThere are some limitations in the scope of the investigation. In the nontronite clay-urea/ureaseexperiments only one clay and salt type was investigated. The only formulation processstudied was the sol-gel method. Also, only the urea/urease in situ salt formation methods wasinvestigated for this system.In the clay-latex system only one clay type was investigated and only two different in situ saltformation methods. The following in situ methods were investigated: the urea/urease and theglucono-δ-lactone/CaCO3 methods.

2
2 Background
2.1 Colloidal particles and dispersionsParticles that have at least one dimension in the size range 10-9-10-6 m can be defined ascolloidal particles [13]. When particles are in the colloidal size range they can under someconditions form stable dispersions that do not sediment. The particles are in constantBrownian motion as they diffuse in the dispersions [14]. Important factors affecting thecolloidal stability of the particles are particle concentration, size and shape, surface chemistryand surface charge, hydrophobicity and hydrophilicity [15, 16, 17]. Some of these factors areinfluenced by the properties of the surrounding medium such as type of solvent, saltconcentration or pH [15, 18]. In a charge stabilized colloidal system, particles electrostaticallyrepel each other mainly due to surface charges [19].
The Brownian motion of particles can be described by the Stokes-Einstein equation (Equation1), where k the Boltzmann constant, T the absolute temperature, h the dynamic viscosity,a the radius of the particles [20]. The equation could also be applied to plate shapedparticles such as clays, assuming a hydrodynamic diameter [21].
pah6kTD = .......... ..............................................................................................[Equation 1]
2.2 Interaction between charged particles
2.2.1 Charges on the surfaceCharged colloidal particles in dispersions are surrounded by a cloud of ions that form what iscalled an electric double layer. The ions will not be distributed uniformly throughout theliquid phase, instead they will be more concentrated near the charged colloidal surface. Figure2 shows the counter and co-ions that are located closest to the surface in the stern-layer.Outside the stern layer alternative layers of oppositely charged ions are located, however thecharges gets increasingly uniformly mixed at increasing distance from the surface. This partof the electric double layer is often referred to as the Gouy-Chapman Double Layer [22].

3
Figure 1 Schematic of the electric double layer [22].
2.2.2 DLVO theoryThe DLVO ( Derjaguin, Landau, Verwey and Overbeek ) theory describes colloidal stabilityand interactions between colloidal particles in a liquid environment. There are several forcesthat affect the particle interactions, including electrostatic interactions and Van der Waalsinteractions [23]. For example, similarly charged particles will repel each other, but Van derWaals forces will cause attraction between them.
Figure 2 Schematic of forces affecting the particle-particle interaction (energy level) as afunction of the distance between the particles [24].
The energy barrier in the black curve in Figure 2 will keep the particles from aggregatingwhen the sol is stable. This barrier can be several times greater than the kinetic energy of the

4
particles and under these conditions the particles will not aggregate. Energy minimums areobserved where the total net energy corresponds to attraction on both sides of the energymaximum. The particles can form loose flocculates at distances corresponding to the longrange energy minimum and such aggregates can sometimes be re-dispersed. However, at theshort range minimum the particles tend to aggregate irreversibly [11].
2.2.3 Colloidal stabilityThere are many factors that influence colloidal stability in particle dispersions/sols and thesefactors will affect the balance between repulsive and attractive forces. In that context the keycriterion that needs to be fulfilled for a sol to be stable is that an energy barrier is needed tokeep the particles apart. Particle size is important as small particles tend to remain indispersions due to Brownian motion counteracting gravitationally driven sedimentation.Particle surface charges often stabilize the particles by providing a repulsive force betweenparticles and thereby making particle-particle aggregation less likely [14].
The addition of ions can screen the particle surface charges, or in DLVO theory terms, theadditions of ions lower the energy barrier for particle-particle aggregation. Different types ofions will have different effect on the stability and divalent ions such as Ca2+ usually screensmore efficiently compared to monovalent ions such as Na+ [25]. Increasing the ionconcentration in the dispersion will compress the electric double layer and reduce theparticle-particle repulsion so that the energy barrier is decreased, which causes particleaggregation.
Another type of colloidal stability mechanism is steric repulsion. This effect is often presentin colloidal systems where the particle surfaces are covered by grafted or adsorbed polymermolecules. There are two effects that cause this type of repulsion, both the osmotic effectcaused by the high concentration of chain elements in the region of overlap, and a volumerestriction effect caused by of the loss of possible polymers strand conformations in thenarrow space between two particles that are close to each other [26].
2.3 Interaction between clay and water moleculesWater is a polar molecule that together with other water molecules will self-organize close tothe negatively charged faces and positively charged edges of the clay sheets. A clay sheet isschematically illustrated in Figure 3 [27]. Fully exfoliated clay sheets that have beendelaminated into individual sheets can absorb much larger amounts of water compared toaggregated bulk clay that has much less accessible surface [28]. Different types of clays havedifferent surface charges and hence different amounts of cations close to their surfaces, whichin turn affect the polarization of water molecular. In effect the water will form a 3-4 waterlayer thick film of immobilized water on the clay surfaces [7]. The surface of clays such asmontmorillonite, which is a close relative to nontronite, often behaves as a weak acid [29].This is mainly because of the deprotonation of hydroxylgroups, located to some extent on thefaces, but mainly on the edges of the clay particles [30].

5
Figure 3 Schematic of clay sheet and the location of charges.
2.4 Clay sheet alignment in magnetic fieldNontronite clay sheets are rich in iron ions in the octahedral layer which makes clay particlesin dispersion susceptible to magnetic field alignment [7]. The magnetic susceptibility of theclay particles, described as the clay sheets response to a magnetic field, can be affected byshape, size fraction, concentration of clay and to some extent thermal diffusion [11, 31, 33].The magnetic torque forces the magnetic moment of the clay particles to align in the magneticfield direction [32]. Nematic phases have been found to be easier to magnetically align asthese phases make the collective movement the particles easier [11]. The characteristics ofnematic phases are further discussed below. The dispersions transition from an isotropicallyoriented state to an aligned state can be visualized between crossed polarizers as the samplesgoes from an optically dark, to a birefringent bright appearance, respectively.
2.5 Clay and its dispersionsClay consists of small crystalline sheet-like particles of various shapes that in the case ofnontronite clay is 1 nm thick and between 10 to 2000 nm wide [7]. The crystal structure ofnontronite has an octahedral layer sandwiched between two tetrahedral silica layers and eachlayer contains metal ions located in the octahedral interlayer. Figure 4 illustrate the crystallinestructure of the clay sheets. Different substances can penetrate the interlayer between the claysheets and in the presence of water the cations in the inter-layer can be hydrated. Suchprocesses help with the clay exfoliation [34].

6
Figure 4 The left image show lumps of dry nontronite clay that was used for this thesis, andthe right figure show a schematic model of the clay crystal structure (with permission fromMc Graw Hill education) [35].
The replacement of ions in the crystal structure makes the clay surface charge negative. Forinstance if Al3+ replace Si4+ there will be one extra negative charge that will give the clay a netnegative charge. The charges of the chemical groups protruding at the edges of the clayparticle can be either positive or negative depending on the dispersion pH [30].
2.6 Clay dispersion and gel phase behaviorA gel is a network spanning system that binds the water that it contains and that has solid likeproperties. At the turning point from solution to gel the viscosity of the system usually risesquickly just before gelation. Two common gel formation mechanisms are the physical andchemical mechanisms. Physical gelation tend to be reversible and to be caused by physicalcross-links, such as hydrogen or ionic bonding, microphase separation [36] or excludedvolume induced close packing [11]. On the other hand, chemical gelation tends to be anirreversible process caused by reacting monomers or cross-linking polymer strands that forma network [37].
By increasing the anisotropic particle concentration in a liquid, different types of phases form.At low particle concentration the phase is isotropic, but at medium to high concentration itbecomes nematic (in some cases) and at high concentration it gels. In nematic phases, andsometimes in the birefringent gel phase, the particles have a higher degree of parallelalignment relative to each other. The transition from an isotropic to nematic transition isenergetically favorable because the orientational entropy decrease is compensated by the gainin excluded volume interactions [7].
Specifically for nontronite, Michot and co-workers showed that nontronite clay form liquidphases at a low electrolyte concentration of 10-4 M NaCl that are isotropic below 0.6 vol%clay, biphasic between 0.6 and 0.8 vol%, and a fully nematic between 0.8-0.83 vol% clay.Above 0.83 vol% clay, birefringent gel phases were formed [11]. The onset of these phasetransitions in nontronite are affected by electrolyte concentration, the size of the clay

7
sheets,and the ratio between diameter and the thickness of the clay sheets [38]. Abrahamssonand colleagues have shown that gelation can take place in nontronite clay dispersions at leastdown to a clay concentration of 0.5 vol%, at a NH4HCO3 salt concentration of 1 M [7]..
Gels or flocs of clay particles are often formed in the presence of salt. In these phases the claysheets often arrange in an edge to face configuration, called a “house of cards” structure.However, just increasing the clay concentration can result in gelation even in the absence ofsalt as the system becomes close packed [39].
Figure 5 Clay dispersions and gel phases.
The nontronite aggregated phases are organized in different ways depending on the saltconcentration. A small addition of salt result in a decrease in the yield stress and viscositycompared to when no salt is added. This can be attributed to a decrease of the effectivevolume of the clay particles due to screening of the electric double layer by salt ions. Thismakes it easier for the clay sheets to move which results in shorter relaxation times. At thissalt concentration the clay particles are not aggregated but instead interact with each otherthrough mutual repulsion. However, edge-to-face flocculation starts to play a role atlow-moderate salt concentrations as the negatively charged faces of one clay sheet interactwith the positively charged edges of another clay sheet. These aggregates flocculate relativelyfast and usually show no flow birefringence. ‘Zig-zag’ ribbon like structures or even lamellarface-to-face packing of the clay sheets, which are shown in Figure 5C and Figure 5D, tend tooccur at moderate-high salt concentration and these phases usually show flow birefringenceand relatively dense sediments [40, 41].
3 Techniques descriptionThere are several experimental techniques used in this thesis, for example birefringenceobservations between crossed polarizers, an inverted tube test that gives an indication of thesamples rheological properties and resistivity measurements that was used to try toquantitatively quantify how the structure changed because of magnetic alignment.
3.1 Crossed polarizer observationsOptical polarizers have slits that can filter unpolarized light so that linearly polarized lightcomes through the filter. If the slit of a second polarizer is oriented perpendicular to the firstpolarizer no light will go through the second polarizer as shown in the Figure 6. However, if a

8
Figure 6 Linearly polarized light is passing through the first polarizer but not the second asthe second polarizer has the slit orientation perpendicular to the first (with permission fromHyperphysics project) [44].
sample is inserted between the filters at a 45° angle relative the first slit, light will also passthrough the second filter. This usually means that the sample is birefringent which could meanthat the sample have an anisotropic alignment in its microstructure that interact with visiblelight [42, 43].
3.2 Inverted tube testThe rheology of the samples where probed be an “inverted tube test” [45]. In this test thegravity induced movement of the sample inside the tube is visually assessed when invertingthe tube. Samples with high viscosity will tend to flow slowly or not move at all as illustratedin the Figure 7. This test was used to asses if the sample was a dispersion or a gel. Themethod provides an indirect measurement of the strength of the particle-particle interaction inthe sample.
Figure 7 Examples of sample behavior during an inverted tube test that was use to assess thesample rheology.

9
This interaction can be affected by for example pH, particle and salt concentration. As Figure8 illustrates, samples with low viscosity readily flow while samples with higher viscosity willflow more slowly, while gels will not flow at all [46].
3.3 Resistivity measurementsThe resistivity of gels can be used as a measure of the tortuosity of the pores in the material.Comparing porous materials of the same dry weight concentration, a higher resistance is anindication that the electron need to travel a longer path (higher material tortuosity) than if theresistance was lower. Such effects can be expected in samples with clay particles that havedifferent orientation relative the direction of the resistivity measurement. However, differenttype, concentration and distribution of clay will affect the resistivity. This will also be theeffect of different solvent type and salt concentration. However, by keeping all parametersconstant except the clay orientation, an estimation of the change in tortuosity can be made[47].
4 Experimental methods
4.1 Methods used for the clay – urea/urease system
4.1.1 Clay preparationExfoliated clay sols were fractioned into various sizes fractions by the following process thathave been described earlier [7]. First, the greenish colored clay lumps were ground to powderin a crucible. The clay powder was suspended in a 1M of NaCl (Sigma, Sweden) and thesuspension was ultra-sonicated using an ultrasonic probe (Viber-cell 505, Sonics, USA) withan amplitude of 40% for 150 seconds. After leaving the sample to rest for 30 min thesuspension were ultracentrifuged (Optima XL-100K ultracentrifuge with 90 Ti rotor,Beckman Coulter, Palo Alto, CA, USA) at 35000×g for 90 min. The pellet was re-dispersed insalt solution again and then centrifuged. The centrifugation and redispersion was repeated intotal 3 times to exchange as many of the ions associated with the clay surfaces to sodium ions.The collected pellet after the last centrifugation was re-dispersed into 250 ml of MilliQ water,and to remove excess salt the dispersion was dialysed (MWCO 12-14000 kDa, Sigma-Aldrich,USA) against deionised water until the conductivity did not change anymore. The suspensionwas left to sediment for 3 days in Imhoff cones to remove impurities like iron oxide andfeldspar. The dispersion was then centrifuged at 7000×g and then 17000×g for 90 min to getsize fraction 1 and 2, respectively. Fraction 2 was the fraction used for all experiments withclay in this thesis. The nontronite clay sheets have an average particle length of 372 nm andwidth of 146 nm, as previously reported [48]. Dry weight measurements were made to findthe clay concentration of the fraction 2 pellets. The density of the nontronite clay particles isaround 3 g/cm3 [11].
4.1.2 Sample formulationThe phase behavior at different clay and salt concentrations were investigated after the

10
following sample formulation. Fraction 2 nontronite clay pellet was mixed with urea solution(Sigma, Sweden), MilliQ water (Millipore MilliQ, 18 MΩ cm) and urease enzyme solution.Homogenous gelation of the samples was achieved by in situ formation of NH4HCO3 salt,through hydrolysis of urea (Sigma) by the enzyme urease (Sigma, Jack Bean-urease type IX,Specific activity ~75,000 U/g). The enzyme concentration in all samples was 1.5 mg/ml [49].The mixing of the different sample constituents was made in 1.5 ml Eppendorf tubes(Eppendorf AG German). The total sample volume in the finished samples was 0.5 ml. Aftervortexing the sample dispersion for about 10 seconds it was transferred into 5 mm NMR tubesand capped after which it was left to gel for a few days.
4.1.3 Sample imaging, magnetic alignment and optical birefringence
observationsSamples were imaged between crossed polarizers both before and after magnetic fieldexposure to a NMR spectrometer magnetic field (11.7 Tesla) for 5 min. Imaging of thesamples were made approximately 40 seconds after taking samples out of NMR which forsome samples at lower clay concentration resulted in relaxation of the induced alignment. Thesamples were then imaged without crossed polarizers.
4.1.4 Resistivity measurements
The resistivity was measured before and after magnetic exposure with a digital multimeter(Agilent 34401A, Agilent Technologies, Palo Alto, USA) together with copper wires asshown in Figure 8. From the resistivity the conductivity could calculated. The copper wirewas inserted 1-2 mm both at the top and bottom of the sample before recording the resistivity.
Figure 8 Resistivity measurement set-up.

11
4.2 ResultsAs earlier mentioned these studies aimed at investigating the influence of clay and saltconcentration on the magnetic alignment of the clay sheets. Several other relevantcharacterization methods were also used and the results from these experiments are presentedbelow.
4.2.1 Clay – urea/urease systemFigure 9 shows the sample appearance without crossed polarizers at different clay and saltconcentration. Figure 10 and 11 show the same samples viewed between crossed polarizersbefore and after magnetic exposure. In Figure 10 and 11 the samples have exactly the samecomposition, however, the samples in Figure 10 has been used for resistance measurementswhere the insertion of the electrodes mechanically disturb mainly the upper surface of thesample. To control for this the samples in Figure 11 were made as these have not been usedfor resistance measurements.
4.2.2 Phase behavior - Color differences, aggregates and crack formationFigure 9 to 11 clearly show color difference going from transparent to yellow-green whenincreasing the clay and salt concentration. The higher clay and salt concentration, the morecolored the sample appears to be. At 0.8 vol% clay concentration the largest change in colortakes place between at a salt concentration between 10 and 1 mM. In Figure 10 the twosamples with 0.8 vol% clay and 0.1-1 M salt had small birefringent regions inside the samplesbefore magnetic exposure. These disappear almost completely after magnetic exposure.Cracks are apparent in the sample with 0.1 vol% clay and 1M salt in Figure 11, but not inFigure 10 even though the samples have the same composition.

12
10-5 10-4 10-3 10-2 10-1 1
Figure 9 Images of samples taken without crossed polarizers after magnetic field exposure.
Salt concentration (M)
0.8
0.5
0.3
0.1

13
10-5 10-4 10-3 10-2 10-1 1 10-5 10-4 10-3 10-2 10-1 1
Figure 10 Samples with varied clay and salt concentration. This is the first sample seriesimaged between crossed polarizers before (left) and after magnetic exposure (right side).
Salt concentration (M)
0.8
0.5
0.3
0.1

14
10-5 10-4 10-3 10-2 10-1 1 10-5 10-4 10-3 10-2 10-1 1
Figure 11 Sampled with varied clay and salt concentration. Second sample series imagedbetween crossed polarizers before (left) and after magnetic exposure (right side).
4.2.3 Sample rheology and phase separationAfter magnetic exposure an inverted tube test was performed. The result from this test can beviewed in Table 1 where it is apparent that higher clay and salt concentration leads to moreviscous samples, or even gelation. As one moves from the lower left to the upper right cornerthe samples goes from a liquid state with loose flocculates, to viscous samples where somehave flocculated/phase separated. At the highest salt concentration all samples had gelled.Flocculation and phase separation is more common at lower salt concentration. Still, thephase separation is undoubtedly most pronounced at a clay concentration of 0.1 vol% withlow to moderate salt concentration.
Salt concentration (M)
0.8
0.5
0.3
0.1

15
Table 1 Phase behavior of samples after magnetic alignment.
DispersionPhase separated X
Table 2 Degree of phase separation in samples. The percentages represents the relative size(length) of the upper phase relative the total sample size (length) in the samples that phaseseparated.
Table 2 indicates the degree of phase separation in the samples. The total length of eachsample was 40 mm.
X X X X
X X X X X
X
X X X
GelViscous liquidLiquidPhase separated X
X(1.25%) X(1.25%) X(5%) X(6.25%)
X(10%) X(5%) X(7.5%) X(1.25%) X(5%)
X(7.5%)
X(12.5%) X(7.5%) X(10%)
Salt concentration (M)
Salt concentration (M)
0.80.50.30.1
10-5 10-4 10-3 10-2 10-1 1
0.80.50.30.1
10-5 10-4 10-3 10-2 10-1 1
16
4.2.4 Magnetic alignment and optical birefringenceFigure 10 will be the figure that is most discussed in relation to the magnetic alignment as theimages in Figure 11 suffers from the presence of unpolarized light , due to light leaking induring the experiment. It is therefore hard to see any difference in birefringence before andafter magnetic exposure in Figure 11.
Figure 10 shows that magnetic exposure of the samples causes them to display birefringenceat a clay concentration of 0.3 vol% and above if the salt concentration is bellow 10 mM. Thereare hints of weak birefringence is some of the samples with 10mM salt. Also worth nothing isthe very strong birefringence found on top of the some samples after magnetic exposure inboth Figure 10 and 11. No birefringence was observed in the samples with 0.1 vol% claybefore or after magnetic exposure.
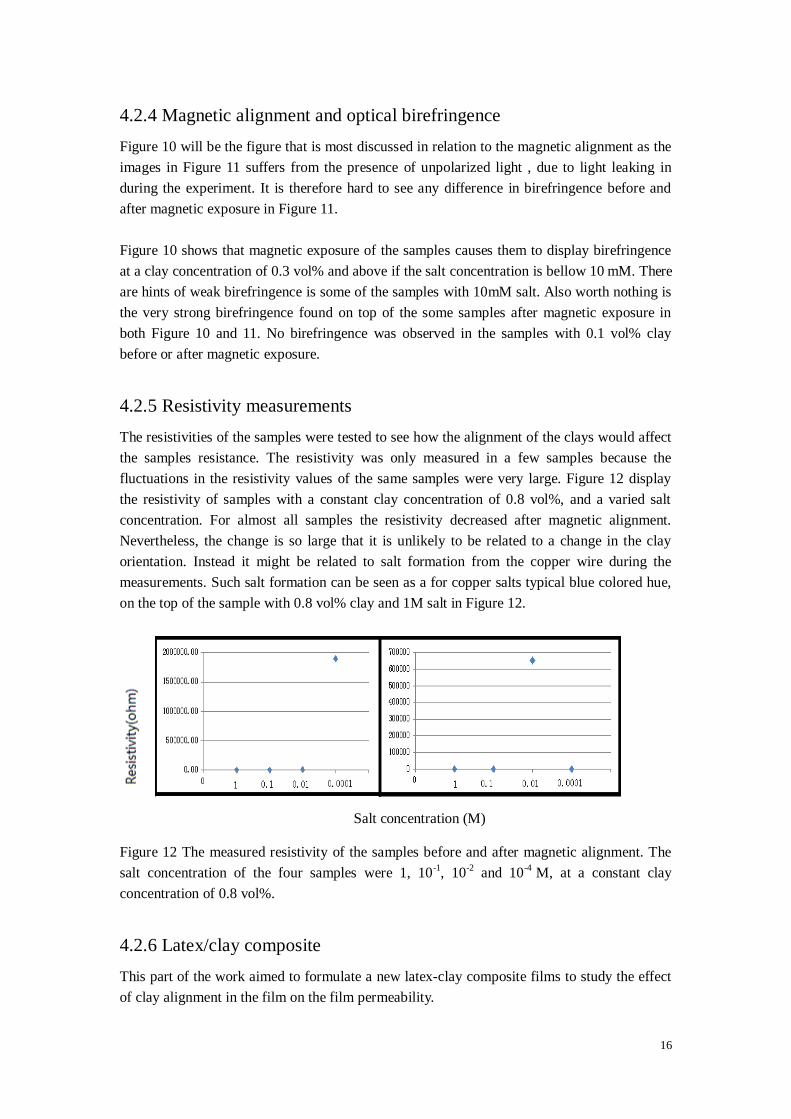
4.2.5 Resistivity measurementsThe resistivities of the samples were tested to see how the alignment of the clays would affectthe samples resistance. The resistivity was only measured in a few samples because thefluctuations in the resistivity values of the same samples were very large. Figure 12 displaythe resistivity of samples with a constant clay concentration of 0.8 vol%, and a varied saltconcentration. For almost all samples the resistivity decreased after magnetic alignment.Nevertheless, the change is so large that it is unlikely to be related to a change in the clayorientation. Instead it might be related to salt formation from the copper wire during themeasurements. Such salt formation can be seen as a for copper salts typical blue colored hue,on the top of the sample with 0.8 vol% clay and 1M salt in Figure 12.
Figure 12 The measured resistivity of the samples before and after magnetic alignment. Thesalt concentration of the four samples were 1, 10-1, 10-2 and 10-4 M, at a constant clayconcentration of 0.8 vol%.
4.2.6 Latex/clay compositeThis part of the work aimed to formulate a new latex-clay composite films to study the effectof clay alignment in the film on the film permeability.
Salt concentration (M)

17
The mean latex particle sizes were measured in the latex sols are presented in Table 3 andFigure 13. The mean particle size for the different latexes ranges between 102 to 126 nm.
Latex type PX9612 PX9272 PX9704 PX9340Mean particle diameter (nm) 115.3 126.9 102.0 109.0
Polydispersity 0.057 0.005 0.005 0.005Table 3 The mean particle diameter and the polydispersity of the 4 different latex types.
Figure 13 Mean particle sizes for four different latex types as measured with dynamic lightscattering.
4.2.7 Destabilization of latex dispersions with urea/urease method.The phase behavior of different latex types, concentrations and salt concentrations aredisplayed in Table 4-7. As can be seen no samples gelled with the urea/urease destabilization,which was a requirement before trials with added clay would be attempted. Hence theurea/urease destabilization method was abandoned and instead the glucono-δ-lactone/CaCO3
method was tried.
Type of latex

18
15 20 25 30
Table 4 The phase behavior for Latex PX9272 with urea/urease destabilization.
15 20 25 30
Table 5 The phase behavior for Latex PX9612 with urea/urease destabilization.
15 20 25 30
Table 6 The phase behavior for Latex PX9704 with urea/urease destabilization.
15 20 25 30
Table 7 The phase behavior for Latex PX9340 with urea/urease destabilization.
Latex(%)
10.50.20.05
10.50.20.05
10.50.20.05
10.50.20.05
Latex(%)
Latex(%)
Latex(%)
19
4.2.8 Destabilization with the glucono-δ-lactone/CaCO3 method
0
500
1000
1500
2000
0 1 2 3 4 5 6 7 9 13 15 20 26 30 49 57 110
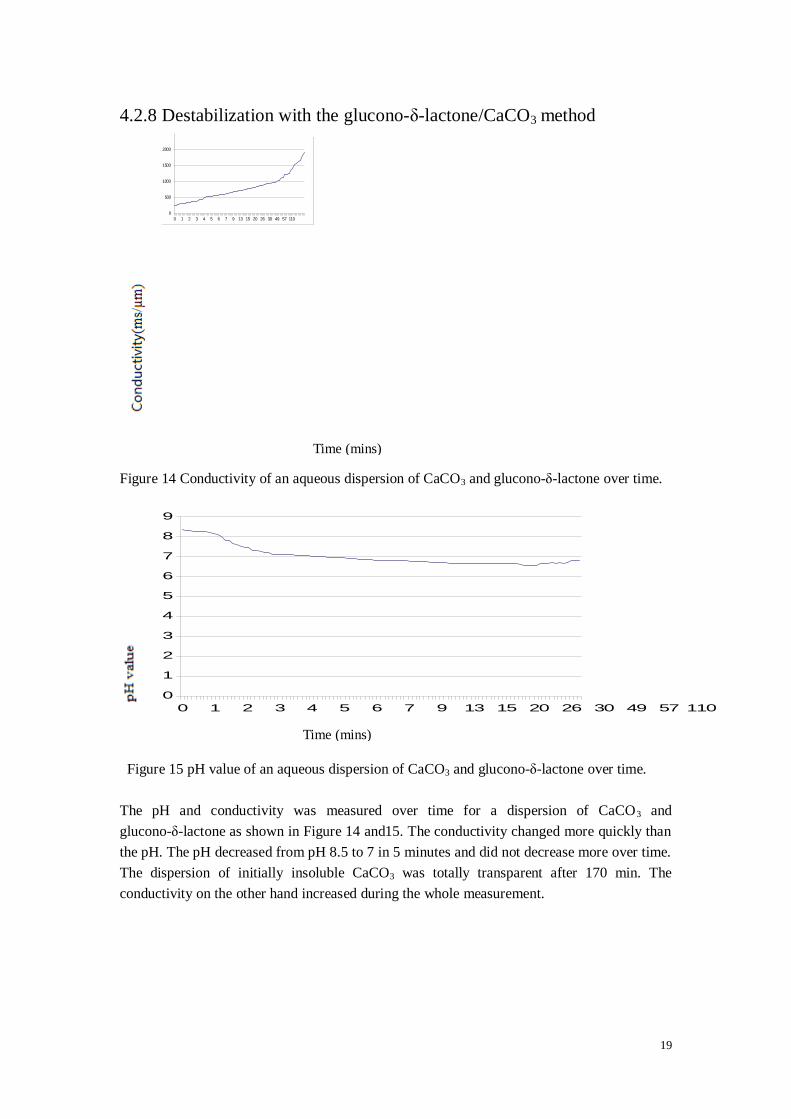
Figure 14 Conductivity of an aqueous dispersion of CaCO3 and glucono-δ-lactone over time.
0
1
2
3
4
5
6
7
8
9
0 1 2 3 4 5 6 7 9 13 15 20 26 30 49 57 110
Figure 15 pH value of an aqueous dispersion of CaCO3 and glucono-δ-lactone over time.
The pH and conductivity was measured over time for a dispersion of CaCO3 andglucono-δ-lactone as shown in Figure 14 and15. The conductivity changed more quickly thanthe pH. The pH decreased from pH 8.5 to 7 in 5 minutes and did not decrease more over time.The dispersion of initially insoluble CaCO3 was totally transparent after 170 min. Theconductivity on the other hand increased during the whole measurement.
Time (mins)
Time (mins)

20
15 20 25 30
Table 8 The phase behavior of CaCO3/ glucono-δ-lactone and latex.
Several samples gelled in Table 8 and to find such samples was the goal of this particularexperiment. Even so, the gelation the samples were not reproducible which was why also thismethod of latex sol destabilization was abandoned. Instead all time was spent on investigatingthe phase behavior of only nontronite clay at different clay and salt concentrations.
5 DiscussionExcept from being used in nanocomposites, clay dispersions and their rheological propertiesare of great importance in many industrial applications. The focus of this thesis discussionwill be put on how the nontronite clay and salt concentration affect the magnetic alignmentand the rheological properties. Phase behavior characterizations of different sample propertieshave indeed produced some very interesting results. Resistivity measurements were alsoattempted, however the validity of those measurements for the study of the claymicrostructure is questionable. Also the formulation of a latex/ clay composite for studies ofliquid permeability though magnetically aligned latex/clay composites failed. The reason thatthe failed results from the formulation of the latex/clay composites are still included in thethesis is to provide a record of these studies as they took up a considerable time of thepractical thesis work.
5.1 Sample color and rheology as a function of clay and salt
concentrationFigure 9 show that all samples with a clay concentration above 0.1 vol% transitioned from atransparent to a yellow-green appearance as the salt concentration were increased from 1 to 10mM NH4HCO3. At constant clay concentration the sample where more colored at a higher saltconcentration. The reason for this is likely to be the difference in pH between the samples(not measured). Urease first produces ammonia from the urea which increases the pH until thebuffering pH of 9.3 is reached [7]. At the buffering pH the NH4HCO3 salt will be formed. ThepH is known to influence the oxidation state of the iron ions present in clay sheets whichexplains the color differences at constant clay concentration [50]. The reason for the decreasein color intensity of the samples with decreasing clay concentration at a constant saltconcentration is that the colored clay particles and their colored ions become more dilute.Interestingly the colored samples are roughly the same samples that are defined as gels in
10.50.20.05
Latex concentration (wt %)

21
Table 1. This makes sense as the most colored samples have the highest salt concentration andsalt is known to cause gelation in clay dispersions [11].
5.2 Magnetic alignment and rheologyExcept for the 0.1 vol% sample, Figure 10 show magnetic alignment in all samples with a saltconcentration below 10 mM. To find the relationship between magnetic alignment and clayand salt concentrations was an important goal of this thesis. Hence, under the conditions usedin this study, clay concentration does not determine which sample that can align. Instead saltconcentration is the decisive factor. It should be noted that the samples with 10-5M salt inFigure 11 have less birefringence than the samples with 10-4M salt. One possible reason couldbe that the clay dispersions with a salt concentration of 10-5 M relax faster than at 10-4M. Asthe samples needed to be moved from the NMR magnet after alignment, their birefringencerelaxed partly. Abrahamsson and co-workers observed no magnetic alignment in a 0.5 vol%nontronite clay gel gelled with 1M urea with the addition of urease, which is consistent withthe results in this thesis [7]. If one compares the inverted tube test observations in Table 1with the magnetic alignment results in Figure 10, it becomes apparent that the rheologicalproperties are poor predictors of which samples that magnetically align or not. This isespecially evident at low clay concentration.
The presence of birefringent ‘flocs’ can be seen at a clay concentration of 0.8 vol% and0.1-1M salt concentration. This type of birefringence has previously been observed byAbrahamsson and colleagues [7] and they theorized that the birefringent flocs actuallyconsisted of local regions of collectively aligned clays that were birefringent. Thesebirefringent regions might have formed during sample mixing which could cause flowbirefringence. It is then possible that the slow salt formation locked the orientation of theclays into this locally aligned state. Phase separation was clearly observed at a clayconcentration of 0.1 vol%, but no birefringence could be observed. Hence these samples arephase separated, yet not ordered by the magnetic field.
Figure 10, 11 and 16 show how regions at the top of some of the samples form a thin butintensely birefringent phase after clay alignment. A schematic with the different phasesillustrated can be found in Figure 16. The birefringent phase appears in the middle of twoisotropic or less birefringent phases. One hypothesis is that a secondary phase separationformed a nematic phase from residual clay particles present in the upper isotropic phase. Thisupper isotropic phase would have been formed after an earlier primary phase separation thatformed two isotropic clay phases of different clay concentration. This could be confirmed inthe future by SAXS measurement on these phases. Except SAXS measurements it would beuseful to determine to the dry weight concentration of the different phase separated layers asthis could shine more light on which phases that are present.

22
10-5 10-4 10-3 10-2 10-1 1
Figure 16 Observed phase separation at varied clay and salt concentration. I1, I2, N and G standfor isotropic phase, nematic-like phase and gel phase, respectively. I1 stand for isotropic lowclay concentrations and I2 stand for isotropic higher clay concentrations.
Table 1 shows that the samples gel at a high salt and clay concentration and as expected thereis a viscous liquid region between the liquid and gel region. Michot and collegues havereported that nontronite clay disperions with a clay concentration of 0.83 vol% and no saltgelled due to the close packing of the system. They also showed that when salt was addedgelation took place down to a clay concentration of 0.3 vol%, when the salt concentration wasaround 10-2 M NaCl. Compared to Michot’s results phase separation is in this work seen over
Salt concentration (M)
0.8
0.5
0.3
0.1

23
a much larger range of clay concentrations [11]. This might be because the addition ofenzyme and the use of another type of salt in this study.
5.3 Resistivity measurementsAs mentioned earlier the resistivity measurements are not expected to be accurate as theresistivity measured in the samples fluctuated a lot. Also, copper ions dissolved in the sampleduring measurements which of course increased the conductivity of the samples. Still,differences in conductivity because of clay orientation would be expected if a more stablemeasurement set-up would have been used. Fukue and co-workers measured the resistivity ofclay containing materials and related the conductivity to concentration of ions and counterions next to the surface of clay particles, water content and even the orientations of the watermolecules in the region of the electric double layer [51]. It has also been shown that theresistivity increased at a higher clay concentration. In the summary, no conclusion can bedrawn based on the resistivity measurements in this thesis. Still, literature indicate that theionic strength and clay type/concentration could have major influence on the resistivity of thedispersions [52].
5.4 Latex/clay compositeThe goal of these formulations experiments were to make latex/clay films that could be usedto study the permeability of films containing clays with different clay orientation. However,both the destabilization with urea/urease and CaCO3/glucono-δ-lactone proved unsuccessfulin the effort to reproducibly produce mechanically stable films. The CaCO3/glucono-δ-lactonemethod did form gels, however, even when repeatedly testing the mixing of the same samplerecipe the gelation of the sample failed in many cases without any obvious explanation.Hence this gelation method was abandoned. One theory for why it was so hard to form gelswas that the large surface area of the sol buffered changes in pH or that the latex particlesadsorbed the urease enzyme on its surface so that it became inactive, effectively hindering saltformation and gelation. All latex phase behavior diagrams show phase separation. This mightbe caused by insufficient salt concentration for reasons mentioned above or that the change inpH caused by the in situ gelation methods instead favor flocculation.

24
6 ConclusionsTo find the relationship between magnetic alignment, and clay and salt concentration wereimportant goals of this thesis. In this study it was found that clay concentration does notdetermine which sample that can align, instead salt concentration was the decisive factor. At asalt concentration of 10-3 NH4HCO3 and below the samples could align in an 11.7 Teslamagnetic field, but not above this salt concentration. Also, the rheological properties werepoor predictors of which samples would magnetically align. It is therefore not possible to saythat a more viscous clay sample will align slower than a less viscous sample.
7 Future workFurther studies of how the magnetic alignment would be affected by different magnetic fieldstrength would be interesting. Also, SAXS measurements would be beneficial to prove theexistence of nematic phase in some of the samples. Furthermore, birefringence relaxationtime and rheology measurements would also be of use as these would quantitativelydetermine the clay dynamics of the system. Also, it would be beneficial to measure the pH ofall the samples in the phase diagram, as pH can have large influence on the phase behavior ofclay containing systems.

25
8 Reference1. EuStis S., EL-Sayed M.A., Why gold nanoparticles are more precious than pretty goldNoble metal surface plasmon resonance and its enhancement of the radiative and nonradiactive properties of nanocrystals of different shapes, Chemistry Society Review, 35,p.209-217 (2005)2. Valiev R., Material science: Nanomaterial advantage, Nature ,419, p.887-889 (2002)3. Wang J., Nanomaterial-based electrochemical biosensors, Analyst, 130, p.421-426 (2005)4. Glotzer S.C, Solomon M.J., Anisotropy of building blocks and their assembly into complexstructures, Nature Materials, 6, p.557-562 (2007)5. Wang Y.C., Huang T.K., Tung S.G., Self-assembled clay films with a platelet-voidmultilayered nanostructure and flame-blocking properties, Scientific reports, 3, 2631, p.1-6(2013)6. Luo J.J., Daniel I.M.., Characterization and modeling of mechanical behavior ofpolymer/clay nanocomposites, Composites Science and Technology, volume 63, issue 11,p.1607-1616 (2003)7. Abrahamsson C., Nordstierna L., Bergenholtz J., Nyden M., Magnetically inducedstructural anisotropy in binary colloidal gels and its effect on diffusion and pressure drivenpermeability., Soft matter, 24, 10, p.4403-4412 (2014)8. Camerel F., Gabriel J.-C.P., Batail P., Magnetically induced large mesoporoussingle-domain monoliths using a mineral liquid crystal as a template, volume 13, issue 5, p.377-381 (2003)9. Mitsunaga M., Ito Y., Ray S.S., Okamoto M., Intercalated Polycarbonate/ClayNanocomposites: Nanostructure Control and Foam Processing, Macromolecular Materialsand Engineering, volume 288, issue 7, p. 543 -548 (2003)10. Bharadwaj R.K., Modeling the barrier properties of polymer-layered silicatenanocomposite, Macromolecules,volume 34, number 26, p.9189-9192 (2001)11. Michot L.J., Bihannic I., Maddi SS. Funari S.S., Liquid- crystalline aqueous claysuspensions, Proceedings of the National Academy of Sciences, volume 103, number 44,p.16101-16104 (2006)12. Maitland G.C., Oil and gas production, Current opinion in Colloid & Interface Science,volume 5. issue 5-6, p.301-311 (2000)13. Petrucci R.H., Harwood W.S., General chemistry: principle and modern applications. 9th
ed. (2007)14. Russel W., Saville D.A., Schowalter W.R., Colloidal Dispersions, Cambridge Universitypress, p.12 (1989)15. Adamson A.W., Gast A.P., Physical chemistry of surfaces, 6th edition, p.169 (1967)16. Binks B.P., Horozov T.S., Colloidal particles at liquid interfaces: An introduction.Cambridge University Press, p.1-10 (2008)17. Onsager L. The effects of shape on the interaction of colloidal particles, Annals New YorkAcademy of Science, p.627-659 (1949)18. Chi E.Y., Krishnan S., Roles of conformational stability and colloidal stability in theaggregation of recombination human granulocyte colony-simulating factor, volume 12,issue 5, p. 903-913 (2003)

26
19. Fleer G.J., Lyklema J., Polymer adsorption and its effect on the stability of hydrophobiccolloids, Journal of colloid and interface science,volume 46, number.1, p1-12 (1974)20. Islam M.A., Einstein-Smoluchowski Diffusion equation: a discussion, Physica Scriptavolume 70, 120-125 (2004)21. Bates T.F., Bradley W.F., Plummer N., Waxman M.H., Weaver C.E., Clay and clayminerals on clays and clay minerals. p.21 (1956)22. Goodwin J.W., Colloidal dispersions, The Royal Society of Chemistry, Burlington House,London W1V OBN, University of Bristol 10th , p.9-40 (1981)23. Ohshima H., Biophysical Chemistry of Biointerfaces, John Wiley & Sons, Inc , Hoboken,NJ, USA, p.420 (2010)24. Guo D., Mechanical properties of nanoparticles: basics and applications, Journal ofPhysical D: Applied Physics (2014)25. Badawy A., Luxton T., Silva R., Scheckel K., Suidan M.., Tolaymat T., Impact ofenvironmental conditions (pH, Ionic Strength, and Electrolyte type) on the surface charge andaggregation of silver nanoparticles suspensions, Environment Society Technology. 44,p.1260-1266 (2010)26. Schmitz K., Macro ions in solution and colloidal suspension, Department of chemistry.University of Missouri-Kansas City (1992)27. Dunn J.R., Hudec P.P., Water, clay and rock soundness, The Ohio journal of science,volume 66, issue 2, p.153-168 (1966)28. Torrence M.R., Adsorbed water on clay: A review, M.I.T. Soil engineering. Cambridge,Massachusetts (1960)29. Marshall C.E., Krinbill C.A., The clay as colloidal electrolytes, Journal of PhysicalChemistry, p.1077-1090 (1942)30. Tombacz E., Szekeres M., Colloidal behavior of aqueous montmorillonite suspensions:the specific role of pH in the presence of indifferent electrolytes, Applied clay science,volume 27, issue 1-2, p.75-94 (2004)31. Mullins C.E., Magnetic susceptibility of the soil and its significance in soil science - areview, Journal of soil science, volume 28, issue 2, p.223-246 (2006)32. Tang B.Z., Geng Y.H., Lam J.W., Li B., Processible nanostructure materials with electricalConductivity and Magnetic Susceptibility: Preparation and Properties ofMaghmite/Polyaniline Nanocomposite Films. Chemistry Mater, volume 11, p.1581-1589(1999)33. Wiese G.R., Healy T.W., Effect of particle size on Colloid Stability, TransaminationFaraday Society, p.490-499 (1970)34. Skipper N.T, McConnell R., Computer simulation of interlayer water 2:1 clays, Journal ofChemistry Physics, 94, p.7434 (1991)35. Grim, R.E., Clay Mineralogy, 2nd edition, p.10 (1968)36. Te Nijenhuis K., Thermoreversible networks, Advanced Polymer Science, 130, p.1-267(1997)37. Clark A.H., Gels and gelling, Physics chemistry of food. p.263-305 (1992)38. Zhang Z.X., Duijneveldt J.S., Isotropic-nematic phase transition of nonaqueoussuspensions of natural clay rods, Journal of chemical physics 124, number15, 154910 (2006)39. Dijkstra M., Hansen J.P., Madden P.A., Gelation of a clay colloid suspension, Physics

27
Review Letter volume 75, number 11, p.2236 (1995)40.Abend S., Lagaly G., Sol–gel transitions of sodium montmorillonite dispersions, AppliedClay Science, 16, p.201-227 (2000)41. Schofield R., Samson H., Discussions of the Faraday Society, 18, p.135-145 (1954)42. Sprokel G.J., Birefringent liquid crystal structure, United State Patents (1975)43. Robinson C., Liquid-crystalline structures in polypeptide solution, Tetrahedron, vol 13,p.219-234 (1961)44. http://hyperphysics.phy-astr.gsu.edu/hbase/phyopt/polcross.html [Accessed on: January14, 2014]45. Gupta D, Tator C.H., Shoichet M.S. Fast-gelling injectable blend of hyaluronan andmethylcellulose for intrathecal, localized delivery to the injured spinal cord, volume 27, issue11, p.2370-2379 (2006)46. Ganji F., Abdekhodaie M.J., Gelation time and degradation rate of chitosan-basedinjectable hydrogel, J Sol-Gel Society Technology, p.42:47-53 (2007)47. Lima O.A., Sharma M.M., A grain conductivity approach to shaly sanstones, Geophysics,55(10), p.1347-1356 (1990)48. Ramiasa M., Locock K., Abrahamsson C., Nyden M., Smart polymer-clay compositenanomaterials, Manuscript (2014)49. Qin Y. and Cabral J. M., Kinetic studies of the urease-catalyzed hydrolysis of urea in abuffer-free system, Applied biochemistry and biotechnology, 1994, 49, p.217-240 (2000)50. Temple K.L. and Colmer A.R., The Autotrophic oxidation of iron by a new bacterium:Thiobacillus ferrooxidans, J. Bacteriol, 62(5), p.609 (1951)51. Fukue M., Minato T., The micro-structures of clay given by resistivity measurements,volume 54, issues 1-2, p.43-53 (1999)52. Yoon G.L., Park J.B., Sensitivity of leachate and fine contents on electrical resistivityvariations of sandy soils, Journal of Hazardous materials, volume 84, issue 2-3, p.147-161(2001)