macro-micro response characteristics of surrounding rock
TRANSCRIPT

Research ArticleMacro-Micro Response Characteristics of Surrounding Rockand Overlying Strata towards the Transition from Open-Pit toUnderground Mining
Xiaoshuang Li,1,2,3,4 Shun Yang ,1 Yunmin Wang,3,4 Wen Nie,1 and Zhifang Liu1
1School of Resources and Environmental Engineering, Jiangxi University of Science and Technology, Ganzhou, Jiangxi 341000, China2School of Civil Engineering, Shaoxing University, Shaoxing Zhejiang 312000, China3State Key Laboratory of Safety and Health in Metal Mines, Maanshan, Anhui 243003, China4Sinosteel Maanshan General Institute of Mining Research Co. Ltd., Maanshan, Anhui 243000, China
Correspondence should be addressed to Shun Yang; [email protected]
Received 13 January 2021; Revised 25 February 2021; Accepted 1 April 2021; Published 7 May 2021
Academic Editor: Rihong Cao
Copyright © 2021 Xiaoshuang Li et al. This is an open access article distributed under the Creative Commons Attribution License,which permits unrestricted use, distribution, and reproduction in any medium, provided the original work is properly cited.
The macro-micro mining response of the surrounding rock and overlying strata towards the transformation from open-pit tounderground mining is examined in the present study, based on the engineering background of the Jinning phosphate mine(Yunnan Phosphate Chemical Group Co., Ltd.) via simulations involving similar materials, digital photographic measurementtechnology, and numerical simulation. The mining deformation of the surrounding rock underground, and of the overlyingstrata, is shown to develop in three stages, namely: (1) small and local deformation, (2) continuous linear increase, and (3) theviolent nonlinear collapse of the entire system. The internal distribution of stress in the surrounding rock and adjacent overlyingstrata of the inclined mined-out area is complicated. The degrees of pressure increase and pressure relief have an importantrelationship with the size of the mining space. The pressure relief is more complete close to the mined area, and the stressreduction decreases with increasing distance. The cracks propagate in arc shapes and have a tendency to penetrate into theupper and lower ends of the stope. The size of the excavation space plays a key role in the generation, propagation, andpenetration of the cracks. Due to the disturbance of the first mining level and the increase in excavation depth, the rate ofdamage to the surrounding and overlying rock increases in the second mining level. This process generates more cracks, whichaccelerate the instability of the surrounding rock and overlying strata.
1. Introduction
Most of China’s open-pit mines were built in the 1950s.After several decades of continuous high-intensity mining,the vast majority of open-pit mines have entered the deepopen-pit mining stage and even underground mining. Thetransition from open-pit to underground mining is a com-plex systems engineering problem, and the resulting defor-mation mechanism of the rock mass is highly complicateddue to the effects of numerous stress fields. The process pre-sents typical sudden and nonlinear characteristics and posesa serious challenge to the open-pit to underground miningproject [1–5].
Research on the transition from open-pit to undergroundmining in China began around the 1990s, with manyresearchers conducting bottom friction modeling experi-ments [6, 7], physical modeling tests [8–10], numericalsimulations [11–14], combined numerical and physical sim-ulations [15–18], and field measurements [19–22]. Recently,a mathematical model was established to describe the atten-uation of peak particle velocity (PPV) in the open-pit slope,which is used to evaluate the influence of underground mineblasting on the slope stability [23]. Cheng et al. used the Uni-versal Distinct Element Code (UDEC) numerical method tosimulate the movement of strata in the footwall caused byunderground mining [24]. In addition, the discontinuous
HindawiGeofluidsVolume 2021, Article ID 5582218, 18 pageshttps://doi.org/10.1155/2021/5582218

deformation analysis (DDA) method has been used to studythe process of slope instability induced by the caving methodin rock structures of various mass during mining from open-pit to underground [25–27]. Regassa et al. used the equiva-lent discontinuity modeling method (EDMM) to simulatethe rock movement and failure caused by mining under theend slope of the Western open pit of the Yanqianshan ironmine [28]. With advances in technology, researchers haveused micro seismic monitoring, in situ monitoring, and truetriaxial modeling [29–32] to investigate the deformationcharacteristics and failure mechanisms of the slope rock massand the surrounding rock of the underground stope after thetransition from open-pit to underground mining.
Nevertheless, few studies have examined the changes inthe surrounding rock and overlying strata of the under-ground stope due to influences in slope and mining coupled.Due to major differences in the conditions, mining tech-niques, mining methods, and complexity of the open-pitslope and underground mining environments, it is necessaryto study the macro-micro response characteristics of the sur-rounding rock and overlying strata to the transition fromopen-pit to underground mining. Therefore, taking theopen-pit to underground mining project of the Jinning phos-phate mine belonging to the Yunlin Group as an example,experiments on similar materials, numerical simulations,and theoretical analyses are used in the present study toinvestigate the mining response characteristics of the sur-rounding rock and overlying strata during such a transition.
2. Engineering Background
After more than 30 years of mining, part of the no. 2 pit in theJinning phosphate mine belonging to the Yunnan PhosphateChemical Group Co., Ltd. has formed a high and steep slope.Figure 1(a) is the second pithead of the Jinning phosphatemine. The mining area is low in the north and high in thesouth and inclined to the east and west. The highest pointis 2320m, and the general elevation is between +2200 and+2320m. The average dip angle of the ore body is 36°. Thethickness of the ore body is generally 3–15m, with an averagethickness of 6.8m, and the firmness coefficient of the depositis 7-9. The roof is composed of dolomite with argillaceousrock (firmness coefficient: 6-10), and the floor is composedof argillaceous dolomite with a thin layer of chert (firmnesscoefficient: 14-16). There are few weak interlayers in the rocklayer of the open-pit slope; thus, the influence of faults andjoints is small. At present, the total mining depth of pit 2 isover 120m. The top slope angle is 45°, and the bottom slopeangle is equal to the dip angle. Since only a small amount ofgeological reserves (above +2270m) are available for open-pit mining, the levels below this will be transferred to theunderground mining stage. The representative section ofexploration line 59 has been selected as the test section forthe present study, and Figure 1(b) is the engineering geolog-ical section of exploration line 59. According to the actualmining process, one mining level per 50m is selected forthe study. The underground ore body is mined at a level of10m in each mining level.
3. Macro Mining Response Characteristics:Similar Material Experiments
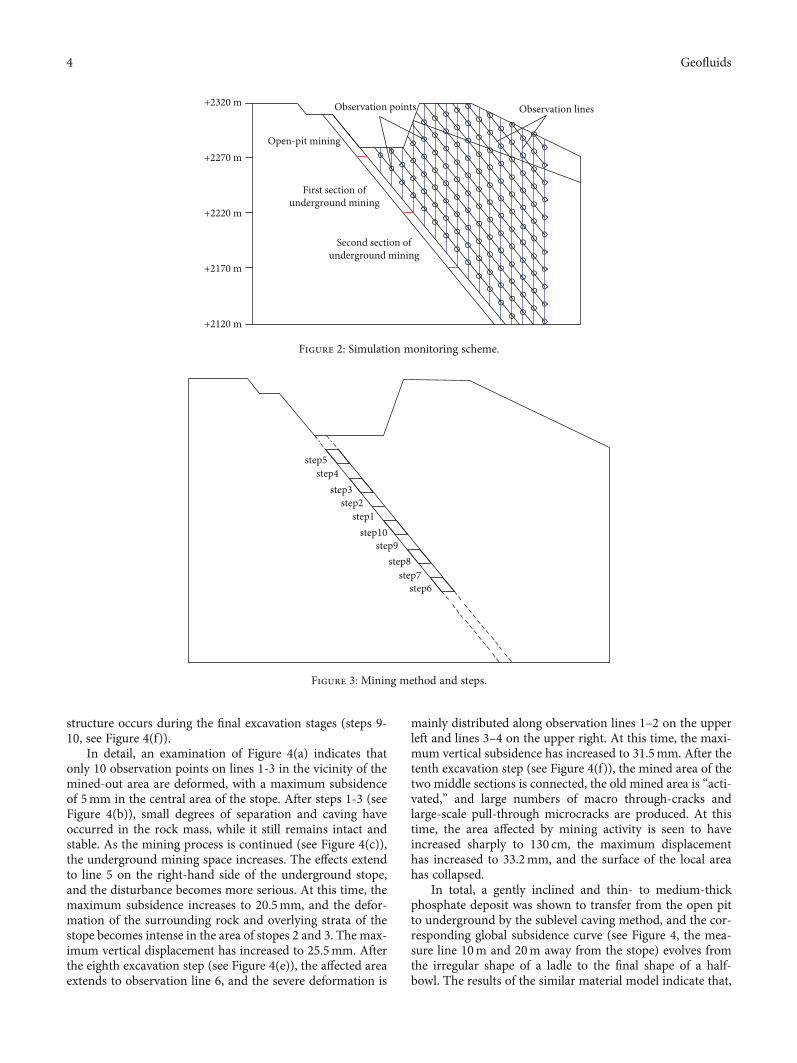
3.1. Simulated Excavation. Experiment is the most traditionalmethod in the field of geotechnical engineering [33–48]. Inorder to simulate the excavation from the open pit to under-ground, the two middle sections were selected; Figure 2shows the two middle sections. In the actual mine, miningextended only to the +2120m level, and the maximum sur-face elevation was +2320m (see Figure 1(b)). In the presentstudy, the simulated maximum mining depth and width are200 and 300m, respectively. The overlying strata in the mon-itoring scheme area is uniformly divided into sixteen dis-placement observation lines at horizontal intervals of 0.1m,with the initial observation line positioned at +2270m at ahorizontal distance of 0.116m from the slope. In the verticaldirection, the lowest observation point in each line is 0.1mfrom the ore body, and the height of successive observationpoints increased in steps of 0.1m. In total, 128 deformationobservation points are arranged in this experiment, Figure 2is the simulation monitoring scheme.
Mining is performed via the sublevel caving method,Figure 3 shows the mining method and steps. The ore blocksare arranged along the strike and divided into two middlesections, each with a height of 0.5m. Both of the two middlesections are mined in 5 steps from bottom to top, withsubsection heights of 0.1m. And the mining process is com-pleted in 10 steps.
3.2. Model Design. The ore body is chiefly phosphate rock,with a footwall consisting primarily of boundary phosphaterock, mud-bearing dolomite, and layered dolomite. Theupper section consists mainly of mudstone-bearing quartzsandstone, dolomite, and a quaternary clay layer. Table 1shows the rock mechanical parameters measured by labora-tory physical tests after field sampling, which reflects themechanical properties of rock, and the similar physicalmodel experiment material ratio is also based on themechanical parameters.
Based on the principle of similar material simulation, thesimilarity parameters for each simulation test are as follows:geometry similarity ratio = 1 : 100, bulk density similarityratio = 0:81 : 1, stress similarity ratio = 1 : 123:50, and timesimilarity ratio = 1 : 10. A plane stress model was used inthe present work to simulate similar materials along the dipof the phosphate rock. The main components of the modelmaterials were sand, gypsum, calcium carbonate, mica pow-der, soft glue, engine oil, fine wood chips, and water. Theappropriate material ratios were selected via the orthogonaltest method and the use of a material testing machine, andthe dimensions of the plane model were 3:00 × 0:30 × 2:00m (length × width × height).
3.3. Physical Modeling Result Analysis. The vertical displace-ment of the surrounding rock and overlying strata at variousstages of the model excavation was measured using a digitalcamera system. Figures 4(a)–4(f) are the subsidence displace-ments after the first, third, fifth, sixth, eighth, and tenth exca-vation steps of the similar material model, respectively. Here,
2 Geofluids

the distance from the beginning of the ore body and theextent of subsidence are plotted as negative values.
These experimental results indicate that the deformationof the surrounding rock underground and the overlyingstrata during mining occurs in the following three stages:
(i) small and local deformations occur during the initial exca-vation steps (steps 1-3, see Figures 4(a) and 4(b)), (ii) a con-tinuous linear increase in deformation occurs during theintermediate excavation stages (steps 4-8, see Figures 4(c)–4(e)), and (iii) a violent nonlinear collapse of the entire
Kunming
N
Yunnan
0Type name
200 400 km
(a) Second pithead of the Jinning phosphate mine
+2170 m
+2120 m
+2220 m
+2270 m
+2320 m
4
56
12
1
2
13
3
89
7
1011
8 Boundary phosphate strata9 Muddy dolomite10 Layered muddy dolomite11 Boundary phosphate strata12 Off-white layered dolomite13 Dark gray layered dolomite
1 Quaternary clay2 Gray dolomite3 Off-white coarse-grained dolomite4 Dark gray cryptocrystalline dolomite5 Muddy quartz sandstone6 Layered muddy dolomite7 Phosphate strata
(b) Engineering geological section of exploration line 59
Figure 1: Engineering background.
3Geofluids
structure occurs during the final excavation stages (steps 9-10, see Figure 4(f)).
In detail, an examination of Figure 4(a) indicates thatonly 10 observation points on lines 1-3 in the vicinity of themined-out area are deformed, with a maximum subsidenceof 5mm in the central area of the stope. After steps 1-3 (seeFigure 4(b)), small degrees of separation and caving haveoccurred in the rock mass, while it still remains intact andstable. As the mining process is continued (see Figure 4(c)),the underground mining space increases. The effects extendto line 5 on the right-hand side of the underground stope,and the disturbance becomes more serious. At this time, themaximum subsidence increases to 20.5mm, and the defor-mation of the surrounding rock and overlying strata of thestope becomes intense in the area of stopes 2 and 3. The max-imum vertical displacement has increased to 25.5mm. Afterthe eighth excavation step (see Figure 4(e)), the affected areaextends to observation line 6, and the severe deformation is
mainly distributed along observation lines 1–2 on the upperleft and lines 3–4 on the upper right. At this time, the maxi-mum vertical subsidence has increased to 31.5mm. After thetenth excavation step (see Figure 4(f)), the mined area of thetwo middle sections is connected, the old mined area is “acti-vated,” and large numbers of macro through-cracks andlarge-scale pull-through microcracks are produced. At thistime, the area affected by mining activity is seen to haveincreased sharply to 130 cm, the maximum displacementhas increased to 33.2mm, and the surface of the local areahas collapsed.
In total, a gently inclined and thin- to medium-thickphosphate deposit was shown to transfer from the open pitto underground by the sublevel caving method, and the cor-responding global subsidence curve (see Figure 4, the mea-sure line 10m and 20m away from the stope) evolves fromthe irregular shape of a ladle to the final shape of a half-bowl. The results of the similar material model indicate that,
+2320 m
+2270 m
+2220 m
+2170 m
+2120 m
Observation points Observation lines
Open-pit mining
First section ofunderground mining
Second section ofunderground mining
Figure 2: Simulation monitoring scheme.
step1step2
step3step4
step5
step10step9
step8step7
step6
Figure 3: Mining method and steps.
4 Geofluids

near the mined-out area, the surrounding rock and overlyingstrata of a gently inclined, thin- to medium-thick phosphatedeposit begin to deform and break after 1-10 excavationsteps. During this process, the rock will bend and sink underthe influence of the gravity and mining stress, to finally col-lapse when the internal stress exceeds the limiting strengthof the rock stratum. The failure modes of sinking, bending,and breaking are identical for the upper and lower strata,and failure of the surrounding and overlying rock graduallyprogresses from the bottom to the top.
4. Micro Mining Response Characteristics:Numerical Simulation
4.1. Model Geometry and Boundary Conditions. In recentyears, computer technology has developed rapidly, andnumerical simulation has become an important researchmethod [49–70]. Based on the specific geological conditionsand mechanical parameters of the deep inclined medium-thick phosphate ore body in the northern area of pit 2 (Jin-ning County phosphate mine), a particle flow code (PFC)numerical model was run with the same size as that of thesimilar material model, i.e., height × width = 300 cm × 200cm; Figure 5(a) shows the particle flow code (PFC) modeldiagram, and Figure 5(b) shows the initial state of the model.
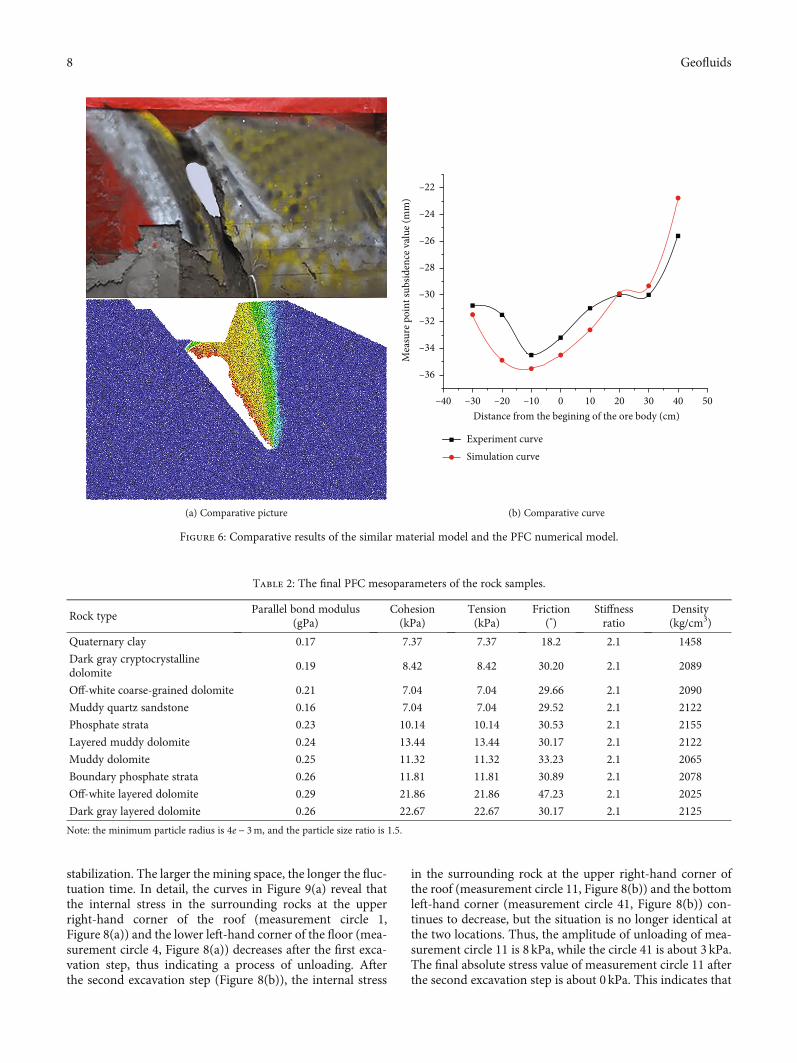
4.2. Physical and Mechanical Parameters of the Rock. Themesomechanical parameters of the PFC model were basedon the measured mechanical properties of rock samplesobtained on site. They account for the size effect and similar-ity ratio via repeated adjustments to make the simulatedsettlement close to that of the similar material model.Figure 6(a) shows the comparative picture of the experimentand simulation, Figure 6(b) shows the subsidence curve ofthe experiment and simulation, and Figure 6 shows the totalcomparative results of the similar material model and thePFC numerical model, the results illustrated the effectivenessof this simulation method, and this method can be used toanalyze the mechanical behavior of surrounding rock andoverlying strata during the mining process. Table 2 showsthe final PFC mesoparameters of the rock samples, and the
PFC calculated results are consistent with the similar mate-rial model experiment.
4.3. Model Measuring Circle Layout. According to the minepressure theory, after the underground mining, the sur-rounding rock and overlying strata are affected by miningstress and mined-out areas, and the in situ stress will redis-tribute. Figure 7 shows the in situ stress distribution afterexcavation step 1, step 2, step 5, and step 10, which illustratethe pressure increase and pressure relief zone of the sur-rounding rock and overlying strata near the goaf.
To analyze the stress changes in the surrounding rockand overlying strata at various locations after the first andsecond excavation steps, measuring circles were laid out inthe surrounding rock, roof corner, and floor corner of themined-out area, respectively. Figures 8(a) and 8(b) showthe layout of survey points on the surrounding rock andoverlying strata in the PFCmodel for the first excavation stepand the second excavation step, respectively. The left measur-ing circles (5 and 51) and the right measuring circles (2 and21) were 0.03m away from the rock surrounding the excava-tion. The measuring line was arranged at an angle bisectingthe roof and floor corner, with each measuring circle posi-tioned 0.03m away from the mined area (circles 1, 3, 4, and6 and 11, 31, 41, and 61). Another six measurement circles(1, 7, and 8 and 11, 71, and 81) were set at vertical intervalsof 0.09m on the right-hand corner of the roof in order toanalyze the changes in the internal stress of the overlyingstrata. All measuring circles had a radius of 0.03m.
4.4. PFC Simulation Results and Analysis
4.4.1. Stress Characteristics of the Surrounding Rock andOverlying Strata after Each Excavation Step. Figures 9(a)and 9(b) show the stress evolution in the overlying strata atthe upper right-hand corner of the roof and the lower left-hand corner of the floor after the first excavation step (mea-surement circles 1 and 4, respectively) and after the secondexcavation step (measurement circles 11 and 41, respec-tively). The stress evolution curves at the end of each excava-tion step indicate that the surrounding rocks experience threestress evolution stages: (i) unloading, (ii) fluctuation, and (iii)
Table 1: Rock mechanical properties.
LithologyBulk density(γ) (kN·m-3)
Modulus of elasticity(E) (GPa)
Compressive strength(σc) (MPa)
Poisson ratio (μ)Tensile strength
(σt) (MPa)
Quaternary clay 18.00 3.28 5.12 0.46 0
Gray dolomite 25.80 9.93 29.10 0.31 0.71
Off-white coarse-grained dolomite 25.28 9.99 31.50 0.29 0.78
Dark gray cryptocrystalline dolomite 25.80 9.93 29.10 0.31 0.89
Layered muddy dolomite 26.20 9.14 24.78 0.28 0.92
Muddy dolomite 24.79 6.06 17.10 0.34 0.67
Phosphatic bed 19.50 8.10 22.87 0.39 0.88
Boundary phosphate rock 26.60 13.80 37.96 0.30 1.46
Off-white layered dolomite 26.24 14.60 48.13 0.28 1.66
Charcoal gray layered dolomite 25.00 15.80 39.35 0.33 1.40
5Geofluids

–30 –25 –20 –15 –10 –5 0
–5.0
–4.5
–4.0
–3.5
–3.0
–2.5
–2.0
–1.5
–1.0
Mea
sure
poi
nt su
bsid
ence
val
ue (m
m)
Distance from the beginning of ore body (cm)
Measure point 10 m away from the stopeMeasure point 20 m away from the stopeMeasure point 30 m away from the stope
(a) First excavation step
–30 –20 –10 0 10 20
–20
–15
–10
–5
0
Mea
sure
poi
nt su
bsid
ence
val
ue (m
m)
Distance from the beginning of ore body (cm)
Measure point 10 m away from the stopeMeasure point 20 m away from the stopeMeasure point 30 m away from the stopeMeasure point 40 m away from the stopeMeasure point 50 m away from the stope
(b) Third excavation step
–30 –20 –10 0 10 20
–25
–20
–15
–10
–5
0
Mea
sure
poi
nt su
bsid
ence
val
ue (m
m)
Distance from the beginning of ore body (cm)
Measure point 10 m away from the stopeMeasure point 20 m away from the stopeMeasure point 30 m away from the stopeMeasure point 40 m away from the stopeMeasure point 50 m away from the stope
(c) Fifth excavation step
–30 –20 –10 0 10 20 30 40
–25
–20
–15
–10
–5
0
Mea
sure
poi
nt su
bsid
ence
val
ue (m
m)
Distance from the beginning of ore body (cm)
Measure point 10 m away from the stopeMeasure point 20 m away from the stopeMeasure point 30 m away from the stopeMeasure point 40 m away from the stopeMeasure point 50 m away from the stope
(d) Sixth excavation step
Figure 4: Continued.
6 Geofluids

–30 –20 –10 0 10 20 30 40 50
–35
–30
–25
–20
–15
–10
–5
0
Mea
sure
poi
nt su
bsid
ence
val
ue (m
m)
Distance from the beginning of ore body (cm)
Measure point 60 m away from the stope
Measure point 10 m away from the stopeMeasure point 20 m away from the stopeMeasure point 30 m away from the stopeMeasure point 40 m away from the stopeMeasure point 50 m away from the stope
(e) Eighth excavation step
–30 –20 –10 0 10 20 30 40 50 60 70
–35
–30
–25
–20
–15
–10
–5
Mea
sure
poi
nt su
bsid
ence
val
ue (m
m)
Distance from the beginning of ore body (cm)
Measure point 70 m away from the stopeMeasure point 80 m away from the stope
Measure point 60 m away from the stope
Measure point 10 m away from the stopeMeasure point 20 m away from the stopeMeasure point 30 m away from the stopeMeasure point 40 m away from the stopeMeasure point 50 m away from the stope
(f) Tenth excavation step
Figure 4: Subsidence displacements after each excavation step of the similar material model.
PFC2D 5.00
Ball group 1Ball (53781)
Boundary phosphate strate
Dark gray cryptocrystalline dolomite
Dark gray layered dolomite
Layered muddy dolomite
Muddy dolomite
Muddy quartz sandstone
Off-white coarse-grained dolomite
Off-white layered dolomite
Phosphate strata
Quatemary clay
(a) Particle flow code (PFC) model diagram
Geometry
Contact
ContactContact (127680)
Edge
PFC2D 5.00
(b) Initial contact force distribution
Figure 5: Particle flow code (PFC) model diagram and initial contact force distribution.
7Geofluids
stabilization. The larger the mining space, the longer the fluc-tuation time. In detail, the curves in Figure 9(a) reveal thatthe internal stress in the surrounding rocks at the upperright-hand corner of the roof (measurement circle 1,Figure 8(a)) and the lower left-hand corner of the floor (mea-surement circle 4, Figure 8(a)) decreases after the first exca-vation step, thus indicating a process of unloading. Afterthe second excavation step (Figure 8(b)), the internal stress
in the surrounding rock at the upper right-hand corner ofthe roof (measurement circle 11, Figure 8(b)) and the bottomleft-hand corner (measurement circle 41, Figure 8(b)) con-tinues to decrease, but the situation is no longer identical atthe two locations. Thus, the amplitude of unloading of mea-surement circle 11 is 8 kPa, while the circle 41 is about 3 kPa.The final absolute stress value of measurement circle 11 afterthe second excavation step is about 0 kPa. This indicates that
(a) Comparative picture
–40 –30 –20 –10 0 10 20 30 40 50
–36
–34
–32
–30
–28
–26
–24
–22
Mea
sure
poi
nt su
bsid
ence
val
ue (m
m)
Distance from the begining of the ore body (cm)
Experiment curveSimulation curve
(b) Comparative curve
Figure 6: Comparative results of the similar material model and the PFC numerical model.
Table 2: The final PFC mesoparameters of the rock samples.
Rock typeParallel bond modulus
(gPa)Cohesion(kPa)
Tension(kPa)
Friction(°)
Stiffnessratio
Density(kg/cm3)
Quaternary clay 0.17 7.37 7.37 18.2 2.1 1458
Dark gray cryptocrystallinedolomite
0.19 8.42 8.42 30.20 2.1 2089
Off-white coarse-grained dolomite 0.21 7.04 7.04 29.66 2.1 2090
Muddy quartz sandstone 0.16 7.04 7.04 29.52 2.1 2122
Phosphate strata 0.23 10.14 10.14 30.53 2.1 2155
Layered muddy dolomite 0.24 13.44 13.44 30.17 2.1 2122
Muddy dolomite 0.25 11.32 11.32 33.23 2.1 2065
Boundary phosphate strata 0.26 11.81 11.81 30.89 2.1 2078
Off-white layered dolomite 0.29 21.86 21.86 47.23 2.1 2025
Dark gray layered dolomite 0.26 22.67 22.67 30.17 2.1 2125
Note: the minimum particle radius is 4e − 3m, and the particle size ratio is 1.5.
8 Geofluids

SZZ (Pa)
–5.0E+05
–1.0E+06
–1.5E+06
–2.0E+06
–2.5E+06
–3.0E+06
–3.5E+06
–4.0E+06
–4.5E+06
(a) First excavation step
SZZ (Pa)
–5.0E+05
–1.0E+06
–1.5E+06
–2.0E+06
–2.5E+06
–3.0E+06
–3.5E+06
–4.0E+06
–4.5E+06
(b) Second excavation step
SZZ (Pa)
–5.0E+05
–1.0E+06
–1.5E+06
–2.0E+06
–2.5E+06
–3.0E+06
–3.5E+06
–4.0E+06
–4.5E+06
(c) Fifth excavation step
Figure 7: Continued.
9Geofluids

the surrounding rocks at this location are now in a state ofstress balance. However, as the excavation space increasesduring subsequent excavation steps, the unloading area willcontinue to increase. Hence, due to gravity, this part of thesurrounding rock could be placed under tension accompa-nied by internal bonds breaking and cracks appearing.
Figures 10(a) and 10(b) show the stress evolution in theoverlying strata on the right-hand side of the roof and theleft-hand side of the floor after the first excavation step (mea-surement circles 2 and 5, respectively) and after the secondexcavation step (measurement circles 21 and 51, respec-tively). An examination of Figure 10(a) indicates that theinternal stress of the surrounding rocks on the left and rightsides is increased at the end of the first excavation step. Inaddition, the increase in stress on the left side of the floor
(measurement circle 5, Figure 8(a)) is more pronounced witha maximum amplitude of ~3 kPa, whereas that on the right(measurement circle 2, Figure 8(a)) increases slightly. Asthe mining space is increased during the second excavationstep (Figure 10(b)), the pressure on measurement circle 21continues to increase, whereas that on measurement circle51 is significantly decreased, because the surrounding rockon the left side of the floor is continuously unloaded duringthe second excavation step. The absolute stress on the sur-rounding rocks on the right and left sides at the end of thesecond excavation step is about 8 kPa and 10 kPa, respec-tively, thus indicating that the rock mass was not damagedor moved. The above analysis indicates that the internalstress in the surrounding rocks on the left and right sideschanges in a complicated manner as the excavation space is
SZZ (Pa)
–5.0E+05
–1.0E+06
–1.5E+06
–2.0E+06
–2.5E+06
–3.0E+06
–3.5E+06
–4.0E+06
–4.5E+06
(d) Tenth excavation step
Figure 7: Stress distribution after underground excavation.
1
7
8
2
34
5
60.03 m
0.09 m
(a) The layout of survey points for the first step
0.03 m
0.09 m
11
71
81
21
3141
51
61
(b) The layout of survey points for the second step
Figure 8: The layout of survey points on the surrounding rock and overlying strata in the PFC model for the first excavation step and thesecond excavation step.
10 Geofluids

increased. Hence, the scope of the mining space is a key fac-tor affecting the increase in internal stress or the relief of thesurrounding rocks.
Figures 11(a) and 11(b) show the stress evolution in theoverlying strata at the upper left-hand corner of the roofand the lower right-hand corner of the floor after the firstexcavation step (measurement circles 3 and 6, respectively)and after the second excavation step (measurement circles31 and 61, respectively). The results in Figure 11(a) show that
the internal stress in the surrounding rock at the upper left-hand corner of the roof (measurement circle 3, Figure 8(a))and the lower right-hand corner of the floor (measurementcircle 6, Figure 8(a)) increases during the first excavationstep, thus indicating a concentration of stress at the two loca-tions. During the second excavation step (Figure 11(b)), theinternal stress in the surrounding rock at measurement circle31 and circle 61 continues to increase with implementation ofthe excavation space. However, the increase in pressure is
0.0–18
–16
–14
–12
–10
–8
–6
–4
–2
0St
ress
(kPa
)
Time (s)
Measurement circle 1 Measurement circle 4
(a) First excavation step
0.0–18
–16
–14
–12
–10
–8
–6
–4
–2
0
Stre
ss (k
Pa)
Time (s)
Measurement circle 11 Measurement circle 41
(b) Second excavation step
Figure 9: Stress evolution in the overlying strata at the upper right-hand corner of the roof and the lower left-hand corner of the floor after thefirst excavation step (measurement circles 1 and 4, respectively) and after the second excavation step (measurement circles 11 and 41,respectively).
0.0–20
–18
–16
–14
–12
–10
–8
–6
Stre
ss (k
Pa)
Time (s)
Measurement circle 2 Measurement circle 5
(a) First excavation step
0.0–20
–18
–16
–14
–12
–10
–8
–6
Stre
ss (k
Pa)
Time (s)
Measurement circle 21 Measurement circle 51
(b) Second excavation step
Figure 10: Stress evolution in the overlying strata on the right-hand side of the roof and the left-hand side of the floor after the first excavationstep (measurement circles 2 and 5, respectively) and after the second excavation step (measurement circles 21 and 51, respectively).
11Geofluids

more marked on the lower right, reaching about 6.5 kPa. InFigure 9(b), the unloading amplitude of the surrounding rockat the upper right-hand corner of the roof is greater duringthe second excavation. Hence, due to gravity, the roof has atendency to move downwards and the stress concentratedin the upper left-hand corner. By contrast, the stress on thesurrounding rock on the right-hand side is alleviated by theunloading of the overlying rock in the roof, thus limiting
the increase in the internal stress at the lower right-hand cor-ner of the floor.
Figures 12(a) and 12(b) show the stress evolution in theoverlying strata at vertical intervals of 0.09m on the upperright-hand corner of the roof after the first excavation step(measurement circles 1, 7, and 8) and after the second exca-vation step (measurement circles 11, 71, and 81). Duringthe first excavation step, the results in Figure 12(a) indicate
0.0–20
–19
–18
–17
–16
–15
–14
–13
–12
–11
–10St
ress
(kPa
)
Time (s)
Measurement circle 3Measurement circle 6
(a) First excavation step
0.0–20
–19
–18
–17
–16
–15
–14
–13
–12
–11
–10
Stre
ss (k
Pa)
Time (s)
Measurement circle 31Measurement circle 61
(b) Second excavation step
Figure 11: Stress evolution in the overlying strata at the upper left-hand corner of the roof and the lower right-hand corner of the floor afterthe first excavation step (measurement circles 3 and 6, respectively) and after the second excavation step (measurement circles 31 and 61,respectively).
0.0–12–11–10
–9–8–7–6–5–4–3–2–1
0
Stre
ss (k
Pa)
Time (s)
Measurement circle 1Measurement circle 7Measurement circle 8
(a) First excavation step
0.0–12–11–10
–9–8–7–6–5–4–3–2–1
0
Stre
ss (k
Pa)
Time (s)
Measurement circle 11Measurement circle 71Measurement circle 81
(b) Second excavation step
Figure 12: Stress evolution in the overlying strata at vertical intervals of 0.09m on the upper right-hand corner of the roof after the firstexcavation step (measurement circles 1, 7, and 8) and after the second excavation step (measurement circles 11, 71, and 81).
12 Geofluids

that the decrease in the internal stress on the overlying stratavaries according to the vertical depth. Specifically, the degreeof stress reduction deceases with increasing depth so that theoriginal rock level of stress maintains at a certain depth. Afterthe second excavation step (Figure 12(b)), the pattern ofpressure relief with depth is like that at the end of the firstexcavation step. It is evident that the increase in the mined-out area results in a longer fluctuation time for the internalstress in the overlying strata; i.e., the larger the mining space,the longer the overlying rock stress stabilizes.
In brief, the stress evolution curves of overlying strataafter various excavation steps (see Figures 8–11) demon-strate that a complicated pattern of internal stress distribu-tion occurs in the adjacent overlying strata during theprocess of converting from open-pit to underground min-ing. Thus, both pressure-increasing and pressure-relievingzones exist and are exactly opposite for the roof and thefloor. Moreover, the pressure-increasing and pressure-releasing zones in the roof are more severe than those atthe floor. In addition, the surrounding rocks on each sideform opposite pressure-increasing and pressure-relievingzones during the mining process, with that on the right sidebeing more obvious. Thus, there is an important relation-ship between the size of the mining space and the patternof pressure-increasing and pressure-relieving zones. Thedegree of stress reduction becomes weaken as the distancefrom the mined-out area increased, and, conversely, thepressure relief becomes more complete closer to themined-out area, with the stress release being gradually com-pleted towards the deeper parts.
4.4.2. Crack Propagation Behavior of the Surrounding Rockand Overlying Strata after Each Excavation Step. To investi-gate the mesomechanical characteristics of the surroundingrock and adjacent overlying strata after stepwise excavation,mesoscale distribution of contact forces between particles ofbinding force F and patterns of crack propagation aroundthe mined-out area are diagrammed in Figures 13–15.
Figures 13(a)–13(c) show the mesoscale force fielddistribution and crack propagation during the first, second,and third excavation steps, respectively. During step 1,Figure 13(a) reveals the presence of concentrated areas ofadhesion at the left-hand corner of the roof and the right-hand of the floor, whereas areas of weak adhesion (i.e.,pressure-relieving areas) are indicated at the other two cor-ners of the stope. As the excavation space increases duringstep 2 (see Figure 13(b)), the increase in pressure on the sur-rounding rocks becomes more marked. At the same time, thepressure-relieving areas become larger and the pressure reliefis greater. As mining continues into step 3 (see Figure 13(c)),the internal tensile stress eventually exceeds the bonding ten-sile strength. The bonds break and microcracks appear in thepressure-relieving area. This result is consistent with theanalyses in Figures 8–11 (physical modeling). Note that afew microcracks also appear in the surrounding rock on thebottom right-hand side of the mined-out area due to gravity.Since the mining space is small, there are no large-scale inter-nal cracks, and the surrounding rock and adjacent overlyingrocks remain stable after pressure relief.
Figures 14(a)–14(c) show the mesoscale force field distri-bution and crack propagation during the fourth, fifth, and
bonding forceconcentration
area
First excavation step
(a) First excavation step
unloadingarea
Second excavation step
(b) Second excavation step
fracture
Third excavation step
F max
F min
(c) Third excavation step
Figure 13: Mesoscale force field distribution and crack propagation during the first, second, and third excavation steps.
13Geofluids

sixth excavation steps, respectively. With further progress inmining and further increase in the mined-out area duringsteps 4-6, the cracks expand more noticeably (seeFigure 14). During steps 4 and 5, the cracks become arc-shaped and tend to penetrate and connect the upper andlower ends of the stope (labelled 1 in Figure 14). As the sur-rounding rock on the right ruptures and falls, the area of con-centrated cohesive force at the bottom of the surroundingrock moves towards right (area 2 in Figure 14). As the roofof the excavation is close to the ground surface, unloadingduring mining causes the cracks in the roof, which firstlyextend to the ground surface (the area labelled 3 inFigure 14(e)). After the lower part of the surrounding rockon the right-hand side falls and collapses, the cracks gradu-ally expand upwards (area 4). When the next mining levelis excavated during step 6 (see Figure 14(f)), the cracksbetween the upper and lower mining levels penetrated (area5). Due to the greater depth of the next mining level, the orig-inal rock stress is correspondingly greater and, hence, morecracks form at the bottom of the surrounding rock on theright-hand side. Thus, it leads to faster destruction of therock mass (area 6).
Figures 15(a)–15(c) show the mesoscale force field distri-bution and crack propagation during the seventh, eighth, andtenth excavation steps, respectively. During the process ofmining the next level, the crack propagation behavior isroughly the same as that under the previous mining level;i.e., the cracks extend in arc shapes and penetrate the upperand lower ends of the stope (area 2 in Figure 15). Due tothe increase in mining depth, the crack propagation rate ishigher than that of the previous mining level such that the fis-sures around the two mining levels penetrate each other (area1, see Figure 15) and subsequently propagate to the surface(areas 3 and 4, see Figure 15). At the end of the final excava-tion step, the relatively independent mined-out area has dis-appeared (see Figure 15(c)), causing the number of cracks toincrease rapidly and propagate to the surface, thus resultingin overall instability of the mined-out area.
In brief, the crack propagation behavior is characterizedby expansion in arc shapes and a tendency to penetrate theupper and lower ends of the stope. Moreover, the size ofthe excavation space is seen to play a key role in the genera-tion, propagation, and penetration of the cracks. Thus, due tothe disturbance of the first mining level and the increase in
1
2
3 4
F max
F min(a) (b) (c)
Figure 15: Mesoscale force field distribution and crack propagation during the seventh, eighth, and tenth excavation steps.
1 4
5 6
F max
F min
3
2
(a) (b) (c)
Figure 14: Mesoscale force field distribution and crack propagation during the fourth, fifth, and sixth excavation steps.
14 Geofluids
excavation depth, the damage rate of the surrounding rockand overlying rock in the second mining level is greater andmore cracks are generated, thus accelerating the instabilityof the surrounding rock and overlying strata.
5. Conclusions
The open-pit end slope, the surrounding rock of the pitbottom, and the underground mine constitute a compoundmining system after the transfer from open-pit mining tounderground mining. During the period of open-pit mining,the rock around the end of slope and the pit bottom is dis-turbed and, on this basis, the underground excavation leadsto secondary disturbance. With the advancement of the exca-vation space, the dynamic superposition of this secondarydisturbance influences the state of the underground sur-rounding rock and the overlying strata.
The present study has used similar material models andnumerical simulation methods to analyze the settlementcurves, stress changes, and crack propagation behavior ofthe surrounding rock and overlying strata during the processof converting from open-pit to underground mining. The fitof the settlement curve from the model experiment with thenumerical calculation illustrated the effectiveness of this sim-ulation method enabling an analysis of the internal stresschanges and crack propagation behavior of the surroundingrock and overlying strata during the mining process, andthe results can be concluded as follows:
(1) When a gently inclined thin- to medium-thick phos-phate deposit was transferred from open-pit tounderground mining via a sublevel caving method,the surrounding rock and overlying strata graduallyevolved from a stable state through a continuous lin-ear failure state to a final large-scale nonlinear col-lapse state. The corresponding global subsidencecurve was shown to evolve from an irregular ladleshape to a final half-bowl shape
(2) The internal stress distribution of the surroundingrock and adjacent overlying rock in the inclinedmined-out area during the process of convertingfrom open-pit to underground mining was shownto be complicated. The degrees of pressure increaseand pressure relief on the internal stress of the sur-rounding rock and the adjacent overlying strata inthe mined-out area were shown to have an importantrelationship with the size of the mining space. Specif-ically, the degree of stress reduction was weakenedwith increasing distance, and, conversely, the reliefof pressure and the release of stress became graduallymore complete towards the deeper part closer to themined-out area
(3) The cracks were shown to expand in an arc shape andhad a tendency to penetrate the upper and lower endsof the stope. The size of the excavation space wasfound to play a key role in the generation, propaga-tion, and penetration of the cracks. Due to thedisturbance of the first mining level and the increase
in excavation depth, the rate of damage to the sur-rounding and overlying rock in the second mininglevel was greater and more cracks were generated,thus accelerating the instability of the surroundingrock and overlying strata
(4) Many factors were shown to influence the evolutionand dynamic characteristics of rock mass deforma-tion and failure after the transition from open-pit tounderground mining. It is therefore necessary tostudy the time-effect and space-time evolution ofthe mining response characteristics of the rock massand the effects of various underground miningmethods
Data Availability
Data are available from the authors upon reasonable request.
Conflicts of Interest
The authors declare that they have no conflict of interest.
Acknowledgments
The research work described herein was funded by theNational Nature Science Foundation of China (NSFC)(Grant No. 41867033), State Key Laboratory of Safety andHealth of Metal Mines Open Fund (Grant No. zdsys2019-005), China Postdoctoral Science Foundation program(Grant No. 2019M650144). These financial supports aregratefully acknowledged.
References
[1] R. Q. Huang and S. W. Qi, “Engineering geology: review andprospect of past ten years in China,” Journal of EngineeringGeology, vol. 25, no. 2, pp. 257–276, 2017.
[2] R. Q. Huang, Y. S. Li, and M. Yan, “The implication and eval-uation of toppling failure in engineering geology practice,”Journal of Engineering Geology, vol. 25, no. 5, pp. 1165–1181,2017.
[3] E. Bakhtavar, “Transition from open-pit to underground inthe case of Chah-Gaz iron ore combined mining,” Journal ofMining Science, vol. 49, no. 6, pp. 955–966, 2013.
[4] C. Li, J. B. Zhu, B. Wang, Y. Z. Jiang, and P. Zeng, “Model testsfor mechanical respond of bedding rock during different exca-vation and anchoring process,” Chinese Journal of Under-ground Space and Engineering, vol. 13, no. 1, pp. 271–278,2017.
[5] X. S. Li, Y. M. Wang, K. Zhao, and S. Yang, “Research progresson the key problems in transition from open-pit to under-ground mining for metal mines,” Metal Mine, vol. 12,pp. 12–20, 2019.
[6] S. G. Sun, M. F. Cai, and S. J. Wang, “Study of sliding mecha-nism for slope due to the excavation form open pit into under-ground mine,” Chinese Journal of Rock Mechanics andEngineering, vol. 19, no. 1, pp. 126–129, 2000.
[7] G. Z. Yin, X. S. Li, and Y. J. Li, “Simulation on the deformationand failure response features and stability of a slope from openpit mining to underground mining under the effecting of
15Geofluids

excavation goaf by the floor friction model,” Journal of Univer-sity of Science and Technology Beijing, vol. 34, no. 3, pp. 231–238, 2012.
[8] W. D. Song, J. H. Du, X. C. Yang, and D. D. Tannant, “Defor-mation and failure of a high steep slope due to transformationfrom deep open pit to underground mining,” Journal of Uni-versity of Science and Technology Beijing, vol. 32, no. 2,pp. 145–151, 2010.
[9] G. Z. Yin, X. S. Li, Z. A. Wei, Y. J. Li, and Q. S. Wang, “Similarsimulation study of deformation and failure response featuresof slope and stope rocks,” Chinese Journal of Rock Mechanicsand Engineering, vol. 30, Supplement 1, pp. 2913–2923, 2011.
[10] X. S. Li, X. Y. Zhi, D. M. Zhang, and M. L. Wang, “Research ondeformation and failure character and the thickness-effect ofthe overlying strata transition from open pit to undergroundmining,” in National Engineering Geology Annual Conference,Gui Lin City, Guang Xi province, China, 2017.
[11] H. Liu, W. S. Chen, X. T. Feng, and Q. R. Chen, “Numericalmodeling of Daye iron open-pit-mine transferring to under-ground mining by discrete element method,” Rock and SoilMechanics, vol. 25, no. 9, pp. 1413–1417, 2004.
[12] F. Han, F. Xie, and J. A. Wang, “3-D numerical simulation onthe stability of rocks in transferred underground mining fromopen-pit,” Journal of University of Science and Technology Bei-jing, vol. 28, no. 6, pp. 509–514, 2006.
[13] X. Z. Shi, G. H. Huang, S. Zhang, and J. Zhou, “Goaf surround-ing rock deformation and failure features using FLAC3D inunderground mining shifted from open-pit in complex situa-tion,” Journal of Central South University (Science and Tech-nology), vol. 42, no. 6, pp. 1710–1718, 2011.
[14] J. Y. Chen, X. Z. Shi, J. Zhou, and X. Y. Qiu, “Deformation pre-diction and reliability analysis of underground mining shiftedfrom open-pit based on orthogonal experiment,” The ChineseJournal of Nonferrous Metals, vol. 26, no. 11, pp. 2383–2392,2016.
[15] Y. H. Li, “Study on digital photography-based deformationmeasurement technique and its application in geo-physicalmodel experiment,” Chinese Journal of Rock Mechanics andEngineering, vol. 24, no. 7, p. 184, 2005.
[16] W. D. Song, J. X. Fu, and D. X. Wang, “Study on physical andnumerical simulation of failure laws of wall rock due to trans-formation from open-pit to underground mining,” Journal ofChina Coal Society, vol. 37, no. 2, pp. 186–191, 2012.
[17] Y. F.Wang and F. P. Zhong, “Study on slope instability in tran-sition from open-pit to underground mining by similar exper-iment and numerical simulation,” Journal of China CoalSociety, vol. 38, Supplement 1, pp. 64–69, 2013.
[18] D. B. Zhang, Research of Similarity Model Test for Open Pit toUnderground Mining with Super High-Steep Slope, China Uni-versity Of Geosciences, Wuhan, 2013.
[19] Y. M. Zhang, F. S. Ma, J. M. Xu, and H. J. Zhao, “Deformationlaws of rock mass due to transform from open-pit to under-ground mining in high stress area,” Rock and Soil Mechanics,vol. 32, Supplement 1, pp. 590–595, 2011.
[20] J. Y. Cao, The Deformation Behavior and Occurrence Mecha-nism of Pit Surrounding Rock after the Transition from Open-Pit Mining to Underground Mining, Shandong University ofScience and Technology, Shandong, 2015.
[21] Q. H. Deng, J. Y. Cao, L. P. Zhang, F. S. Ma, and J. M. Xu,“Uplift mechanism of the bottom of open pit after the transi-tion from open-pit mining to underground mining in Long-
shou mine,” Journal of Mining and Safety Engineering,vol. 32, no. 4, pp. 677–682, 2015.
[22] T. B. Jia, “The dynamic prediction of environment damageinduced by the excavation from open-pit into undergroundmine,” Journal of Safety Science and Technology, vol. 11,no. 3, pp. 99–104, 2015.
[23] N. Jiang, C. B. Zhou, S. W. Lu, and Z. Zhang, “Propagation andprediction of blasting vibration on slope in an open pit duringunderground mining,” Tunnelling and Underground SpaceTechnology, vol. 70, no. 1, pp. 409–421, 2017.
[24] G. W. Cheng, C. X. Chen, L. C. Li et al., “Numerical modellingof strata movement at footwall induced by underground min-ing,” International Journal of Rock Mechanics and Mining Sci-ences, vol. 108, pp. 142–156, 2018.
[25] X. M. Fan, F. Y. Ren, D. Xiao et al., “Improved induced cavingmining method for hanging wall ore with deep concave fea-tures,” Dongbei Daxue Xuebao/Journal of Northeastern Uni-versity, vol. 39, no. 9, pp. 1321–1326, 2018.
[26] X. M. Fan, F. Y. Ren, D. Xiao, and Y. C. Mao, “Opencast tounderground iron ore mining method,” Journal of CentralSouth University of Technology Science & technology of miningand metallurgy, vol. 25, no. 7, pp. 1813–1824, 2018.
[27] F. Y. Ren, B. H. Tan, Y. Fu, and Q. Zhu, “Slope failure causedby hanging-wall ores mining by induced cavingmethod,” Jour-nal of Northeastern University (Natural Science), vol. 40, no. 2,pp. 273–277+283, 2019.
[28] B. Regassa, N. Xu, and G. Mei, “An equivalent discontinuousmodeling method of jointed rock masses for DEM simulationof mining-induced rock movements,” International Journal ofRock Mechanics and Mining Sciences, vol. 108, pp. 1–14, 2018.
[29] K. Xia, C. Chen, Y. Deng et al., “In situ monitoring and analy-sis of the mining-induced deep ground movement in a metalmine,” International Journal of Rock Mechanics and MiningSciences, vol. 109, pp. 32–51, 2018.
[30] R. Yong, J. Ye, B. Li, and S. G. du, “Determining the maximumsampling interval in rock joint roughness measurements usingFourier series,” International Journal of Rock Mechanics andMining Sciences, vol. 101, pp. 78–88, 2018.
[31] Y. Zhao, T. H. Yang, M. Bohnhoff et al., “Study of the rockmass failure process and mechanisms during the transforma-tion from open-pit to underground mining based on micro-seismic monitoring,” Rock Mechanics and Rock Engineering,vol. 51, no. 5, pp. 1473–1493, 2018.
[32] Q. Y. Zhang, Y. Zhang, K. Duan, C. C. Liu, Y. S. Miao, andD. Wu, “Large-scale geo-mechanical model tests for the stabil-ity assessment of deep underground complex under true-triaxial stress,” Tunnelling and Underground Space Technol-ogy, vol. 83, no. 1, pp. 577–591, 2019.
[33] C. Zhang, P. Zou, Y. Wang, T. Jiang, H. Lin, and P. Cao, “Anelasto-visco-plastic model based on stress functions for defor-mation and damage of water-saturated rocks during thefreeze-thaw process,” Construction and Building Materials,vol. 250, article 118862, 2020.
[34] C. Zhang, Y. Wang, and T. Jiang, “The propagation mecha-nism of an oblique straight crack in a rock sample and theeffect of osmotic pressure under in-plane biaxial compres-sion,” Arabian Journal of Geosciences, vol. 13, no. 15, p. 736,2020.
[35] R. Cao, R. Yao, J. J. Meng, Q. Lin, H. Lin, and S. Li, “Failuremechanism of non-persistent jointed rock-like specimensunder uniaxial loading: laboratory testing,” International
16 Geofluids
Journal of Rock Mechanics and Mining Sciences, vol. 132, arti-cle 104341, 2020.
[36] R. H. Cao, R. Yao, T. Hu, C. Wang, K. Li, and J. Meng, “Failureand mechanical behavior of transversely isotropic rock undercompression-shear tests: laboratory testing and numericalsimulation,” Engineering Fracture Mechanics, vol. 241, article107389, 2021.
[37] R. H. Cao, C. Wang, R. Yao et al., “Effects of cyclic freeze-thawtreatments on the fracture characteristics of sandstone underdifferent fracture modes: laboratory testing,” Theoretical andApplied Fracture Mechanics, vol. 109, article 102738, 2020.
[38] Y. X. Wang, S. B. Shan, C. Zhang, and P. P. Guo, “Seismicresponse of tunnel lining structure in a thick expansive soilstratum,” Tunnelling and Underground Space Technology,vol. 88, pp. 250–259, 2019.
[39] Y. Chen, G. Wen, and J. Hu, “Analysis of deformation charac-teristics of fully grouted rock bolts under pull-and-shear load-ing,” Rock Mechanics and Rock Engineering, vol. 53, no. 7,pp. 2981–2993, 2020.
[40] Y. Zhao, L. Zhang, J. Liao, W. Wang, Q. Liu, and L. Tang,“Experimental study of fracture toughness and subcriticalcrack growth of three rocks under different environments,”International Journal of Geomechanics, vol. 20, no. 8, article04020128, 2020.
[41] Y. Zhao, L. Zhang, W. Wang, Q. Liu, L. Tang, and G. Cheng,“Experimental study on shear behavior and a revised shearstrength model for infilled rock joints,” International Journalof Geomechanics, vol. 20, no. 9, article 04020141, 2020.
[42] Y. Zhao, C. Zhang, Y.Wang, and H. Lin, “Shear-related rough-ness classification and strength model of natural rock jointbased on fuzzy comprehensive evaluation,” International Jour-nal of Rock Mechanics and Mining Sciences, vol. 137, article104550, 2021.
[43] Y. Zhao, C. L. Wang, and J. Bi, “Analysis of fractured rock per-meability evolution under unloading conditions by the modelof elastoplastic contact between rough surfaces,” RockMechanics and Rock Engineering, vol. 53, no. 12, pp. 5795–5808, 2020.
[44] S. J. Xie, H. Lin, Y. Chen, R. Yong, W. Xiong, and S. Du, “Adamage constitutive model for shear behavior of joints basedon determination of the yield point,” International Journal ofRock Mechanics and Mining Sciences, vol. 128, article 104269,2020.
[45] S. J. Xie, H. Lin, Y. Wang et al., “A statistical damage constitu-tive model considering whole joint shear deformation,” Inter-national Journal of Damage Mechanics, vol. 29, no. 6,pp. 988–1008, 2020.
[46] Y. Zheng, C. Chen, F. Meng, H. Zhang, K. Xia, and X. Chen,“Assessing the stability of rock slopes with respect to block-flexure toppling failure using a force-transfer model andgenetic algorithm,” Rock Mechanics and Rock Engineering,vol. 53, no. 8, pp. 3433–3445, 2020.
[47] R. Jiang, F. Dai, Y. Liu, and A. Li, “Fast marching method formicroseismic source location in cavern-containing rockmass:performance analysis and engineering application,” Engineer-ing, vol. 4, 2020.
[48] C. Zhang, Y. Wang, H. Ruan, B. Ke, and H. Lin, “The straincharacteristics and corresponding model of rock materialsunder uniaxial cyclic load/unload compression and theirdeformation and fatigue damage analysis,” Archive of AppliedMechanics, 2021.
[49] Y. Zheng, C. Chen, F. Meng, T. Liu, and K. Xia, “Assessing thestability of rock slopes with respect to flexural toppling failureusing a limit equilibrium model and genetic algorithm,” Com-puters and Geotechnics, vol. 124, article 103619, 2020.
[50] Y. Zheng, C. Chen, T. Liu, H. Zhang, and C. Sun, “Theoreticaland numerical study on the block-flexure toppling failure ofrock slopes,” Engineering Geology, vol. 263, article 105309,2019.
[51] Y. Zheng, C. Chen, T. Liu, D. Song, and F. Meng, “Stabilityanalysis of anti-dip bedding rock slopes locally reinforced byrock bolts,” Engineering Geology, vol. 251, pp. 228–240, 2019.
[52] Y. Zheng, C. Chen, T. Liu, H. Zhang, K. Xia, and F. Liu, “Studyon the mechanisms of flexural toppling failure in anti-inclinedrock slopes using numerical and limit equilibrium models,”Engineering Geology, vol. 237, pp. 116–128, 2018.
[53] Y. Chen and H. Lin, “Consistency analysis of Hoek-Brown andequivalent Mohr-Coulomb parameters in calculating slopesafety factor,” Bulletin of Engineering Geology and the Environ-ment, vol. 78, no. 6, pp. 4349–4361, 2019.
[54] H. Lin, H. Yang, Y. Wang, Y. Zhao, and R. Cao, “Determina-tion of the stress field and crack initiation angle of an open flawtip under uniaxial compression,” Theoretical and AppliedFracture Mechanics, vol. 104, article 102358, 2019.
[55] Y. Wang, P. Guo, H. Lin et al., “Numerical analysis of fiber-reinforced soils based on the equivalent additional stress con-cept,” International Journal of Geomechanics, vol. 19, no. 11,article 04019122, 2019.
[56] X. Fan, Z. Yang, and K. Li, “Effects of the lining structure onmechanical and fracturing behaviors of four-arc shaped tun-nels in a jointed rock mass under uniaxial compression,” The-oretical and Applied Fracture Mechanics, vol. 112, p. 102887,2021.
[57] J. Meng, X. Zhang, J. Huang, H. Tang, H. Mattsson, andJ. Laue, “A smoothed finite element method using second-order cone programming,” Computers and Geotechnics,vol. 123, article 103547, 2020.
[58] F. Wang, P. Cao, Y. Wang, R. Hao, J. Meng, and J. Shang,“Combined effects of cyclic load and temperature fluctuationon the mechanical behavior of porous sandstones,” Engineer-ing Geology, vol. 266, article 105466, 2020.
[59] K. Li, Y. Cheng, Z. Y. Yin, D. Han, and J. Meng, “Size effects ina transversely isotropic rock under Brazilian tests: laboratorytesting,” Rock Mechanics and Rock Engineering, vol. 53, no. 6,pp. 2623–2642, 2020.
[60] K. H. Li, Z. Y. Yin, Y. Cheng, P. Cao, and J. Meng, “Three‐dimensional discrete element simulation of indirect tensilebehaviour of a transversely isotropic rock,” International Jour-nal for Numerical and Analytical Methods in Geomechanics,vol. 44, no. 13, pp. 1812–1832, 2020.
[61] H. Lin, Y. Zhu, J. Yang, and Z. Wen, “Anchor stress and defor-mation of the bolted joint under shearing,” Advances in CivilEngineering, vol. 2020, Article ID 3696489, 10 pages, 2020.
[62] C. Y. Zhang, C. Pu, R. Cao, T. Jiang, and G. Huang, “The sta-bility and roof-support optimization of roadways passingthrough unfavorable geological bodies using advanced detec-tion and monitoring methods, among others, in the Sanmen-xia Bauxite Mine in China’s Henan Province,” Bulletin ofEngineering Geology and the Environment, vol. 78, no. 7,pp. 5087–5099, 2019.
[63] H. Lin, D. Lei, R. Yong, C. Jiang, and S. du, “Analytical andnumerical analysis for frost heaving stress distribution within
17Geofluids

rock joints under freezing and thawing cycles,” EnvironmentalEarth Sciences, vol. 79, no. 12, p. 305, 2020.
[64] H. Lin, X. Zhang, R. Cao, and Z. Wen, “Improved nonlinearBurgers shear creep model based on the time-dependent shearstrength for rock,” Environmental Earth Sciences, vol. 79, no. 6,p. 149, 2020.
[65] Z. M. He, D. Xiang, Y. X. Liu, Q. F. Gao, and H. B. Bian,“Deformation behavior of coarse-grained soil as an embank-ment filler under cyclic loading,” Advances in Civil Engineer-ing, vol. 2020, Article ID 4629105, 13 pages, 2020.
[66] Z. M. He, Z. F. Liu, X. H. Liu, and H. B. Bian, “Improvedmethod for determining active earth pressure consideringarching effect and actual slip surface,” Journal of Central SouthUniversity, vol. 27, no. 7, pp. 2032–2042, 2020.
[67] X. Fan, X. Jiang, Y. Liu, H. Lin, K. Li, and Z. He, “Local stressdistribution and evolution surrounding flaw and openingwithin rock block under uniaxial compression,” Theoreticaland Applied Fracture Mechanics, vol. 112, article 102914, 2021.
[68] H. Ozturk and D. Guner, “Laboratory and distinct elementanalysis of the deformability behaviour of thin spray-onliners,” International Journal of Rock Mechanics and MiningSciences, vol. 123, article 104118, 2019.
[69] Y. Zhou, D. Zhao, Q. Tang, and M. Wang, “Experimental andnumerical investigation of the fatigue behaviour and crackevolution mechanism of granite under ultra-high-frequencyloading,” Royal Society Open Science, vol. 7, no. 4, 2020.
[70] J. C. Wang, W. J. Wei, J. W. Zhang, B. Mishra, and A. Li,“Numerical investigation on the caving mechanism with dif-ferent standard deviations of top coal block size in LTCC,”International Journal of Mining Science and Technology,vol. 30, no. 5, pp. 34–42, 2020.
18 Geofluids