economic impact of rock climbing on the communities surrounding … study rrg_… · ·...
TRANSCRIPT

Economic impact of rock climbing on the communities surrounding the Red River Gorge, Kentucky
Unpublished Master’s Thesis Will Hobbs, M.S.
Western Kentucky University 2002

ECONOMIC IMPACT, IMPLAN, ROCK CLIMBING, RED RIVER GORGE
Hobbs, Abridged Thesis, 2002
1
Abstract The sport of rock climbing has exploded in America over the last decade resulting in
millions of climbers flocking to the available areas near and far from their home. Such traffic
demands clear and effective policy-making from land managers, public and private, in order to
conserve and protect valuable natural resources. The Red River Gorge area hosts thousands of
climbers each year and contains over 1,000 climbing routes in ten separate areas with an array of
amenities for lodging, food, and other recreation. However, no research has been completed to
determine the benefits of these climbing resources for local businesses and residents.
This study was designed to investigate the economic impact of rock climbers on the local
communities in and around the Red River Gorge area. Surveys obtained from 141 climbing
groups over fifty-one days provided travel distances, group size, trip duration, and the amount of
expenditure inside and outside the Gorge area. Climbers surveyed spent $34,708.45 in
Kentucky, an average of $28.17 per climber per day. Specifically within the delineated Gorge
area, the expenditure totaled $25,563.50, or $19.95 per climber per day. The data were analyzed
using the input-output model, IMPLAN, to determine the impact on employee compensation,
labor income, total value added, and employment in the designated area. The total economic
effect inside the Gorge area, based on $1 million in annual climber expenditure, was $307,318.

ECONOMIC IMPACT, IMPLAN, ROCK CLIMBING, RED RIVER GORGE
Hobbs, Abridged Thesis, 2002
2
Americans have been scaling backyard bluffs and wilderness peaks for centuries,
pioneering traditions and methods with little need for regulation or management consideration.
Rock climbing places many demands on its participants: mental and physical agility, prowess,
stamina, and more often than not, a human partner. In the constant search for new companions
to go climbing, Americans have spread the addiction far and wide. The Outdoor Industry
Association Participation Study in 1997 indicated 200 climbing gyms were operating in the
United States. In two years, that figure more than doubled to 500 gyms nationwide. The current
tally of active climbing participants is approximately 7 million persons with nearly 25 million
people having participated in technical climbing at least once (Grijalva, 2000). Growth means
more participants, which in turn means greater impact environmentally, socially, and
economically.
Although impact does not necessarily mean the destruction of resources, it does present
the need for smart management. Effective administrative decisions require quality information
on all aspects of the affected resource, including usage data, social and economic effects, and
environmental concerns. However, the increase in rock climbing participation over the past
decade is stressing current public and private management systems (Grijalva, 2000). In fact, the
current tendency is to shut down climbing areas altogether or limit climbing to certain areas at
the first sign of trouble (Ekstrand, 1994). The effects that such a ruling may have on the local
and national economy have been the subject of several recent studies, although some would
argue that changes in management strategies or policy do not directly affect recreation visitation
at a given location (Alward et al, 1998).
This study was designed to provide information applicable to climbing management
decisions in the Red River Gorge area by examining the extent of the economic impact of
ECONOMIC IMPACT, IMPLAN, ROCK CLIMBING, RED RIVER GORGE
Hobbs, Abridged Thesis, 2002
3
climbing on the local region. The background of the Red River Gorge area and the history of
climbing in the area are presented along with a summary of the local businesses and
municipalities and a brief listing of related terms and definitions. The professional literature
related to this study including summations of the economic research mentioned above are
reviewed in Chapter 2. In Chapter 3, the researcher discusses the methodology chosen and the
rationale for the research protocol. The survey tool is also outlined in detail. The findings and
analysis of the research are presented in Chapter 4, and the implications of this study and
opportunities for future research are discussed in Chapter 5.
Background and history of the Red River Gorge area
Located in the wooded hills of eastern Kentucky, the Red River Gorge Geological Area
(RRGGA) lies within the Daniel Boone National Forest and is currently managed by the United
States Forest Service (USFS). The U.S. government began to investigate the area during the
1920’s and had purchased the majority of the land by the 1930’s. In 1937, President Franklin D.
Roosevelt established the Cumberland National Forest; in 1966 the name was changed to Daniel
Boone National Forest under President Johnson (Ruchhoft, 1986). Today, the Red River Gorge
area covers approximately 53,000 acres within the forest and extends into Powell, Menifee, and
Wolfe Counties. Based on the numerous natural arches, rock shelters, caves, and other natural
features, approximately 28,000 acres within the Gorge received the distinction of National
Geologic Area in the 1970’s. Directly to the east lies the Clifty Wilderness Area, a federally
protected wilderness that boasts some 9,000 acres. The Red River cuts through the heart of the
Gorge and has been designated a Wild & Scenic River. The 2,000-acre Natural Bridge State
Resort Park (NBSRP) is situated due south of the RRGGA in Wolfe County and is managed
separately by the commonwealth of Kentucky.
ECONOMIC IMPACT, IMPLAN, ROCK CLIMBING, RED RIVER GORGE
Hobbs, Abridged Thesis, 2002
4
Motorized access to the Gorge is limited to Kentucky backroads and the heavily traveled
Mountain Parkway, which provides east/west access from Winchester (30 miles west), and
Pikeville (70 miles east). Highway 11 from Beattyville in the south splits the state park and
arrives at the RRGGA at Slade, Kentucky, Exit 33 on the Parkway. The Mountain Parkway and
Highway 11 are the most popular routes for gaining access to the area. State Road 715 and 77
connect and loop north through the RRGGA from the town of Pine Ridge west to Nada. State
Road 77 provides access to those few traveling in from north of the area. Paralleling the
Parkway, State Road 15 moves west from Campton past Clay City and continues through Powell
County. The closest regional airport is in Lexington, Kentucky, 50 miles west. The only trains
running through the area are used for mining and other commercial purposes. According to
Forest Service officials, the RRGGA receives over 468,000 visitors per year. This information is
based on vehicle counts and other visitor surveys (J. Hersel, USFS, personal communication,
March 28, 2002). The Natural Bridge State Resort Park receives nearly 1 million visitors per
year (R. Drake, NBSRP, personal communication, March 29, 2002).
The businesses found in the area create a diverse economic picture; however, most
revolve around the tourism industry, whether through entertainment or lodging or necessities
such as groceries or gasoline. The largest of the three counties, Powell (pop. 13,237), boasts two
dozen commercial and industrial members from the Gorge area including a go-cart track, several
bed and breakfast inns, rental cabins, gift shops, trading posts, several guide/outfitter services,
and a sky lift. Gas stations, groceries, restaurants and many motels provide the basic services
(PCCC, 2002). Outside the national forest, Powell County includes the incorporated towns of
Stanton and Clay City, which are relatively well-developed cities. According to the 2000 U.S.
ECONOMIC IMPACT, IMPLAN, ROCK CLIMBING, RED RIVER GORGE
Hobbs, Abridged Thesis, 2002
5
Census, the county has a non-agricultural labor base of 2,461 persons in 179 private
establishments. This figure increased 44% from 1990 (U.S. Census, 2000).
Within Wolfe County (pop. 7,065), Cliffview Resort and Torrent Falls Bed & Breakfast
are two options that provide food and lodging. The owners of Torrent Falls have recently
constructed a steel ladder system, or via ferratta (Latin, meaning “the iron way”), allowing for
easy, safe access to high places for those with little or no climbing experience. This activity is
the first of its kind in North America. NBSRP offers a full-service lodge in addition to miles of
hiking trails, a swimming pool, special events, restaurant dining, and much more. Recreational
vehicle and tent camping is allowed both within the state park campgrounds and the RRGGA
campgrounds. Campton, which lies to the east of the RRGGA, is Wolfe County’s only
incorporated city (Wolfe County Web, 2002). The largest employer in Wolfe County is state and
local government (362 employees). Manufacturing firms employ 282 persons, service
organizations provided 215 jobs, and wholesale and retail trade support 196 jobs (Wolfe County
Web, 2002).
Menifee County (pop. 6,556) lies due north of the RRGGA and is largely covered by the
national forest. Frenchburg is the only incorporated town, but its location is well off the beaten
path taken to reach the Red River Gorge area. The U.S. Census in 2000 listed 564 private non-
farm jobs in the county.
Recreation opportunities abound within the Gorge area. The RRGGA boasts the highest
concentration of rock shelters east of the Rocky Mountains and the largest trail system in
Kentucky. Trails wind from the natural arches to the ridgetops with sweeping views and back to
the densely forested bottoms. Many of the arches and shelters are accessible a short distance
from a parking area allowing persons of all ages and abilities to enjoy the natural splendor. The

ECONOMIC IMPACT, IMPLAN, ROCK CLIMBING, RED RIVER GORGE
Hobbs, Abridged Thesis, 2002
6
RRGGA hosts a reconstructed historic log house and farm, complete with a small herd of bison,
at the Gladie Historic Site. A Forest Service-managed campground at Koomer Ridge provides
lodging for the outdoor-oriented. Paddling enthusiasts can enjoy the miles of the Red River that
snake through the Gorge. The adjacent Clifty Wilderness Area provides much-needed solitude
from the rigors of daily life. Rock climbing and rappelling are popular activities. Off-road
vehicles, mountain bikes, and horses are not allowed within the RRGGA or the Clifty Wilderness
Area.
Rock walls, cliffs, and boulders are scattered about the region. While most of the
documented climbing routes are found inside the RRGGA, numerous routes can be found
throughout the region. Modern climbers began exploring the walls and bluffs in the 1950’s, and
a few routes were published in the “Cumberland Climbers’ Climbing Guide” (Bronaugh, 1998).
The 1970’s saw an increase in climbing traffic and more official guidebooks documenting
established climbing routes. With the advent of safe bolting methods and techniques (drilling
permanent anchors fixed in the rock) in the late 1980’s, the number of routes in the Gorge
increased to about 300. In the 1990’s, the Gorge area exploded with new routes as more and
more walls were “discovered” and developed. The most recent guidebook, Bronaugh’s Red
River Gorge Climbs (1998), lists more than 1,000 climbing routes of varying difficulty and style
in ten separate regions on over 100 different walls, and more are added every year. The Red
River Gorge is regularly featured in the leading climbing magazines and receives attention from
domestic and international climbers.
Purpose of Study
Without a full understanding of the economic benefits of rock climbing, some
communities with enormous climbing resources have been reluctant to accept and promote rock

ECONOMIC IMPACT, IMPLAN, ROCK CLIMBING, RED RIVER GORGE
Hobbs, Abridged Thesis, 2002
7
climbing as a legitimate recreational activity. Further, many management policies currently in
place in climbing areas around the nation can be classified as reactive rather than pro-active.
The rule-of-thumb has generally been to ban all climbing at first question, regardless of the facts
(Ekstrand, 1994). As most management policies are based on the economic ramifications of the
policy implementation, it stands to reason that a study on the economics of rock climbing would
be beneficial to managers and communities hosting climbing resources.
The motivation for this study was fueled in part by the current dearth of information on
the economics of climbing. In spite of the fact that the Red River Gorge area has long been a
popular destination for climbers, no research had been undertaken to establish the level of
economic impact rock climbing has on the area. To that end, this project was focused on
providing data helpful to a variety of interests when considering climbing management
decisions. Specifically, the researcher tried to determine whether the sport of rock climbing had
an impact on the economies of the communities in and around the Red River Gorge and to
describe the impact in detail.
Statement in lieu of hypothesis
Using the expenditure data collected from climbers, the researcher will study the level of
economic impact in Powell, Wolfe, and Menifee Counties due to rock climbing. Climbers spend
large amounts of money inside the demarcated Gorge area; this expenditure will be analyzed and
the actual economic impact extracted.
Significance of Study
As stated earlier, effective management begins with up-to-date and accurate information
including the nature of user groups and levels of participation. At the time of this investigation,
the research related to rock climbers in the Gorge was limited to a general visitor study by the

ECONOMIC IMPACT, IMPLAN, ROCK CLIMBING, RED RIVER GORGE
Hobbs, Abridged Thesis, 2002
8
Forest Service in 1993 and a survey of climbing traffic (quantity of climbers over a given time
period) at two locations within the RRGGA (Red River Gorge Climbers’ Coalition, 1998).
Although the resulting Coalition study produced a visitor baseline for the two surveyed climbing
areas, no additional information on individual climber behavior (including economic, social,
travel or otherwise) was obtained. Both studies are discussed in greater detail in Chapter 2.
Alward et al (1998) expressed the importance of accurate economic information for
management decision:
In many areas near Forest Service lands, there exists an economic structure that has
evolved to directly support the activities that occur on Forest Service property. Many of
these businesses depend, in whole or in part, on how the public lands are managed (p. 2).
Consequently, this research was directed towards providing information useful to the respective
public land managers and private landowners; retail, resort, and restaurant businesses; local
commerce commissions; and local residents when considering rock climbers directly. The
information gathered can be utilized in developing climbing management plans, marketing
strategies for businesses and tourism agencies, and, most importantly, resource management
plans. The study also yielded a model for further exploration of climbing impacts at other
locations throughout the world.
Delimitations
The size of the sample was limited to 141 participants. To reduce instances of bias, the
survey was not submitted to the membership rolls of local climbing organizations. Surveys were
distributed in person rather than by mail in order to increase the response rate. Because the study
focused on the spending habits of rock climbers, non-climbers were not surveyed. The survey
time period was delimited to approximately sixty days through February and March 2002.
ECONOMIC IMPACT, IMPLAN, ROCK CLIMBING, RED RIVER GORGE
Hobbs, Abridged Thesis, 2002
9
Individuals with a home zip code inside the delineated Gorge area (defined as locals) were also
excluded from consideration.
Limitations
Because of the nature of the survey, the researcher was primarily concerned with inflated
or deflated responses from participants due to memory, unknown bias for or against, and
inability to accurately forecast future expenditures. The information obtained in this study relied
on the estimates of the participants for several key questions. However, this method is the most
reliable and the most feasible for gathering the necessary data. As with all economic impact
studies, the figures obtained can at best be considered “guesstimates” (Crompton, 2002). It is
crucial to understand this limitation when considering the results.
The basic premise of any impact study involves positioning various forms of economic
activity within the appropriate sector and applying the correct variables in order to determine the
effect. “Thus, any measure of economic effects must be done with reference to some particular
accounting stance or framework” (Alward et al 1998, p. 2). This research project was designed
around the analysis model, IMPLAN, an economic software program licensed to the USFS.
Prior to the initial data gathering phase, the investigator gained tenuous permission to use the
program under supervision of Forest Service personnel. However, at the start of data analysis,
the researcher was notified that the license agreement between the USFS and the Minnesota
IMPLAN Group prohibited outside users. However, Susan Winter of the USFS, Fort Collins,
agreed to run IMPLAN using the data collected from this study.
Lastly, in order to relate spending to an annual basis, it is critical for any expenditure
analysis to have a valid and credible figure for the number of visitors or visits the area or site
receives per year. To date, no scientifically sound studies have gathered this information for

ECONOMIC IMPACT, IMPLAN, ROCK CLIMBING, RED RIVER GORGE
Hobbs, Abridged Thesis, 2002
10
climbers in the entire Red River Gorge area. Accordingly, any extrapolation to a yearly figure is
tenuous at best and based solely on estimates rather than hard data. Without such data, the
impact analysis was limited in its scope.
Assumptions
The investigator made all analyses and conclusions based on the assumption that
participants completed the survey honestly. It was further assumed that the volunteers did not
tamper with or otherwise adjust completed questionnaires. The investigator provided specific
survey collection training to volunteers and assumed that the data was obtained according to
these preset guidelines.
Definition of Terms
The following terms were related to the research and are defined below to increase the
reader’s understanding of study-specific language:
1. Bouldering – the simplest form of climbing, usually only several feet off the ground,
consisting of a number of moves from start to finish without ropes or harness.
2. Yosemite Decimal System (YDS) – a method of rating rock climbs according to
difficulty; an open ended scale starting at 5.0, currently ending at 5.15a; ratings above 5.9
are subdivided into “a-d” levels, i.e. 5.10a, 5.10b, etc.; climbs above the 5.10a level
require specialized equipment and technique and strength training.
3. Immediate group – the total number of persons traveling with the participant for whom
he or she may be paying expenses (Crompton, 2001).
4. IMPLAN – IMpact analysis for PLANning software developed by the U.S. Forest
Service in 1979 (Minnesota IMPLAN Group, 1997); used in conjunction with local
databases providing comprehensive economic data based on zip code; calculates eight

ECONOMIC IMPACT, IMPLAN, ROCK CLIMBING, RED RIVER GORGE
Hobbs, Abridged Thesis, 2002
11
different measures of economic impact including four most common: sales, personal
income, value added, and employment (Crompton, 2001).
5. Inside the Red River Gorge area – For the purposes of this study, this refers to the
counties that share borders running through the RRGGA, Powell, Menifee, and Wolfe
Counties. The majority of all rock climbs in the area are in one of the three counties.
6. Red River Gorge Climber’s Coalition (RRGCC) – a non-profit organization for
climbers dedicated to working with landowners and managers to protect access to Gorge
climbing areas and create equitable solutions to access conflicts within the area.
7. Rock climber – any person who has participated in the sport of rock climbing at least
once whether inside or outside the Gorge area.
8. Route – the vertical rock path or trail a climber follows created by the series of holds or
weaknesses in a rock face.
9. Sport climbing – a style of climbing involving using fixed anchors in the rock (drilled
bolts) to protect against a ground fall.
10. Traditional climbing – a style of climbing involving using removable anchors placed
while climbing to protect against a ground fall.
11. Trip – For this study, a trip is defined as the elapsed time from when the individual left
home to when he/she returns home.
12. Employment impact – the number of jobs created economy-wide due to climber
expenditures.
13. Total Value Added Impact – gross local product generated by climber spending.
Similar to the Gross National Product.

ECONOMIC IMPACT, IMPLAN, ROCK CLIMBING, RED RIVER GORGE
Hobbs, Abridged Thesis, 2002
12
14. Labor Income Impact – A subset of total value added; total increase in employee
compensation and proprietor’s income from climber expenditures.
15. Employee Compensation Impact – a subset of total value added; the total increase in
salaries and benefits from climber spending.
16. Leakage – an economic loss to a community occurring whenever money is spent on
goods or services that are imported from outside the local community (McIntosh &
Goeldner, 1984).
17. Climbing Day – equal to one climber spending one day at a site; if eight climbers are
intercepted on one day, then eight climbing days are noted.
Review of related literature
The author attempted to determine the economic impact of rock climbing on the
communities within the Red River Gorge area by collecting expenditure data directly from
climbers. Other studies have been designed using various methods to determine the economics
of climbing. As such, the literature related to this study tended to fall into one of three
categories: 1) Red River Gorge-specific information, 2) rock climbing management and
participation, and 3) economic research and development.
Red River Gorge
Although managed by the USFS, the Gorge area has been the subject of few research
projects. In fact, no data on climbers existed until 1997 when members of the Red River Gorge
Climbers’ Coalition (RRGCC) conducted an observation-based survey. The objective of the
study was to determine the ratio of climbers vs. non-climbers and analyze the distribution of
climbers over various routes and difficulty grades at two prominent areas in the Gorge (RRGCC,
1998). Volunteers were assigned to conduct a physical count of climbers and vehicles at the

ECONOMIC IMPACT, IMPLAN, ROCK CLIMBING, RED RIVER GORGE
Hobbs, Abridged Thesis, 2002
13
Martin Fork Trailhead, which serves Military Wall and Left Flank Wall. Parking lot, hiking
trails, and climbing wall observations were recorded from May 1997 to November 1997. Fifty-
one separate surveys were conducted over the period of research. Of the 992 vehicles recorded
in the Martin Fork parking lot, 75% were from Kentucky, Ohio, Indiana, and Michigan; 35 other
states and two Canadian provinces were also represented (RRGCC, 1998). Over the six-month
period, 2,023 individuals were active in the Martin Fork area. Of these, 1,509 persons were
participating in rock climbing, while an additional 178 were “potential” climbers surveyed on the
access trails. Researchers concluded that 83% of visitors to the Martin Fork area were climbers
and 17% were casual hikers. By combining visitor and car counts, each vehicle at the Martin
Fork area brought an average of 2.04 visitors (RRGCC, 1998). The type of data collected did not
permit total annual climbing participation calculations.
The most extensive research to date on climbing resources within the Gorge was
originally conducted by John Bronaugh in 1993. Five years later, revisions were made, new
routes added and the second edition of Red River Gorge Climbs was produced (Bronaugh, 1998).
In this comprehensive guidebook, the Gorge area is subdivided into ten regions with each
containing multiple climbing walls. Each wall is described by type of access, size, and quantity
of individual routes. Route information includes brief start-to-finish directions, length in feet,
difficulty grade, type (sport, traditional, or mixed), and credits for the first ascent. Additional
information on the ancient and modern history of man in the region, and the local history of
climbing is also provided. Bronaugh tallied 1039 climbing routes found in the Red River Gorge
area. Of those, 631 were classified as traditional (61%), 355 as sport (34%), and 53 classified as
mixed (5%). The majority of routes (77%) fall into the moderate range on the Yosemite Decimal
System (YDS) difficulty scale (5.8 to 5.12) (Bronaugh, 1998).
ECONOMIC IMPACT, IMPLAN, ROCK CLIMBING, RED RIVER GORGE
Hobbs, Abridged Thesis, 2002
14
Climbing management and participation
The Access Fund recently published the primary work regarding climbing management
entitled Climbing management: A guide to climbing issues and the production of a climbing
management plan (2001). The goal of the publication was to share information and promote
management consistency between climbing areas in the United States. The guide contains
information regarding climbing and cultural resource protection, management issues, vegetation
impact considerations, practices to limit liability, and increase education and outreach. A
complete how-to section for drafting and implementing a climbing management plan including a
review of issues is provided. A brief section on the economics of climbing debates the value of
climbing resources and points readers to several recent economic studies. The publication also
includes an annotated bibliography listing climbing-related literature as an appendix.
Several sources have provided figures of climbing participation on a national level. The
National Survey on Recreation and the Environment (NSRE) prepared by the United States
Forest Service in 1994 and 1995 reported approximately 7 million U.S. citizens participating in
rock climbing and approximately 9.5 million participating in mountain climbing. The original
NSRE was completed in 1982; however, no rock climbing data were obtained, making growth
conclusions unavailable. A national telephone survey conducted in 1998 by the Survey Research
Center of the Institute for Public Policy (IPP) at the University of New Mexico asked
respondents whether they had ever participated in technical rock climbing or bouldering
(Grijalva, 2000). Affirmative responses were received from 9.7% of those interviewed. Based
on the U.S. population in 1998 (270 million), approximately 25 million persons in the United
States have participated at least once in technical rock climbing. Clarification on the two figures
is as follows: “the NSRE predict[ed] annual U.S. climbing potential to be 7 million individuals,

ECONOMIC IMPACT, IMPLAN, ROCK CLIMBING, RED RIVER GORGE
Hobbs, Abridged Thesis, 2002
15
while the IPP results indicat[ed] that the potential U.S. climbing participation could be as high as
25 million” (Grijalva, 2000, p. 45). Additionally, the Economist reported an estimated 100,000
Americans try rock climbing every year (1995). This figure represents those individuals who
attempt the sport for the first time.
Economic impact
Although Americans have been rock climbing for centuries, only recently has the United
States government officially recognized climbing as a valid recreational activity. The National
Park Service did not address the need for regulations and climbing management guidelines in
national parks until 1993 (58 FR 1993, 32878-80). Other government agencies have since
implemented a variety of measures in response to increased climbing activity with mixed results.
In 1998, the U.S. Forest Service submitted a proposal to restrict climbing in wilderness areas
(USFS, 1998). The plan was based on the Forest Service’s interpretation of the legislative intent
of the Wilderness Act of 1964 and proposed prohibiting the use or placement of fixed anchors in
federally designated wilderness areas. However, these anchors are essential for safely ascending
or descending climbing routes and the elimination of fixed anchors would in effect eliminate a
majority of the rock climbing resources. In 2000, Grijalva published the results of an
investigation into the “economic losses to climbers due to changes in institutional rules for rock
climbing access on federal and state public lands” (Grijalva, 2000, p. viii). Original motivation
for her research came from federal mandates (Executive Orders 12866 and 12291) requiring
benefit-cost analyses prior to any major federal regulations; major being defined as any
regulation with an economic effect of $100 million or more (Grijalva, 2000). The researcher
hypothesized that the elimination of climbing in designated wilderness areas would result in a
loss greater than $100 million to rock climbers, establishing climbers as a group with standing.

ECONOMIC IMPACT, IMPLAN, ROCK CLIMBING, RED RIVER GORGE
Hobbs, Abridged Thesis, 2002
16
Accordingly, the USFS would be unable to make any unilateral decisions on climbing resources
without first conducting appropriate analyses of the effects, i.e., the proposed ban on fixed
anchors would be subject to economic impact review and likely rejected.
Grijalva’s research method utilized a repeated-discrete choice random utility model to
collect the survey data on the trip-taking behavior of 597 climbers dispersed throughout the
United States (Grijalva, 2000). The investigation produced data from approximately 13,000 trips
to 60 separate climbing areas in the U.S. The application of count data regression models
resulted in a seasonal economic loss from $477 to over $1,000 per climber. When the low-end
figure ($477) is applied to the total number of U.S. climbing participants (7 million persons in
1994), the total economic loss from climbing restrictions is a staggering $3.3 billion dollars
(Grijalva, 2000).
Another group of researchers in Nevada investigated the economic value of climbing
resources at Red Rock Canyon National Conservation Area with specific attention given to the
ban on the placement of new permanent anchors (Vossler, et al, 1997). The study compared the
benefits of the ban with the potential economic losses to climbers and the Las Vegas economy
(Vossler, et al, 1997). The results of the study were unavailable for review at the time of this
investigation.
Ekstrand completed similar work in 1994 but on a more limited basis. His investigation
examined the economic value of climbing resources in Eldorado Canyon State Park, Colorado.
The study was designed to measure the economic value of climbing resources and determine the
effect of climber congestion, setting, and remoteness of location on this value. The questionnaire
was designed so the results could be applied to either the travel cost model (TCM) or the
contingent valuation model (CVM) (Ekstrand, 1994). Participants were asked about travel

ECONOMIC IMPACT, IMPLAN, ROCK CLIMBING, RED RIVER GORGE
Hobbs, Abridged Thesis, 2002
17
distances and expenses, as well as other expenses incurred during the trip for the TCM.
Additional questions for the CVM revolved around the participant’s willingness to pay for the
climbing resource with a variety of conditions imposed, i.e., wait time, crowding, length and
difficulty of the hike to the crag. A value for a day of climbing was reported at $26.38 under the
CVM. Using a yearly total for climbers at the state park (30,545) the study concluded the
Eldorado Canyon State Park climbing resources could be valued at $805,777 per year. The
investigator made the assumption that if the daily value ($26.38) could be applied to the national
participation figures available at the time (3 million climbing participants), the value of all
climbing resources for 1991 would be $1.98 billion (Ekstrand, 1994).
Shaw and Jakus completed research in 1996 on the travel cost models for rock climbing
demand in the Shawangunks of the Catskill Mountains, New York. Data were collected by
survey from 220 climbers who indicated they visited the area primarily for climbing (Shaw and
Jakus, 1996). Information from other visited areas was also included. Various models were
applied to the data, including multiple site choice model, a trip frequency model for one site, and
a combined multiple site/total seasonal trips frequency model (Shaw and Jakus, 1996).
In parallel research, Ewert’s study of tourism in a portal community indicated that the
spending of mountain climbers traveling through and staying in the town of Talkeetna, Alaska
had a significant impact on the local economy. Talkeenta serves as the jump off point for
attempts on Denali (Mount McKinley). His survey compiled the results of 169 usable responses
from climbers on their total expenditures both inside and outside the state. The mean value of
$4,249.00 per person was applied to the 1,000 climbers per year average. The expenditure
impact in 1993 exceeded $4 million (Ewert, 1996).

ECONOMIC IMPACT, IMPLAN, ROCK CLIMBING, RED RIVER GORGE
Hobbs, Abridged Thesis, 2002
18
In 1998, several researchers from various fields combined to produce the draft of a
document for the USFS detailing the creation of expenditure profiles for recreational visitors to
Forest Service lands. The purpose of the research was to identify average expenditure profiles
that would then be used in Resource Planning Act (RPA) analyses. The study used data
collected at numerous Forest Service locations by several agencies over a period of many years.
The first data set was gleaned from the Public Area Recreation Visitor Survey (PARVIS) which
gathered expenditure information from 1985 to 1987 (Alward et al, 1998). The CUSTOMER
survey program collected data during a period stretching from 1988 to 1996. Both data sets
(totaling 5100 expenditure surveys) were used in the research although the methods of collection
had been different and did not present a completely whole visitor picture. Incidentally, the study
collected visitor data for the Daniel Boone National Forest in 1993.
Expenditures were divided into five general categories for analysis: Lodging, Food,
Transportation, Activities, and Other. These five were further subdivided into twelve sections
that more accurately described the various expenditures. With the understanding that addressing
every available activity on Forest Service land and the related expenditures would be futile, the
study organized activities into one of five aggregates: Developed site, Mechanized travel, Trail
use, Winter, and Other Activities (Alward et al, 1998). Data was collected on a per trip basis
making it necessary to define the length of stay for each participant.
The study formulated four separate expenditure profiles based on the inclusion/exclusion
of locals, adjustments for at home expenditures, travel costs, and others. The results of the study
indicated that non-local visitors spend more per trip than locals and trips by non-locals generally
last longer than the trips of locals. The average spending ranged (depending on the expenditure
profile applied) from $55.00 per person (Profile D) to over $118.00 per person (Profile C)

ECONOMIC IMPACT, IMPLAN, ROCK CLIMBING, RED RIVER GORGE
Hobbs, Abridged Thesis, 2002
19
(Alward et al, 1998). The research concluded that the application of a particular profile was
dependent of the nature of the resource, activities and local economy. Alward stated, “In short,
there is no one simple answer or formula” (p. 16, 1998).
Beyond rock climbing, John Crompton developed a compilation of proper procedures and
principles for pursuing valid economic impact studies of festivals and special events. He stated
that although the key purpose of conducting an economic impact study is to measure the
economic return to residents, the entire process is, at best, inexact (Crompton, 2001). Because
impact studies rely upon participants recalling and estimating expenses, labeling results as hard
data or fact is inaccurate. Accordingly, results and conclusions can be considered only
“guesstimates” (Crompton, 2001).
It is important to understand the role of economic impact studies in establishing the value
of activities, special events or recreational resources. The impact study can provide insight into
the actual profit or loss of a resource, be it a one-time or continuous occurrence. The results
offer an answer to the question of whether local taxes spent on the event or promotion of a
resource have any effect on the community or not. The real advantage to an impact study is its
ability to bring the economic returns directly to the level of the citizen. Many economists and
tourism promoters have pointed to the total expenditure in a community due to an event or
resource and proclaimed the result as an economic impact figure. “It is used because it generates
the highest economic impact number; but residents have no interest in sales generated, they are
primarily interested in how it personally impacts them in terms of personal income” (Crompton,
2002, p. 72). In fact, the magnitude of sales generated is a benign number and has little or no
relation to the individual citizen because the figure does not trace where the money goes after it
is spent. That process, known as the multiplier effect, allows for the “leakage” of money from a

ECONOMIC IMPACT, IMPLAN, ROCK CLIMBING, RED RIVER GORGE
Hobbs, Abridged Thesis, 2002
20
community; that is, money that was spent inside a community is turned around and used to pay
for goods and services that come from outside the community, which creates no gain for the
citizens. “Only those dollars remaining within a host community after leakage has taken place
constitute the net economic gain” (Crompton, 2002, p. 20). Useful economic impact research
must involve applying this concept to the totals and focus on the money that is turned around
inside a community’s economic engine.
Crompton identified three principles crucial to a proper study: (a) exclusion of local
residents, (b) exclusion of “time-switchers” and “casuals,” and (c) use of income rather than
sales output measures (Crompton, 2001). Local resident expenditures should not be considered
in impact results because they represent a recycling of money that was already there. Money
already in a community does not provide any additional economic stimulus and should not be
considered. “Time-switchers” were defined as individuals already planning to visit a
community, but changed the timing to coincide with a particular event. These individuals are
excluded from consideration because their spending would have occurred in the community
regardless of the occurrence of the focus event. “Casuals” were described as those individuals
who happened to be in the community at the time of the event but were attracted by other
features and elected to attend the event in lieu of doing something else (Crompton, 2001). These
must be discarded for similar reasons as the “time-switchers.” The event being studied held no
importance to the visitor when the destination was chosen; therefore, the spending cannot be
related to the event. If these three principles were ignored, Crompton argued that the data would
include invalid figures that have no relation to the actual economic benefits of the event.
It is interesting to note that there is some disagreement on validity of excluding locals
from consideration in studies involving recreational activities. The argument for use of local

ECONOMIC IMPACT, IMPLAN, ROCK CLIMBING, RED RIVER GORGE
Hobbs, Abridged Thesis, 2002
21
resident recreational spending when determining impact is based on the concept that the expense
is not a necessity and therefore could be included (Winter, USFS, personal communication,
2002).
The survey tool used in Crompton’s research was designed to be analyzed by the IMpact
analysis for PLANning (IMPLAN) software. Developed by the U.S. Forest Service in 1979,
IMPLAN accepts raw expenditure data and calculates eight different measures of economic
impact, although only four are commonly used: sales, personal income, value added, and
employment (Crompton, 2001). The sales measure reports on the direct and indirect effect of the
extra spending input from a visitor on the economics within a community. Personal income
represents the direct and indirect effect of the extra spending input from a visitor on the personal
income and welfare of the residents of the community. Value added refers to other income to the
community through taxes and fees imposed on the visitor. The employment measure provides a
figure for the number of new jobs created to handle the influx of visitor spending (Crompton,
2002).
Since the economy varies from one locale to another, the data must be subjected to
appropriate regional parameters. The structure and condition of the economy effects the degree
to which leakage occurs. For example, in a agriculturally based economy, money spent on farm
machinery is more likely to leave the community than money spent on locally processed cattle
feed because of the location of the manufacturer. IMPLAN uses databases providing
comprehensive local economic data based on zip code to accomplish this process (Minnesota
IMPLAN Group, 1997). These data were compiled over several decades by various public and
private sources and include information gleaned from 528 different industrial sectors (Crompton,
2001).
ECONOMIC IMPACT, IMPLAN, ROCK CLIMBING, RED RIVER GORGE
Hobbs, Abridged Thesis, 2002
22
Methodology
Research involving the economic impact of any subject must be carefully formulated and
follow sound methodology. As such, a solid foundation is crucial. This research was designed to
collect expenditure information from climbers on a per trip basis. The tool used in Crompton’s
studies provided a base model for the survey instrument and analysis procedures for this project.
Subjects
Two different methods were used to determine eligible participants for this study. A
subject was classified as eligible if he or she had climbed in the Red River Gorge area or was
intercepted in the Gorge area while climbing at the time of the interview. Non-climbers were not
surveyed.
During the survey period, trained volunteer interviewers were stationed at various
climbing locations in the Gorge area to intercept and survey any climbers found. Participants
were asked to complete the questionnaire immediately and return it to the interviewer.
Additional collection procedures are discussed in depth later in this chapter.
Responses were also obtained in various climbing gyms throughout the Midwest and
southeast United States. Volunteers gathered these responses - defined as off-site - in person.
Only those climbers that had climbed previously in the Red River Gorge were surveyed.
Survey forms were submitted and approved by the Human Subjects Review Board at
Western Kentucky University. An informed consent document was deemed necessary by the
HSRB and attached to the survey (see Appendix A).
Instruments
The survey instrument used in this investigation was based upon one originally designed
by Crompton for use with special events and festivals (Crompton, 2001). Slight modifications
ECONOMIC IMPACT, IMPLAN, ROCK CLIMBING, RED RIVER GORGE
Hobbs, Abridged Thesis, 2002
23
were made to the instrument to garner climber-specific responses. (see Appendix B) Major
efforts were made to keep the questionnaire short - in order to increase the likelihood of
cooperation from participants - and the questions clear and simple. Several questions were
added to obtain information very useful to land managers and landowners. The questions and
supportive rationale are as follows:
1. What is the zip code at your home address? _______________
This question clarified the status of the participant as either local or non-local. Referring
to Crompton’s principles stated earlier in Chapter 2, locals are excluded because the money spent
was already in the community and does not represent any new input into the economy.
Differentiating between these users is important in regards to calculating impact in the local and
state economy. Moreover, a comparison between in-state visitors and out-of-state visitors can be
very insightful for managers. This resulting data will be useful in future research for calculating
average travel distances and average associated costs for visitors.
2. Is rock climbing the reason you are visiting the Red River Gorge on this trip? Yes_____ No_____
The research procedure required that only climbers complete the survey. This question
simply verified if the respondent was actually participating in rock climbing. If a respondent
indicated “No” then he or she was advised they had completed the survey.
Alternative Question #2 for off-site distribution: (a) Have you been to the Red River Gorge
previously? Yes____ No____ (b) If yes, on your most recent trip, was the reason for your trip centered on rock
climbing? Yes____ No____
The selected phrasing was used in order to make the questionnaire clear for off-site
participants. Using past tense and referring to the “most recent trip” clarified the parameters for
the question. (see Appendix C)
3. On average, how many days per year do you spend climbing at Red River Gorge?

ECONOMIC IMPACT, IMPLAN, ROCK CLIMBING, RED RIVER GORGE
Hobbs, Abridged Thesis, 2002
24
4. How many months/years of climbing experience do you have? _____months _____years
Not imperative to an economic impact study, these questions were added at the request of
the Red River Gorge Climbers’ Coalition. The results were useful in establishing the
demographics of the climbers visiting the Red River Gorge.
5. How many days will you be at the Red River Gorge on this trip? _______
The design of the study focused on the per trip expenditures of each group. In order to
calculate per day data, this question was included. The data also provided for the comparison of
climbers’ spending habits based on the length of stay.
6. How many people (including yourself) are in your immediate group? (This is the number of people for
whom you typically pay the bills, e.g. your family or close friends) ___________ people
By collecting group information rather than individual, this question avoided any
confusion due to possible overlap in group expenses, i.e. one person pays for another, or is paid
for by another. Therefore, only one individual from each group completed the survey. The
responses also allowed for calculation of per visitor and per group expenditures.
7. Please indicate the ages of those in your immediate group: (How many persons in each category?)
0-10___ 11-20___ 21-30___ 31-40___ 41-50___ 51-60___ 61-70___ 71 & up___
It is vital to know age classifications of user groups in order to make positive and
effective management decisions for any activity. The information gleaned from this question
allowed the creation of a more complete user profile.
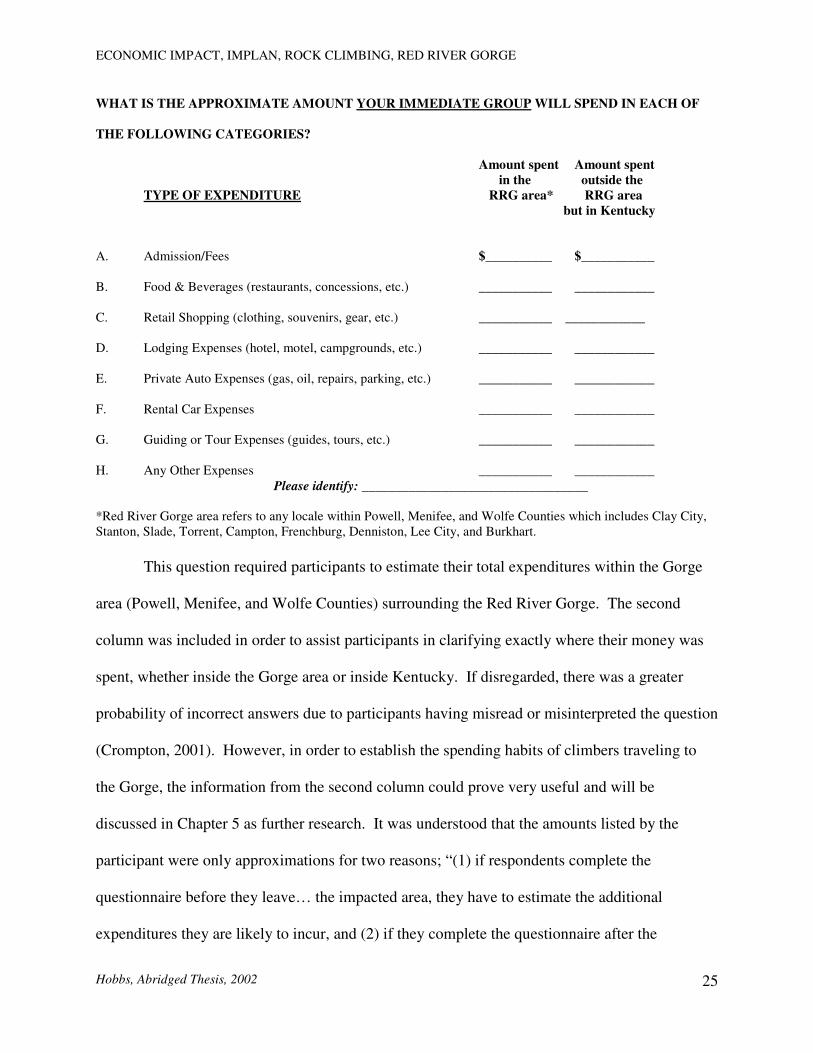
8. To better understand the economic impact of climbers at Red River Gorge, we are
interested in finding out the approximate amount of money you and other visitors in your immediate group will
spend, including travel to and from your home. We understand that this is a difficult question, but please do your
best because your responses are very important to our efforts. DURING THE COURSE OF YOUR VISIT,
ECONOMIC IMPACT, IMPLAN, ROCK CLIMBING, RED RIVER GORGE
Hobbs, Abridged Thesis, 2002
25
WHAT IS THE APPROXIMATE AMOUNT YOUR IMMEDIATE GROUP WILL SPEND IN EACH OF
THE FOLLOWING CATEGORIES?
Amount spent Amount spent in the outside the
TYPE OF EXPENDITURE RRG area* RRG area but in Kentucky
A. Admission/Fees $__________ $___________ B. Food & Beverages (restaurants, concessions, etc.) ___________ ____________ C. Retail Shopping (clothing, souvenirs, gear, etc.) ___________ ____________ D. Lodging Expenses (hotel, motel, campgrounds, etc.) ___________ ____________ E. Private Auto Expenses (gas, oil, repairs, parking, etc.) ___________ ____________ F. Rental Car Expenses ___________ ____________ G. Guiding or Tour Expenses (guides, tours, etc.) ___________ ____________ H. Any Other Expenses ___________ ____________
Please identify: __________________________________
*Red River Gorge area refers to any locale within Powell, Menifee, and Wolfe Counties which includes Clay City, Stanton, Slade, Torrent, Campton, Frenchburg, Denniston, Lee City, and Burkhart.
This question required participants to estimate their total expenditures within the Gorge
area (Powell, Menifee, and Wolfe Counties) surrounding the Red River Gorge. The second
column was included in order to assist participants in clarifying exactly where their money was
spent, whether inside the Gorge area or inside Kentucky. If disregarded, there was a greater
probability of incorrect answers due to participants having misread or misinterpreted the question
(Crompton, 2001). However, in order to establish the spending habits of climbers traveling to
the Gorge, the information from the second column could prove very useful and will be
discussed in Chapter 5 as further research. It was understood that the amounts listed by the
participant were only approximations for two reasons; “(1) if respondents complete the
questionnaire before they leave… the impacted area, they have to estimate the additional
expenditures they are likely to incur, and (2) if they complete the questionnaire after the

ECONOMIC IMPACT, IMPLAN, ROCK CLIMBING, RED RIVER GORGE
Hobbs, Abridged Thesis, 2002
26
[trip]…then their recall memory may be faulty” (Crompton, p. 39, 2001). As stated earlier,
economic impact studies can only be classified as estimates.
A map of the Gorge area with “inside” and “outside” clearly demarcated was
photocopied onto the reverse of the questionnaire to assist participants with understanding the
Gorge area. (see Appendix D)
In order to determine readability of the instrument, the tool was given to six climbers
with histories of climbing in the Red River Gorge. Minor wording changes were made after the
results were examined. The survey took approximately four to five minutes to complete.
Procedures
Data collection began on February 9, 2002 with a meeting of the investigator and
individuals volunteering to assist in the data collection. Detailed procedures for conducting the
survey were explained verbally, and each volunteer was provided with an interviewer’s packet
containing information on logistics. (see Appendix E) The volunteers were instructed to greet
potential participants according to the prepared statement of purpose and intent (see Appendix F)
and conduct the survey as stated.
Volunteers logged many hours distributing questionnaires at various climbing
destinations within the Red River Gorge. Upon first contact, participants were asked verbally if
they had completed the survey elsewhere. It is important to note the procedures followed if an
individual replied they had in fact completed the survey at another time prior to the current
encounter. If the participant indicated he or she had responded earlier, the interviewer was
instructed to determine if the previous survey was completed on the current trip. If yes, then no
additional survey was conducted. If the participant had completed the survey on a previous,
separate trip, then a new survey was administered. Because the research is concerned with the

ECONOMIC IMPACT, IMPLAN, ROCK CLIMBING, RED RIVER GORGE
Hobbs, Abridged Thesis, 2002
27
per trip expenditure, and many climbers visit the Gorge more than once, multiple responses by
the same individual for separate trips were anticipated. If no surveys were completed on the
current trip, then participants were asked to complete the questionnaire in its entirety
immediately and return it to the interviewer. A second interview simply meant excluding
questions 3 and 4. These questions were dismissed on the secondary survey because the
information requested was not trip-specific and using the data would result in improper inflation
of the demographic information. Surveys were collected during February 2002 and March 2002.
Climbers completed 121 surveys on site with 117 usable responses.
A secondary method of data collection utilized the travels of volunteers to various
climbing gym locations throughout the Midwest and southeast United States in January 2002.
Climbers were intercepted at these gyms in much the same way as if they were in the Gorge area.
Upon first contact, respondents were asked verbally if they had completed the survey elsewhere.
The same statement of intent and purpose as used in the Gorge distribution was read to the
participants at the climbing gyms. Participants were then asked to complete the questionnaire
immediately and return it to the interviewer. Upon completion, surveys were placed in an
envelope and mailed in bulk to the investigator. Twenty climbers responded to surveys in gyms,
with 18 usable responses.
Mail-response collection was not used due to the absence of an address database for rock
climbers.
Analysis
At the end of the data collection period, the author was advised that the software chosen
for analysis, currently licensed to the U.S. Forest Service by the Minnesota IMPLAN Group,
required an established agreement prior to any data collection or even survey development.
ECONOMIC IMPACT, IMPLAN, ROCK CLIMBING, RED RIVER GORGE
Hobbs, Abridged Thesis, 2002
28
Tentative permission to use IMPLAN through the cooperative agreement between the Forest
Service and the Red River Gorge Climbers’ Coalition had been previously obtained from the
local Forest Service supervisor. In actual fact, the USFS was prohibited from providing direct
access to the IMPLAN program due to the nature and language of the software license contract.
An alternative plan of analysis was used instead. With the help of the Forest Service, the data
were applied to the IMPLAN model by a trained Forest Service employee and four measures
(Employment, Employee Compensation, Labor Income, and Total Value Added) were produced
based on the three-county area (Powell, Wolfe, and Menifee) surrounding the Red River Gorge.
The results are discussed at length in the following chapter. That the researcher was not allowed
free reign and access with the IMPLAN program was the only complication to the original study
design.
Apart from IMPLAN, many basic miscalculations were possible with the gathered data
without proper constraints. Starting with a sum total expenditure of $20,000.00, the average paid
out per trip (100 total trips) could be as high as $200.00. Simply considering the total sum of
reported trip days (250), the average spending per day could be $80.00. However, the problem
with both figures is the lack of consideration for individual spending habits, group size, and
length of stay rendering each calculation unproductive and useless for anyone.
Two formulas were used for data analysis. To calculate the total reported expenditure per
climber per day, the author began with the reported expenditures inside or outside the Red River
Gorge on each response. The sum of the expenditures was divided by the number of persons
reported in that survey. The result was then divided by the corresponding length of stay. That is,
for each survey the following equation was applied:

ECONOMIC IMPACT, IMPLAN, ROCK CLIMBING, RED RIVER GORGE
Hobbs, Abridged Thesis, 2002
29
Eio = (Rio / p) / L (1)
where:
E = Expenditure per climber per day R = Reported expenditures recorded in survey p = Number of persons in surveyed immediate group L = Length of trip reported in survey i = Inside the Gorge area o = Outside the Gorge area but in Kentucky
By substituting outside expenditures (Ro) for inside, this formula was applied to expenses
outside the Gorge area with the same result (Eo). Adding both together and applying the formula
resulted in Eio or the expenditure per climber per day for entire trip. This method considered the
individual differences between surveys, which was then reflected in expanded calculations on the
dataset as a whole.
Thus, in order to compute the average daily outgo, the results of Equation 1 for each
survey were added together and then divided by the total number of valid surveys. Data set
averages for expenditures inside and outside the Gorge area were included.
Moving to the yearly input of climbers into the Red River Gorge community required
more flexibility and a reminder of the nature of economic studies and the reliance on the
estimations of survey participants. The method is best expressed below:
Yio = Eio (Dy) (2)
where:
Y = Expenditure per climber per year inside/outside the Red River Gorge area Eio = Expenditure per climber per day inside/outside the Gorge area Dy = Estimated days spent in the Gorge per year by responding climber
ECONOMIC IMPACT, IMPLAN, ROCK CLIMBING, RED RIVER GORGE
Hobbs, Abridged Thesis, 2002
30
Applying the average process to the dataset, the investigator was able to obtain an
average annual expenditure per climber inside the Gorge area, outside the area in Kentucky, and
total expenditure in Kentucky.
Other calculations
Average group size, length of trip, and time spent in the area per year were also figured.
A brief comparison of the expenditure and trip data for Kentucky residents and out-of-state
visitors is also noted. These findings are presented in depth in the following chapter. Although
this research was directed toward the economic impact, the data gathered provided an abundance
of additional usable information ranging from experience levels, travel distances, and ages of
participants. Possible areas for further exploration with the collected data are discussed later.
Results and Analysis
The project was designed to gather specific demographic, economic, and trip data from
rock climbers at the Red River Gorge, Kentucky. Participants were intercepted by trained
volunteers at various locations in the Gorge area and at climbing gyms in Kentucky and invited
to complete a short survey. The volunteers collected 141 surveys over a fifty-one-day period in
February and March 2002.
Data analysis
Of the 141 collected responses, 135 were deemed acceptable and used in the data analysis
outlined below. Six responses were set aside for one or more of the following reasons:
participant provided a home zip code that was inside the demarcated Gorge area (1), one or more
essential questions were left blank or incomplete (4), or the survey was improperly filled out (1).
This last survey was word-processed and the investigator assumed it was not received or

ECONOMIC IMPACT, IMPLAN, ROCK CLIMBING, RED RIVER GORGE
Hobbs, Abridged Thesis, 2002
31
completed in person. Some surveys left Question 3 blank (estimated days climbing at the Red
River Gorge per year). In this case, the reported length of the current/most recent trip was used.
Because of the nature of the survey, the researcher was primarily concerned with inflated
or deflated responses from participants due to memory, unknown bias for or against, and
inability to accurately forecast future expenditures. It is crucial to understand this limitation
when considering the results. The information obtained in this study relied on the estimates of
the participants for several key questions. However, this method is the most reliable and the
most feasible for gathering the necessary data. As with all economic impact studies, the figures
obtained can be considered “guesstimates” at best (Crompton, 2002).
Non-economic results
Twenty-four states, Washington D.C., and Canada were represented in the survey. Only
33 of 134 usable responses for this question came from Kentucky residents. This number was
the most from any state surveyed. Ohio, Indiana, Illinois, and Michigan rounded out the top five
states. Canadian climbers were recognized with a 6.7% share of the total responses. The
remaining 19 states, including Massachusetts, California, and the District of Columbia, provided
12.5% of the responses. Note that non-Kentucky responses were by far the majority at 67% (102
responses). (See Table 4.1 for more information)
All 135 responses provided the length of the current or most recent trip to the Gorge in
days. While the surveys represented a total of 400.5 days of climbing, the trip length per
surveyed climber averaged 2.97 days. Visits varied from one day in length (numerous
responses) to twelve days (one group from Georgia). Kentucky residents spent an average of 1.3
days per trip in the Gorge area, while out-of-state climbers averaged 3.5 days. Canadian visits
ranged from three to seven days with a mean of 5.4 per trip.

ECONOMIC IMPACT, IMPLAN, ROCK CLIMBING, RED RIVER GORGE
Hobbs, Abridged Thesis, 2002
32
Participants were requested to estimate the number of days he or she spends climbing in
the Gorge area each year. Results varied from one day for first-time visitors to climbing guides
that visit the area nearly two-thirds of the year. The climbers surveyed estimated a total for
climbing days per year of 3,552 with the average time at 26.3 days. Surprisingly, out-of-state
visitors spent more time in the area - 17.9 days on average with a total of 1826. Kentucky
residents averaged over twice that figure at 55.7 days. The total climbing days for Kentuckians
was 1726. However, it is interesting to note that when the eight Kentucky responses indicating
100 days or more per year were removed, the total was 676 climbing days and the average
dropped to 29.4 days per year.
The 135 surveys collected represented a total of 457 climbers, and the size of each
immediate group ranged from one person (seven responses) to eleven persons (one response).
Of note here, six of the seven one-person surveys were from out-of-state climbers. The average
for the immediate group was 3.4 persons. In-state climbers had smaller groups in general with
an average of 2.8 persons per group while out-of-state groups averaged 3.5 persons. Kentucky
residents totaled only 20% (93 persons) of surveyed climbers while nonresidents totaled 364
(80%).
Several questions that were not crucial to the impact analysis were included in the survey.
Participants were asked to quantify in months and years the amount of rock climbing experience
he or she has had. Responses varied from four months to 34 years. The average length of
experience for the entire survey group was 5.93 years.
Lastly, participants were asked to identify the appropriate age group for each member of their
immediate party. The groups were defined by decades from 0 to 10 years, 11 to 20, 21 to

ECONOMIC IMPACT, IMPLAN, ROCK CLIMBING, RED RIVER GORGE
Hobbs, Abridged Thesis, 2002
33
Table 4.1
State/country of origin per reported zip code
State Response total Percentage KY 33 24.6%
OH 17 12.7
IN 13 9.7
IL 12 8.9
CA, NC, NY, CO, IA, MO 12* 8.9
MI 11 8.2
MA, WA, PA, AL, TX, VA, WV, WI, MS, DC 10** 7.5
Canada 9 6.7
GA 7 5.2
VT, MA 6 4.4
TN 4 2.9
Note: n = 134. * 2 responses received from each state. ** 1 response received from each state.
30, and so on. At least six responses left this question blank or incomplete. Twenty-one to
thirty-year olds created the largest age group (263 persons). Seventy-four climbers were in the
eleven to twenty year age bracket and fifty-seven were included in the 31-40 year group. Thirty
individuals were represented in the 41-50 age group. Responses indicated eight persons under
age eleven. Two persons over 51 were identified. No surveys reported climbers ages sixty-one
or higher.
Expenditure results
Participants were asked to estimate their expenditures on the current/most recent trip to
the Gorge area and define the expense in one of eight categories: Admissions/Fees, Food &
Beverages, Retail Shopping, Lodging expenses, Private Auto expenses, Rental Car expenses,
Guiding or Tour expenses, and Other expenses. These categories were chosen based on

ECONOMIC IMPACT, IMPLAN, ROCK CLIMBING, RED RIVER GORGE
Hobbs, Abridged Thesis, 2002
34
Crompton’s previous impact research. Participants were also asked to differentiate between
expenses occurring inside the Red River Gorge area and those occurring outside the Gorge area
but in Kentucky. Refer to Table 4.2 for additional information on each category.
Expenses inside the Red River Gorge area exceeded those outside by nearly a 65%
margin. Participants reported spending a total of $34,708.45 in the commonwealth of Kentucky
during the survey period. An important distinction should be made as regards the spending
habits of Kentucky climbers versus those from out-of-state.
Surveyed Kentuckians spent only $3,286.00 in their travels to and from the Gorge for
climbing. The remainder ($31,422.45) was brought into the commonwealth by non-residents.
Category A, Admissions/Fees, included any entry ticket charges, permits, or other related
expenses. The U.S. Forest Service implemented an overnight parking fee system over the last
year for the Red River Gorge Geological Area only. Those permits are available at local gas
stations and groceries.
Food & Beverages (Category B) constituted the largest area of expense for climbers
visiting the Gorge area. Several gas stations, restaurants, and markets in Slade and Stanton see
Table 4.2 Expenditure results by category
Category Inside the Gorge area Outside the area* Total Admission/fees $192.00 $153.00 $345.00 Food & beverages 10,761.00 2,960.00 13,721.00 Retail shopping 1,598.00 1,769.95 3,367.95 Lodging expenses 10,390.50 455.00 10,845.50 Private auto expenses 2,159.00 2,117.00 4,276.00 Rental car expenses 375.00 120.00 495.00 Guiding/tour expenses - 70.00 70.00 Other expenses - - - Total $25,563.50 $7,644.95 $34,708.45
Note: Dashes indicate no expenses reported in this category. * Indicates expenses occurring outside the delineated Gorge area but within Kentucky.

ECONOMIC IMPACT, IMPLAN, ROCK CLIMBING, RED RIVER GORGE
Hobbs, Abridged Thesis, 2002
35
much of the business in this regard. Reported expenditures on food and beverages inside and
outside the area totaled $13,721.00.
Retail Shopping expenses outside the Gorge area more than doubled those inside the area.
The amount difference is likely due to the limited retail outlets within the delineated Gorge area.
Lodging expenses were close to the top in total expenses at $10,845.50. However,
expenses inside the area were almost 23 times greater than those outside the area. This
difference may be explained in part to the lack of lodging outside the area and yet still in close
proximity to climbing resources. The Gorge area itself abounds with campgrounds, motels,
lodges, cabin rentals, and bed and breakfast inns.
Private Auto expenses accounted for the gas, oil, and possible repairs encountered by
visitors during travel to and from the Red River Gorge.
Under the Rental Car expense category, participants reported $495.00 in total expenses.
Expenses inside the area more than doubled those reported outside the area.
Guiding and Tour expenses was the most vague and open category for participants.
Besides the obvious fees for guides and tours, this category accepts expenditures for
entertainment such as movies or climbing gym entry charges. Several participants recorded
these expenses under the Other Expenses heading. According to Susan Winter of the USFS, the
IMPLAN analysis recognizes considers movie and gym admissions as Guiding or Tour
expenses. For this study, Guiding and Tour expenditures totaled $70.00 occurring completely
outside the area. No usable Other Expenses were reported.
Data extrapolations
Without proper restraint, many basic miscalculations were possible with the gathered
data. Starting with the known sum total expenditure of $34,708.45, the average paid out per trip

ECONOMIC IMPACT, IMPLAN, ROCK CLIMBING, RED RIVER GORGE
Hobbs, Abridged Thesis, 2002
36
(135 total trips) could be as high as $257.10. Simply considering the total sum of reported trip
days (400.5), the average spending per day could be $86.66. However, the problem with both
figures is the lack of consideration for individual spending habits, group size, and length of stay.
Application of the equations discussed in Chapter 3 allowed the researcher to develop
more useful numbers. The average of the results of Equation 1 (expenditure per climber per day)
using expenditures from inside the delineated area for the entire dataset was $19.95. Expansion
to annual expenditures per climber (Equation 2) at the Red River Gorge indicated a mean of
$450.21 per climber inside the delineated area, $215.88 per climber per year outside the area but
in Kentucky, and $666.09 total in Kentucky per climber per year. (see Table 4.3 for complete
results)
Impact analysis
The researcher worked in conjunction with a Forest Service employee licensed and
trained to use the IMPLAN program. The data set was provided to the analyst and four impact
measures were produced: Employment, Employee Compensation, Labor Income, and Total
Value Added.
Based on economic data collected in the survey, IMPLAN determined a weight for each
category of expenditure both inside the Gorge area and outside the area. This
weight was then applied to the annual climber expenditure and IMPLAN was able to construct a
total response coefficient for each economic measure. The key to this model is a valid annual
expenditure, which is directly dependent on a valid annual visitor total. No valid research has
been conducted to date that provides a solid annual climber
visitation figure for the area in question. The USFS has reported an estimate of 5,000 climbers
per year in the Gorge from 1995 (J. Hersel, USFS, personal communication, March 28, 2002).
ECONOMIC IMPACT, IMPLAN, ROCK CLIMBING, RED RIVER GORGE
Hobbs, Abridged Thesis, 2002
37
An RRGCC representative, Shannon Stuart-Smith, felt this figure was very conservative and did
not reflect the current level of visitation in the Gorge area. However, using the data collected in
this study, the researcher was able to construct several figures that provide a framework for
annual visitation. The results of these combinations are presented in Table 4.4. Participants
were asked to estimate the number of days spent in the Gorge area per year (3,552 days). If
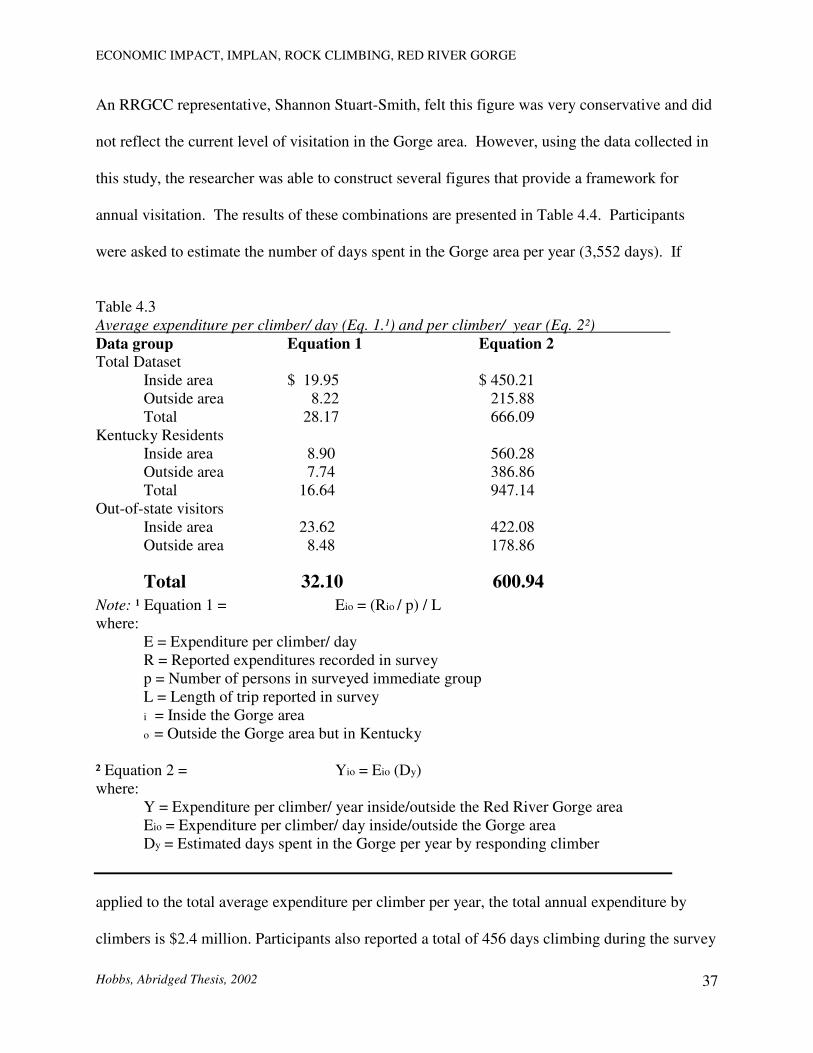
Table 4.3 Average expenditure per climber/ day (Eq. 1.¹) and per climber/ year (Eq. 2²)
Data group Equation 1 Equation 2 Total Dataset Inside area $ 19.95 $ 450.21 Outside area 8.22 215.88 Total 28.17 666.09 Kentucky Residents Inside area 8.90 560.28 Outside area 7.74 386.86 Total 16.64 947.14 Out-of-state visitors Inside area 23.62 422.08 Outside area 8.48 178.86
Total 32.10 600.94
Note: ¹ Equation 1 = Eio = (Rio / p) / L where: E = Expenditure per climber/ day R = Reported expenditures recorded in survey p = Number of persons in surveyed immediate group L = Length of trip reported in survey i = Inside the Gorge area o = Outside the Gorge area but in Kentucky ² Equation 2 = Yio = Eio (Dy) where: Y = Expenditure per climber/ year inside/outside the Red River Gorge area Eio = Expenditure per climber/ day inside/outside the Gorge area Dy = Estimated days spent in the Gorge per year by responding climber
applied to the total average expenditure per climber per year, the total annual expenditure by
climbers is $2.4 million. Participants also reported a total of 456 days climbing during the survey
ECONOMIC IMPACT, IMPLAN, ROCK CLIMBING, RED RIVER GORGE
Hobbs, Abridged Thesis, 2002
38
period. When extended to visits per year, the total is 3,257, creating an annual expenditure of
$2.1 million. When the USFS estimate of 5,000 climbers per year is used to calculate annual
expenditure, the result is $3.3 million. Thus, using available visitor data, the annual expenditure
by climbers in the Gorge could range from over $2 million to more than $3 million. In lieu of a
reliable annual figure and in order to maintain the integrity of the analysis results, the impact
analysis with IMPLAN was calculated using just $1 million dollars of annual climber
expenditure, which is well below the estimates of yearly expenditures outlined above.
The Employment Impact measure provides the total of jobs stimulated by the spending in
the area for a year’s time. All types of jobs are included in this model (full-time, part-time,
temporary, and seasonal) with no distinction between them. Based on the weights assigned by
IMPLAN and $1 million in climber spending, the total Employment Impact inside the Gorge
area was 13.9 jobs per year. The economic impact outside the area decreased slightly to 13.7
jobs per year.
Labor Income refers to the level of impact to employee compensation (salaries and
benefits) and proprietor’s income. The reported expenditures inside the Gorge created a total
impact of $185,455. Spending outside the Gorge was greater than inside, and the calculated
economic effect reflected that discrepancy, totaling $309,222 per year.
The third measure constructed by IMPLAN was Employee Compensation Impact. This
impact calculated the effect climber spending had on the level of salaries and benefits of
employees in the delineated area. Using $1 million in annual climber expenditure, this impact
totaled $153,133 per year inside the Red River Gorge area. Outside spending grossed $277,281
per year.

ECONOMIC IMPACT, IMPLAN, ROCK CLIMBING, RED RIVER GORGE
Hobbs, Abridged Thesis, 2002
39
The overall economic effects of climbing in the Red River Gorge area were determined
under the fourth measure used: Total Value Added (TVA). Similar to the Gross National
Product, the TVA indicates the total impact from the annual expenditures in the subject area.
The reported expenditures inside the Red River Gorge area created $307,318 in economic
stimulus within the area. Expenditures from outside the three-county area but in Kentucky
resulted in an impact of $520,271.
Discussion of results
The research produced a number of interesting data for consideration. The quantity of
out-of-state climbers (80%) versus Kentucky residents (20%) was surprising. The resulting
difference in the level of spending ($29,556.45) was then expected. Combined in-state and out-
of-state responses left a total of $25, 563.50 within the area, compared with $7,644.95 outside
the area but in Kentucky. Inside expenditure more than tripled that outside the area.
Table 4.4 Annual expenditure by Red River Gorge climbers in Kentucky
Climbing Days per year Annual Expenditure¹ (in millions) 3,552* Inside area 1.60 Outside area .77 Total 2.37 3,257** Inside area 1.47 Outside area .70 Total 2.17 5,000² Inside area 2.25 Outside area 1.08 Total 3.33
Note: ¹ Annual expenditure is listed in millions of dollars. * This figure was calculated using the total number of days spent climbing in the Gorge area per year. ** Calculated by extending the reported trip length (456 days over 51 days or 14% of a 365-day year) on each survey to a full year. ² Obtained from the USFS as an unofficial estimate of climbing visitors per year to the Gorge area.
ECONOMIC IMPACT, IMPLAN, ROCK CLIMBING, RED RIVER GORGE
Hobbs, Abridged Thesis, 2002
40
More importantly, however, the economic effect of the $7,644.95 spent outside was far
greater – by almost a quarter million dollars – than that of the inside expenditures when
calculated by IMPLAN. The nature and type of economic infrastructure within a community can
be quite effective in preventing the leakage of dollars from that community. The economic
engine within the delineated Gorge area is obviously not as large and diverse as that of the entire
commonwealth. Many goods and services found inside the Gorge either rely on outside
resources or suppliers, creating a pipeline for dollars leaving the community. Although leakage
exists at the state level, it is certainly not as significant as it is with a rural community such as the
Red River Gorge.
It is interesting to note that the average expenditure per climber per year result ($666.09 –
calculated by the average of all individual survey results from Equation 2) was consistent with
Grijalva’s economic expenditure research. Her report indicated average annual expenditures per
climber ranged from $477 to $1,000 for the entire year (Grijalva, 2000). Climbers surveyed at
the Red River Gorge for this study appeared to be very typical in terms of spending habits.
Summary of study
As the number of climbing participants increase in the United States, land managers
overseeing climbing resources will be forced to deal with the increased impacts from the sport,
socially, environmentally, and economically. Learning how to respond to the challenges of
climbing management involves understanding the effects of the sport on the surrounding
communities and resources. This study was directed toward providing information on the
economic impact of rock climbing at the Red River Gorge, Kentucky, on the towns and counties
neighboring the Gorge.

ECONOMIC IMPACT, IMPLAN, ROCK CLIMBING, RED RIVER GORGE
Hobbs, Abridged Thesis, 2002
41
Based on previous research on economic effects, an in-person questionnaire was
developed and distributed in person to climbers at the Red River Gorge and local climbing gyms
(Crompton, 2001). The researcher requested information from the participant regarding the
current/most recent trip to the Gorge area. Beginning with home zip code, the questions covered
the size of the participant’s immediate group and length of current/most recent trip. Most
importantly, participants recorded per group expenditures in eight expense categories and
differentiated between those paid inside the Gorge area and those outside the area but in
Kentucky. Questions such as level of experience, ages of group members, and time spent at the
Gorge per year, were asked but were not crucial to the impact study.
Of the 141 responses collected, 135 were deemed usable and subjected to further
scrutiny. Although Kentucky held the largest total for one state (33 responses), out-of-state
climbers completed 80% of the surveys. Visitors were from a variety of locations including
Canada, California, Massachusetts, and Washington. Climbers reported making more than five
trips per year averaging 17.9 days in the Gorge area with an average trip length of 3.5 days.
Expenditure data inside the Gorge were significantly higher than those outside. Climbers
indicated spending $25,563.50 ($19.95 per climber per day) inside the Gorge during the survey
period and only $7,644.95 ($8.22 per climber per day) outside the Gorge but in Kentucky.
Applying two equations to the data allowed the researcher to calculate an average per climber
per year expenditure of $666.09.
IMPLAN analysis conducted by the Forest Service using the data collected in this study
reported a total economic effect in the state of Kentucky of $827,589.00 based on $1 million
annual climber expenditure. This figure refers to the Gross Commonwealth Product of Kentucky
and is similar to the Gross National Product (GNP). The impact inside the Red River Gorge area

ECONOMIC IMPACT, IMPLAN, ROCK CLIMBING, RED RIVER GORGE
Hobbs, Abridged Thesis, 2002
42
was $307,318.00. Outside the Gorge area but in Kentucky, climbing expenditures had an effect
of $520,271.00.
These figures are better understood in the context of the separate measures constructed by
IMPLAN; that is, for every $1 million dollars that rock climbers spend inside the Red River
Gorge area per year, 13.9 jobs are created. For every $1 million dollars spent outside the area,
13.7 jobs are created. Similarly, for every $1 million spent inside the Gorge area, $185,455.00 is
recycled to local employees and business owners as Labor Income and $309,222.00 is returned
for every $1 million spent outside the area but in Kentucky. The difference inside and outside
the Gorge area is due largely to the level of leakage that occurs in a rural economy such as that
surrounding the Gorge area. Much of the money that is spent inside the Red River Gorge area
leaves the community as the business owners must purchase replacement goods and services
from outside the area. On a personal level, the Employee Compensation measure results were
$153,133 in personal income for each $1 million spent inside the area, $277,281 in personal
income outside the area. Viewing the results in this manner allows for a clearer picture of the
actual impact of rock climbers on the communities surrounding the Red River Gorge area.
Conclusions
It is important to note that the impact analysis was conducted assuming an annual climber
expenditure of $1 million in Kentucky. This estimate was a conservative one but was used
because of the lack of reliable research to verify any larger amount. The annual expenditure
calculation is dependent on valid visitors per year data, which did not exist at the time of this
project. Obviously, having such data in hand would greatly increase the accuracy of the impact
numbers generated by this study. Using the visitor data detailed in Table 4.4, the total economic
impact inside the Gorge area could be as high as $1.02 million per year. However, the impact

ECONOMIC IMPACT, IMPLAN, ROCK CLIMBING, RED RIVER GORGE
Hobbs, Abridged Thesis, 2002
43
results are valid and report a definite economic impact from the sport of rock climbing in the
economies of Powell, Wolfe, and Menifee counties. The significance of that impact could be
easily seen in a comparison of rock climbing results with other recreational activities occurring
in the Red River Gorge such as hiking, canoeing, and fishing. Without other similar studies to
provide perspective, the results must stand alone.
Implications
Perhaps most relevant to local resource managers and business owners is the annual
expenditure per climber per year in the state of Kentucky ($666.09). As yet, this financial
resource is untapped and comes from little if any commercial promotion of the climbing areas in
the state. Thousands of climbers visit the state each year just for climbing despite of the lack of
publicity and tourism promotion of the area, and most spend a considerable amount of money.
The natural conclusion and implication of this research involves re-evaluating the marketing
strategies currently in place in order to increase the climbing traffic at areas around the state.
There are multiple ways for local businesses to claim a portion of the money spent by climbers
each year. Most strategies involve advertising more effectively and creating awareness among
climbers about locations where they may want to spend their money. The opportunities for
climbing promotion are abundant. Several communities in other areas have created climbing
festivals and events in conjunction with climbing advocacy groups, bringing thousands of
climbers into an area for a week or weekend. The Ouray Ice Climbing Festival in Ouray,
Colorado, the Phoenix Bouldering Competition in Arizona, and others have proven to be
manageable and positive experiences for both the visiting climbers and the host communities.
The advantages to such an event include greater publicity for the climbing resource and
subsequent increased annual traffic. Both of these result in an increase in economic benefits.

ECONOMIC IMPACT, IMPLAN, ROCK CLIMBING, RED RIVER GORGE
Hobbs, Abridged Thesis, 2002
44
It is interesting to note that the Kentucky State Parks Department has banned rock
climbing and rappelling from any park lands. Several parks contain incredible resources for
climbing. Natural Bridge State Resort Park, Cumberland Falls State Resort Park, Lake Malone
State Resort Park, and Pennyrile Forest State Resort Park are some of the parks with climbing
resources. Based upon the data collected in this research, this ban could be shutting the door on
a significant financial resource for the local communities surrounding these parks as well as
ostracizing a significant recreational user group. The philosophy towards climbing management
in the state of Kentucky should be discussed and must evolve in order to meet the needs of the
Kentucky community and increase recreational opportunities for citizens.
Recommendations for further research
The opportunities for additional studies in this area are many. The first obvious need is
to gather valid recreational visitors per year data for each activity group at the Red River Gorge.
The results of this study could be taken further, i.e., developing the actual impact of climbing in
all sectors, if a number of climbing visits per year could be established. The entire project could
be conducted on a statewide level, intercepting climbers at climbing areas across the state. The
resulting information could provide a complete picture of the impact rock climbing has on the
entire state economy, rather than just the impact in the Red River Gorge area.
The entire study should be repeated, collecting data over a year in varying time periods
such as two months in each season. This method would provide a larger sample size and a more
accurate picture of climber expenditures. In consideration of IMPLAN, a few adjustments
should be made to the survey instrument, aligning the expense categories with the software
database prior to data collection. This step would remove any questions and problems with
bridging the data into appropriate category for analysis. With additional analysis, the data

ECONOMIC IMPACT, IMPLAN, ROCK CLIMBING, RED RIVER GORGE
Hobbs, Abridged Thesis, 2002
45
collected could provide a more complete user profile of climbers in regard to age, experience,
and actual travel distances. These data may also be applicable to additional methods of
determining impact or value.

ECONOMIC IMPACT, IMPLAN, ROCK CLIMBING, RED RIVER GORGE
Hobbs, Abridged Thesis, 2002
46
References: Access Fund (2001). Climbing management: A guide to climbing issues and the production of a
climbing management plan. Boulder, CO: Sharp End Publishing.
Alward, G. A., Arnold, J. R., English, D. B. K., & McCollum, D. W. (1998). Developing
expenditure profiles for Forest Service recreation visitors. Unpublished manuscript.
Wolfe County Industry. (n.d.). Retrieved April 9, 2002, from
http://www.archland.com/wolfe/industry.htm
Bronaugh, J. H. (1998). Red River Gorge Climbs (2nd ed.). Lexington, KY: Geezer Press.
Climbing up the wall. (1995, March). Economist, 334, 88.
Crompton, J. L. (n.d.). Measuring economic impact. Retrieved December 17, 2001, from Texas
A&M, Department of Recreation, Parks, and Tourism web site:
http://rptsweb.tamu.edu/Faculty/PUBS/Economic%20Impact.PDF
Crompton, J. L., Lee, S., Shuster, T. J. (2001). A guide for undertaking economic impact studies:
the Springfest example. Journal of Travel Research, 40, 79-87.
Ekstrand, E. R. (1994). Economic benefits of resources used for rock climbing at Eldorado
Canyon State Park, Colorado. Unpublished doctoral dissertation, Colorado State
University, Ft. Collins.
Ewert, A.W. (1996). Gateways to adventure tourism: The economic impacts of mountaineering
on one portal community. Tourism Analysis, 1, 59-63.
Grijalva, T. A. (2000). Valuing the loss in access: an institutional and welfare analysis of rock
climbing on U.S. public lands. Unpublished doctoral dissertation, University of New
Mexico, Alberquerque.

ECONOMIC IMPACT, IMPLAN, ROCK CLIMBING, RED RIVER GORGE
Hobbs, Abridged Thesis, 2002
47
McIntosh, R., & Goeldner, C. (1984). Tourism: Principles, practices, philosophy (4th ed.). New
York: John Wiley & Sons.
Minnesota IMPLAN Group. (1997). IMPLAN professional: social accounting & Analysis
[Computer software]. Stillwater, MN: MIG.
National Park Service. (1993). Federal Register. 58(112): 32878-80.
Outdoor Industry Association. (2000). Outdoor recreation participation study for the United
States, (2nd ed.). Boulder, CO: Prepared by Leisure Trends Group/Gallup.
Powell County Chamber of Commerce (n.d.). Slade Natural Bridge. Retrieved March 11, 2002,
from http://www.powellcountyky.com/slade.htm.
Red River Gorge Climbers’ Coalition (1998). Survey of the Martin Fork area. Unpublished
manuscript.
Ruchhoft, R. H. (1986). Kentucky’s land of the arches. Cincinnati: The Pucelle Press.
Shaw, W. D., Jakus, P. (1996). Travel cost models of the demand for rock climbing. Agricultural
& Economics Review. 131-142.
Vossler, C., Shaw, W. D., Hilger, J., Peterson, M., & Mitchell, G. (1997). The economic and
recreational importance of rock climbing and recreation at the Red Rock Canyon National
Conservation Area. Preliminary study results. (Cooperative Extension Fact Sheet 97-12).
Las Vegas: University of Nevada, Cooperative Extension.
United States Bureau of Census (2000). State and county quickfacts. Retrieved April 9, 2002,
from http://quickfacts.census.gov/qfd/states
United States Department of Agriculture (1998). USDA Forest Service bans use of fixed anchors
for climbing in wilderness. Washington, D.C. News Release. Retrieved January 15, 2002
from http://www.outdoorlink.com/accessfund/usfsnews.html