macro for small displays contents 1-2 abbreviations 3 ... · circular flow 7 crowding-out effect...
TRANSCRIPT
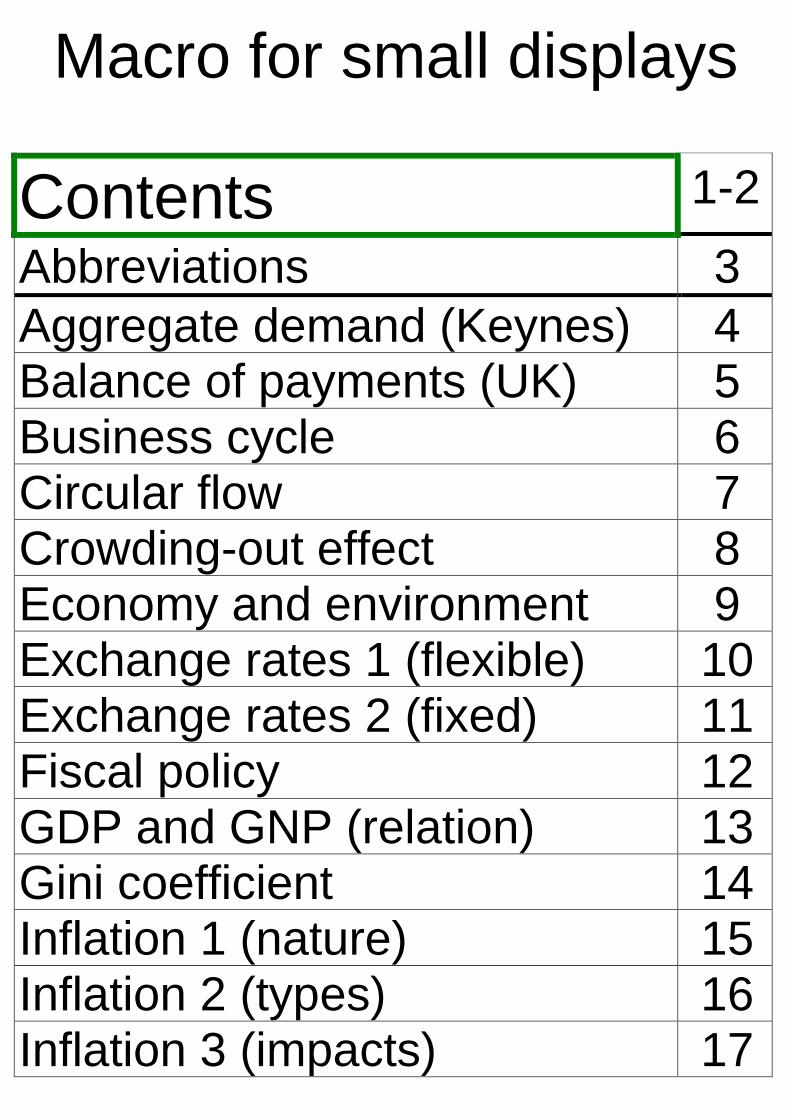
Macro for small displays
Contents 1-2
Abbreviations 3Aggregate demand (Keynes) 4Balance of payments (UK) 5Business cycle 6Circular flow 7Crowding-out effect 8Economy and environment 9Exchange rates 1 (flexible) 10Exchange rates 2 (fixed) 11Fiscal policy 12GDP and GNP (relation) 13Gini coefficient 14Inflation 1 (nature) 15Inflation 2 (types) 16Inflation 3 (impacts) 17

Investment demand 18Labour force 19Laffer curve 20Liquidity trap 21Lorenz curve 1 (nature, form) 22Lorenz curve 2 (redistribution) 23Monetary policy 24Money market 25Multiplier and accelerator 26Multiplier and AD 27Objectives and policies 28Paradox of thrift 29Phillips curve 30Poverty (vicious circle) 31Quantity theory of money 32Unemployment 1 (types) 33Unemployment 2 (impacts) 34Wealth (virtuous circle) 35
2012-11-01

Abbreviations
AD Aggegate demandAS Aggregate supplyC ConsumptionD DemandG Government spendingGDP Gross domestic productGNP Gross national productI Investmenti or r Interest ratesM ImportsQ Quantityr or i Interest ratesS SavingsT TaxesX ExportsY National income
2012-11-01

planned AD
Y
I + G
Aggregate demand (Keynes)
C
AD = Y
- AD = C + I + G- C = a + bY- I and G are not dependent on Y.- Y* = Equilibrium national income
AD
Y*
45o
2012-11-01

2012-11-01
Balance of payments (UK)
Trade in goods
Trade in services
Total income
Current transfers
Current balance
Errors/Omissions
Financial account
Capital account

Economic activity
Time
3
Business cycle
1
2
Recovery
Boom
Recession
Depression
4
Phase Danger
1
2
3
4
Inflation
Unemployment
2012-11-01

2012-11-01
Circular flow
HouseholdsFirms
Income
Consumer expenditure (C)
Factors of production
+ Injections I,G,X - Withdrawels S,T,M
Goods and services

Private spending
2012-11-01
Crowding-out effect
Market for loans
Interest rate
Loans
An increase in government bor-rowing causes a reduction in pri-vate spending (C or I) due to anincrease in interest rates.
Interest rate
Spending (C,I)
Supply
D1D2

2012-11-01
Factors of production
Economy and environment
NatureNature Households Firms
Goods and servicesWaste
See also: Graham Dawson, Macroeconomics,Harlow 2006, 553

2012-11-01
Supply(£)
Rates by market forces
Exchange rates 1 (flexible)
and at a moment:
Time
Q (£)
Rates during a time period...
D (£)
2012-11-01
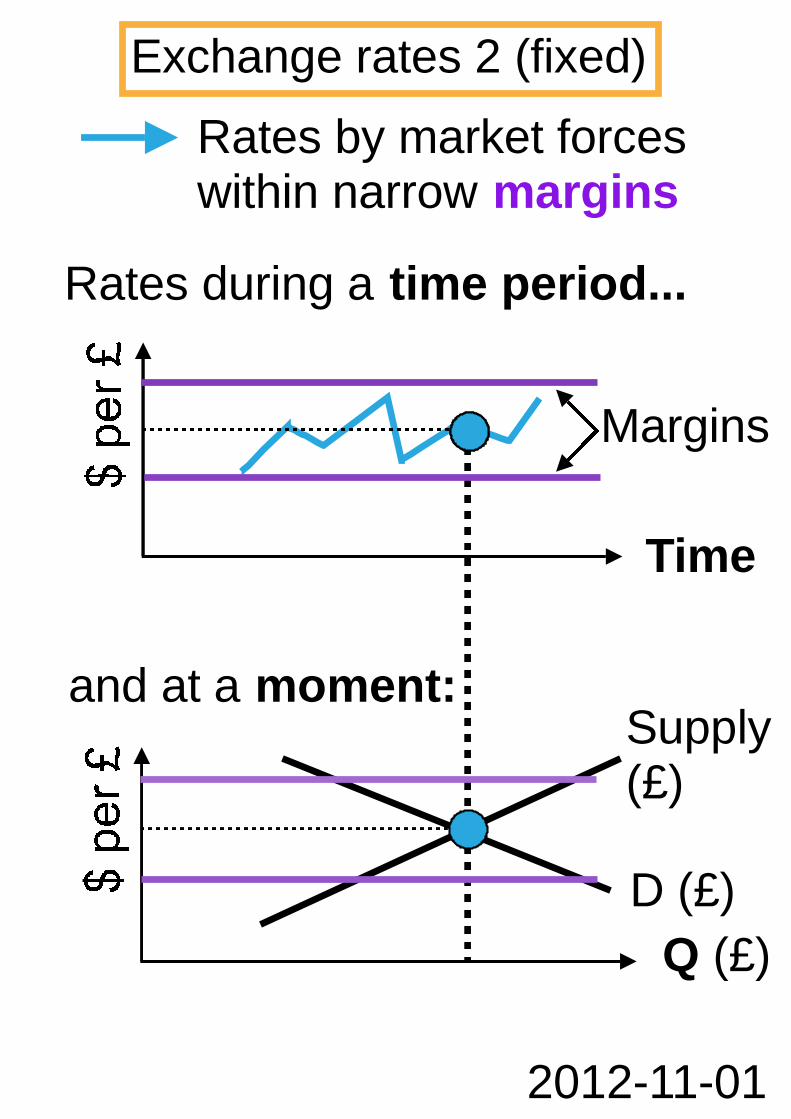
Supply(£)
Rates by market forceswithin narrow margins
Exchange rates 2 (fixed)
and at a moment:
Time
Q (£)
Rates during a time period...
D (£)
Margins
2012-11-01
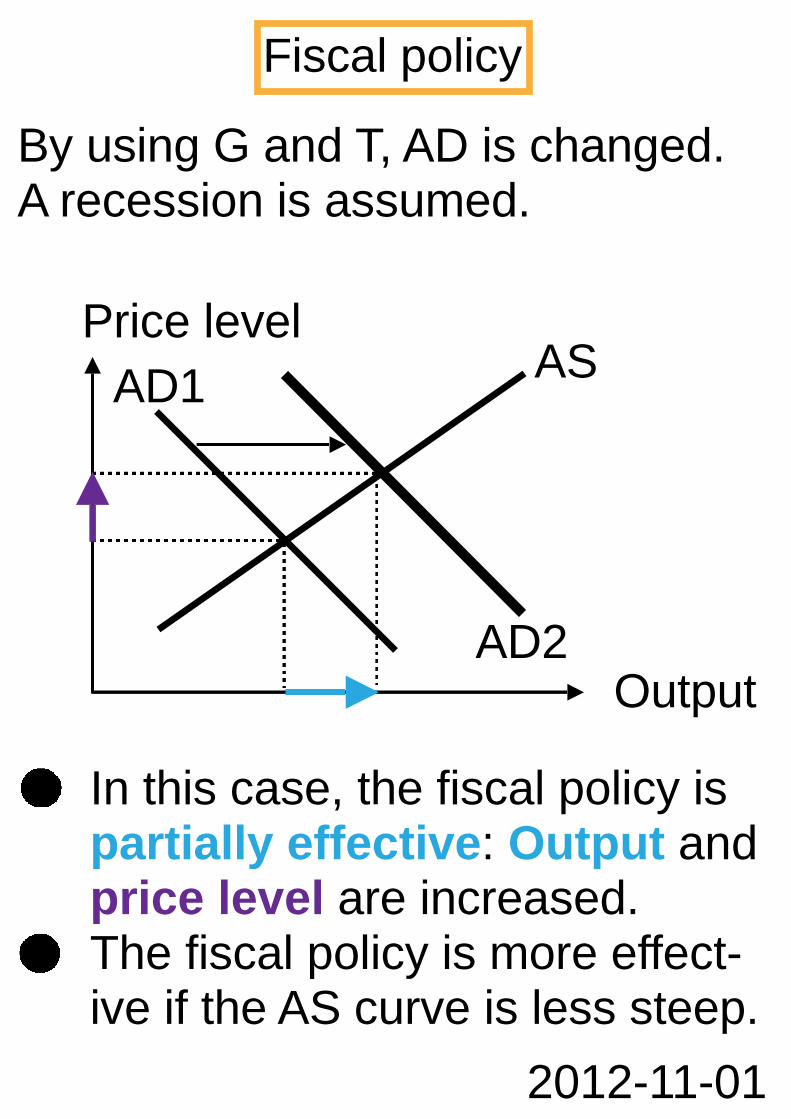
AD1
Output
Price level
By using G and T, AD is changed.A recession is assumed.
Fiscal policy
AS
In this case, the fiscal policy ispartially effective: Output andprice level are increased.The fiscal policy is more effect-ive if the AS curve is less steep.
AD2

C
NI = Net income from abroad(from labour, from investments)If NI > 0, then GDP < GNP(more income from abroadthan to abroad)If NI < 0, then GDP > GNP(less income from abroad thanto abroad)
GDP and GNP (relation)
I
G
X - M
NI
2012-11-01

Gini coefficient =Area between diagonal and LCArea ABC
LC = Lorenz curve
2012-11-01- 0 < Gini coeff. < 1
Gini coefficient
Persons (cumulative %)
100
- 100
A B
C
LC
- The Gini coefficient is a measureof (in)equality in income.
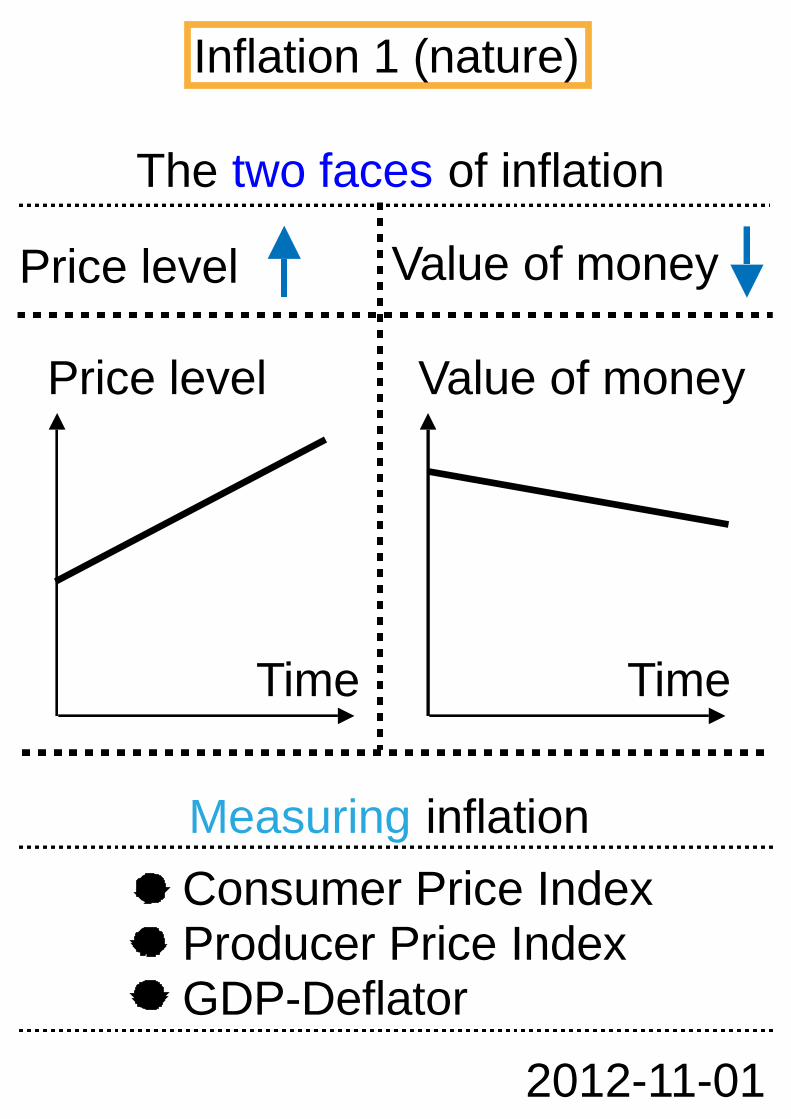
The two faces of inflation
Measuring inflation
- Consumer Price Index- Producer Price Index- GDP-Deflator
Inflation 1 (nature)
Value of moneyPrice level
Price level
Time
Value of money
Time
2012-11-01

Types of inflation
Price level
Inflation 2 (types)
Demand-pull
Example:Consumption
Cost-push
Example:Wages
GDP
AS1
AS2Price level
GDP
AS
ADAD1
AD2
2012-11-01

General impacts
If inflation is anticipated:Cost for avoiding theimpacts (time and effort)
2012-11-01
Inflation 3 (impacts)
Uncertainty
Speculation
Special impacts
If inflation is not antici-pated:Redistribution of incomeand wealth from lenders toborrowers
1
2

i
Investment demand
I D curve Change in i Shifting of D
D+
I
D
I
D
ID
I
D
I
ii
Negativerelationshipbetween i and I(ceteris paribus)
Movementalong D (ceterisparibus):
If i , then IIf i , then I
D
-
Determinants:Growth (+)Recession (-)Optimism (+)Pessimism (-)

Unemployed
1 leaving labour force
Labour force
The labour force consists of em-ployed and unemployed persons.
Employed
32
getting employed again
5
1
2
3
4
4
5
changing the job
getting unemployed
entering labour force
2012-11-01

2012-11-01
In most cases, the peak will not beat the tax rate of 50 %. Neverthe-less, total tax revenue will be low ifthe tax rate is very low or very high.
0 %
Tax rate
Laffer curve
= peak, at the tax rate of 50 %
100 %50 %

2012-11-01
r very low monetary policy ineffective
Liquidity trap
1
r
AD (C+I+G+...)InvestmentMoney market
Money
r
I
planned AD
Y
D
2
Y*1=Y*2
AD1=AD2
Supply
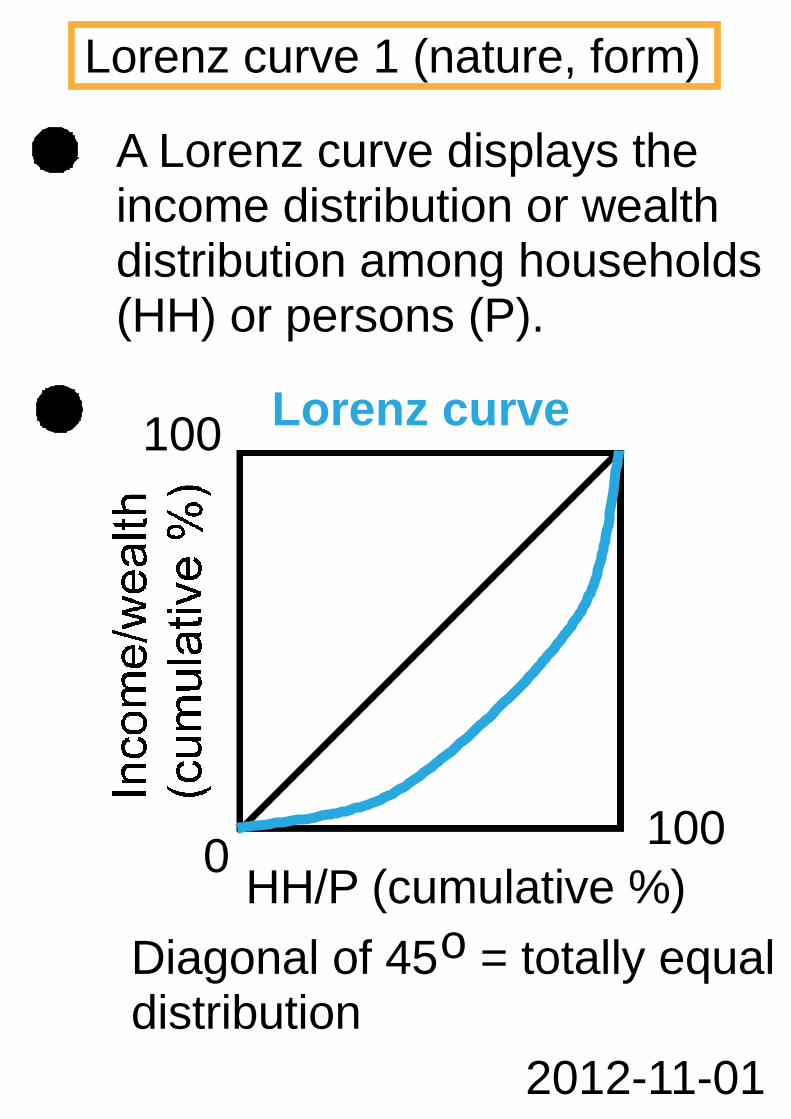
A Lorenz curve displays theincome distribution or wealthdistribution among households(HH) or persons (P).
2012-11-01
Lorenz curve 1 (nature, form)
HH/P (cumulative %)0
100
100Lorenz curve
Diagonal of 45o = totally equaldistribution

If a government redistributesincome from rich to poor, e.g. byprogressive taxes, the Lorenzcurve shifts inwards (to the left).
2012-11-01
LC1
Lorenz curve 2 (redistribution)
Persons (cumulative %)0
100
100Lorenz curve (LC)
LC2
2012-11-01
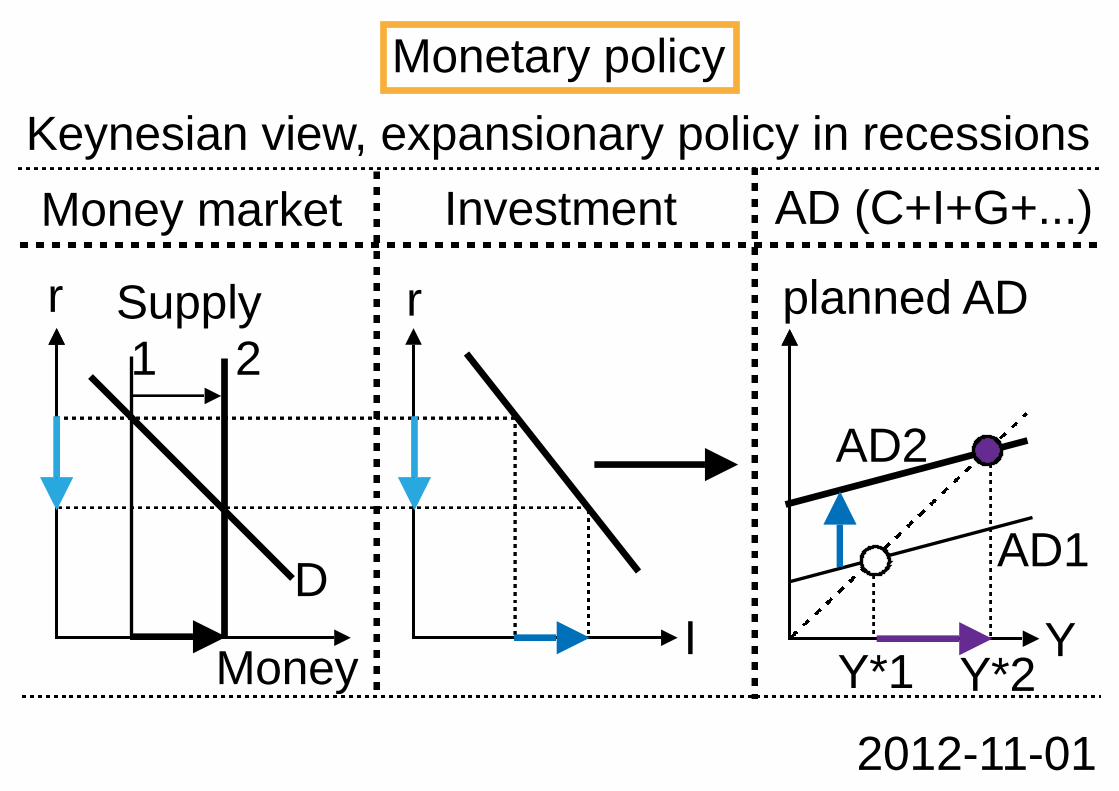
Keynesian view, expansionary policy in recessions
Monetary policy
1
r
AD (C+I+G+...)InvestmentMoney market
Money
r
I
planned AD
Y
AD2
D
2
Y*2Y*1
AD1
Supply

2012-11-01
Money supply is determinedby the central bank.
Money
Supply
Interest rate
Money market
Demand
Motives for demand:- Transactions- Precaution- SpeculationThe first two motives dependon income, the third dependson the interest rate.
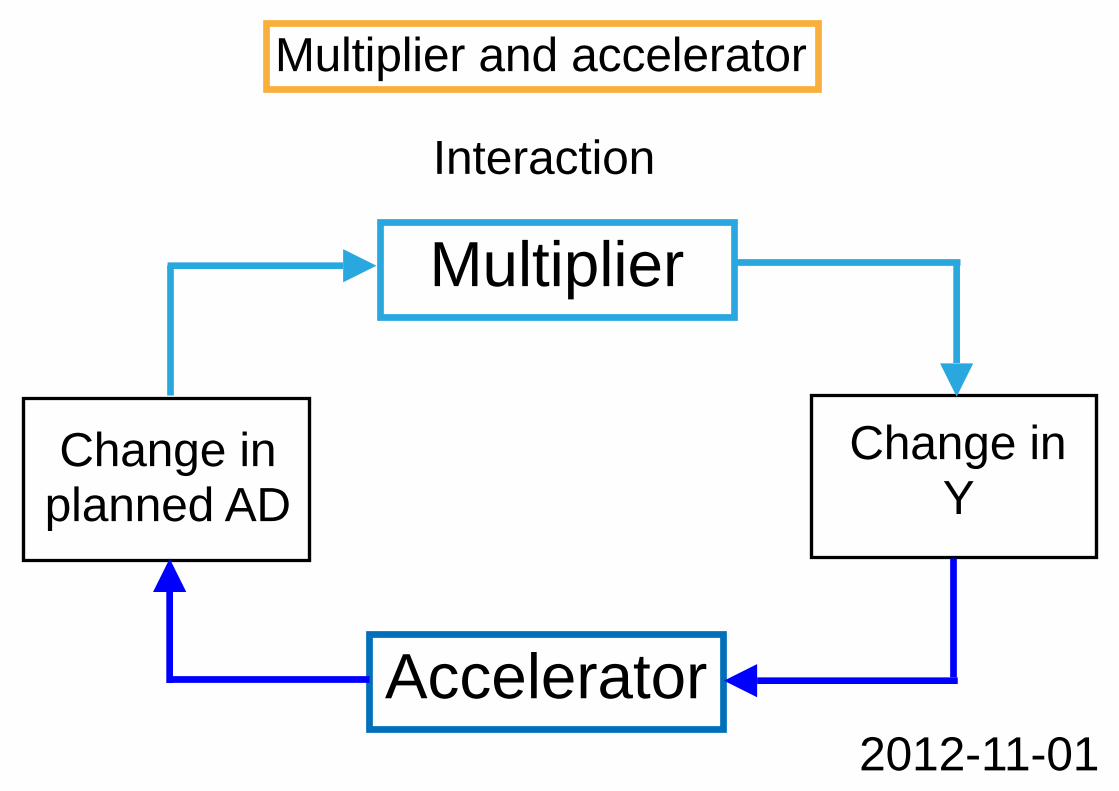
Multiplier and accelerator
Accelerator
Multiplier
Change inplanned AD
Change inY
Interaction
2012-11-01

planned AD
Y
Multiplier and AD
AD = Y
AD1
45o
2012-11-01
Multiplier
Changein AD
Change in Y
Change in AD=
AD2
Y1 Y2Change in Y
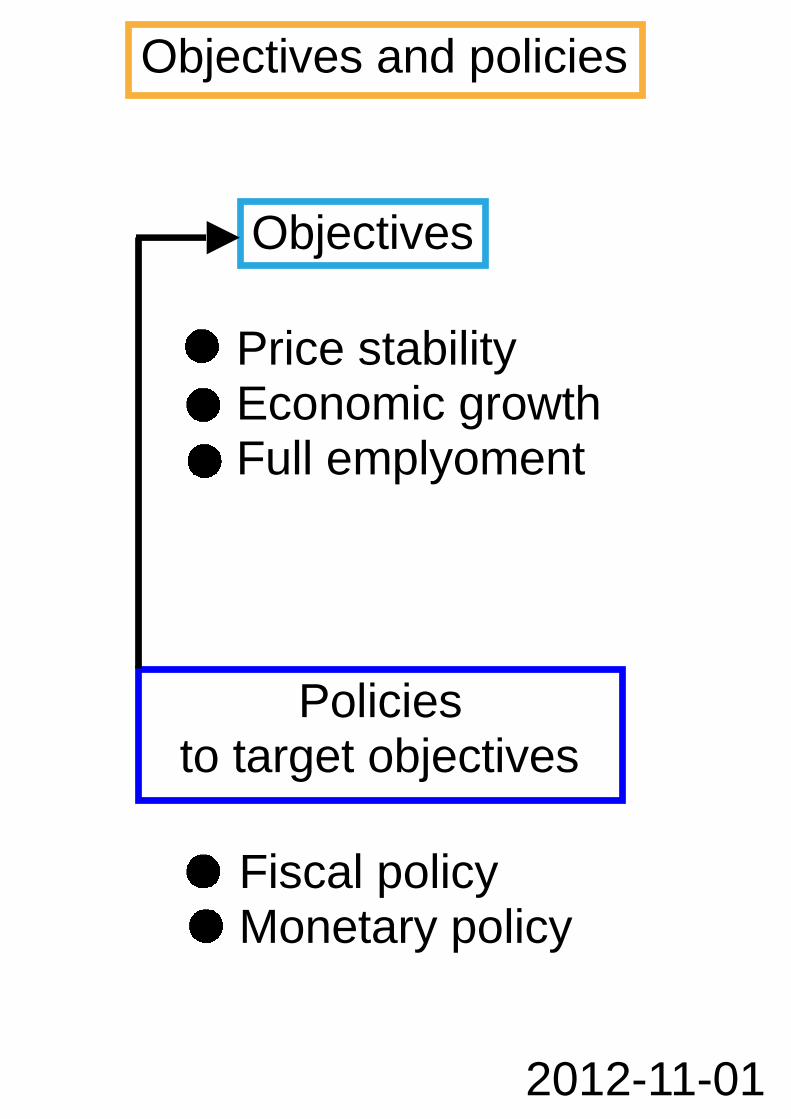
Objectives
Policiesto target objectives
2012-11-01
Objectives and policies
- Price stability- Economic growth- Full emplyoment
- Fiscal policy- Monetary policy
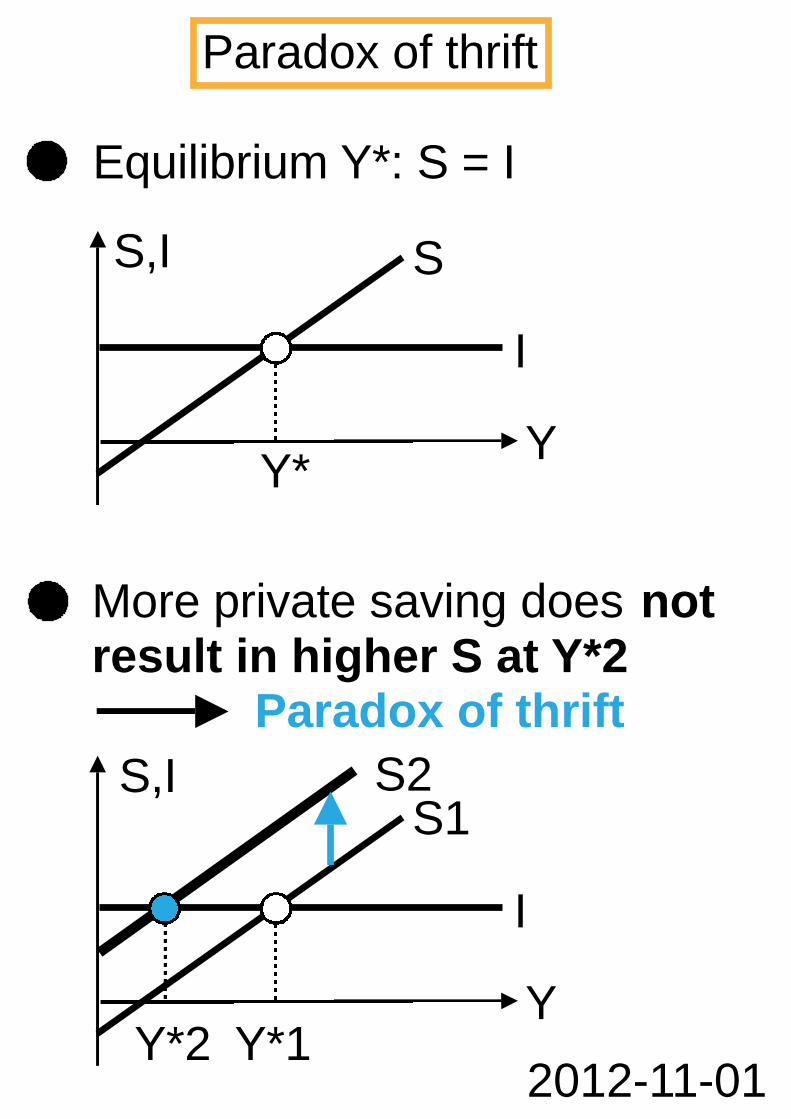
Equilibrium Y*: S = I
S,I
2012-11-01
Paradox of thrift
S
I
Y*Y
S1
I
Y*1Y
More private saving does notresult in higher S at Y*2
Paradox of thrift
S2
Y*2
S,I

Inflation (%)
2012-11-01
Phillips curve
Unemploy-ment (%)X
Y
The Phillips curve describes anegative relationship betweeninflation and unemployment.
- Since the 1970s this relation-ship has not been constant anymore. The curve is shiftedsometimes.
X = unemployment /Y= inflation

Low incomes
Low savingand investment
Source: Samuelson/Nordhaus:Economics, 18th ed, 583
Poverty (vicious circle)
Low capitalaccumulation
Low productivity
2012-11-01

2012-11-01
Classical and monetarist view:Monetary policy just changesthe price level (and not othervariables).
M * V = P * Q- M = Money supply- V = Velocity of circulation- P = Price level- Q = Output
Quantity theory of money
If V (pattern of payments) andQ (full employment) areconstant, then it can be said:A rise in M results in aproportional increase in P, e.g.more money, more inflation.

2012-11-01
Unemployment 1(types)
Seasonal unemployment:regular during the year
Frictional unemployment:when joining the labour forceor changing the job
Structural unemployment:due to changes in technology
Cyclical unemployment:during recessions
2012-11-01
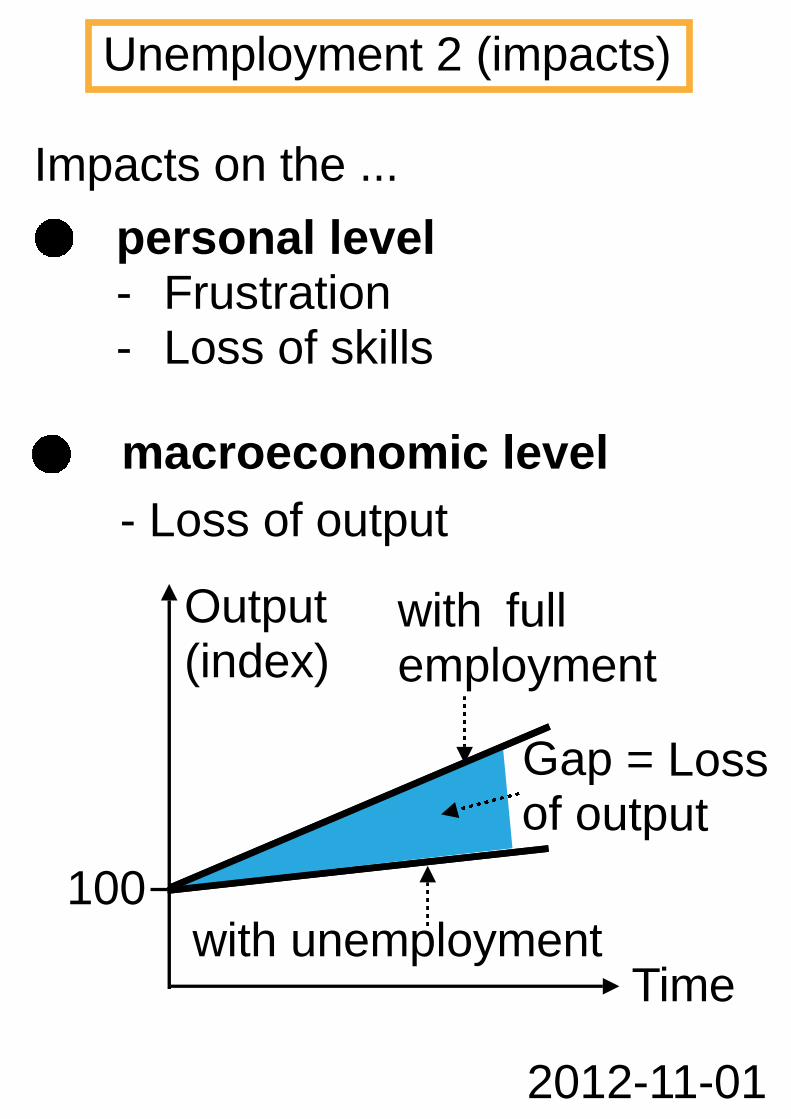
- Loss of output
100
Output(index)
personal level- Frustration- Loss of skills
Impacts on the ...
Unemployment 2 (impacts)
macroeconomic level
with fullemployment
with unemployment
Gap = Lossof output
Time

High incomes
High savingand investment
Wealth (virtuous circle)
High capitalaccumulation
High productivity
2012-11-01