machine-learning techniques for customer retention: a ... · (ijacsa) international journal of...
TRANSCRIPT

(IJACSA) International Journal of Advanced Computer Science and Applications,
Vol. 9, No. 2, 2018
273 | P a g e
www.ijacsa.thesai.org
Machine-Learning Techniques for Customer
Retention: A Comparative Study
Sahar F. Sabbeh
Faculty of computing and information sciences, King AbdulAziz University, KSA
Faculty of computing and information sciences, Banha University, Egypt
Abstract—Nowadays, customers have become more interested
in the quality of service (QoS) that organizations can provide
them. Services provided by different vendors are not highly
distinguished which increases competition between organizations
to maintain and increase their QoS. Customer Relationship
Management systems are used to enable organizations to acquire
new customers, establish a continuous relationship with them
and increase customer retention for more profitability. CRM
systems use machine-learning models to analyze customers’
personal and behavioral data to give organization a competitive
advantage by increasing customer retention rate. Those models
can predict customers who are expected to churn and reasons of
churn. Predictions are used to design targeted marketing plans
and service offers. This paper tries to compare and analyze the
performance of different machine-learning techniques that are
used for churn prediction problem. Ten analytical techniques
that belong to different categories of learning are chosen for this
study. The chosen techniques include Discriminant Analysis,
Decision Trees (CART), instance-based learning (k-nearest
neighbors), Support Vector Machines, Logistic Regression,
ensemble–based learning techniques (Random Forest, Ada
Boosting trees and Stochastic Gradient Boosting), Naïve
Bayesian, and Multi-layer perceptron. Models were applied on a
dataset of telecommunication that contains 3333 records. Results
show that both random forest and ADA boost outperform all
other techniques with almost the same accuracy 96%. Both
Multi-layer perceptron and Support vector machine can be
recommended as well with 94% accuracy. Decision tree achieved
90%, naïve Bayesian 88% and finally logistic regression and
Linear Discriminant Analysis (LDA) with accuracy 86.7%.
Keywords—Customer relationship management (CRM);
customer retention; analytical CRM; business intelligence;
machine-learning; predictive analytics; data mining; customer
churn
I. INTRODUCTION
For any business, customers are the basis for its success and revenue and that is why companies become more aware of the importance of gaining customers’ satisfaction. Customer relationship management (CRM) supports marketing by selecting target consumers and creating cost-effective relationships with them. CRM is the process of understanding customer behavior in order to support organization to improve customer acquisition, retention, and profitability. Thus, CRM systems utilize business intelligence and analytical models to identify the most profitable group of consumers and target them achieve higher customer retention rates. Those models can predict customers with high probability to churn based on analyzing customers’ personal, demographic and behavioral
data to provide personalized and customer-oriented marketing campaigns to gain customer satisfaction. The lifecycle of business – customer relationship includes four main stages: 1) identification; 2) attraction; 3) retention; and 4) development.
1) Customer identification/acquisition: This aims to
identify profitable customers and the ones that are highly
probable to join organization. Segmentation and clustering
techniques can explore customers’ personal and historical data
to create segments/sub-groups of similar customers [1], [2].
2) Customer attraction: The identified customer segments
/ sub-groups are analyzed to identify the common features that
distinguish customers within a segment. Different marketing
techniques can be used to target different customer segments
such targeted advertising and/or direct marketing [3].
3) Customer retention: This is the main objective of CRM
as retaining existing customers is at least 5 to 20 times more
cost effective than acquiring new ones depending on business
domains [4], [5]. Customer retention includes all actions taken
by organization to guarantee customer loyalty and reduce
customer churn. Customer churn refers to customers moving
to a competitive organization or service provider. Churn can
be for better quality of service, offers and/or benefits. Churn
rate is an important indicator that all organizations aim to
minimize. For this sake, churn prediction is an integral part of
proactive customer retention plan [6]. Churn prediction
includes using data mining and predictive analytical models in
predicting the customers with high likelihood to churn/defect.
These models analyze personal and behavioral customer data
for tailored and customer-centric retention marketing
campaigns [7].
4) Customer development: The main objective of this
phase is to increase the amount of customer transactions for
more profitability. For this sake, market basket analysis,
customer lifetime value, up, and cross selling techniques are
used. Market basket analysis tries to analyze customers’
behavior patterns to maximize the intensity of transactions [8],
[9]. Analyzing customer lifetime value (CLTV) can help
identifying the total net income expected from customer [10]-
[12]. Up and/or Cross selling include activities that increase
the transactions of the associated services/products [13], [14].
Customer retention and churn prediction have been increasingly investigated in many business domains, including, but not limited to, telecommunication [15]-[18],

(IJACSA) International Journal of Advanced Computer Science and Applications,
Vol. 9, No. 2, 2018
274 | P a g e
www.ijacsa.thesai.org
banking [19]-[21], retail [22] and cloud services subscriptions [23], [24]. Different statistical and machine-learning techniques are used to address this problem. Many attempts have been made to compare and benchmark the used techniques for churn prediction. In [28], [66] a comparison between (Decision trees, Logistic regression and Neural Network) models was performed. The study found that neural network perform slightly higher than the other two techniques. Another comparison between a set of models against their boosted versions is discussed in [67]. This study included two-layer Back-Propagation neural network (BPN), Decision Trees, SVM and Logistic Regression. The study showed that both decision trees and BPN achieved accuracy 94%, SVM comes next with 93% while Logistic Regression failed with accuracy 86%. Additionally, study showed 1-4% performance improvement in the boosted versions. In [68] the study investigated the accuracy of different models (Multi-layer perceptron (MLP) and Decision Tree (C5)). The study showed that MLP achieves accuracy of 95.51%, which outperforms C5 decision tree 89.63%.
Most of comparisons in the literature did not consider a study that covers the various categories of learning techniques. The bulk of the models applied for churn prediction fall into one of the following categories:
1) Regression analysis, 2) Decision tree–based, 3) Support Vector Machine, 4) Bayesian algorithm, 5) Instance – based learning, 6) Ensemble learning, 7) Artificial neural network, and 8) Linear Discriminant Analysis.
This study presents a comparative study of the most used algorithms for predicting customer churn. The comparison is held between algorithms from different categories. The main goal is to analyze and benchmark the performance of the models in the literature. The selected models are:
1) Regression analysis: logistic regression.
2) Decision tree–CART.
3) Bayes algorithm: Naïve Bayesian.
4) Support Vector Machine
5) Instance – based learning: k-nearest Neighbor.
6) Ensemble learning: Ada Boost, Stochastic Gradient
Boost and Random Forest.
7) Artificial neural network: Multi-layer Perceptron.
8) Linear Discriminant Analysis.
A. Contribution
The key contribution of this paper is the analysis of most common learning techniques in the state of the arts and the evaluation of their accuracy.
This paper is organized as follows: Section 2 presents a state of the arts of data mining techniques for churn prediction and briefly discusses the evaluated techniques. In Section 3, methodology of the study is discussed, Results and discussion are given in Section 4 and finally Section 5 concludes this work.
II. MACHINE-LEARNING FOR CHURN PREDICTION
Machine-learning techniques have been widely used for evaluating the probability of customer to churn [25]. Based on
a survey of the literature in churn prediction, the techniques used in the bulk of literatures fall into one of the following categories 1) Regression analysis; 2) Tree – based; 3) Support Vector Machine; 4) Bayesian algorithm; 5) Ensemble learning; 6) Sample – based learning; 7) Artificial neural network; and 8) Linear Discriminant Analysis. A brief introduction of the chosen algorithms is presented in this section.
1) Regression analysis: Regression analysis techniques
aim mainly to investigate and estimate the relationships
among a set of features. Regression includes many models for
analyzing the relation between one target/response variable
and a set of independent variables. Logistic Regression (LR) is
the appropriate regression analysis model to use when the
dependent variable is binary. LR is a predictive analysis used
to explain the relationship between a dependent binary
variable and a set of independent variables. For customer
churn, LR has been widely used to evaluate the churn
probability as a function of a set of variables or customers'
features [26]-[33].
2) Decision Tree: Decision Tree (DT) is a model that
generates a tree-like structure that represents set of decisions.
DT returns the probability scores of class membership. DT is
composed of: a) internal Nodes: each node refers to a single
variable/feature and represents a test point at feature level;
b) branches, which represent the outcome of the test and are
represented by lines that finally lead to c) leaf Nodes which
represent the class labels. That is how decision rules are
established and used to classify new instances. DT is a flexible
model that supports both categorical and continuous data. Due
to their flexibility they gained popularity and became one of
the most commonly used models for churn prediction [27]-
[29], [33]-[36].
3) Support Vector Machine: Support Vector Machine
(SVM) is a supervised learning technique that performs data
analysis in order to identify patterns. Given a set of labeled
training data, SVM represents observations as points in a high-
dimensional space and tries to identify the best separating
hyperplanes between instances of different classes. New
instances are represented in the same space and are classified
to a specific class based on their proximity to the separating
gap. For churn prediction, SVM techniques have been widely
investigated and evaluated to be of high predictive
performance [37]-[41].
4) Bayes Algorithm: Bayes algorithm estimates the
probability that an event will happen based on previous
knowledge of variables associated with it. Naïve Bayesian
(NB) is a classification technique that is based on Bayes’
theorem. It adopts the idea of complete variables
independence, as the presence/absence of one feature is
unrelated to the presence/absence of any other feature. It
considers that all variables independently contribute to the
probability that the instance belongs to a certain class. NB is a
supervised learning technique that bases its predictions for
new instances based on the analysis of their ancestors. NB

(IJACSA) International Journal of Advanced Computer Science and Applications,
Vol. 9, No. 2, 2018
275 | P a g e
www.ijacsa.thesai.org
model usually outputs a probability score and class
membership. For churn problem, NB predicts the probability
that a customer will stay with his service provider or switch to
another one [42]-[46].
5) Instance – based learning: Also known as memory-
based learning, new instances are labeled based on previous
instances stored in memory. The most widely used instance
based learning techniques for classification is K-nearest
neighbor (KNN). KNN does not try to construct an internal
model and computations are not performed until the
classification time. KNN only stores instances of the training
data in the features space and the class of an instance is
determined based on the majority votes from its neighbors.
Instance is labeled with the class most common among its
neighbors. KNN determine neighbors based on distance using
Euclidian, Manhattan or Murkowski distance measures for
continuous variables and hamming for categorical variables.
Calculated distances are used to identify a set of training
instances (k) that are the closest to the new point, and assign
label from these. Despite its simplicity, KNN have been
applied to various types of applications. For churn, KNN is
used to analyze if a customer churns or not based on the
proximity of his features to the customers in each classes [17],
[51].
6) Ensemble – based Learning: Ensemble based learning
techniques produce their predictions based on a combination
of the outputs of multiple classifiers. Ensemble learners
include bagging methods (i.e. Random Forest) and boosting
methods (i.e. Ada Boost, stochastic gradient boosting).
a) Random Forest
Random forests (RF) are an ensemble learning technique that can support classification and regression. It extends the basic idea of single classification tree by growing many classification trees in the training phase. To classify an instance, each tree in the forest generates its response (vote for a class), the model choses the class that has receive the most votes over all the trees in the forest. One major advantage of RF over traditional decision trees is the protection against overfitting which makes the model able to deliver a high performance [47]-[50].
b) Boosting – based techniques (Ada Boost and
Stochastic Gradient Boosting)
Both AdaBoost (Adaptive Boost) and Stochastic Gradient Boosting algorithms are ensemble based algorithms that are based on the idea of boosting. They try to convert a set of weak learners into a stronger learner. The idea is that having a weak algorithm will perform better than random guessing. Thus, Weak learner is any algorithm that can perform at least a little better than random solutions. The two algorithms differ in the iterative process during which weak learners are created. Adaboost filters observations, by giving more weight to problematic ones or the ones that the weak learner couldn’t handle and decrease the correctly predicted ones. The main focus is to develop new weak learns to handle those misclassified observations. After training, weak learners are
added to the stronger learner based on their alpha weight (accuracy), the higher alpha weight, the more it contributes to the final learner. The weak learners in AdaBoost are decision trees with a single split and the label assigned to an instance is based on the combination of the output of all weak learners weighted by their accuracy [56].
On the other hand, gradient bosting gives importance to misclassified/difficult instances using the remaining errors (pseudo-residuals) of the strong learner. At each iteration, errors are computed and a weak learner is adjusted to them. Then, the contribution of the weak learner to the strong one is the minimization of the overall error of the strong learner [57]. For churn prediction Adaboost [58]-[60] and Sochastic gradient [61], [62] have been used for churn prediction.
7) Artificial neural network: Artificial Neural Networks
(ANNs) are machine-learning techniques that are inspired by
the biological neural network in human brain. ANNs are
adaptive, can learn by example, and are fault tolerant. An
ANN is composed of a set of connected nodes (neurons)
organized in layers. The input layer communicates with one or
more hidden layers, which in turn communicates with the
output layer. Layers are connected by weighted links. Those
links carry signals between neurons usually in the form of a
real number. The output of each neuron is a function of the
weighted sum of all its inputs. The weights on connection are
adjusted during the learning phase to represent the strengths of
connections between nodes. ANN can address complex
problems, such as the churn prediction problem. Multilayer
perceptron (MLP) is an ANN that consists of at least three
layers. Neurons in each layer use supervised learning
techniques [52], [53]. In the case of customer churn problem,
MLP has proven better performance over LR [21], [27], [28],
[54], [55].
8) Linear Discriminant Analysis: Linear Discriminant
Analysis (LDA) is a mathematical classification technique that
searches for a combination of predictors that can differentiate
two targets. LDA is related to regression analysis. They both
attempt to express the relationship between one dependent
variable and a set of independent variables. However, unlike
regression analysis, LDA use continuous independent
variables and a categorical dependent variable (target). The
output label for an instance is estimated by the probability that
inputs belong to each class and the instance is assigned the
class with the highest probability. Probability in this model is
calculated based on Bayes Theorem. LDA can be used for
dimensionality reduction by determining the set of features
that are the most informative. LDA has been used in for
different classification tasks including customer churn
[63]-[65].
III. METHODOLOGY
The first step before applying the selected analytical models on the dataset, explanatory data analysis for more insights into dataset was performed. Based on the observations data was preprocessed to be more suitable for analysis.

(IJACSA) International Journal of Advanced Computer Science and Applications,
Vol. 9, No. 2, 2018
276 | P a g e
www.ijacsa.thesai.org
1) Data: The used dataset for the experiments of this
study is a database of customer data of a telecommunication
company. The dataset contains customers’ statistical data
including 17 explanatory features related to customers’ service
usage during day, international calls, customer service calls.
14% of the observations have the target variable “yes” and
86% observations have the value “No”. The dataset variables
of customer transactions and their descriptions are presented
in Table I and Fig. 1 shows the distribution of each feature.
TABLE I. CUSTOMER FEATURES IN DATASET
Variable DataType Description
AccountLength Integer how long account has been active
Int'l Plan categorical International plan activated ( yes, no)
VMail Plan categorical Voice Mail plan activated ( yes , no )
VMailMessage Integer No. of voice mail messages
DayMins Integer Total day minutes used
DayCalls Integer Total day calls made
DayCharge Integer Total day charge
EveMins Integer Total evening minutes
EveCalls Integer Total evening calls
EveCharge Integer Total evening charge
NightMins Integer Total night minutes
NightCalls Integer Total night calls
NightCharge Integer Total night charge
IntlMins Integer Total International minutes used
IntlCalls Integer Total International calls made
IntlCharge Integer Total International charge
CustServCalls Integer Number of customer service calls made
Churn categorical Customerchurn(yes=churn,No=nochurn)
Fig. 1. Features’ distribution.
2) Data preprocessing: Preprocessing includes three
steps: a) data transformation, b) data cleaning and c) feature
selection.
a) Data Transformation
Two of the explanatory variables (Int.l.plans and VMail Plan) were transformed from binominal form (yes/no) into binary form (1/0) to be more suitable for the selected models.
b) Data cleaning
This stage includes missing data handling/imputation: Some of the selected algorithms cannot handle missing data such as SVM. That’s why missing value can be replaced by mean, median or zero. However, missing data replacement by statistically computed value (imputation) is a better option. The used dataset included missing values in some the numerical variables (Day Charge, Eve Mins, Intl Calls, Intl Charge and Night Charge) and two categorical variables (VMail Plan, Int'l Plan). Numerical data were replaced using random forest imputation technique [69]. And binary values were imputed using the techniques in [70]
c) Feature selection
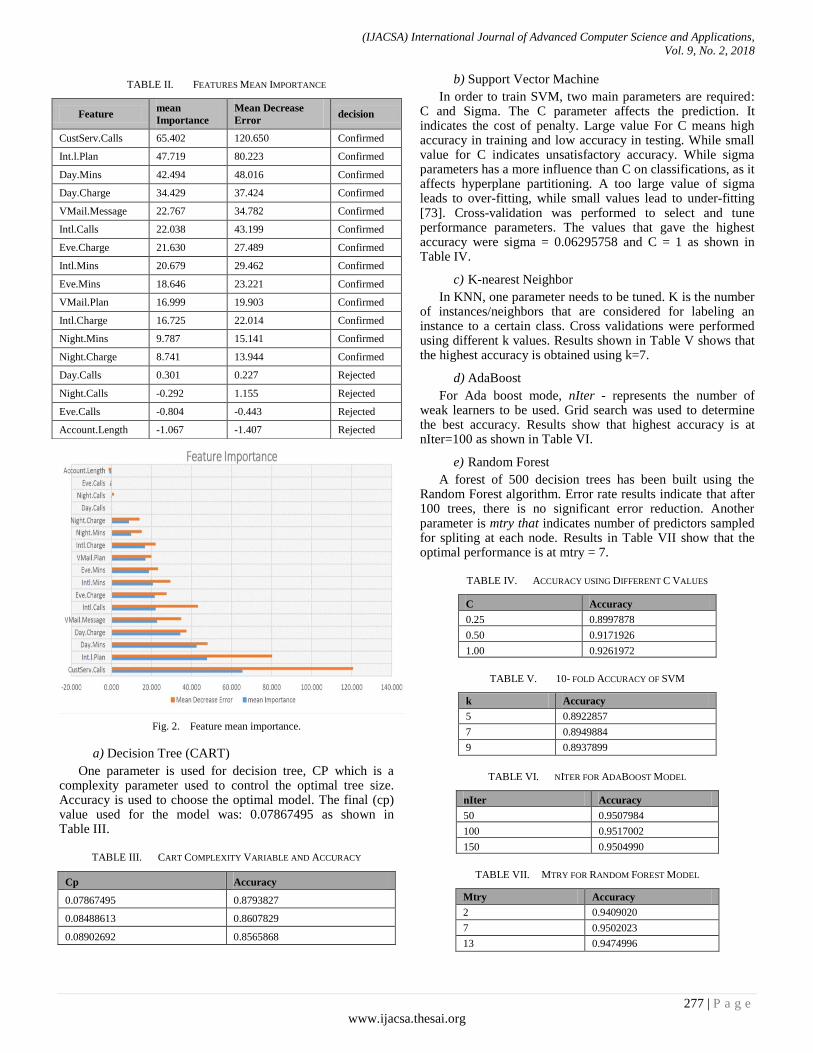
Before model training, feature selection is one of the most important factors that can affect the performance of models. In this study, the importance of the used variables was measured to identify and rank explanatory variables influence on the target/response. This allows dimensionality reduction by removing variables/predictors with low influence on the target. Random forest technique can be used for feature selection using mean decrease accuracy. Mean decrease measures the impact of each feature on model accuracy. The model permutes values of each feature and evaluates model accuracy change. Only features having higher impact on accuracy are considered important [71]. Another well-known feature selection technique Boruta [72] was used. It is an improvement on RF. It considers all features that are relevant to the target variable whereas, most of techniques follow a minimal optimal method. Additionally, it can handle interactions between features [72]. Both techniques were applied to rank predictors based on the mean importance from Boruta and the mean decrease error calculated by random forest. Results shown in Table II shows that both models agree on the top three variables with the same rank (custServ.Calls, Int.l.Plan,Day.Mins). Both models agree on the next six features with different ranks (Day.Charge, VMail.Message, Intl.Calls, Eve.Charge, Intl.Mins and Eve.Mins). Both models give very low rank to the same four variables (Day.Calls,Night.Calls, Eve.Calls and Account.Length). Results are shown in Table II and Fig. 2.
3) Simulation Setup: For this study, the selected models
are used to generate predictions using the dataset containing
3333 samples with 13 predictors and one response variable.
10-fold cross validations were used for models training and
testing. Training and testing datasets are randomly chosen
with cross validation 60% for training and 40% for testing.
Each module requires initial parameters that are set as follows:
(IJACSA) International Journal of Advanced Computer Science and Applications,
Vol. 9, No. 2, 2018
277 | P a g e
www.ijacsa.thesai.org
TABLE II. FEATURES MEAN IMPORTANCE
Fig. 2. Feature mean importance.
a) Decision Tree (CART)
One parameter is used for decision tree, CP which is a complexity parameter used to control the optimal tree size. Accuracy is used to choose the optimal model. The final (cp) value used for the model was: 0.07867495 as shown in Table III.
TABLE III. CART COMPLEXITY VARIABLE AND ACCURACY
Cp Accuracy
0.07867495 0.8793827
0.08488613 0.8607829
0.08902692 0.8565868
b) Support Vector Machine
In order to train SVM, two main parameters are required: C and Sigma. The C parameter affects the prediction. It indicates the cost of penalty. Large value For C means high accuracy in training and low accuracy in testing. While small value for C indicates unsatisfactory accuracy. While sigma parameters has a more influence than C on classifications, as it affects hyperplane partitioning. A too large value of sigma leads to over-fitting, while small values lead to under-fitting [73]. Cross-validation was performed to select and tune performance parameters. The values that gave the highest accuracy were sigma = 0.06295758 and C = 1 as shown in Table IV.
c) K-nearest Neighbor
In KNN, one parameter needs to be tuned. K is the number of instances/neighbors that are considered for labeling an instance to a certain class. Cross validations were performed using different k values. Results shown in Table V shows that the highest accuracy is obtained using k=7.
d) AdaBoost
For Ada boost mode, nIter - represents the number of weak learners to be used. Grid search was used to determine the best accuracy. Results show that highest accuracy is at nIter=100 as shown in Table VI.
e) Random Forest
A forest of 500 decision trees has been built using the Random Forest algorithm. Error rate results indicate that after 100 trees, there is no significant error reduction. Another parameter is mtry that indicates number of predictors sampled for spliting at each node. Results in Table VII show that the optimal performance is at mtry = 7.
TABLE IV. ACCURACY USING DIFFERENT C VALUES
C Accuracy
0.25 0.8997878
0.50 0.9171926
1.00 0.9261972
TABLE V. 10- FOLD ACCURACY OF SVM
k Accuracy
5 0.8922857
7 0.8949884
9 0.8937899
TABLE VI. NITER FOR ADABOOST MODEL
nIter Accuracy
50 0.9507984
100 0.9517002
150 0.9504990
TABLE VII. MTRY FOR RANDOM FOREST MODEL
Mtry Accuracy
2 0.9409020
7 0.9502023
13 0.9474996
Feature mean
Importance
Mean Decrease
Error decision
CustServ.Calls 65.402 120.650 Confirmed
Int.l.Plan 47.719 80.223 Confirmed
Day.Mins 42.494 48.016 Confirmed
Day.Charge 34.429 37.424 Confirmed
VMail.Message 22.767 34.782 Confirmed
Intl.Calls 22.038 43.199 Confirmed
Eve.Charge 21.630 27.489 Confirmed
Intl.Mins 20.679 29.462 Confirmed
Eve.Mins 18.646 23.221 Confirmed
VMail.Plan 16.999 19.903 Confirmed
Intl.Charge 16.725 22.014 Confirmed
Night.Mins 9.787 15.141 Confirmed
Night.Charge 8.741 13.944 Confirmed
Day.Calls 0.301 0.227 Rejected
Night.Calls -0.292 1.155 Rejected
Eve.Calls -0.804 -0.443 Rejected
Account.Length -1.067 -1.407 Rejected

(IJACSA) International Journal of Advanced Computer Science and Applications,
Vol. 9, No. 2, 2018
278 | P a g e
www.ijacsa.thesai.org
Fig. 3. Boosting iterations of SGB model.
f) Stochastic gradient boost
The model was tuned to calculate the number of trees that achieves the best accuracy. The parameter was initially 5000 to 1000000. Results show that after 60000 ntrees, there’s no significant change in accuracy as shown in Fig. 3.
g) MLP ANN
Multi-layer perceptron neural network was built using: 13 inputs, 2 outputs and one hidden layer with 5 neurons. The initial weight matrix was randomly generated. The learning function is “Std_Backpropagation” and the learning rate = 0.1.
The resulted weight matrix after epochs’ network training is shown in Table VIII.
IV. RESULTS AND DISCUSSION
Accuracy is used to evaluate the model performance. Accuracy indicates the ability to differentiate the credible and non-credible cases correctly. It’s the proportion of true positive (TP) and true negative (TN) in all evaluated news:
(1)
Where,
TP: is the total number of customers correctly identified as churn.
FP: is the total number of customers incorrectly identified as churn.
TN: is the total number of customers correctly identified as no-churn.
FN: is the total number of customers incorrectly identified as no-churn.
Results of applying the cross validation in all models are shown in Table IX and Fig. 4.
TABLE VIII. WEIGHT MATRIX OF MLP
Hidden2.1 Hidden2.2 Hidden2.3 Hidden_2_4 Hidde 2_5 churn No_churn
Input_1 -3.657 2.147 -4.093 1.868 -7.117 0.000 0.000
Input_2 -1.407 0.719 -0.587 0.022 1.720 0.000 0.000
Input_3 -0.569 -0.261 0.400 0.251 1.524 0.000 0.000
Input_4 -2.200 -0.067 0.022 0.131 -3.674 0.000 0.000
Input_5 -1.604 -0.733 1.327 -0.493 -1.328 0.000 0.000
Input_6 -0.504 0.364 1.028 0.240 -0.250 0.000 0.000
Input_7 -1.149 -0.757 -0.723 -0.664 -2.153 0.000 0.000
Input_8 -0.675 -0.416 0.122 -0.116 -0.961 0.000 0.000
Input_9 -0.468 0.121 0.054 -0.175 -0.328 0.000 0.000
Input_10 -0.311 -1.649 0.176 -0.838 -0.053 0.000 0.000
Input_11 -0.056 -0.672 -1.017 3.285 -0.263 0.000 0.000
Input_12 -0.052 -0.412 0.369 0.649 -0.063 0.000 0.000
Input_13 0.857 -1.078 -1.965 -0.134 0.287 0.000 0.000
Hidden2_1 0.000 0.000 0.000 0.000 0.000 -0.426 0.411
Hidden2_2 0.000 0.000 0.000 0.000 0.000 -4.107 4.104
Hidden2_3 0.000 0.000 0.000 0.000 0.000 -3.332 3.326
Hidden2_4 0.000 0.000 0.000 0.000 0.000 -3.322 3.320
Hidden2_5 0.000 0.000 0.000 0.000 0.000 -5.024 5.036
TABLE IX. ACCURACY OF MODELS DURING 10 FOLDS
LR CART SVM Naïve KNN Adabost SGB RF LDA
0.856 0.901 0.940 0.865 0.904 0.961 0.940 0.949 0.841
0.874 0.886 0.922 0.871 0.895 0.961 0.931 0.946 0.862
0.844 0.880 0.904 0.865 0.898 0.943 0.890 0.946 0.832
0.862 0.889 0.919 0.865 0.901 0.946 0.945 0.964 0.868
0.874 0.904 0.937 0.871 0.916 0.964 0.946 0.964 0.868
0.856 0.865 0.922 0.883 0.874 0.949 0.930 0.946 0.859
0.859 0.874 0.919 0.865 0.886 0.934 0.931 0.931 0.850
0.859 0.862 0.940 0.874 0.895 0.955 0.925 0.952 0.850
0.865 0.853 0.934 0.865 0.883 0.955 0.955 0.949 0.856
0.868 0.880 0.925 0.880 0.898 0.958 0.916 0.955 0.853

(IJACSA) International Journal of Advanced Computer Science and Applications,
Vol. 9, No. 2, 2018
279 | P a g e
www.ijacsa.thesai.org
Fig. 4. 10-Fold accuracy of the selected models.
Fig. 5. Accuracy of the selected models.
Minimum and maximum accuracies for all of the selected models are summarized in Table X and Fig. 5. Results of the study show that ensemble based learning techniques (RF and AdaBoost) achieved the highest performance with approximately 96%. Both MLP and SVM can be recommended as well with 94% accuracy. DT achieved 90%, NB 88% and finally LR and LDA with accuracy 867% as shown in Fig. 5.
TABLE X. ACCURACY OF THE SELECTED MODELS
Model Min Max
Random forest 0.931138 0.963964
ADABoost 0.934132 0.963964
Multi-layer perceptron 0.93329 0.944
Stochastic Gradient Boosting 0. 8900000 0.9439552
Support Vector Machine 0.904192 0.94012
K-Nearest Neighbor 0.873874 0.915916
CART 0.852853 0.903904
Naïve Bayes 0.864865 0.882883
Logistic regression 0.844311 0.873874
LDA 0.832335 0.867868
V. CONCLUSION AND FUTURE WORK
This study tries to present a benchmark for the most widely used state of the arts for churn classification. The accuracy of the selected models was evaluated on a public dataset of customers in Telecom Company. Based on the findings of this study, ensemble – based learning techniques are recommended as both Random forest and Ad boost models gave the best accuracy. However, the study can be extended by including hybrid models and deep learning models. Other performance metrics can be used for performance evaluation. Timing measures of the models can also be a major indicator for performance. Models can also evaluate against different datasets from different domains.
75.00%
80.00%
85.00%
90.00%
95.00%
100.00%
Min Max

(IJACSA) International Journal of Advanced Computer Science and Applications,
Vol. 9, No. 2, 2018
280 | P a g e
www.ijacsa.thesai.org
REFERENCES
[1] Guha, Sudipto, and Nina Mishra. "Clustering data streams:- In Data Stream Management”. Springer Berlin Heidelberg, 2016.
[2] Brito, Pedro Quelhas, Carlos Soares, Sérgio Almeida, Ana Monte, and Michel Byvoet. "Customer segmentation in a large database of an online customized fashion business." Robotics and Computer-Integrated Manufacturing , Elsevier ,2015.
[3] Abolfazl Kazemi, Mohammad Esmaeil Babaei, “Modelling Customer Attraction Prediction in Customer Relation Management using Decision Tree: A Data Mining Approach”, journal of Optimization in Industrial Engineering , 2011.
[4] The Chartered Institute of Marketing, Cost of customer acquisition versus customer retention (2010).
[5] Colin Shaw, CEO, Beyond Philosophy, 15 Statistics That Should Change The Business World – But Haven't, Featured in: Customer Experience, June 4, 2013.
[6] Ramakrishna Vadakattu ; Bibek Panda ; Swarnim Narayan ; Harshal Godhia “ Enterprise subscription churn prediction” ,IEEE International Conference on Big Data (Big Data), 2015.
[7] Miguel A.P.M. Lejeune "Measuring the impact of data mining on churn management", Internet Research , Vol. 11 Issue: 5, pp.375-387,
[8] [8] [8] Jain S., Sharma N.K., Gupta S., Doohan N. (2018) Business .Strategy Prediction System for Market Basket Analysis. In: Kapur P., Kumar U., Verma A. (eds) Quality, IT and Business Operations. Springer Proceedings in Business and Economics. Springer, Singapore. 2017. DOI https://doi.org/10.1007/978-981-10-5577-5_8
[9] M. Kaur and S. Kang, “Market Basket Analysis: Identify the Changing Trends of Market Data Using Association Rule Mining,” Procedia Computer Science, vol. 85, pp. 78–85, 2016
[10] Berger, P.D. and Nasr, N.I. (1998), “Customer lifetime value: marketing models and applications”, Journal of Interactive Marketing, Vol. 12 No. 1, pp. 17‐29.
[11] Cheng, C.‐H. and Chen, Y.‐S. (2009), “Classifying the segmentation of customer value via RFM model and RS theory”, Expert Systems with Applications, Vol. 36 No. 3, pp. 4176‐4184.
[12] Huang, S.C., Chang, E.C. and Wu, H.H. (2009), “A case study of applying data mining techniques in an outfitter's customer value analysis”, Expert System Application, Vol. 36 No. 3, pp. 5909‐5915
[13] Nishant Saxena, ESCORT (Enterprise Services Cross-sell Optimization Using Rigorous Tests of Association), Advances in Economics and Business 5(5): 239-245, 2017
[14] Anita Prinzie , DirkVan den Poel, “Investigating purchasing-sequence patterns for financial services using Markov, MTD and MTDg models”. European Journal of Operational Research, 170, 710–734. 2006.
[15] Rahul J. Jadhav, Usharani T. Pawar, "Churn Prediction in Telecommunication Using Data Mining Technology", (IJACSA) International Journal of Advanced Computer Science and Applications, Vol. 2, No.2 , February 2011
[16] Amin A., Khan C., Ali I., Anwar S. "Customer Churn Prediction in Telecommunication Industry: With and without Counter-Example". In: Gelbukh A., Espinoza F.C., Galicia-Haro S.N. (eds) Nature-Inspired Computation and Machine-learning. MICAI 2014. Lecture Notes in Computer Science, vol 8857. Springer, Cham,2014.
[17] A. Keramatia, R.Jafari-Marandi, M.Aliannejadi, I.Ahmadian, M.Mozaffari, U.Abbasi, "Improved churn prediction in telecommunication industry using data mining techniques",Applied Soft Computing Volume 24,Pages 994-1012. 2014.
[18] Adnan Amin, Sajid Anwar, Awais Adnan, Muhammad Nawaz, Khalid Alawfi, Amir Hussain ,Kaizhu Huang, "Customer churn prediction in the telecommunication sector using a rough set approach", Neurocomputing Volume 237, Pages 242-254,2017.
[19] Ben lanHe , Yong Shi, Qian Wan, XiZhao, "Prediction of Customer Attrition of Commercial Banks based on SVM Model",2nd International Conference on Information Technology and Quantitative Management, ITQM, Procedia Computer Science Volume 31, Pages 423-430, 2014.
[20] Keramati, A., Ghaneei, H. & Mirmohammadi, "Developing a prediction model for customer churn from electronic banking services using data
mining", S.M. Financ Innov (2016) 2: 10. https://doi.org/10.1186/s40854-016-0029-6
[21] Alisa Bilal Zorić, "PREDICTING CUSTOMER CHURN IN BANKING INDUSTRY USING NEURAL NETWORKS", nterdisciplinary Description of Complex Systems 14(2), page:116-124, 2016
[22] M. Clemente, V. Giner-Bosch, and S. San Matías, “Assessing classification methods for churn prediction by composite indicators”, Dept. of Applied Statistics, OR & Quality,Universitat Politècnica de València, Camino de Vera s/n, 46022 Spain, 2010
[23] Anthony E. R. Sukow, Rebecca Grant, "Forecasting and the Role of Churn in Software-as-a-Service Business Models", iBusiness, Vol. 5 No. 1A, 2013, pp. 49-57.
[24] Yizhe Ge ; Shan He ; Jingyue Xiong ; Donald E. Brown, "Customer churn analysis for a software-as-a-service company", In the proceedings of Systems and Information Engineering Design Symposium (SIEDS), 2017
[25] Rahul J. Jadhav and Usharani T. Pawar. “Churn prediction in telecommunication using data mining technology” , (IJACSA) International Journal of Advanced Computer Science and Applications, Vol. 2, No.2, 2011.
[26] Andrew h. Karp, using logistic regression to predict customer retention, 1998.
[27] M.C. Mozer ; R. Wolniewicz ; D.B. Grimes ; E. Johnson ; H. Kaushansky. “Predicting Subscriber Dissatisfaction and Improving Retention in the Wireless Telecommunication Industry”. IEEE Transactions on Neural Networks, Volume: 11, Issue: 3, 2000.
[28] Afaq Alam Khan, Sanjay Jamwal, and M.M.Sepehri, Applying data mining to customer churn prediction in an Internet Service Provider”. International Journal of Computer Applications Volume 9–No.7,2010
[29] Guoxun Wang , Liang Liu, Yi Peng , Guangli Nie, Gang Kou, G., and Yong Shi. “Predicting credit card holder churn in banks of China using data mining and MCDM”. IEEE/WIC/ACM International Conference on Web Intelligence and Intelligent Agent Technology. 2010.
[30] Abbas Keramati, Seyed M.S. Ardabili, "Churn analysis for an Iranian mobile operator”. Telecommunications Policy Volume 35, Issue 4, Pages 344-356,2011.
[31] B.E.A. Oghojafor,G.C. Mesike, C.I. Omoera and R.D. Bakare, “Modelling telecom customer attrition using logistic regression”, African Journal of Marketing Management Vol. 4(3), pp. 110-117, 2012.
[32] Sebastian H. T, Wagh R. Churn Analysis in Telecommunication Using Logistic Regression. Orient.J. Comp. Sci. and Technol; Vol. 10, No. (1): Pgs. 207-212, 2017.
[33] Guangli Nieae, Wei Rowec Ling ling, Zhangab Yingjie, Tiana YongShi, “Credit card churn forecasting by logistic regression and decision tree”, Expert Systems with Applications Volume 38, Issue 12, November–December 2011
[34] Luo Bin ; Shao Peiji ; Liu Juan, “Customer churn prediction based on the decision tree in personal handyphone system service”. International Conference on Service Systems and Service Management, 2007.
[35] Coussement, K., Benoit, D. F., & Van den Poel, D. Improved marketing decision making in a customer churn prediction context using generalized additive models. Expert Systems with Applications, volume:37. No.3, pp:2132-2143. 2010.
[36] Michel Ballings, Dirk Van den Poel, “Customer event history for churn prediction : how long is long enough?”, Journal Expert Systems with Applications: An International Journal archive Volume 39 Issue 18, December, 2012 Pages 13517-13522
[37] Kristof Coussement, Dirk Van den Poel, “Churn prediction in subscription services: An application of support vector machines while comparing two parameter selection techniques”. Expert Systems with Applications, Volume 34, Issue 1, Pages 313-327, 2008.
[38] Hur Y., Lim S. Customer Churning Prediction Using Support Vector Machines in Online Auto Insurance Service. In: Wang J., Liao XF., Yi Z. (eds) Advances in Neural Networks . Lecture Notes in Computer Science, vol 3497. 2005.
[39] Jing Zhao. and Xing-hua Dang. Bank customer churn prediction based on support vector machine: Taking a commercial bank's VIP customer

(IJACSA) International Journal of Advanced Computer Science and Applications,
Vol. 9, No. 2, 2018
281 | P a g e
www.ijacsa.thesai.org
churn as the example” , the 4th International Conference on Wireless Communications, Networking and Mobile Computing, 2008.
[40] Stefan Lessmann, Stefan VoB, “A reference model for customer-centric data mining with support vector machines”. European Journal of Operational Research, volume 199, issue 2, pages:520-530,2009.
[41] Ali Dehghan, Theodore B. Trafalis, “Examining Churn and Loyalty Using Support Vector Machine”, Business and Management Research,Vol. 1, No. 4; 2012.
[42] Benlan He, Yong Shi, Qian Wan, Xi Zhao, “Prediction of customer attrition of commercial banks based on SVM model”, the 2nd International Conference on Information Technology and Quantitative Management, ITQM 2014.
[43] Lee, H., Lee, Y., Cho, H., Im, K., and Kim, Y. S. (2011). Mining churning behaviors and developing retention strategies based on a partial least squares (PLS) model. Decision Support Systems, 52(1):207{216.
[44] Huang, B., Kechadi, M. T., and Buckley, B. (2012). Customer churn prediction in telecommunications. Expert Systems with Applications, 39(1):1414-1425.
[45] Clement Kirui, Li Hong, Wilson Cheruiyot, and Hillary Kirui. “Predicting customer churn in mobile telephony industry using probabilistic classifiers in data mining”. JCSI International Journal of Computer Science Issues, Vol. 10, Issue 2, No 1, March 2013.
[46] Catalin CIMPOERU, Anca ANDREESCU , “Predicting Customers Churn in a Relational Database”, Informatica Economica vol. 18, no. 3/2014
[47] Bart Larivière, Dirk Van den Poel. Predicting customer retention and proftability by using random forests and regression forests techniques. Expert Systems with Applications, volume 29 issue 2, Pages:472-484, 2005.
[48] Yaya Xie, Xiu Li, E.W.T. Ngai, Weiyun Ying. “Customer churn prediction using improved balanced random forests”. Expert Systems with Applications, volume 36 issue 1, pages:5445–5449, 2009.
[49] Adnan Idris, Muhammad Rizwan, Asifullah Khan, “Churn prediction in telecom using Random Forest and PSO based data balancing in combination with various feature selection strategies” Computers & Electrical Engineering, volume 38 issue 6, 2012.
[50] Sadaf Nabavi, Shahram Jafar, Providing a Customer Churn Prediction Model Using Random Forest and Boosted Trees Techniques (Case Study: Solico Food Industries Group, Journal of Basic and Applied Scientific Research, volume 3, issue 6, pages:1018-1026, 2013
[51] Ionut B. Brandusoiu Gavril Toderean, Predicting Churn In Mobile Telecommunications Industry", Acta Technica Napocensis Electronics and Telecommunications, Volume 54, Number 3, 2013.
[52] Rosenblatt, Frank. x. Principles of Neurodynamics: Perceptrons and the Theory of Brain ] Mechanisms. Spartan Books, Washington DC, 1961
[53] Rumelhart, David E., Geoffrey E. Hinton, and R. J. Williams. "Learning Internal Representations by Error Propagation". David E. Rumelhart, James L. McClelland, and the PDP research group. (editors), Parallel distributed processing: Explorations in the microstructure of cognition, Volume 1: Foundation. MIT Press, 1986.
[54] Hwang H., Jung T., Suh E.: An LTV model and customer segmentation based on customer value: a case study on the wireless telecommunication industry. Expert Systems with Applications 26 (2004) 181-188.
[55] Ferreira J., Vellasco M., Pachecco M., Barbosa C.: Data mining techniques on the evaluation of wireless churn. ESANN2004 proceedings – European Symposium on Artificial Neural Networks Bruges (2004). ISBN 2-930307-04-8, p 483-488.
[56] Schapire R.E. Explaining AdaBoost. In: Schölkopf B., Luo Z., Vovk V. (eds) Empirical Inference. Springer, Berlin, Heidelberg, 2013.
[57] Jerome Friedman, "Greedy Function Approximation: A Gradient Boosting Machine", The Annals of Statistics, 29(5), 2001, 1189-1232.
[58] Shao Jinbol, Li Xiu, Liu Wenhuang, “The application of AdaBoost in customer churn prediction. In the proceedings of the international Conference on Service Systems and Service Management 2007.
[59] Adnan Idris, Asifullah Khan, yeon soo Lee, “Genetic programming and adaboosting based churn prediction for telecom. In the proceedings of IEEE International Conference on Systems, Man, and Cybernetics (SMC), pp. 1328–1332, 2012.
[60] Wu ; Sufang Meng, “E-commerce customer churn prediction based on improved SMOTE and AdaBoost”, In the proceedings of the 13th international conference on Service Systems and Service Management (ICSSSM), 2016.
[61] Lemmens, Aurelie and Gupta, Sunil, “Managing Churn to Maximize Profits” (May 8, 2017). http://dx.doi.org/10.2139/ssrn.2964906
[62] Gerald Fahner , Stochastic Gradient Boosting Approach to Daily Attrition Scoring Based on High-dimensional RFM Features”2015 Fair Isaac Corporation. Confidential.
[63] Yaya Xie ; Xiu Li, “Churn prediction with Linear Discriminant Boosting algorithm “, International Conference on Machine-learning and Cybernetics, , 2008
[64] A.Keramatia, R.Jafari-Marandia, M.Aliannejadib, I.Ahmadianc, M.Mozaffaria, U.Abbasiad, "Improved churn prediction in telecommunication industry using data mining techniques", Applied Soft Computing Volume 24, Pages 994-1012,2014 .
[65] Naveen Kumar Rai,Vikas Srivastava, Rahul Kumar, “Churn Prediction Model Using Linear Discriminant Analysis (LDA)”, IOSR Journal of Computer Engineering (IOSR-JCE), Volume 18, Issue 5,PP 86-93, 2016.
[66] Tom Au, Shaomin Li, Guangqin Ma. Applying and Evaluating Models to Predict Customer Attrition Using Data Mining Techniques”. Journal of Comparative International Management, Vol. 6, No. 1, 10-22, 2003.
[67] T. Vafeiadisa, K. I. Diamantarasb, G. Sarigiannidisa, K. Ch. Chatzisavvasa, A comparison of machine-learning techniques for customer churn prediction” Simulation Modelling Practice and Theory, 2015.
[68] Samira Khodabandehlou, Mahmoud Zivari Rahman, "Comparison of supervised machine-learning techniques for customer churn prediction based on analysis of customer behavior", Journal of Systems and Information Technology, Vol. 19 Issue: 1/2, pp.65-93, https://doi.org/10.1108/, 2017.
[69] Anoop D Shah, Jonathan W Bartlett, James Carpenter, Owen Nicholas, and Harry Hemingway. “Comparison of Random Forest and Parametric Imputation Models for Imputing Missing Data Using MICE: A CALIBER Study”. American Journal of Epidemiology , 179(6):764–774, 2014.
[70] Munevver Mine Subasia, Ersoy Subasib, Martin Anthony, Peter L.Hammer, "A new imputation method for incomplete binary data", Discrete Applied Mathematics Volume 159, Issue 10, 2011.
[71] Breiman,L. “Random Forests”, Machine-learning Volume 45, Issue 1, pp 5–32, 2001.
[72] Miron B. Kursa, Aleksander Jankowski, Witold R. Rudnicki, "Boruta – A System for Feature Selection", Fundamental Informaticae volume101, pages:271–285, 2010.
[73] M. Pardo, G. Sberveglieri, “Classification of electronic nose data with support vector machines”, Sens. Actuators B: Chem. 107 (2005) 730–737.