m3 water sample collection methods - university of...
TRANSCRIPT
R. Pitt January 4, 2007
Module 3: Water Sample Collection Methods General Considerations for Sample Collection.............................................................................................1
Basic Safety Considerations when Sampling ............................................................................................................1 Selecting the Sampling Locations .............................................................................................................................2 Volumes to be Collected, Container Types, Preservatives to be used, and Shipping of Samples .............................3
Sample Volumes....................................................................................................................................................5 Sample Containers .................................................................................................................................................6 Cleaning Sample Bottles........................................................................................................................................7 Field Processing of Samples and Preparation for Shipping ...................................................................................8 Shipping Samples ..................................................................................................................................................9 Chain-of-Custody and other Documentation .........................................................................................................9 Sample Preservation and Storage at the Laboratory ............................................................................................10
Personnel Requirements ..........................................................................................................................................10 Receiving Water and Discharge Sampling .................................................................................................11
Automatic Water Sampling Equipment ...................................................................................................................11 Required Sample Line Velocities to Minimize Particle Sampling Errors............................................................18 Programming an Automatic Sampler...................................................................................................................18 Automatic Sampler Initiation and the use of Telemetry to Signal or Query Sampler Conditions .......................23
Manual Sampling Procedures ..................................................................................................................................24 Dipper Samplers ..................................................................................................................................................24 Depth-Integrated Samplers for Suspended Sediment ..........................................................................................25 Bed-Load Samplers .............................................................................................................................................26 Floatable Litter Sampling ....................................................................................................................................27
References..................................................................................................................................................28 General Considerations for Sample Collection This module summarizes some of the most important issues associated with sample collection. A more detailed discussion is presented by Burton and Pitt (2002). Basic Safety Considerations when Sampling The most important factor when conducting a field monitoring program is personnel safety. If an adequate program cannot be carried out in a reasonably safe manner, then an alternative to the monitoring program should be used. Most of the hazards reflect site selection and sampling times. The use of automatic samplers and well trained crews (more than one person in the field!) will reduce many of the hazards. Sampling may expose field personnel to hazardous conditions. Obviously, water hazards (high flows, deep pools, soft sediments, etc.) are usually of initial concern. In some studies, sampling during rainy weather in streams that may undergo rapid velocity and depth changes is necessary. Great care must be taken when approaching a stream in wet weather, as steep and slippery banks may cause sliding into the water. Always sample in pairs and have adequate safety equipment available. At a minimum, this will include: • throw rope • inflatable life vests
• nylon covered neoprene waders (that offer some floatation, even when swamped) • 2-way radio or cellular phone • weather radio If the conditions warrant (such as with steep and slippery stream banks), the sampler personnel should be tied together, with an attachment to a rigid shore object. In all cases, only go into the stream if absolutely necessary. Try to collect all samples from shore, especially if during heavy rains. Be extremely cautious of changing weather and stream conditions and cancel sampling when hazardous conditions warrant. Never enter a stream where footing is unstable or if the water is too deep (probably more than 2 feet deep) or fast (probably more than 2.5 ft/sec). Always enter the water cautiously and be prepared to make an efficient retreat if insecure. Other hazardous conditions may also occur when working near urban streams. Sharp debris in the water and along streams require protective waders be worn at all times while in the stream. No one should enter the water bare-footed. Poison ivy, poison oak, and ticks thrive along many stream banks, requiring long pants and shirts. When in the field during sunny weather, sun screen and a hat are also necessities. In many parts of the country, especially in the south, special caution is also required concerning snakes. Water moccasins are very common and coral snakes and copperheads may also be present along streams. Again, waders offer some protection, but be careful when moving through thick underbrush where visibility is limited. These cautions are necessary and are basically common sense. However, the greatest dangers associated with field sampling, especially in urban areas, are likely associated with loose running dogs, weird people, automobiles/trucks, and eating greasy fast food (dangers which are not restricted to stream sampling). Selecting the Sampling Locations Specific sampling locations are determined based on the objectives of the study and site specific conditions. Obviously, safety is a prime consideration, along with statistical requirements expressed in the experimental design. In all cases, the sample must represent the conditions being characterized. The process of selecting a sampling site is often given minimal thought when designing an assessment study. Site selections are driven by two basic criteria: accessibility/safety and upstream-downstream locations of pollutant discharges. Channel, flow, and stratification characteristics are particularly important when locating sample sites in streams, rivers, lakes and reservoirs. Sampling near shore is seldom satisfactory except in small, upper reach streams. Whether using a random or systematic approach, one should carefully note the channel, flow, or stratification (lakes and reservoirs) conditions. In reservoirs it is common for the principal flow to follow the old river channel and at a depth similar to the temperature (density) of the feeder stream. This area thus often contains the highest pollutant concentrations (e.g., suspended solids, fecal pathogens). Depositional zones, such as river bends and mouths, pools, and impoundment structures, should be sampled for sediment contamination and toxicity. As noted previously, paired analyses are the most efficient sampling strategy. This can be simply sampling the influent and effluent of a control structure, outfalls of test and control watersheds, comparable stream habitats in test and control streams, or even the same stream sampling location, but at different seasons. Paired sampling can eliminate much variability, as many influencing factors are assumed to remain constant, enabling effects to be more easily seen. Obviously, if the expected differences are expected to be large between the two elements in the pair, and the background random variability is small, many fewer sampling pairs are needed to identify a statistically significant difference in the observations. Great care must be taken to select correct pairs, as the random variability can easily be greater than expected. One example of likely inefficient paired sampling is sampling above and below an outfall in a stream. In almost all cases, the stream pollutant loads and flows are much greater than a single outfall discharge. Therefore, the differences expected in stream water quality upstream versus downstream of an outfall would be very small and very difficult to detect. Exceptions may occur with large point source outfalls discharging during very low flow conditions. Otherwise, one large number is basically subtracted from another large number (with both having a certain amount of uncertainty) to determine the effects of a relatively small discharge. If this sampling strategy needs to be employed, make sure that the outfall discharge is also well characterized.
The actual location of sampling is somewhat dependent on the type of sampler to be used. However, in all cases, the sample taken must be representative of the flow to be characterized. Permanently mounted automatic or semi-automatic samplers are most restricted in their placement, as security and better access is needed than with manual grab sampling. With manual sampling, less equipment is generally being carried to the sampling location (some type of manual dipper sampler, plus sample bottles, for example), while automatic samplers require a relatively large sample container, a multi-bottle sampler base, and batteries and other maintenance and cleaning supplies to be periodically carried to the sampler. Weekly visits to automatic samplers, at least, are typically needed for maintenance. In all cases, access during rains must be provided to all stormwater sampler locations. Manual stormwater sampling takes place during the rains, of course, while automatic samplers may need to have their bottles switched during rains, or other checks made. Therefore, dangerous locations, such as requiring steep ascents down clayey stream banks must obviously be avoided, for example. Obviously, care must also be used to locate the sampler intakes to minimize induced scour of sediments and to prevent clogging from debris. All submerged pumps can quickly fail if the pump draws coarse particles into the pump, but doesn’t have enough velocity in the sample line to discharge most of them completely through the sample line. If the intake is located on a creek bottom, the water entering the sampler intake will likely scour sediment from the surrounding area. Locating the sampler intake on top of a small anchored concrete slab in the creek will minimize scour. Elevating the sampler intake above the creek bottom will also minimize scour, but would present an obstruction to flows and would easily catch debris. Elevating the intake slightly would be important to obtain a better sample if the flow is vertically stratified. In some cases, sampler intakes can be successfully located on the downstream side of a bridge piling or pier. Do not locate the sample intake near any treated wood structure if heavy metals or organics are to be sampled. Locating a sampler intake in an outfall pipe presents other problems. Because the pipe is likely to be smaller than a receiving water, horizontal differences in water quality should not be a problem. However, vertical differences may occur. The sampler intake also presents a greater obstruction to the pipe flow and therefore has a greater tendency to catch debris. To ensure a well-mixed water sample, the intake should be placed in an area that has turbulent flow. This may decrease volatile components in the water sample, but typical automatic samplers are inappropriate for collecting samples for volatile analyses anyway. Locating the intake on the downstream side of a flow monitoring flume would help obtain a mixed sample. In addition, added obstructions (bricks and concrete blocks) can be cemented to the pipe above the sampling location to induce well-mixed conditions during low to moderate flows. Obviously, flow measurements would not be taken where obstructions are used to mix the flow. Manual sampling is much more flexible and can be modified to better represent the flow conditions at the time of sampling. Obviously, multiple dips across a stream, and at multiple depths will result in a better representation of the stream than a single sampling location. Special manual samplers are needed to collect depth-integrated samples that may be needed for sediment transport studies. The advantages of manual sampling compared to automatic sampling are off-set by the time frame that is represented in the sample. A grab sample taken at a single time will not be as representative of a storm event as an automatic sampler taking sub-samples from many time periods during the event, even considering multiple versus single sampling points. A single sampling location will be subjected to varying conditions during the storm, including variable horizontal and vertical variations. However, if a single sampling location is consistently biased compared to the cross-section of the stream, then that needs to be recognized and corrected. Therefore, it is necessary to observe conditions in the stream during the sampling times as much as possible to detect any potential bias. A bias may be caused by currents or nearby discharges, for example, and may be visually observed if colored or turbid water is indicating current conditions near the sampler. Volumes to be Collected, Container Types, Preservatives to be used, and Shipping of Samples The specific sample volume, bottle type, and preservative requirements will be specified by the analytical laboratory used. Standard Methods for the Examination of Water and Wastewater lists the basic container requirements, minimum sample sizes, required preservative, and the maximum storage period before the analyses need to be conducted. Table 1 shows these guidelines for water samples. Care must be taken to handle the samples properly to
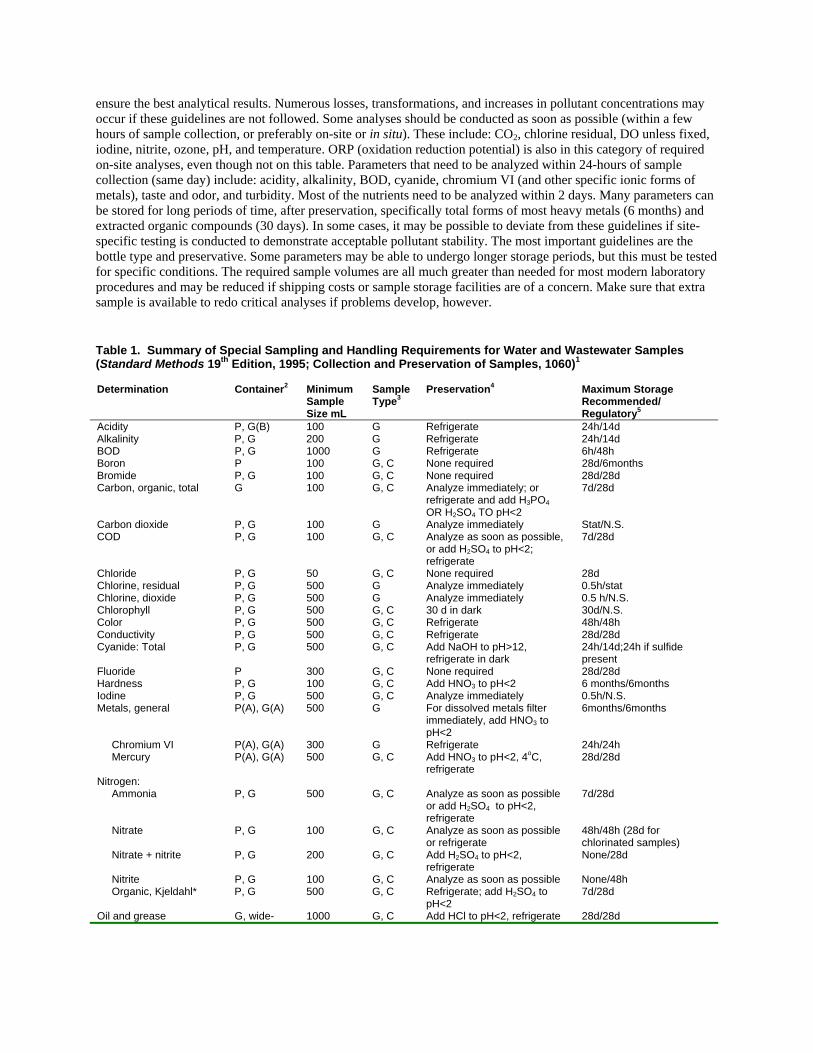
ensure the best analytical results. Numerous losses, transformations, and increases in pollutant concentrations may occur if these guidelines are not followed. Some analyses should be conducted as soon as possible (within a few hours of sample collection, or preferably on-site or in situ). These include: CO2, chlorine residual, DO unless fixed, iodine, nitrite, ozone, pH, and temperature. ORP (oxidation reduction potential) is also in this category of required on-site analyses, even though not on this table. Parameters that need to be analyzed within 24-hours of sample collection (same day) include: acidity, alkalinity, BOD, cyanide, chromium VI (and other specific ionic forms of metals), taste and odor, and turbidity. Most of the nutrients need to be analyzed within 2 days. Many parameters can be stored for long periods of time, after preservation, specifically total forms of most heavy metals (6 months) and extracted organic compounds (30 days). In some cases, it may be possible to deviate from these guidelines if site-specific testing is conducted to demonstrate acceptable pollutant stability. The most important guidelines are the bottle type and preservative. Some parameters may be able to undergo longer storage periods, but this must be tested for specific conditions. The required sample volumes are all much greater than needed for most modern laboratory procedures and may be reduced if shipping costs or sample storage facilities are of a concern. Make sure that extra sample is available to redo critical analyses if problems develop, however. Table 1. Summary of Special Sampling and Handling Requirements for Water and Wastewater Samples (Standard Methods 19th Edition, 1995; Collection and Preservation of Samples, 1060)1 Determination Container2 Minimum
Sample Size mL
Sample Type3
Preservation4 Maximum Storage Recommended/ Regulatory5
Acidity P, G(B) 100 G Refrigerate 24h/14d Alkalinity P, G 200 G Refrigerate 24h/14d BOD P, G 1000 G Refrigerate 6h/48h Boron P 100 G, C None required 28d/6months Bromide P, G 100 G, C None required 28d/28d Carbon, organic, total G 100 G, C Analyze immediately; or
refrigerate and add H3PO4 OR H2SO4 TO pH<2
7d/28d
Carbon dioxide P, G 100 G Analyze immediately Stat/N.S. COD P, G 100 G, C Analyze as soon as possible,
or add H2SO4 to pH<2; refrigerate
7d/28d
Chloride P, G 50 G, C None required 28d Chlorine, residual P, G 500 G Analyze immediately 0.5h/stat Chlorine, dioxide P, G 500 G Analyze immediately 0.5 h/N.S. Chlorophyll P, G 500 G, C 30 d in dark 30d/N.S. Color P, G 500 G, C Refrigerate 48h/48h Conductivity P, G 500 G, C Refrigerate 28d/28d Cyanide: Total P, G 500 G, C Add NaOH to pH>12,
refrigerate in dark 24h/14d;24h if sulfide present
Fluoride P 300 G, C None required 28d/28d Hardness P, G 100 G, C Add HNO3 to pH<2 6 months/6months Iodine P, G 500 G, C Analyze immediately 0.5h/N.S. Metals, general P(A), G(A) 500 G For dissolved metals filter
immediately, add HNO3 to pH<2
6months/6months
Chromium VI P(A), G(A) 300 G Refrigerate 24h/24h Mercury P(A), G(A) 500 G, C Add HNO3 to pH<2, 4oC,
refrigerate 28d/28d
Nitrogen: Ammonia
P, G
500
G, C
Analyze as soon as possible or add H2SO4 to pH<2, refrigerate
7d/28d
Nitrate P, G 100 G, C Analyze as soon as possible or refrigerate
48h/48h (28d for chlorinated samples)
Nitrate + nitrite P, G 200 G, C Add H2SO4 to pH<2, refrigerate
None/28d
Nitrite P, G 100 G, C Analyze as soon as possible None/48h Organic, Kjeldahl* P, G 500 G, C Refrigerate; add H2SO4 to
pH<2 7d/28d
Oil and grease G, wide- 1000 G, C Add HCl to pH<2, refrigerate 28d/28d
mouth calibrated
Organic compounds: 200 MBAS P, G 250 G, C Refrigerate 48h Pesticides* G(S), TFE-
lined cap 1000 G, C Refrigerate; add 1000 mg
ascorbic acid/L if residual chlorine present
7d/7d until extraction 40d after extraction
Phenols P, G 500 G, C Refrigerate add H2SO4 to pH<2
*/28d
Purgeables* by purge and trap
G, TFE-lined cap
2x40 G Refrigerate; add HCl to pH<2; add 1000 mg ascorbic acid/L if residual chlorine present
7d/14d
Oxygen, dissolved: Electrode
G, BOD bottle
300 G Analyze immediately
0.5h/stat
Winkler Titration may be delayed after acidification
8h/8h
Ozone G 1000 G Analyze immediately 0.5h/N.S. pH P, G 50 G Analyze immediately 2h/stat Phosphate G(A) 100 G For dissolved phosphate filter
immediately; refrigerate 48h/N.S.
Salinity G, wax seal 240 G Analyze immediately or use wax seal
6 months/N.S.
Silica P 200 G, C Refrigerate, do not freeze 28d/28d Solids P, G 200 G, C Refrigerate 7d/2-7d Sulfate P, G 100 G, C Refrigerate 28 /28d Sulfide P, G 100 G, C Refrigerate; add 4 drops 2N
zinc acetate/100 mL; add NaOH TO pH>9
28d/7d
Temperature P, G - G Analyze immediately Stat/stat Turbidity P, G 100 G, C Analyze same day; store in
dark up to 24 h, refrigerate 24/h48h
1 See Standard Methods for additional details. For determination not listed, use glass or plastic containers; preferably refrigerate during storage and analyze as soon as possible. 2 P = plastic (polyethylene or equivalent); G = glass; G (A) or P(A) = rinsed with 1 + 1 HNO; G(B) = glass, borosilicate; G(S) = glass, rinsed with organic solvents or baked. 3 G = grab; C = composite 4 Refrigerate = storage at 4o C, in the dark. 5 Environmental Protection Agency, Rules and Regulation, 40 CFR Parts 100-149, July 1, 1992. See this citation for possible differences regarding container and preservation requirements. N.S. = not stated in cited reference; stat = no storage allowed; analyze immediately. Sample Volumes The volume of water or sediment needed is dependent on the types of toxicity assays, physical and chemical analyses, and level of precision (replicate numbers) needed. Usually one to two liters is adequate for physical and chemical analyses. The following example for determining the water volume needed for laboratory analyses is based on the requirements of a specialized in-house laboratory where shipping costs resulted in the development of analytical methods using minimal amounts of sample. It is important to work with the laboratory to determine their specific sample volume needs. Table 2 summarizes the sample quantities collected for each set of analysis. Also shown on this table is whether the sample is filtered or unfiltered (for constituent partitioning analyses). As an example, the metallic and organic toxicants are analyzed in both unfiltered and filtered sample portions in order to determine the amount of the pollutants associated with particulates and the amount that are considered “soluble.” Filtering is through 0.45 µm membrane filters (using all-glass filtering apparatus and membrane filters that are found to have minimal affects on constituent concentrations). The sample volumes that needs to be delivered to the laboratory (where further filtering, splitting, and chemical preservation will be performed) and the required containers are as follows:
• three 500 mL amber glass containers with Teflon lined screw caps • three 500 mL HDPE (high density polyethylene) plastic containers with screw caps
A total of 3 L of each water sample is therefore needed for comprehensive analyses. In addition to the water samples, collected sediment needs to be shipped in the following sample bottles:
• one 500 mL amber glass wide mouth container with Teflon lined screw cap • one 500 mL HDPE (high density polyethylene) wide mouth plastic container
Table 2. Example Water Volume Requirements for Different Analytes Constituent
Volume (mL) Filtered? Unfiltered?
total solids 100 mL yes dissolved solids 100 mL yes turbidity 30 mL yes yes particle size (by Coulter Counter MultiSizer IIe) 20 mL yes conductivity 70 mL yes pH (also on-site or in situ) 25 mL yes color 25 mL yes hardness 100 mL yes alkalinity 50 mL yes anions (F-, Cl-, NO2
-, NO32-, SO4
2-, and PO42-) 25 mL yes
cations (Li+, Na+, NH4+, K+, Ca2+, and Mg2+) 25 mL yes
COD 10 mL yes yes metals (Pb, Cr, Cd, Cu, and Zn) 70 mL yes yes semi-volatile compounds (by GC/MSD) 315 mL yes yes pesticides (by GC/ECD) 315 mL yes yes Microtox™ toxicity screen 10 mL yes yes
The following list shows the amounts of sediment sample generally required for different chemical and physical analyses:
Inorganic chemicals 90-1000 mL Organic chemicals 50-2000 mL TOC, Moisture 100-300 mL Particle size 230 - 500 mL Petroleum hydrocarbons (semi-volatile compounds) 250-1000mL
Sample Containers Aqueous samples for toxicity testing may be collected and shipped in plastic containers, e g., Cubitainers®. Dark borosilicate glass with Teflon® lined caps are recommended for samples to be used for organics analyses. High density polyethylene containers are needed when metals are to be analyzed. Metals can sorb to glass and also new glassware may have zinc contaminants. Polyethylene is not recommended when samples are contaminated with oil, grease, or creosote. Wide-mouth containers made of either Teflon or high-density polyethylene, with Teflon-lined or polypropylene screw caps, are available in a variety of sizes from any scientific supply company and are considered the optimal all-purpose choice for sediment samples collected for both chemical and toxicity testing. Wide-mouth, screw-capped containers made of clear or amber borosilicate glass are also suitable for most types of analyses, with the notable exception of sediment metals, where polyethylene or Teflon is preferred. In addition, if a sediment or porewater sample is to be analyzed for organic contaminants, then amber glass bottles are recommended over plastic. It should be noted that glass containers have several disadvantages, such as greater weight and volume and susceptiblity to breakage, particularly when they are filled with sediment and frozen. Plastic bags made of high-density polyethylene can also be used for storing wet or dry sediment samples for certain end uses. Generally, when the end use of the sample is known, Standard Methods should be consulted for specific recommendations regarding type of container, volume and storage times.
Pre-cleaned sample containers can be obtained from I-Chem (through Fisher Scientific at 800-766-7000), or Eagle Picher (at 800-331-7425). Fisher’s catalog numbers and prices are as follows: I-Chem # Fisher # Approx. Cost Description 241 -0500 05-719-74 $35/case of 12 wide mouth amber 0.5 L glass jars with Teflon™-lined lids and labels 311 -0500 05-719-242 $68/case of 24 wide mouth 0.5 L HDPE jars with Teflon™-lined lids and labels Eagle Picher sample containers are as follows: 122- 16A case of 12 - $25 wide mouth amber 0.5 L glass jars with Teflon™-lined lids 151500WWM case of 24 - $46 wide mouth 0.5 L HDPE jar with Teflon™-lined lids Cleaning Sample Bottles ASTM (1996) has listed bottle cleaning/conditioning requirements in standard D 3370. New glass bottles (unless purchased pre-cleaned) must be preconditioned before use by filling with water for several days. This conditioning time can be shortened by using a dilute solution of HCl. They also point out that polyethylene is the only suitable material for sample containers when low concentrations of hardness, silica, sodium, or potassium are to be determined (in conflict with the above recommendation that warned of using polyethylene for samples containing creosote, oils or greases). All sample containers must also be sealed with Teflon™ (preferred) or aluminum lined caps. The bottles must be washed using a similar protocol as described below for the sampling equipment. ASTM (1996), in standard E 1391, also recommended more stringent preconditioning of sample containers before their first use in critical toxicological testing, as noted above (7 day leaching using a 1:1 solution of HCl and deionized water and than another 7 days in a 1:1 solution of HNO3 in deionized water for plastics. Overnight soaking in these solutions was found to be adequate for glassware. Again, take care and test for damage before soaking equipment in strong acid solutions). Minimum cleaning would include cleaning the samplers, including sampling lines, with domestic tap water immediately after sample retrieval. Components that can be taken to the laboratory (such as the containers in the automatic samplers) are washed using warm tap water and laboratory detergent (phosphate free), rinsed with tap, then distilled, and finally laboratory grade (18 megohm) water. ASTM (1996) presents standard D 5088-90 covering the cleaning of sampling equipment and sample bottles. They recommend a series of washings, depending on the analyses to be performed. The first wash is with a phosphate-free detergent solution (with a scrub brush, if possible), followed by a rinse of clean (known characteristics) water, such as tap water. If inorganic analyses are to be performed (especially trace heavy metals), then the sample contacting components of the equipment and the sample bottles need to be rinsed with a 10% solution of reagent grade nitric or hydrochloric acid and deionized water. The equipment is rinsed again. If organic analyses are to be performed (especially trace organic compounds by GC/MSD), then the sample contacting components of the equipment and sample bottles need to be rinsed with pesticide grade isopropanol alcohol, acetone, or methanol. The equipment and bottles are then rinsed with deionized water and allowed to air dry. The cleaned equipment needs to be wrapped with suitable inert material (such as aluminum foil or plastic wrap) for storage and transport. If sample components cannot be reached with a brush, such as tubing, the cleaning solutions need to be recirculated through the equipment. Be careful of potentially explosive conditions when using alcohol or acetone. Intrinsically save sampling equipment that does not produce sparking with electronic contacts or from motors, or friction heat, should be used whenever
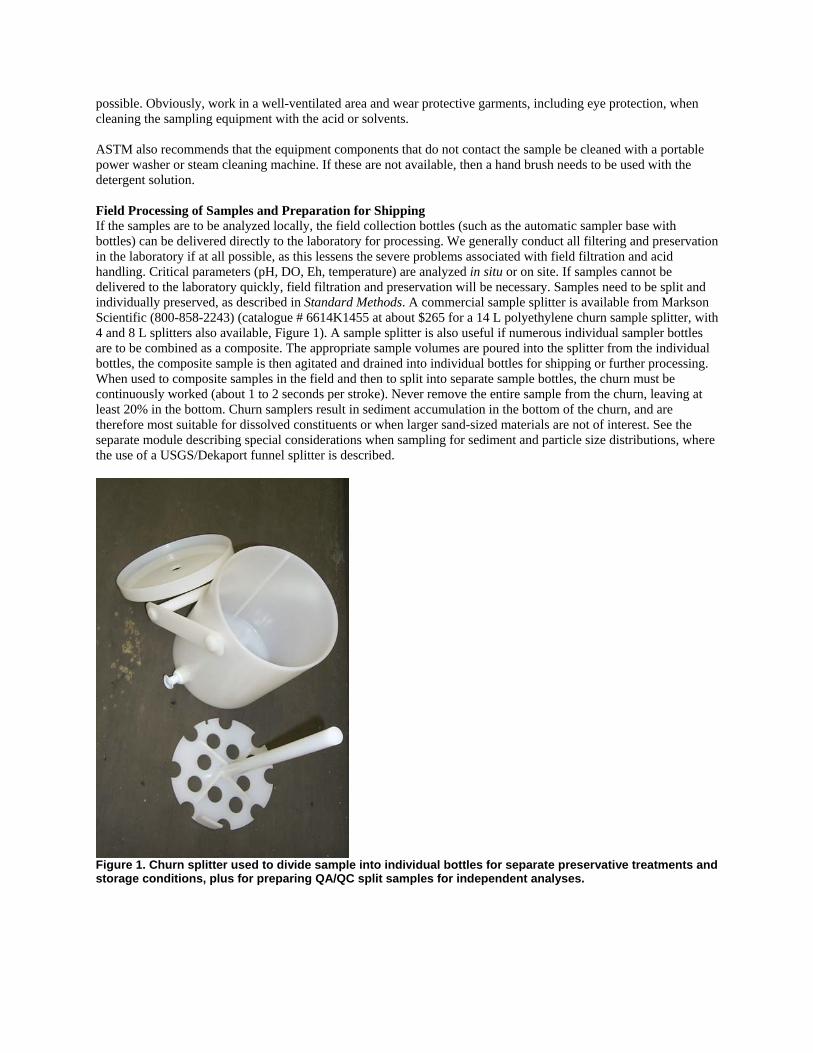
possible. Obviously, work in a well-ventilated area and wear protective garments, including eye protection, when cleaning the sampling equipment with the acid or solvents. ASTM also recommends that the equipment components that do not contact the sample be cleaned with a portable power washer or steam cleaning machine. If these are not available, then a hand brush needs to be used with the detergent solution. Field Processing of Samples and Preparation for Shipping If the samples are to be analyzed locally, the field collection bottles (such as the automatic sampler base with bottles) can be delivered directly to the laboratory for processing. We generally conduct all filtering and preservation in the laboratory if at all possible, as this lessens the severe problems associated with field filtration and acid handling. Critical parameters (pH, DO, Eh, temperature) are analyzed in situ or on site. If samples cannot be delivered to the laboratory quickly, field filtration and preservation will be necessary. Samples need to be split and individually preserved, as described in Standard Methods. A commercial sample splitter is available from Markson Scientific (800-858-2243) (catalogue # 6614K1455 at about $265 for a 14 L polyethylene churn sample splitter, with 4 and 8 L splitters also available, Figure 1). A sample splitter is also useful if numerous individual sampler bottles are to be combined as a composite. The appropriate sample volumes are poured into the splitter from the individual bottles, the composite sample is then agitated and drained into individual bottles for shipping or further processing. When used to composite samples in the field and then to split into separate sample bottles, the churn must be continuously worked (about 1 to 2 seconds per stroke). Never remove the entire sample from the churn, leaving at least 20% in the bottom. Churn samplers result in sediment accumulation in the bottom of the churn, and are therefore most suitable for dissolved constituents or when larger sand-sized materials are not of interest. See the separate module describing special considerations when sampling for sediment and particle size distributions, where the use of a USGS/Dekaport funnel splitter is described.
Figure 1. Churn splitter used to divide sample into individual bottles for separate preservative treatments and storage conditions, plus for preparing QA/QC split samples for independent analyses.
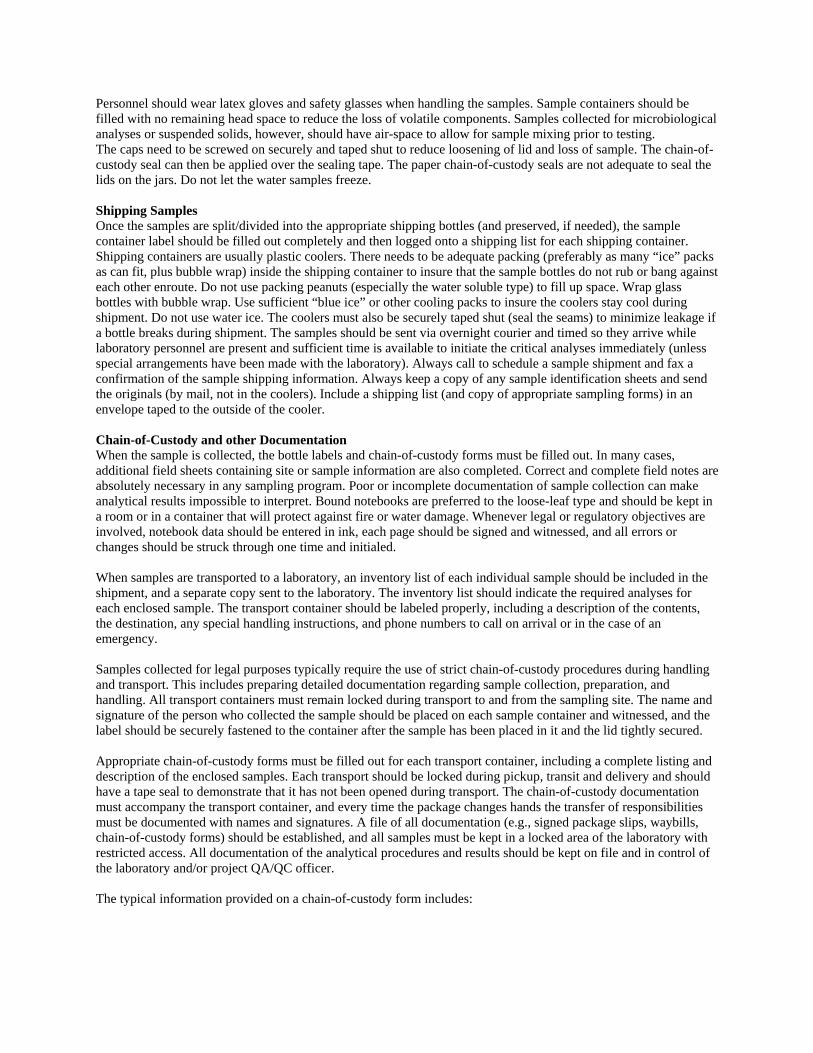
Personnel should wear latex gloves and safety glasses when handling the samples. Sample containers should be filled with no remaining head space to reduce the loss of volatile components. Samples collected for microbiological analyses or suspended solids, however, should have air-space to allow for sample mixing prior to testing. The caps need to be screwed on securely and taped shut to reduce loosening of lid and loss of sample. The chain-of-custody seal can then be applied over the sealing tape. The paper chain-of-custody seals are not adequate to seal the lids on the jars. Do not let the water samples freeze. Shipping Samples Once the samples are split/divided into the appropriate shipping bottles (and preserved, if needed), the sample container label should be filled out completely and then logged onto a shipping list for each shipping container. Shipping containers are usually plastic coolers. There needs to be adequate packing (preferably as many “ice” packs as can fit, plus bubble wrap) inside the shipping container to insure that the sample bottles do not rub or bang against each other enroute. Do not use packing peanuts (especially the water soluble type) to fill up space. Wrap glass bottles with bubble wrap. Use sufficient “blue ice” or other cooling packs to insure the coolers stay cool during shipment. Do not use water ice. The coolers must also be securely taped shut (seal the seams) to minimize leakage if a bottle breaks during shipment. The samples should be sent via overnight courier and timed so they arrive while laboratory personnel are present and sufficient time is available to initiate the critical analyses immediately (unless special arrangements have been made with the laboratory). Always call to schedule a sample shipment and fax a confirmation of the sample shipping information. Always keep a copy of any sample identification sheets and send the originals (by mail, not in the coolers). Include a shipping list (and copy of appropriate sampling forms) in an envelope taped to the outside of the cooler. Chain-of-Custody and other Documentation When the sample is collected, the bottle labels and chain-of-custody forms must be filled out. In many cases, additional field sheets containing site or sample information are also completed. Correct and complete field notes are absolutely necessary in any sampling program. Poor or incomplete documentation of sample collection can make analytical results impossible to interpret. Bound notebooks are preferred to the loose-leaf type and should be kept in a room or in a container that will protect against fire or water damage. Whenever legal or regulatory objectives are involved, notebook data should be entered in ink, each page should be signed and witnessed, and all errors or changes should be struck through one time and initialed. When samples are transported to a laboratory, an inventory list of each individual sample should be included in the shipment, and a separate copy sent to the laboratory. The inventory list should indicate the required analyses for each enclosed sample. The transport container should be labeled properly, including a description of the contents, the destination, any special handling instructions, and phone numbers to call on arrival or in the case of an emergency. Samples collected for legal purposes typically require the use of strict chain-of-custody procedures during handling and transport. This includes preparing detailed documentation regarding sample collection, preparation, and handling. All transport containers must remain locked during transport to and from the sampling site. The name and signature of the person who collected the sample should be placed on each sample container and witnessed, and the label should be securely fastened to the container after the sample has been placed in it and the lid tightly secured. Appropriate chain-of-custody forms must be filled out for each transport container, including a complete listing and description of the enclosed samples. Each transport should be locked during pickup, transit and delivery and should have a tape seal to demonstrate that it has not been opened during transport. The chain-of-custody documentation must accompany the transport container, and every time the package changes hands the transfer of responsibilities must be documented with names and signatures. A file of all documentation (e.g., signed package slips, waybills, chain-of-custody forms) should be established, and all samples must be kept in a locked area of the laboratory with restricted access. All documentation of the analytical procedures and results should be kept on file and in control of the laboratory and/or project QA/QC officer. The typical information provided on a chain-of-custody form includes:
• The sampling location. • The sample identification number. • The type of test or analytical procedure. • The name of the person who relinquishes the samples. • The date and time of sample collection. • The date and time when samples are relinquished. • The name of the person who should receive the sampling results.
Sample Preservation and Storage at the Laboratory Once the samples arrive in the laboratory, they need to be logged in, sorted for further processing, and filtered and preserved, as needed, if not already. A reading of pH is conducted immediately when the samples arrive and bacteria analyses need to be started as soon as possible. Sample preservation needs to be conducted according to Standard Methods. Within a day, chilled samples need to be filtered. Glass filters used for suspended solids analyses typically contain large amounts of zinc that easily contaminate samples, therefore, membrane filters need to be used for filtered (dissolved) metal analyses. All samples are chilled on ice or in a refrigerator at 4°C (except for the HNO3 preserved samples for heavy metal analyses) and analyzed within the holding times shown below:
• immediately after sample collection or upon arrival in the laboratory: pH and microorganisms • within 24 hours: toxicity, ions, color, and turbidity • within 7 days: GC extractions, solids, and conductivity • within 40 day: GC analyses • within 6 months: heavy metal digestions and analyses
Personnel Requirements Personnel needed to carry out an effective monitoring program fall into several classifications. Obviously, project directors need to design the program to fulfill the project objectives while staying within the available resources. In many cases, a calculated monitoring program may be impossible to carryout because of insufficient monitoring opportunities (necessary length of monitoring period available, number of rain events expected, etc.). Obviously, the project personnel therefore need to understand the local conditions. Project field staff need to be able to efficiently collect samples in a safe manner and be capable of working under changing and uncomfortable conditions. In all cases, at least two people need to go into the field together. Laboratory personnel will be dependent on the analyses to be conducted and will likely need to have substantial wet weather sample analysis experience. Statistical experts are also needed to assist in the project design and to help analyze the data. Some of this effort could be provided with volunteers, but most comprehensive monitoring programs will also require a substantial effort by highly trained technical personnel. Obviously, volunteer support can be very successful from an economical and educational viewpoint. An increasingly common method to obtain water quality data is through the use of volunteer programs. Typically, a group of interested people are recruited by a local environmental organization. These people are trained in the use of relatively simple field test kits and then carry out relatively broad-based observations. Usually, these people obtain relatively frequent data from local waters that supplement regulatory agency monitoring efforts. Historical efforts have been mostly conducted by lake-shore property owners who take Secchi disk readings of lake water transparency. However, with decreasing budgets for regulatory agencies and decreasing formal monitoring efforts conducted by state agencies, volunteer monitoring programs are increasing. The objectives for the use of this data must still define the parameters observed and other aspects of the experimental designs (sampling locations, frequencies, etc.). All too often, volunteer monitoring programs are relatively unstructured and are restricted to parameters that are relatively simple to measure. They therefore cannot truly replace most professional monitoring programs, but can be good supplements. Relatively simple field test kits have been marketed in the U.S. for the past 30 years that can evaluate many of the monitoring parameters of interest. However, few of these kits are suitable substitutes for conventional laboratory procedures. With care, good “screening” observations can be obtained from many of these kits. The sample

collector, kit user, and data user must be aware of the limitations and hazards associated with many of these kits. The main concerns include: • safety (safe and correctly labeled reagents and clear instructions, including disposal guidance) • adequate sensitivity for required use of data • problems with interferences • ease of use and level of training needed • cost Tests conducted by Day (1996) have evaluated numerous field test kits for these criteria and are summarized by Burton and Pitt (2002). Receiving Water and Discharge Sampling Water samples can be collected by manual grab or automatic samplers, the latter being more directly expensive, but often superior when conditions fluctuate rapidly or sporadically, or when available personnel are lacking. Automatic samplers are essential for the NPDES program when effluents are monitored for permit requirements. Many types of automatic samplers exist (e.g., see EPA 1982) and none are ideally suited for all situations. The following variables must be considered when selecting a sampler (EPA 1982): • Water or effluent variation (flow and constituents) • Suspended solids concentration, dissolved gases, and specific gravity of effluent • Vertical lift required • Maintenance Automatic Water Sampling Equipment Automatic water samplers that are commonly used for stormwater monitoring are available from ISCO and American Sigma, amongst others (Figures 2 through 10). These manufactures have samplers that have very flexible programming capabilities specifically designed for stormwater sampling and are designed for priority pollutant sampling. A simpler automatic sampler is the Masterflex self-contained composite sampler (from Forestry Suppliers, Inc., for about $1,500). This sampler is restricted to composite sampling only on a time-increment basis and there is little control over the sample volumes that can be obtained. However, it may be a worthwhile option for simple sampling needs. The American Sigma (800-635-4567) samplers are an excellent example of a highly flexible automatic sampler (Figure 2). They have an integral flow meter option and can directly connect to a liquid level actuator or a depth sensor. The depth sensor is placed in the storm drainage upstream of a flow monitoring device (such as a weir or flume, or any calibrated stage-discharge relationship can be used). The flow indicators can control sample initiation and/or sampling frequency. A rain gage is also available that can be directly connected to the sampler. Rainfall data can therefore be logged by the sampler, along with flow information and sampling history. Rainfall can also be used to trigger sample initiation. A solar panel is also available to keep the sampler's battery charged. Several sample bases and sample bottle options are also available (Figure 3). Single bottle composite sample bases are available having glass or polyethylene bottles from 2.5 to 5.5 gallons in volume. Up to four one gallon glass or polyethylene bottles can also be used to obtain composite samples over segments of the runoff event. In addition, several 24 bottle options are also available, with 575 mL or 1 L polyethylene bottles, or 350 mL glass bottles. American Sigma also has several AC powered samplers that are refrigerated.
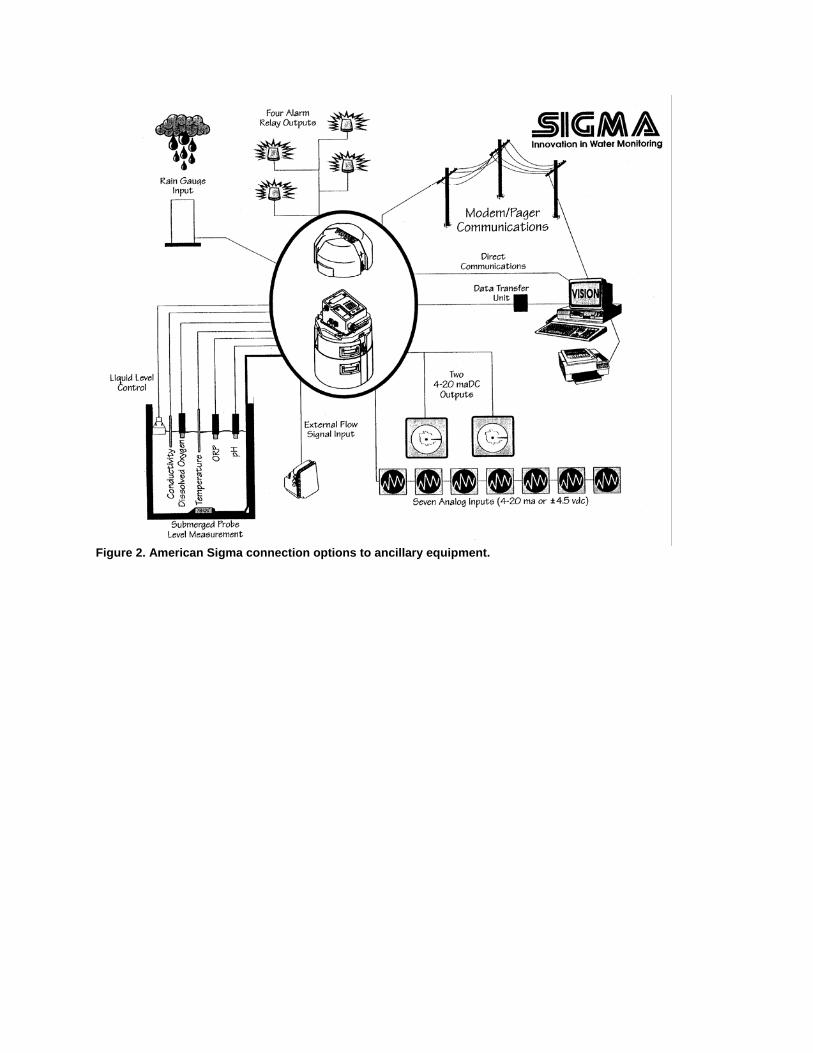
Figure 2. American Sigma connection options to ancillary equipment.
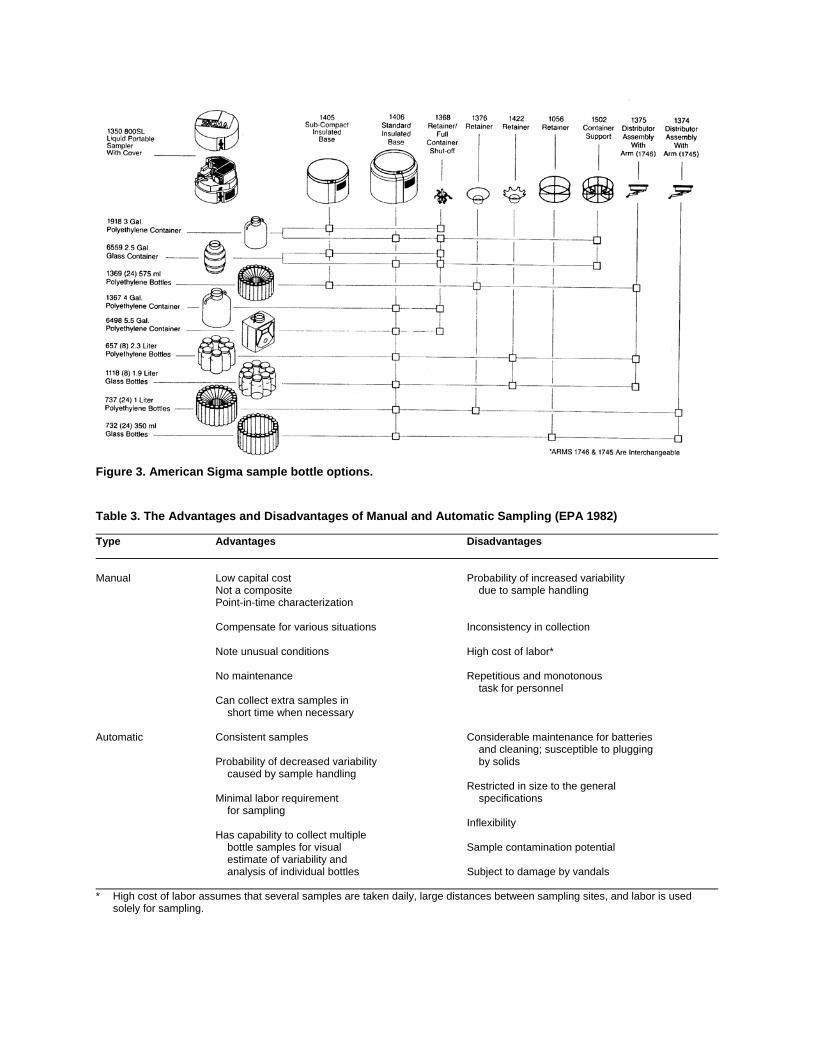
Figure 3. American Sigma sample bottle options. Table 3. The Advantages and Disadvantages of Manual and Automatic Sampling (EPA 1982) Type Advantages Disadvantages Manual Low capital cost Probability of increased variability Not a composite due to sample handling Point-in-time characterization Compensate for various situations Inconsistency in collection Note unusual conditions High cost of labor* No maintenance Repetitious and monotonous task for personnel Can collect extra samples in short time when necessary Automatic Consistent samples Considerable maintenance for batteries and cleaning; susceptible to plugging Probability of decreased variability by solids caused by sample handling Restricted in size to the general Minimal labor requirement specifications for sampling Inflexibility Has capability to collect multiple bottle samples for visual Sample contamination potential estimate of variability and analysis of individual bottles Subject to damage by vandals * High cost of labor assumes that several samples are taken daily, large distances between sampling sites, and labor is used
solely for sampling.
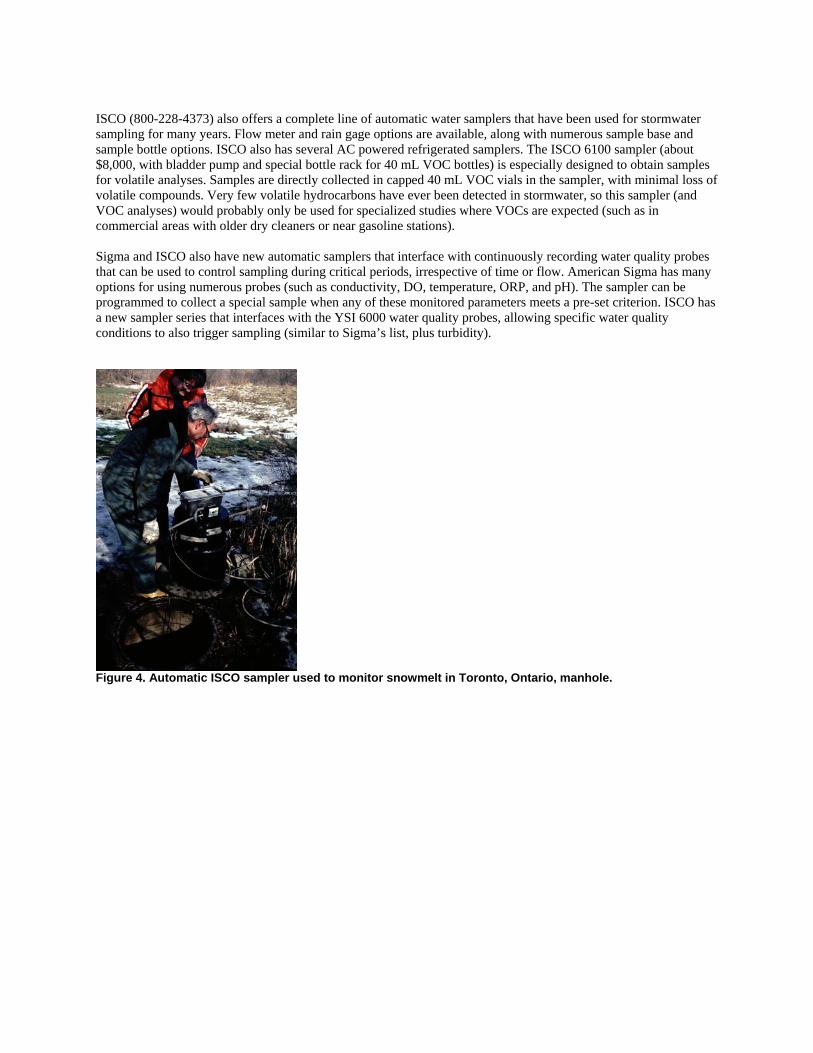
ISCO (800-228-4373) also offers a complete line of automatic water samplers that have been used for stormwater sampling for many years. Flow meter and rain gage options are available, along with numerous sample base and sample bottle options. ISCO also has several AC powered refrigerated samplers. The ISCO 6100 sampler (about $8,000, with bladder pump and special bottle rack for 40 mL VOC bottles) is especially designed to obtain samples for volatile analyses. Samples are directly collected in capped 40 mL VOC vials in the sampler, with minimal loss of volatile compounds. Very few volatile hydrocarbons have ever been detected in stormwater, so this sampler (and VOC analyses) would probably only be used for specialized studies where VOCs are expected (such as in commercial areas with older dry cleaners or near gasoline stations). Sigma and ISCO also have new automatic samplers that interface with continuously recording water quality probes that can be used to control sampling during critical periods, irrespective of time or flow. American Sigma has many options for using numerous probes (such as conductivity, DO, temperature, ORP, and pH). The sampler can be programmed to collect a special sample when any of these monitored parameters meets a pre-set criterion. ISCO has a new sampler series that interfaces with the YSI 6000 water quality probes, allowing specific water quality conditions to also trigger sampling (similar to Sigma’s list, plus turbidity).
Figure 4. Automatic ISCO sampler used to monitor snowmelt in Toronto, Ontario, manhole.

Figure 5. ISCO sampler used in instrument shelter with flow monitoring and telemetry equipment in Madison, WI.
Figure 6. Intermittent stream monitoring in Austin, TX.
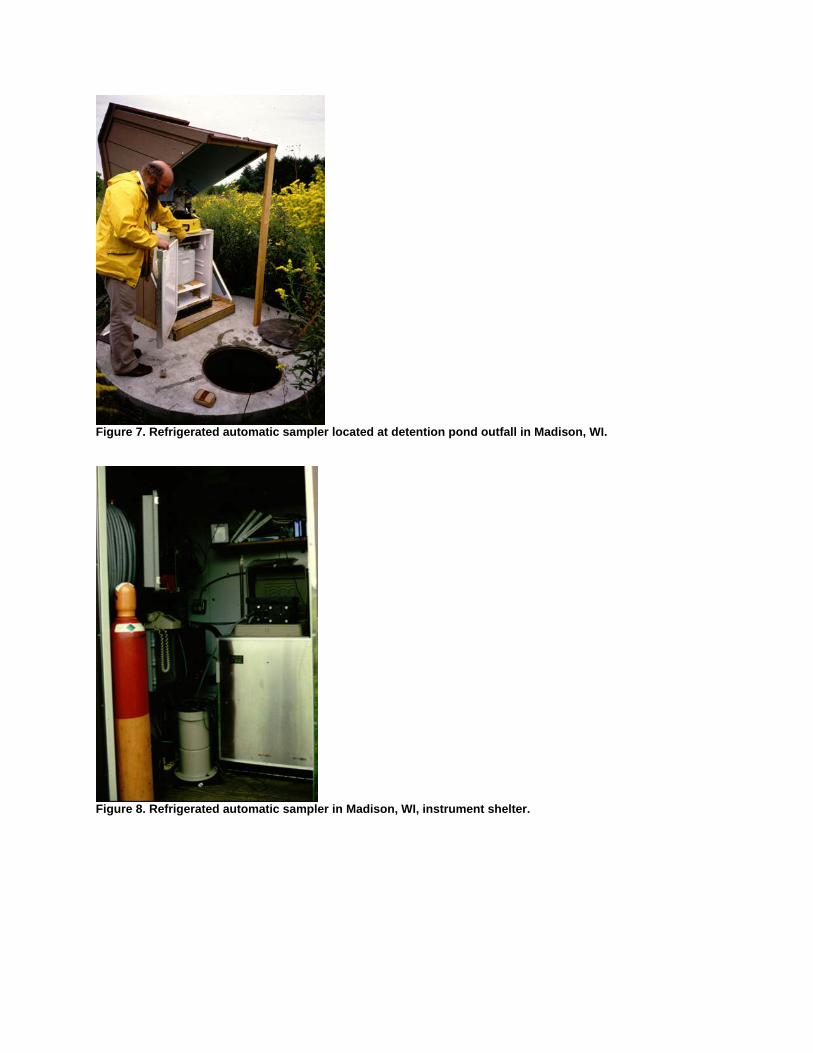
Figure 7. Refrigerated automatic sampler located at detention pond outfall in Madison, WI.
Figure 8. Refrigerated automatic sampler in Madison, WI, instrument shelter.
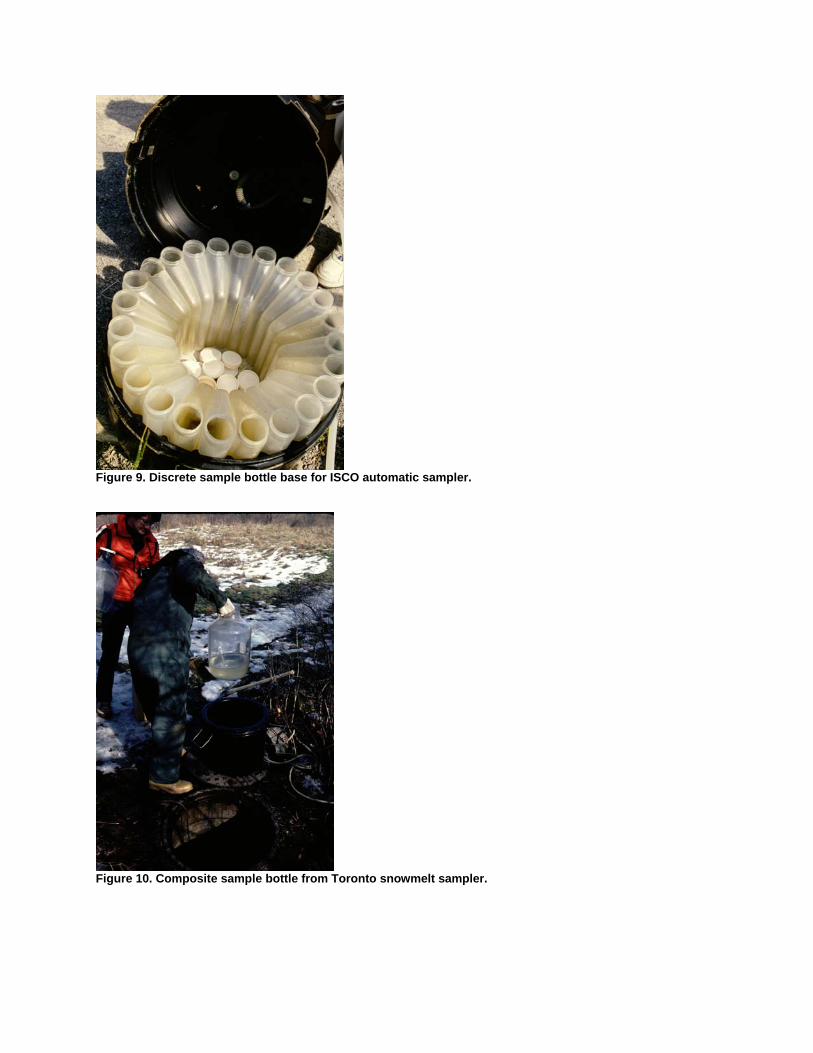
Figure 9. Discrete sample bottle base for ISCO automatic sampler.
Figure 10. Composite sample bottle from Toronto snowmelt sampler.
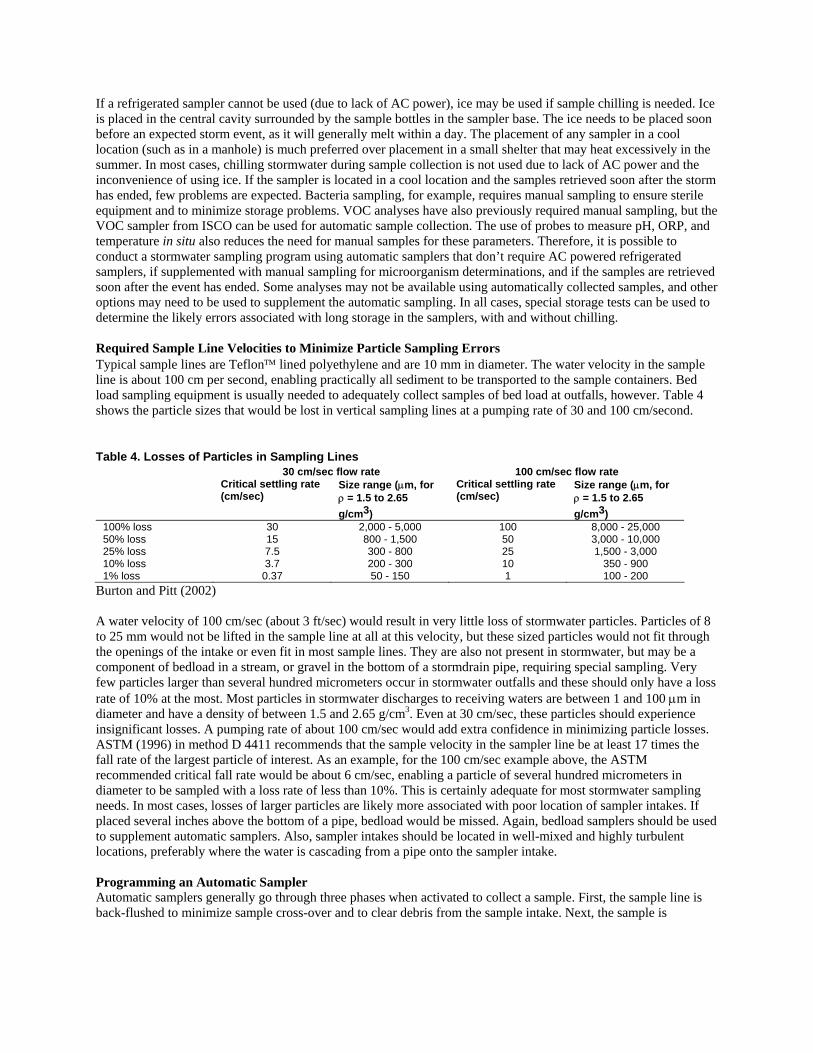
If a refrigerated sampler cannot be used (due to lack of AC power), ice may be used if sample chilling is needed. Ice is placed in the central cavity surrounded by the sample bottles in the sampler base. The ice needs to be placed soon before an expected storm event, as it will generally melt within a day. The placement of any sampler in a cool location (such as in a manhole) is much preferred over placement in a small shelter that may heat excessively in the summer. In most cases, chilling stormwater during sample collection is not used due to lack of AC power and the inconvenience of using ice. If the sampler is located in a cool location and the samples retrieved soon after the storm has ended, few problems are expected. Bacteria sampling, for example, requires manual sampling to ensure sterile equipment and to minimize storage problems. VOC analyses have also previously required manual sampling, but the VOC sampler from ISCO can be used for automatic sample collection. The use of probes to measure pH, ORP, and temperature in situ also reduces the need for manual samples for these parameters. Therefore, it is possible to conduct a stormwater sampling program using automatic samplers that don’t require AC powered refrigerated samplers, if supplemented with manual sampling for microorganism determinations, and if the samples are retrieved soon after the event has ended. Some analyses may not be available using automatically collected samples, and other options may need to be used to supplement the automatic sampling. In all cases, special storage tests can be used to determine the likely errors associated with long storage in the samplers, with and without chilling. Required Sample Line Velocities to Minimize Particle Sampling Errors Typical sample lines are Teflon™ lined polyethylene and are 10 mm in diameter. The water velocity in the sample line is about 100 cm per second, enabling practically all sediment to be transported to the sample containers. Bed load sampling equipment is usually needed to adequately collect samples of bed load at outfalls, however. Table 4 shows the particle sizes that would be lost in vertical sampling lines at a pumping rate of 30 and 100 cm/second.
Table 4. Losses of Particles in Sampling Lines 30 cm/sec flow rate 100 cm/sec flow rate Critical settling rate
(cm/sec) Size range (µm, for ρ = 1.5 to 2.65 g/cm3)
Critical settling rate (cm/sec)
Size range (µm, for ρ = 1.5 to 2.65 g/cm3)
100% loss 30 2,000 - 5,000 100 8,000 - 25,000 50% loss 15 800 - 1,500 50 3,000 - 10,000 25% loss 7.5 300 - 800 25 1,500 - 3,000 10% loss 3.7 200 - 300 10 350 - 900 1% loss 0.37 50 - 150 1 100 - 200
Burton and Pitt (2002) A water velocity of 100 cm/sec (about 3 ft/sec) would result in very little loss of stormwater particles. Particles of 8 to 25 mm would not be lifted in the sample line at all at this velocity, but these sized particles would not fit through the openings of the intake or even fit in most sample lines. They are also not present in stormwater, but may be a component of bedload in a stream, or gravel in the bottom of a stormdrain pipe, requiring special sampling. Very few particles larger than several hundred micrometers occur in stormwater outfalls and these should only have a loss rate of 10% at the most. Most particles in stormwater discharges to receiving waters are between 1 and 100 µm in diameter and have a density of between 1.5 and 2.65 g/cm3. Even at 30 cm/sec, these particles should experience insignificant losses. A pumping rate of about 100 cm/sec would add extra confidence in minimizing particle losses. ASTM (1996) in method D 4411 recommends that the sample velocity in the sampler line be at least 17 times the fall rate of the largest particle of interest. As an example, for the 100 cm/sec example above, the ASTM recommended critical fall rate would be about 6 cm/sec, enabling a particle of several hundred micrometers in diameter to be sampled with a loss rate of less than 10%. This is certainly adequate for most stormwater sampling needs. In most cases, losses of larger particles are likely more associated with poor location of sampler intakes. If placed several inches above the bottom of a pipe, bedload would be missed. Again, bedload samplers should be used to supplement automatic samplers. Also, sampler intakes should be located in well-mixed and highly turbulent locations, preferably where the water is cascading from a pipe onto the sampler intake. Programming an Automatic Sampler Automatic samplers generally go through three phases when activated to collect a sample. First, the sample line is back-flushed to minimize sample cross-over and to clear debris from the sample intake. Next, the sample is

collected. Finally, the sample is back-flushed again before going into a sleep mode to await the next sampling instruction. It can require several minutes to cycle through this process. A volume of 1850 mL of water fills a 10 mm (3/8 inch) diameter sample line that is 7.5 meters (25 feet) long. If a sample volume of 350 mL is to be collected for each sample interval, the following total volume of water is pumped by the sampler for each sample instruction: back-flush line: 1850 mL fill tube: 1850 mL collect sample: 350 mL back-flush line: 1850 mL This totals about 6 L of water to be pumped. Typical automatic samplers have a pumping rate of about 3.5 L per minute for low head conditions (about 1 meter). It would therefore require about 1.7 minutes to pump this quantity of water. With pump reversing and slower pumping speeds at typical pumping heads, this could easily extend to 2 minutes, or more. If the sampler collects 3 liters of sample instead of 350 mL, then another minute can be added to this sampling time for one cycle. This sampler cycle time requires various decisions to be made when setting up and programming a sampler, especially for flow-weighted composite sampling. The most important decisions relate to selecting the sampling interval that can accommodate expected peak flows and the sample volume needed for the smallest events to be sampled. Sample storage in the samplers is limited, further complicating the issue. The samplers are generally programmed to sample every 15 minutes to 1 hour for time-compositing sampling, or for an appropriate sample volume increment for flow-weighted sampling. If each sample increment is 0.25 L, a total of 40 sub-samples can therefore accumulate in a 10 L composite sample container. Automatic samplers can generally operate in two sampling modes, based on either time or flow increments. The sample bases can generally hold up to 24 bottles, each 1 L in volume. A single sample bottle of up to about 20 L is generally available for compositing the sample into one container. These bottle choices and the cycle time requirements of automatic samplers restrict the range of rain conditions that can be represented in a single sampler program for flow-weighted sampling. It is important to include samples from small rains (from about 0.01 to 0.2 inch) in a stormwater sampling program because they are very frequent and commonly exceed numeric water quality criteria, especially for fecal coliform bacteria and heavy metals. Moderate sized rains (from about 0.2 to 3 inches) are very important because they represent the majority of flow (and pollutant mass) discharges. The largest rains (greater than about 3 inches) are important from a drainage design perspective to minimize flooding problems. It is very difficult to collect a wide range of rain depths in an automatic sampler using flow-weighted sampling. Conflicts occur between needing to have enough sub-samples during the smallest event desired (including obtaining enough sample volume for the chemical analyses) and the resulting sampling frequency during peak flows for the largest sampling event desired. As an example, consider the following problem: • desired minimum rain to be sampled: 0.15 inch in depth, 4 hour runoff duration, having a 0.20 Rv (volumetric runoff coefficient) • largest rain desired to be sampled: 2.5 inch in depth, 12 hour runoff duration, having a 0.50 Rv • the watershed is 250 acres in size and 3 samples, at least, are needed during the smallest rain The calculated total runoff for these conditions is therefore: • minimum rain: 0.10 (0.15 in) (250 ac) (ft/12 in) (43,560 ft2/ac) = 13,600 ft3. • maximum rain: 0.50 (2.5 in) (250 ac) (ft/12 in) (43,560 ft2/ac) = 1,130,000 ft3. The average runoff flow rates expected are roughly estimated to be:
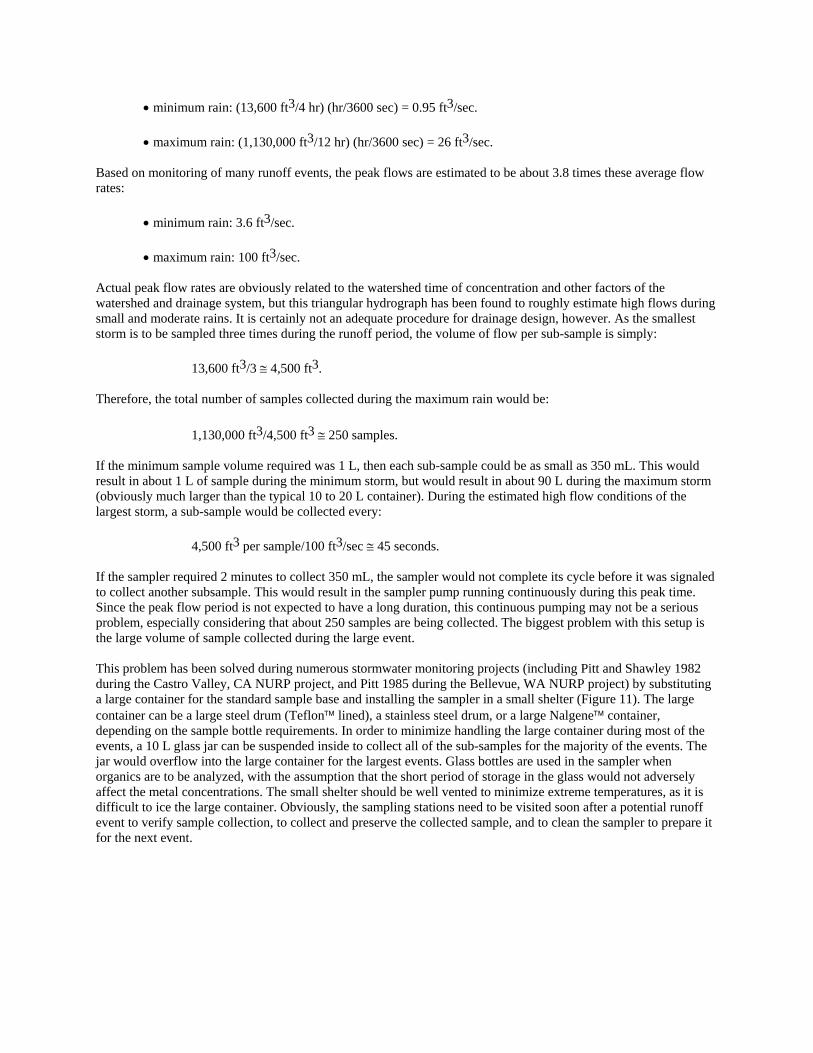
• minimum rain: (13,600 ft3/4 hr) (hr/3600 sec) = 0.95 ft3/sec. • maximum rain: (1,130,000 ft3/12 hr) (hr/3600 sec) = 26 ft3/sec. Based on monitoring of many runoff events, the peak flows are estimated to be about 3.8 times these average flow rates: • minimum rain: 3.6 ft3/sec. • maximum rain: 100 ft3/sec. Actual peak flow rates are obviously related to the watershed time of concentration and other factors of the watershed and drainage system, but this triangular hydrograph has been found to roughly estimate high flows during small and moderate rains. It is certainly not an adequate procedure for drainage design, however. As the smallest storm is to be sampled three times during the runoff period, the volume of flow per sub-sample is simply: 13,600 ft3/3 ≅ 4,500 ft3. Therefore, the total number of samples collected during the maximum rain would be: 1,130,000 ft3/4,500 ft3 ≅ 250 samples. If the minimum sample volume required was 1 L, then each sub-sample could be as small as 350 mL. This would result in about 1 L of sample during the minimum storm, but would result in about 90 L during the maximum storm (obviously much larger than the typical 10 to 20 L container). During the estimated high flow conditions of the largest storm, a sub-sample would be collected every: 4,500 ft3 per sample/100 ft3/sec ≅ 45 seconds. If the sampler required 2 minutes to collect 350 mL, the sampler would not complete its cycle before it was signaled to collect another subsample. This would result in the sampler pump running continuously during this peak time. Since the peak flow period is not expected to have a long duration, this continuous pumping may not be a serious problem, especially considering that about 250 samples are being collected. The biggest problem with this setup is the large volume of sample collected during the large event. This problem has been solved during numerous stormwater monitoring projects (including Pitt and Shawley 1982 during the Castro Valley, CA NURP project, and Pitt 1985 during the Bellevue, WA NURP project) by substituting a large container for the standard sample base and installing the sampler in a small shelter (Figure 11). The large container can be a large steel drum (Teflon™ lined), a stainless steel drum, or a large Nalgene™ container, depending on the sample bottle requirements. In order to minimize handling the large container during most of the events, a 10 L glass jar can be suspended inside to collect all of the sub-samples for the majority of the events. The jar would overflow into the large container for the largest events. Glass bottles are used in the sampler when organics are to be analyzed, with the assumption that the short period of storage in the glass would not adversely affect the metal concentrations. The small shelter should be well vented to minimize extreme temperatures, as it is difficult to ice the large container. Obviously, the sampling stations need to be visited soon after a potential runoff event to verify sample collection, to collect and preserve the collected sample, and to clean the sampler to prepare it for the next event.
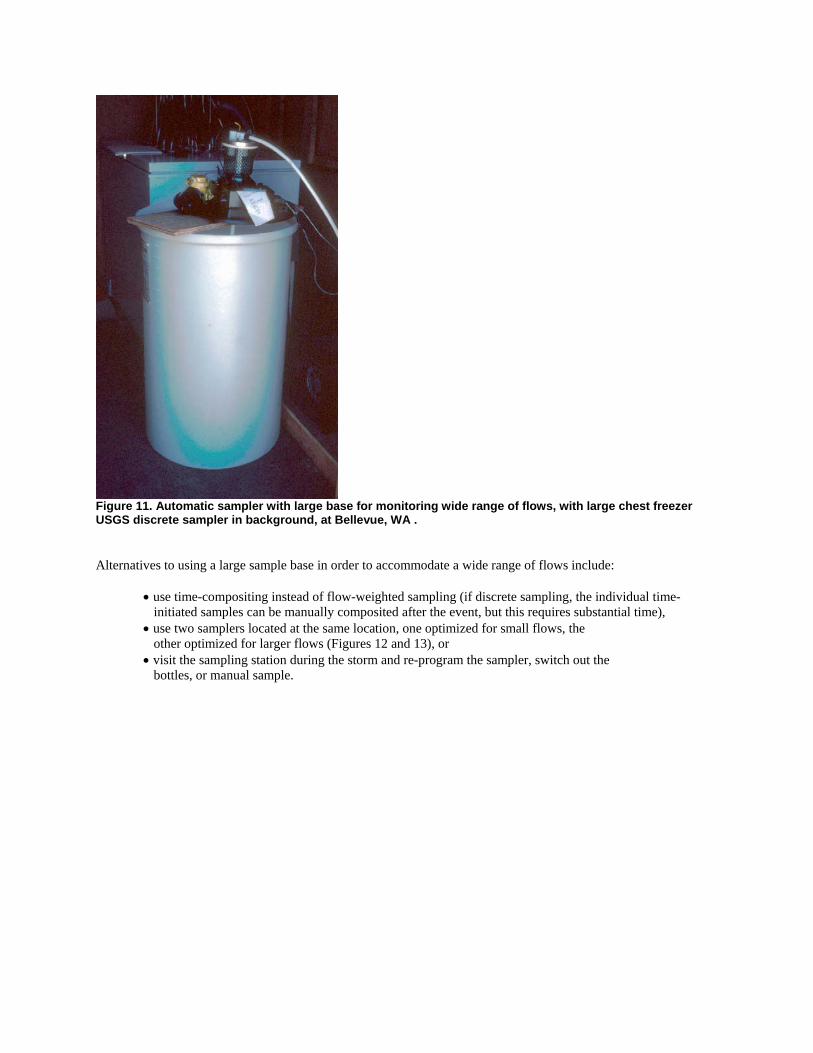
Figure 11. Automatic sampler with large base for monitoring wide range of flows, with large chest freezer USGS discrete sampler in background, at Bellevue, WA . Alternatives to using a large sample base in order to accommodate a wide range of flows include: • use time-compositing instead of flow-weighted sampling (if discrete sampling, the individual time- initiated samples can be manually composited after the event, but this requires substantial time), • use two samplers located at the same location, one optimized for small flows, the other optimized for larger flows (Figures 12 and 13), or • visit the sampling station during the storm and re-program the sampler, switch out the bottles, or manual sample.

Figure 12. Double monitor setup for simultaneously monitoring influent and effluent at small treatment device in Birmingham, AL.
Figure 13. Double monitor setup for sampling over a wide range of flow conditions The most common option is the last one which is expensive, uncertain, and somewhat dangerous. Few monitoring stations have ever used multiple samplers, but that may be the best all-around solution, but at an increased cost. The first option above, using time-compositing instead of flow-weighted sampling, should be considered. The Wisconsin Department of Natural Resources conducted a through evaluation of alternative sampling modes for stormwater sampling to determine the average pollutant concentrations for individual events (Roa-Espinosa and Bannerman 1995). Four sampling modes were compared at outfalls at five industrial sites, including: flow-weighted composite sampling, time-discrete sampling, time-composite sampling, and “first-flush” sampling during the first 30 minutes of runoff. Based on many attributes, they concluded that time-composite sampling at outfalls is the best method due to simplicity, low cost, and good comparisons to flow-weighted composite sampling. The time-composite sampling cost was about ¼ of the cost of the time discrete and flow-weighted sampling schemes, for example (but was about three times the cost of the first-flush sampling only). The accuracy and reproducibility of the composite samples were all good, while these attributes for the first-flush samples were poor. However, it is important to ensure that the time-composite sampling include many sub-samples. It would not be unusual to have the automatic samplers take samples every 10 minutes for the duration of an event. If the minimum sample volume needed is 1L and the shortest rain to be sampled is 30 minutes, then each subsample would need to be about 350 mL. The total volume collected would be about 50L (144 samples) if a storm lasted 24 hours. The sampler would
have to have an enlarged container (as in the above flow-weighted example), or the sampler would have to be visited about every 5 hours if a 10L composite sample container was used. In all cases, the use of in situ probes attached to the sampler that can monitor the general water quality during the sampling period should be used to detect significant water quality variations during the event. As indicated in the first module, many events need to be represented in a sampling program. It would be very expensive to use discrete sampling and analyze each separate sample within an individual event. However, the use of a continuous probe for turbidity and specific conductivity (along with temperature, DO, pH, and ORP) is very helpful to identify these variations within an event. Automatic Sampler Initiation and the use of Telemetry to Signal or Query Sampler Conditions Automatic sampling equipment is typically located semi-permanently in the field and is set to automatically begin sampling for a pre-determined set of conditions. The most common method to start samplers is to use a stage indicator. This simple device, available from most sampler manufactures, may be a float switch (as from American Sigma) or an electronic sensor that shorts out when wet (ISCO). These devices plug into the sampler at the flow sensor connection. If flow monitoring is simultaneously being monitored, a cable Y connection is available to allow both connections. The stage sensor is typically placed slightly above the base flow water elevation (in a pipe, open channel, or creek). It is difficult trying to sample small events that may not cause a large-enough stage elevation increase to trip the indicator. False alarms are also common when the sensor is placed too close to the base flow water elevation, or in areas having high humidity. In addition, the base flow water stage changes seasonally, requiring constant modifications in the sensor location. If the channel or pipe is normally dry, then these problems are significantly reduced, as the sensor can be placed on the bottom of the drainage way or pipe. Flow-weighted sampling schemes can eliminate the use of sensors all together. In this case, some water may collect in the sample container during base flow conditions, however. Frequent visits to the sampler are needed to empty and clean the sample container. Another method used to initiate sampling is to trip the equipment using a local rain gage. Pitt and McLean (1986) used a rain gage to initiate sampling at an industrial site in Toronto, while simultaneously monitoring flow. A tipping bucket rain gage was used and three trips (about 0.03 in. of rain) of the rain gage within a few hours were usually used to initiate sampling. In all cases, the use of telemetry (radio, telephone, or cell phone) is extremely useful in minimizing false trips to a remote sampler by automatically signaling that samples have been collected (Figure 14). Campbell Scientific of Logan, Utah (801-753-2342), supplies many options allowing remote inquiring or automatic signaling to indicate sampler status. It is also possible to phone a monitoring station and immediately determine if a sampler is operating, and to download or observe instantaneous or compiled rain, flow, or continuous in situ water quality monitoring information. The use of telemetry is extremely important when many remote systems are being operated by a small group. It should be considered an integral part of all sampling and monitoring programs where high reliability and good quality data is needed. There are potential problems with RF interference between cellular phones and some monitoring equipment, so care must be taken to use an external antenna, to electronically shield the monitoring equipment, and to thoroughly test the equipment.
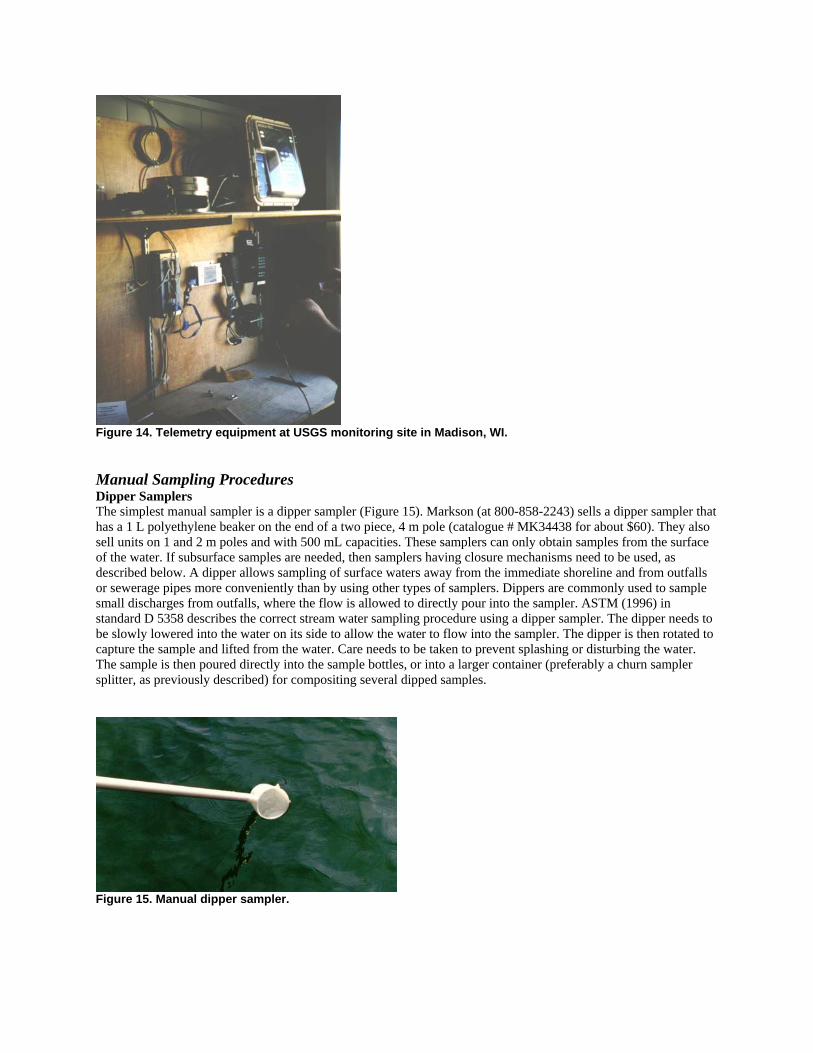
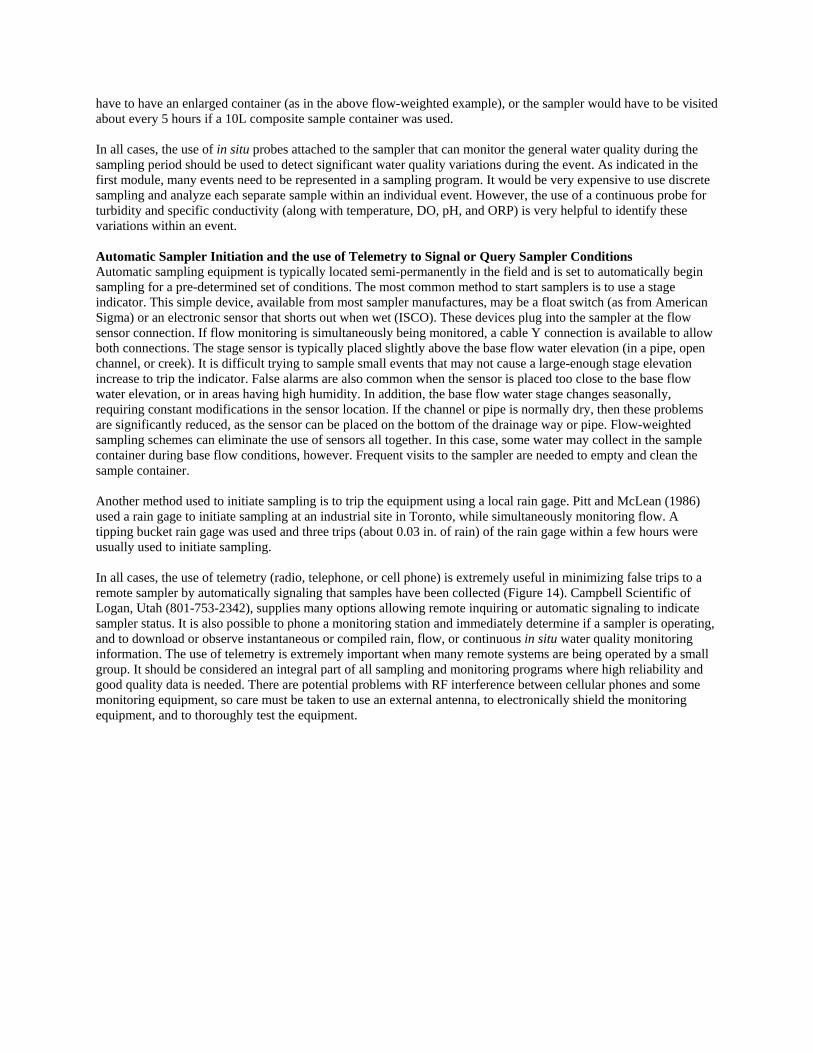
Figure 14. Telemetry equipment at USGS monitoring site in Madison, WI. Manual Sampling Procedures Dipper Samplers The simplest manual sampler is a dipper sampler (Figure 15). Markson (at 800-858-2243) sells a dipper sampler that has a 1 L polyethylene beaker on the end of a two piece, 4 m pole (catalogue # MK34438 for about $60). They also sell units on 1 and 2 m poles and with 500 mL capacities. These samplers can only obtain samples from the surface of the water. If subsurface samples are needed, then samplers having closure mechanisms need to be used, as described below. A dipper allows sampling of surface waters away from the immediate shoreline and from outfalls or sewerage pipes more conveniently than by using other types of samplers. Dippers are commonly used to sample small discharges from outfalls, where the flow is allowed to directly pour into the sampler. ASTM (1996) in standard D 5358 describes the correct stream water sampling procedure using a dipper sampler. The dipper needs to be slowly lowered into the water on its side to allow the water to flow into the sampler. The dipper is then rotated to capture the sample and lifted from the water. Care needs to be taken to prevent splashing or disturbing the water. The sample is then poured directly into the sample bottles, or into a larger container (preferably a churn sampler splitter, as previously described) for compositing several dipped samples.
Figure 15. Manual dipper sampler.
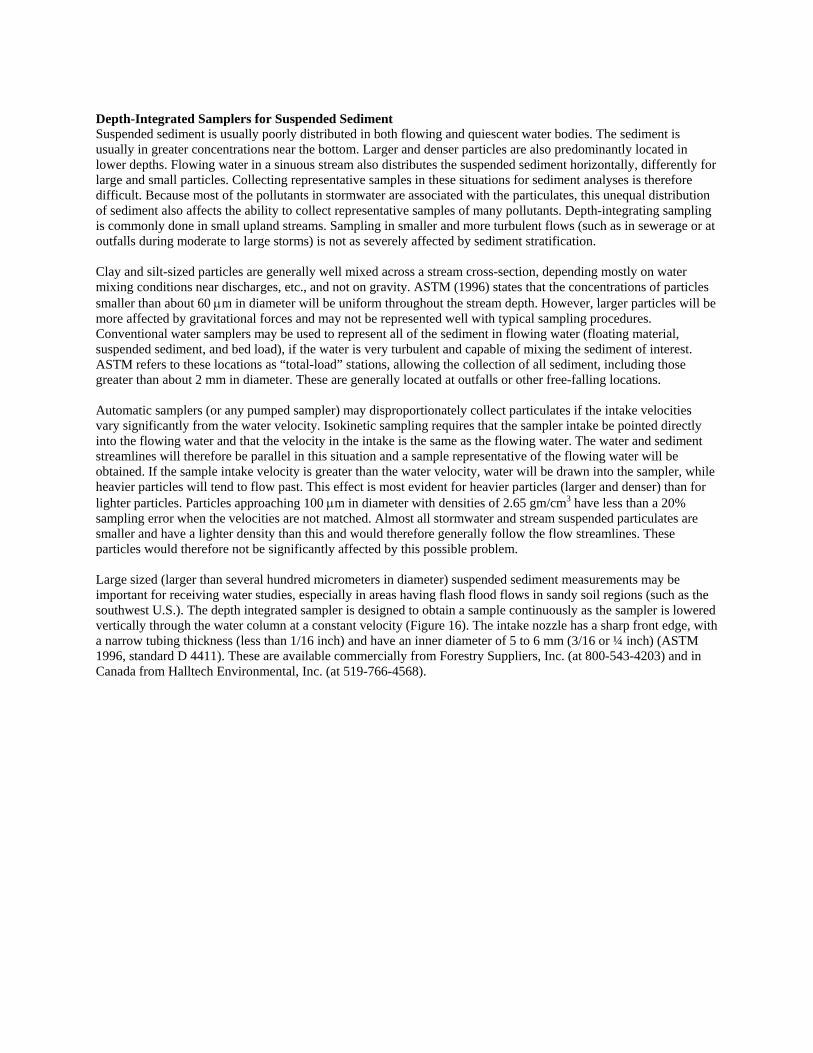
Depth-Integrated Samplers for Suspended Sediment Suspended sediment is usually poorly distributed in both flowing and quiescent water bodies. The sediment is usually in greater concentrations near the bottom. Larger and denser particles are also predominantly located in lower depths. Flowing water in a sinuous stream also distributes the suspended sediment horizontally, differently for large and small particles. Collecting representative samples in these situations for sediment analyses is therefore difficult. Because most of the pollutants in stormwater are associated with the particulates, this unequal distribution of sediment also affects the ability to collect representative samples of many pollutants. Depth-integrating sampling is commonly done in small upland streams. Sampling in smaller and more turbulent flows (such as in sewerage or at outfalls during moderate to large storms) is not as severely affected by sediment stratification. Clay and silt-sized particles are generally well mixed across a stream cross-section, depending mostly on water mixing conditions near discharges, etc., and not on gravity. ASTM (1996) states that the concentrations of particles smaller than about 60 µm in diameter will be uniform throughout the stream depth. However, larger particles will be more affected by gravitational forces and may not be represented well with typical sampling procedures. Conventional water samplers may be used to represent all of the sediment in flowing water (floating material, suspended sediment, and bed load), if the water is very turbulent and capable of mixing the sediment of interest. ASTM refers to these locations as “total-load” stations, allowing the collection of all sediment, including those greater than about 2 mm in diameter. These are generally located at outfalls or other free-falling locations. Automatic samplers (or any pumped sampler) may disproportionately collect particulates if the intake velocities vary significantly from the water velocity. Isokinetic sampling requires that the sampler intake be pointed directly into the flowing water and that the velocity in the intake is the same as the flowing water. The water and sediment streamlines will therefore be parallel in this situation and a sample representative of the flowing water will be obtained. If the sample intake velocity is greater than the water velocity, water will be drawn into the sampler, while heavier particles will tend to flow past. This effect is most evident for heavier particles (larger and denser) than for lighter particles. Particles approaching 100 µm in diameter with densities of 2.65 gm/cm3 have less than a 20% sampling error when the velocities are not matched. Almost all stormwater and stream suspended particulates are smaller and have a lighter density than this and would therefore generally follow the flow streamlines. These particles would therefore not be significantly affected by this possible problem. Large sized (larger than several hundred micrometers in diameter) suspended sediment measurements may be important for receiving water studies, especially in areas having flash flood flows in sandy soil regions (such as the southwest U.S.). The depth integrated sampler is designed to obtain a sample continuously as the sampler is lowered vertically through the water column at a constant velocity (Figure 16). The intake nozzle has a sharp front edge, with a narrow tubing thickness (less than 1/16 inch) and have an inner diameter of 5 to 6 mm (3/16 or ¼ inch) (ASTM 1996, standard D 4411). These are available commercially from Forestry Suppliers, Inc. (at 800-543-4203) and in Canada from Halltech Environmental, Inc. (at 519-766-4568).
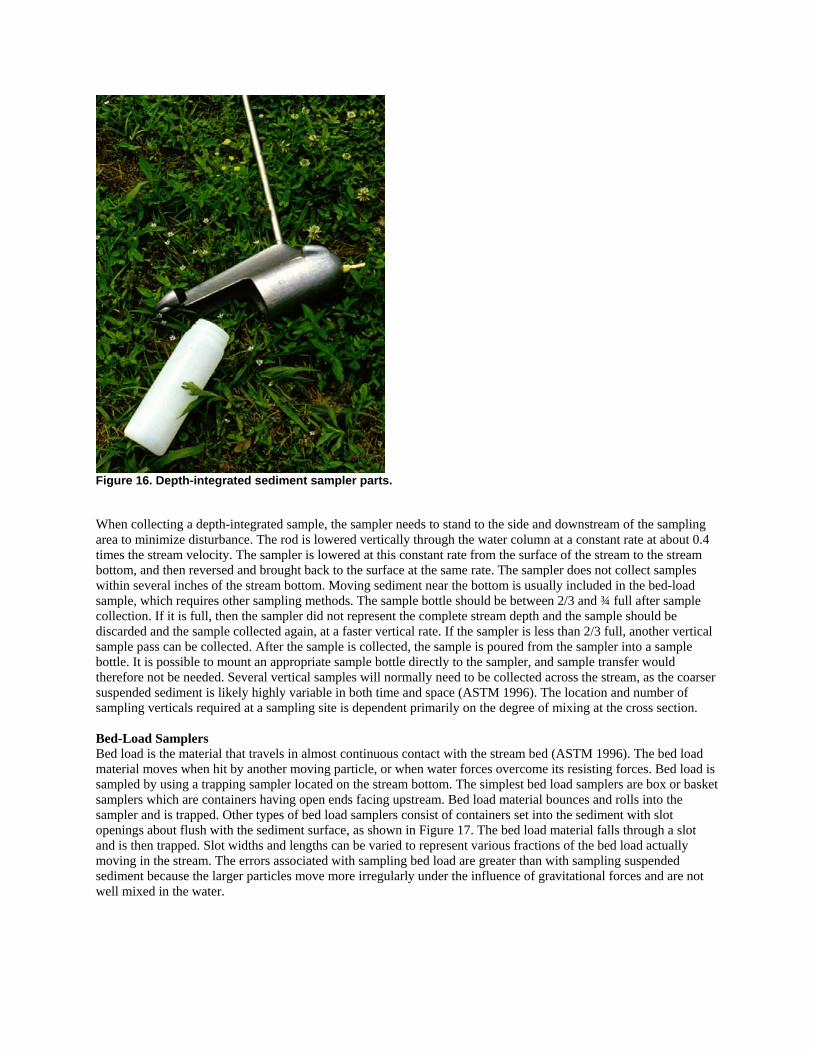
Figure 16. Depth-integrated sediment sampler parts. When collecting a depth-integrated sample, the sampler needs to stand to the side and downstream of the sampling area to minimize disturbance. The rod is lowered vertically through the water column at a constant rate at about 0.4 times the stream velocity. The sampler is lowered at this constant rate from the surface of the stream to the stream bottom, and then reversed and brought back to the surface at the same rate. The sampler does not collect samples within several inches of the stream bottom. Moving sediment near the bottom is usually included in the bed-load sample, which requires other sampling methods. The sample bottle should be between 2/3 and ¾ full after sample collection. If it is full, then the sampler did not represent the complete stream depth and the sample should be discarded and the sample collected again, at a faster vertical rate. If the sampler is less than 2/3 full, another vertical sample pass can be collected. After the sample is collected, the sample is poured from the sampler into a sample bottle. It is possible to mount an appropriate sample bottle directly to the sampler, and sample transfer would therefore not be needed. Several vertical samples will normally need to be collected across the stream, as the coarser suspended sediment is likely highly variable in both time and space (ASTM 1996). The location and number of sampling verticals required at a sampling site is dependent primarily on the degree of mixing at the cross section. Bed-Load Samplers Bed load is the material that travels in almost continuous contact with the stream bed (ASTM 1996). The bed load material moves when hit by another moving particle, or when water forces overcome its resisting forces. Bed load is sampled by using a trapping sampler located on the stream bottom. The simplest bed load samplers are box or basket samplers which are containers having open ends facing upstream. Bed load material bounces and rolls into the sampler and is trapped. Other types of bed load samplers consist of containers set into the sediment with slot openings about flush with the sediment surface, as shown in Figure 17. The bed load material falls through a slot and is then trapped. Slot widths and lengths can be varied to represent various fractions of the bed load actually moving in the stream. The errors associated with sampling bed load are greater than with sampling suspended sediment because the larger particles move more irregularly under the influence of gravitational forces and are not well mixed in the water.
Figure 17. A series of bedload samplers in a storm drain in Madison, WI (WI DNR and USGS). Bed load may be important when characterizing stormwater sediment discharges. In northern areas where sands are used for ice control, relatively large amounts of sand material can be transported along the drainage system as bed load. At the Monroe St. detention pond site in Madison, the bed load accounted for about 10% of the total annual sediment loading. This fraction was much greater during the spring when most of the sand was flushed from the drainage area. Conventional water samplers may not adequately collect bed load material. A slot sampler placed in a drilled hole in the bottom on a discharge pipe can effectively collect this material. However, the slot dimensions and placement exposure times usually need to be determined by trial and error. In addition, several bed load samplers should be used in close proximity because of the varied nature of bed load transport. Bed load samplers that are full upon retrieval may not represent actual conditions. If full, then the slot widths should be reduced and/or the exposure time should be shortened. The slot length should be as long as possible for the container lid, as bouncing bed load particles may jump over openings that are too short. In addition, the slot widths should be at least ¼ inch wide, as narrower slots will filter out large materials. Basket samplers are probably most applicable in streams, where the opening width is a small fraction of the stream width. Again, several samplers need to be used in close proximity and the best exposure period needs to be determined by trial. For grab samples, both hand-held and cable suspended Helley Smith (Geological Survey) bed-load samplers are available from Halltech Environmental, Inc. (at 519-766-4568). Floatable Litter Sampling One example of quantifying litter discharges during wet weather was described by Grey and Oliveri (1998). New York City has been involved in a comprehensive litter analysis and capture effectiveness program since the mid 1980s. As part of this investigation, they studied litter discharges from stormwater inlets using baskets that were inserted in manholes below catchbasins (Figure 18). The baskets were made of galvanized mesh and were 13 inches square and 36 inches high. The lower half of the baskets were made of ¼ inch mesh, while the upper half were of ½ inch mesh. The baskets were positioned on a wooden platform just beneath the catchbasin outlet pipe and were held

in place with ropes, allowing removal without requiring entry into the manholes. These baskets were installed at 38 locations throughout the city and were in place for 3 to 4 months. Most baskets were removed, emptied, and replaced every two weeks, although some were in place for only a week before emptying. The captured material was placed in sample bags, brought to the laboratory, sorted into 13 categories, counted, and weighed. They also measured the surface areas of the collected material.
Figure 18. New York City catchbasin litter sampling setup (HydroQual 1995). In addition to characterizing the litter discharges, New York City also examined the effectiveness of the catchbasins in capturing this material. Grey and Oliveri (1998) also described these tests. They placed a known amount of litter (10 pieces each of 12 different floatable items, totaling about 1 ft3 in volume of each material), including plastic bags, candy wrappers, straws, bottle caps, juice bottles, hard plastic pieces, glass vials, aluminum cans, polystyrene cups and pieces, cigarette butts, and medical syringes. They then opened a fire hydrant to produce a basic flow rate of about 75 gal/min (corresponding to a rain intensity of about 0.28 in/hr over a 40,000 ft2 drainage area). They also ran tests at 1/3 and 2X this flow. The flow was continued until no more items were transported to the sampling basket (usually about 5 to 10 minutes). The items remaining in the catchbasin were then retrieved and counted. This test was repeated five times for each test and ten tests in all were conducted (some with and some without catchbasin hoods). References ASTM (American Society of Testing and Materials). 1996 Annual Book of ASTM Standards. West Conshohocken,
PA: ASTM, vol. 04.08, 1996. Burton, G.A. Jr., and R. Pitt. Stormwater Effects Handbook: A Tool Box for Watershed Managers, Scientists, and
Engineers. ISBN 0-87371-924-7. CRC Press, Inc., Boca Raton, FL. 2002. 911 pages. Day, J. Selection of Appropriate Analytical Procedures for Volunteer Field Monitoring of Water Quality. MSCE
thesis, Dept. of Civil and Environmental Engineering, University of Alabama at Birmingham. 1996. EPA. "Handbook for Sampling and Sample Preservation of Water and Wastewater," Environmental Monitoring and
Support Lab, U. S. Environmental Protection Agency, Cincinnati, OH, EPA 600/4-82/029 (1982).
Grey, G. and F. Oliveri. “Catch basins – Effective floatables control devices.” Presented at the Advances in Urban Wet Weather Pollution Reduction conference. Cleveland, Ohio, June 28 – July 1, 1998. Water Environment Federation. Alexandria, VA. 1998.
HydroQual, Inc. Floatables Pilot Program Final Report: Evaluation of Non-Structural Methods to Control Combined and Storm Sewer Floatable Materials. City-Wide Floatables Study, Contract II. Prepared for New York City, Department of Environmental Protection, Bureau of Environmental Engineering, Division of Water Quality Improvement. NYDP2000. December 1995.
Pitt, R. Characterizing and Controlling Urban Runoff through Street and Sewerage Cleaning. U.S. Environmental Protection Agency, Storm and Combined Sewer Program, Risk Reduction Engineering Laboratory. EPA/600/S2-85/038. PB 85-186500. Cincinnati, Ohio. 467 pgs. June 1985.
Pitt, R., and J. McLean. Toronto Area Watershed Management Strategy Study: Humber River Pilot Watershed Project. Ontario Ministry of the Environment, Toronto, Ontario. 486 pgs. 1986.
Pitt, R. and G. Shawley. A Demonstration of Non-Point Source Pollution Management on Castro Valley Creek. Alameda County Flood Control and Water Conservation District and the U.S. Environmental Protection Agency, Water Planning Division (Nationwide Urban Runoff Program). Washington, D.C. June 1982.
Roa-Espinosa, A. and R. Bannerman. “Monitoring BMP effectiveness at industrial sites.” Proc Eng Found Conf Stormwater NPDES Related Monitoring Needs, Proceedings of the Engineering Foundation Conference on Stormwater NPDES Related Monitoring Needs. Aug 7-12 1994. Sponsored by: U.S. Environmental Protection Agency; The Engineering Foundation; U.S. Geological Survey; Water Environment Federation; American Institute of Hydrology, ASCE. pp 467-486. 1995.
Standard Methods for the Examination of Water and Wastewater. 19th edition. Water Environment Federation. Washington, D.C. 1995.