challenges in green infrastructure design and associated...
TRANSCRIPT
Challenges in Green Infrastructure Design and Associated Failure Modes,
or how to get the most out of planned stormwater controls
Robert Pitt, Ph.D., P.E., D.WRE, BCEE Department of Civil, Construction, and Environmental Engineering
University of Alabama Tuscaloosa, AL, USA 35487

Dozen Issues of Concern • Poor Assumptions • Clogging • Compaction • Chemical Breakthrough • Sodium Adsorption Ratio • Improper Sizing and
Locations • Groundwater
Interactions
• Improper Construction • Poor Maintenance • Anaerobic Conditions • Large Underdrains and
Short-Circuiting • Need Combinations of
Controls and Unit Processes
1) Real Data May Not Support Traditional Urban Hydrology
Assumptions
• Many agencies and stormwater managers focus on single design storms that do not adequately represent the long-term discharges of water and pollutants during wet weather
• Legacy of drainage design approaches

Seattle Rains: <0.15”: 50% of rains (7% of runoff) 0.15 to 1”: 42% of rains (51% of runoff) 1 to 3”: 8% of rains (26% of runoff) 3 to 8”: <1% of rains (16% of runoff)
Probability distribution of rains (by count) and runoff (by depth):

Typical plot of calculated curve numbers for actual site monitoring (FL resid. area). This date is from the Univ. of Florida’s rainfall-runoff database that contains historical SCS/NRCS and COE monitoring data that was used to develop TR-55. Obviously, the CN method is only applicable for the large drainage design storms for which it was intended!

Small Urban Swale vs. Historical Stillwater, Oklahoma, Large Irrigation Channel Grass Retardance Curves
From such graphs, swale hydraulic characteristics can be predicted on the basis of flow rate, cross sectional geometry, slope, and vegetation type. Small-scale urban drainage systems and flows are quite different from originally studied larger systems.
Kirby 2005

2) Clogging • Clogging of biofiltration/bioretention devices
hinders their long-term performance. • Grass swales are relatively robust as they are
very large in comparison to the service area and sediment load.
• Many smaller infiltration devices suffer due to excessive sediment without adequate pre-treatment.

Many media options can clog at sediment loads less than 5 kg/m2. Larger scale systems can usually handle several times more sediment than small systems, especially if well established vegetation.

Years to clog as a function of biofilter size
0.1
1
10
100
0.1 1 10 100
Year
s to
clog
Percentage of area as biofilter
5% of the area as biofilter would provide 7 to 20 years before clogging (plants would likely extend operating period). 2.2% of the area as biofilters would only allow about 3 to 8 years before clogging, possibly too short for vegetation to have a significant benefit.

1
10
100
1000
10000
0.1 1 10 100
Year
s to
Clog
ging
Rain Garden Size (% of roof area)
years to 10 kg/m2
years to 25 kg/m2
Clogging Potential for Different Sized Rain Gardens Receiving Roof Runoff
Clogging not likely a problem with rain gardens from roofs (due to low sediment loads)

3) Soil and Media Compaction
• Compaction of soils or media in an infiltration area (let alone in all pervious areas!) severely hinders infiltration capacity.
• Difficult to recover from compaction, so care is needed during construction and use.

Infiltration Rates in Disturbed Sandy
Urban Soils
Infiltration Rates in Disturbed Clayey Urban
Soils
Pitt, et al. 1999

Pitt, et al. 2002
Laboratory Infiltration Tests for Silty Loam Soil 4” Diameter Test Cylinder, 4.5” Depth
Loamy and clayey soils are especially sensitive to compaction (moderate to severe compaction can render these soils basically impervious: to much less than 0.1 in/hr)
4) Breakthrough of Chemical Capacity
• Besides sediment clogging, media can fail due to exceeding chemical treatment capacity of the media.
• Long-term column tests more reliable indicators of chemical capacity than short-term batch tests.
• Need to use actual stormwater to represent the wide range of competing chemicals in the water, compared to tests using artificially high concentrations of single pollutant.

Analyte % Ionic % ColloidalMagnesium 100 0Calcium 99.1 0.9Zinc 98.7 1.3Iron 97 3Chromium 94.5 5.5Potassium 86.7 13.3Lead 78.4 21.6Copper 77.4 22.6Cadmium 10 90
Mostly ionic forms of metals in filtered stormwater (with some notable exceptions); also, several removal processes occur,
including precipitation, ion exchange, sorption, etc.
Morquecho 2005
Controlled batch tests using “artificial” or simulated stormwater do not represent these chemical characteristics, nor include competing ions.
5) Sodium Adsorption Ratio (SAR) • Excessive amounts of sodium in relation to calcium
and magnesium causes the dispersion of clays in a soil, severely restricting infiltration capacity.
• Problem when deicing salts and snowmelt entering infiltration devices that have even small amounts of clay in the soil or media mixture.
• Not much of an issue for roof runoff rain gardens (as long as heavily salted walks or driveways do not drain towards them).
• Acceptable media and soil mixtures in cold climates should prohibit clays, focusing on sandy material with small amounts of organic amendments.

A new infiltration pond after first winter; receives snowmelt from adjacent salted parking areas (plus sediment from area construction); lost almost all of the infiltration capacity and is rapidly becoming a (poorly designed) wet pond. [was restored last summer]
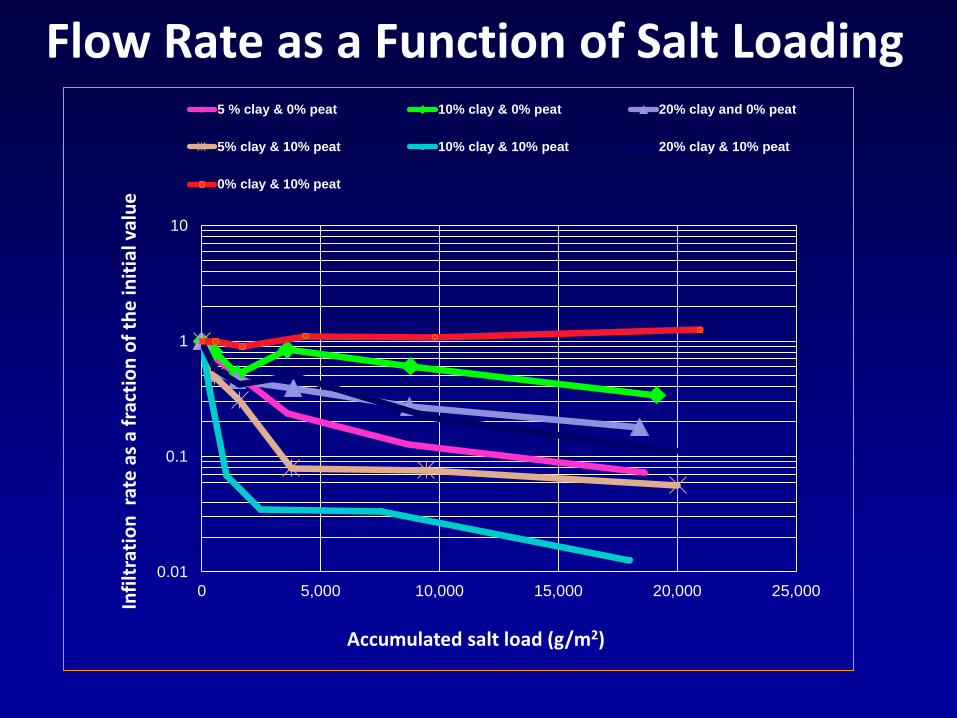
Flow Rate as a Function of Salt Loading
0.01
0.1
1
10
0 5,000 10,000 15,000 20,000 25,000
Inf
iltra
tion
rate
as a
frac
tion
of th
e in
itial
val
ue
Accumulated salt load (g/m2)
5 % clay & 0% peat 10% clay & 0% peat 20% clay and 0% peat
5% clay & 10% peat 10% clay & 10% peat 20% clay & 10% peat
0% clay & 10% peat

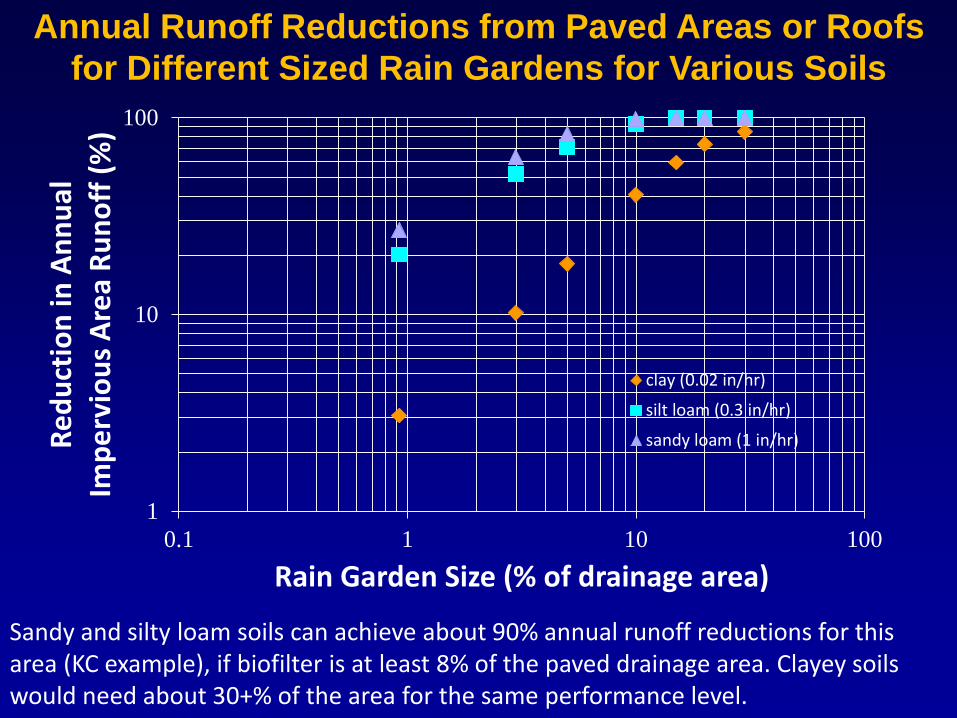
6) Improper Sizing and Poor Locations
• Improper modeling and design storm use can result in (usually) overly-optimistic performance expectations.
• Long-term simulations needed to access likely failures and maintenance issues.
• Over-sizing is usually needed (especially in northern climates) to overcome many uncertainties in infiltration behavior.
1
10
100
0.1 1 10 100
Redu
ctio
n in
Ann
ual
Impe
rvio
us A
rea
Runo
ff (%
)
Rain Garden Size (% of drainage area)
clay (0.02 in/hr)
silt loam (0.3 in/hr)
sandy loam (1 in/hr)
Annual Runoff Reductions from Paved Areas or Roofs for Different Sized Rain Gardens for Various Soils
Sandy and silty loam soils can achieve about 90% annual runoff reductions for this area (KC example), if biofilter is at least 8% of the paved drainage area. Clayey soils would need about 30+% of the area for the same performance level.

Unlikely suitable performance of grass pavement in heavily used parking area, with severely compacted soil and no vegetation. At least the table tops in the adjacent hotel had flourishing LID components!

7) Groundwater Interactions
• Groundwater contamination potential from infiltrating stormwater is decreased with treatment before discharge to the groundwater, proper media selection, or located in an area having little contamination potential.
• Mounding below infiltration sites can severely reduce infiltration rates if shallow groundwater table.
• Increased groundwater recharge may increase groundwater flows to adjacent urban streams (usually a positive outcome, but if groundwater is contaminated, then this is a potential problem).

Moderate to High Contamination Potential (worst case sandy soil conditions, with limited organic matter content) Surface Infiltration after Sedimentation plus sorption/ion-exchange (MCTT and bioretention)
Surface Infiltration with minimal Pretreatment (biofiltration and marginal soils)
Injection after Minimal Pretreatment (dry wells, gravel trenches, and most porous pavements)
Lindane, chlordane Lindane, chlordane
Fluoranthene, pyrene Benzo (a) anthracene, bis (2-ethylhexl phthalate), fluoranthene, pentachlorophenol, phenanthrene, pyrene
1,3-dichlorobenzene, benzo (a) anthracene, bis (2-ethylhexl phthalate), fluoranthene, pentachlorophenol, phenanthrene, pyrene
Enteroviruses Enteroviruses Enteroviruses, some bacteria and protozoa Nickel, chromium, lead, zinc
Chloride Chloride Chloride

Minimal Pre-treatment before Infiltration Leads to Greater Groundwater Contamination Potential
(also, filter fabric liners are usually not recommended anymore as many have failed due to clogging from silts)
Early approaches to infiltrating stormwater:

8) Improper Construction and Poor Selection of Components
• Problems with media materials (did I mention clay before?)
• Over-filling biofilters (a surprisingly common problem), reducing storage capacity, usually with overflows set at too low of an elevation further decreasing storage.
• Difficult for water to enter device (not in flow path, no gradient, blocked entrances, and no drop off to top of media, allowing build-up of debris.

Red southern clay turned these terraced biofilters into something else. Constant flooding killed the vegetation and they are attempting to break up the surface clay layers.

Over-filled biofilter allowing short-circuiting of surface flows to slot drain inlet that is set slightly below top of media

9) Poor Maintenance • Proper maintenance is necessary to ensure
expected performance. • Excessive erosion of surrounding areas and at
the device itself can lead to excessive sediment loads and clogging in a short period of time.
• Irrigation is needed during periods of low rainfall to keep biofilter plants alive and active. Similar needs for green roof plants during seasonal dry periods. Plants need to be selected to withstand a wide range of dry to flooding conditions.

Excessive erosion at edges of biofilter.
Lack of irrigation resulted in complete loss of these biofilter plants during extended drought.

10) Anaerobic Conditions • Anaerobic conditions in biofilter media can enhance
nitrate removals, if used in conjunction with other properly designed attributes (media selection and underdrain design).
• Many organic media can loose previously captured pollutants, especially nutrients, under anaerobic conditions. Metal retention is usually more secure, but degradation of the media results in losses of all materials.
• “First-flushes” of retained water from biofilters that have gone anaerobic contain very high pollutant concentrations.
• Free-draining media that remain aerobic during interevent periods exhibit fewer of these problems.


11) Large Underdrains and Short-Circuiting
• Underdrains are needed in areas where standing water for extended periods of time causes problems, and to reduce anaerobic conditions in biofilter media.
• Conventional large underdrains provide too large of a drainage flow rate causing short-circuiting and short residence times.
• Flow restrictions are causes of clogging or maintenance problems.
• Modified underdrains can provide a good solution.

Many Areas Require Biofilter Drainage within 72 hours to Prevent Mosquito Infestation

Contact Time Affects Pollutant Removals Minimal filtered metal removal observed for all media except peat when contact time <10 minutes. The optimal contact times for filtered metals removal ranged from 10 to 1,000 minutes (17 hrs), depending on the metal and the media type. However too long of a contact time increased leaching losses from some media.
Peat moss GAC
Site zeolite
Surface modified zeolite
Rhyolite sand Influent test water

0
0.02
0.04
0.06
0.08
0.1
0.12
0.14
0 0.2 0.4 0.6 0.8 1 1.2
Flow
rate
(L/s
)
Head (m)
Orifice 0.1 inches
Orifice 0.25 inches
Orifice 0.20 inches
Smart Drain 1.25 ft dirty water
Smart Drain 1.25 ft clean water
Smart Drain 1.1 to 9.4 ft clean water
Smart Drain Flow Rates Compared to Very Small Orifices

12) Need Combinations of Controls (storage, sedimentation and infiltration)
• Infiltration alone can be effective in reducing most stormwater pollutants and flows.
• Sedimentation before infiltration offers advantages of pre-treatment and better sediment control.
• Storage before infiltration enhances treatment at low treatment flow rates.

Parallel study areas, comparing test with control site, Cross Plains, WI, DNR and USGS


Runoff Reductions by Site Components
100%
83%
78%
55%
3%
0%10%20%30%40%50%60%70%80%90%
100%
Runoff Volume
Conventional + SwalesRoof & 1 Sidewalk + Infiltration Basin+ Narrow Streets
Conventional Development
LID Scenarios
“Conventional” Management

Summary • Learn from others (and yourselves)! Evaluate and
monitor installations and modify approaches. • Site conditions and local rains dramatically affect
performance. • Northern areas and locations using deicing salts are an
extreme example that require special approaches to stormwater management.
• Groundwater issues need to be considered. • Combinations of unit processes almost always result in
the most robust, most cost-effective, and best water quality.

Acknowledgements • Many researchers and stormwater
managers over the years have been true pioneers in developing and enhancing stormwater controls.
• The few examples of poor installations in this presentation are not intended to denigrate these efforts, but to thank all for their ideas and dedication, so others can learn.