m new york city neighborhood economic q … · new york city neighborhood economic ... breezy point...
TRANSCRIPT

Queens
Bronx
Brooklyn
Manhattan
Staten Island
NEW YORK CITY
NEIGHBORHOOD ECONOMIC
PROFILES
NEW YORK CITY COMPTROLLER
SCOTT M. STRINGER
2017 EDITION
1 Centre Street, New York, NY 10007 • (212) 669-3500 • www.comptroller.nyc.gov • brand16 @NYCComptroller

2 NEW YORK CITY COMPTROLLER SCOTT M. STRINGER

NEIGHBORHOOD ECONOMIC PROFILES 3
Dear Friend,
One of my jobs as Comptroller is analyzing the long-term economic health of our city, a responsibility that requires having a very clear sense of business activity in our many vibrant, diverse neighborhoods. That’s why my office has created this compendium of Neighborhood Economic Profiles – to share with you the kind of economic and demographic data we look at every day in the Comptroller’s Office to assess where we as a city have been, and where we need to go.
In this book, you will find an economic snapshot of every borough and every Community Board district in the city, with information that charts how businesses and populations have changed between the years 2000 to 2015. It is by far the most comprehensive and up-to-date look at the City’s evolving economic landscape available today, providing everything from the number and types of businesses in your neighborhood, to changes in population, to the number of building lots zoned for commercial use, as well as information about the age, race, and commute times of local residents.
When you step back, you can see some interesting shifts in our city’s economy over the last 15 years. Consider this -- the number of businesses in our most economically challenged neighborhoods has increased 41 percent since 2000, and by even more (45 percent) in neighborhoods commonly classified as gentrifying. That’s good news. But it’s also true that the benefits of that business growth have not always been broadly distributed, and that deep disparities persist along racial, educational and geographic lines.
I believe that we as a city need to do a better job of connecting local people to local jobs as neighborhoods thrive and grow, which is why I have released a separate report — The New Geography of Jobs: A Blueprint for Strengthening NYC Neighborhoods — that focuses more on strategies for empowering local residents as neighborhoods grow. In short, I believe we need to create more local wealth in all our boroughs, and we can only do that with more innovative, collaborative, and community-centric solutions.
As your Comptroller, you can be sure that I will continue to try and advance strategies that lift up all our neighborhoods. In the meantime, I hope you find these economic profiles of interest. Please don’t hesitate to call my office’s Community Action Center to request a copy, at 212-669-3916, or to make suggestions about how to make next year’s edition even more useful.
Sincerely,
Scott M. Stringer
The City of New YorkOffice of the Comptroller
Scott M. Stringer
Municipal Building • 1 Centre Street, 5th Floor • New York, NY 10007Phone: (212) 669-3500 • @scottmstringer
www.comptroller.nyc.gov

4 NEW YORK CITY COMPTROLLER SCOTT M. STRINGER

NEIGHBORHOOD ECONOMIC PROFILES 5
NEW YORK CITY .......................................................6
BRONX ......................................................................8
Hunts Point, Longwood & Melrose .............................. 10
Belmont, Crotona Park East & East Tremont ................ 12
Concourse, Highbridge & Mount Eden ........................ 14
Morris Heights, Fordham South & Mount Hope .......... 16
Bedford Park, Fordham North & Norwood .................. 18
Riverdale, Fieldston & Kingsbridge .............................. 20
Castle Hill, Clason Point & Parkchester ........................ 22
Co-op City, Pelham Bay & Schuylerville ....................... 24
Pelham Parkway, Morris Park & Laconia ....................... 26
Wakefield, Williamsbridge & Woodlawn ...................... 28
BROOKLYN ..............................................................30
Greenpoint & Williamsburg .......................................... 32
Brooklyn Heights & Fort Greene .................................. 34
Bedford-Stuyvesant ...................................................... 36
Bushwick ....................................................................... 38
East New York & Starrett City ....................................... 40
Park Slope, Carroll Gardens & Red Hook ..................... 42
Sunset Park & Windsor Terrace .................................... 44
Crown Heights North & Prospect Heights .................... 46
Crown Heights South, Prospect Lefferts & Wingate..... 48
Bay Ridge & Dyker Heights .......................................... 50
Bensonhurst & Bath Beach ........................................... 52
Borough Park, Kensington & Ocean Parkway .............. 54
Brighton Beach & Coney Island ................................... 56
Flatbush & Midwood .................................................... 58
Sheepshead Bay, Gerritsen Beach & Homecrest .......... 60
Brownsville & Ocean Hill .............................................. 62
East Flatbush, Farragut & Rugby .................................. 64
Canarsie & Flatlands ..................................................... 66
MANHATTAN...........................................................68
Battery Park City, Greenwich Village & Soho ............... 70
Chinatown & Lower East Side ...................................... 72
Chelsea, Clinton & Midtown Business District ............. 74
Murray Hill, Gramercy & Stuyvesant Town ................... 76
Upper West Side & West Side ...................................... 78
Upper East Side ............................................................ 80
Hamilton Heights, Manhattanville & West Harlem ............................................................. 82
Central Harlem ............................................................. 84
East Harlem .................................................................. 86
Washington Heights, Inwood & Marble Hill ................. 88
QUEENS ..................................................................90
Astoria & Long Island City ............................................ 92
Sunnyside & Woodside ................................................ 94
Jackson Heights & North Corona ................................. 96
Elmhurst & South Corona ............................................. 98
Ridgewood, Glendale & Middle Village ..................... 100
Forest Hills & Rego Park ............................................. 102
Flushing, Murray Hill & Whitestone ............................ 104
Briarwood, Fresh Meadows & Hillcrest ....................... 106
Richmond Hill & Woodhaven ..................................... 108
Howard Beach & Ozone Park ..................................... 110
Bayside, Douglaston & Little Neck ............................. 112
Jamaica, Hollis & St. Albans ....................................... 114
Queens Village, Cambria Heights & Rosedale ........... 116
Far Rockaway, Breezy Point & Broad Channel ............ 118
STATEN ISLAND ....................................................120
Port Richmond, Stapleton & Mariners Harbor ............ 122
New Springville & South Beach .................................. 124
Tottenville, Great Kills & Annadale ............................. 126
Table of Contents

6 NEW YORK CITY COMPTROLLER SCOTT M. STRINGER
UNEMPLOYMENT RATE IN 2015*
7.4%down from 9.0% in 2000
NUMBER OF BUSINESSES
237,198up 16% from 2000 to 2015
MEDIAN HOUSEHOLD INCOME
$55,200
NEIGHBORHOOD ECONOMIC PROFILE
New York City
EMPLOYMENT* 2000 2015 % Change
Employed 3,144,395 3,919,210 25%
Unemployed 311,406 311,192 0%
Unemployment Rate 9.0% 7.4% --
Out of School & Work (age 18-24) 188,823 136,483 -28%
% Out of School & Work (age 18-24) 24% 17% --
INDIVIDUAL INCOME*º 2000 2015 % Change
$25,000 or less 2,473,054 2,886,197 17%
$25,001 - $50,000 1,201,002 1,205,243 0%
$50,001 - $75,000 660,777 634,243 -4%
$75,001+ 752,341 886,425 18%
NUMBER OF BUSINESSES 2000 2015 % Change
Construction 10,289 14,120 37%
Manufacturing 9,135 5,405 -41%
Wholesale Trade 18,193 16,135 -11%
Retail Trade 29,182 35,472 22%
- Supermarkets (with 10+ Employees) 691 1,039 50%
Transportation, Warehousing 4,554 5,544 22%
Information 5,660 6,403 13%
Finance, Insurance 13,722 11,018 -20%
- Retail Banks 1,701 2,173 28%
Real Estate, Rental, Leasing 16,593 20,213 22%
Professional, Scientific, Technical 23,057 28,204 22%
- Legal and Accounting 7,589 9,305 23%
- Architecture and Design 3,862 4,887 27%
- Computer Systems Design 3,689 3,979 8%
Administrative, Waste Management 8,277 8,857 7%
Educational 2,330 3,986 71%
Health Care, Social Assistance 17,361 23,820 37%
Arts, Entertainment, Recreation 4,044 6,322 56%
- Performing Arts Companies 906 1,036 14%
Accommodation, Food 14,378 23,227 62%
- Hotels and Motels 355 641 81%
- Food Services and Drinking Places 12,958 21,192 64%
*Statistics are for working age population (19-65). ºInflation Adjusted.

NEIGHBORHOOD ECONOMIC PROFILES 7
EDUCATION 2000 2015 % Change
Bachelor's Degree or Higher (age 25+)
1,454,196 2,190,334 51%
Percentage of Population with Bachelor's or Higher (age 25+)
28% 37% --
Associates Degree (age 25+) 274,772 356,240 30%
LAND USE 2002 2016 % Change
Tax lots devoted to Mixed-Use Residential/Commercial
47,263 51,912 10%
Tax lots devoted to Office Buildings 5,524 6,243 13%
Tax lots devoted to Standalone Retail 18,265 19,260 5%
WORK PLACE* 2000 2015 % Change
Work Inside NYC 2,800,772 3,541,291 26%
Percentage of Employed Working Inside NYC
92% 93% --
Work Inside Home Borough 1,600,038 2,064,215 29%
Percentage of Employed Working Inside Home Borough
52% 54% --
COMMUTE* 2000 2015 % Change
Commute Time (min) 40.1 40.8 2%
Public Transit 1,571,593 2,197,950 40%
Private Car or Taxi 1,063,173 1,037,051 -2%
Walk or Bike 324,048 430,290 33%
Work at Home 84,971 141,224 66%
AGE 2000 2015 % Change
Total Population 8,004,759 8,551,938 7%
Youth (Age 0-18) 2,028,144 1,894,933 -7%
Working Age Population (age 19-65)
5,087,174 5,612,108 10%
Seniors (age 66+) 889,441 1,044,897 17%
RACE 2000 2015 % Change
White 2,810,842 2,743,091 -2%
Black 1,951,027 1,878,755 -4%
Hispanic 2,150,965 2,484,880 16%
Asian 783,689 1,202,800 53%
BIRTH PLACE 2000 2015 % Change
Born inside the United States
4,761,976 5,029,494 6%
Born outside the United States
3,242,783 3,522,444 9%
New York City

8 NEW YORK CITY COMPTROLLER SCOTT M. STRINGER
UNEMPLOYMENT RATE IN 2015*
10.3%down from 13.5% in 2000
NUMBER OF BUSINESSES
17,705up 26% from 2000 to 2015
MEDIAN HOUSEHOLD INCOME
$35,000
NEIGHBORHOOD ECONOMIC PROFILE
Bronx
EMPLOYMENT* 2000 2015 % Change
Employed 413,360 575,615 39%
Unemployed 64,441 66,163 3%
Unemployment Rate 13.5% 10.3% --
Out of School & Work (age 18-24) 46,258 38,323 -17%
% Out of School & Work (age 18-24) 33% 24% --
INDIVIDUAL INCOME*º 2000 2015 % Change
$25,000 or less 453,787 590,184 30%
$25,001 - $50,000 197,501 197,845 0%
$50,001 - $75,000 83,756 70,548 -16%
$75,001+ 57,815 57,204 -1%
NUMBER OF BUSINESSES 2000 2015 % Change
Construction 921 1,176 28%
Manufacturing 482 327 -32%
Wholesale Trade 722 699 -3%
Retail Trade 3,139 4,182 33%
- Supermarkets (with 10+ Employees) 93 148 59%
Transportation, Warehousing 268 432 61%
Information 129 204 58%
Finance, Insurance 367 468 28%
- Retail Banks 116 152 31%
Real Estate, Rental, Leasing 2,012 2,217 10%
Professional, Scientific, Technical 473 686 45%
- Legal and Accounting 248 413 67%
- Architecture and Design 48 60 25%
- Computer Systems Design 40 43 8%
Administrative, Waste Management 396 451 14%
Educational 200 296 48%
Health Care, Social Assistance 1,663 2,346 41%
Arts, Entertainment, Recreation 130 146 12%
- Performing Arts Companies 11 7 -36%
Accommodation, Food 1,047 1,846 76%
- Hotels and Motels 21 31 48%
- Food Services and Drinking Places 958 1,728 80%
*Statistics are for working age population (19-65). ºInflation Adjusted.
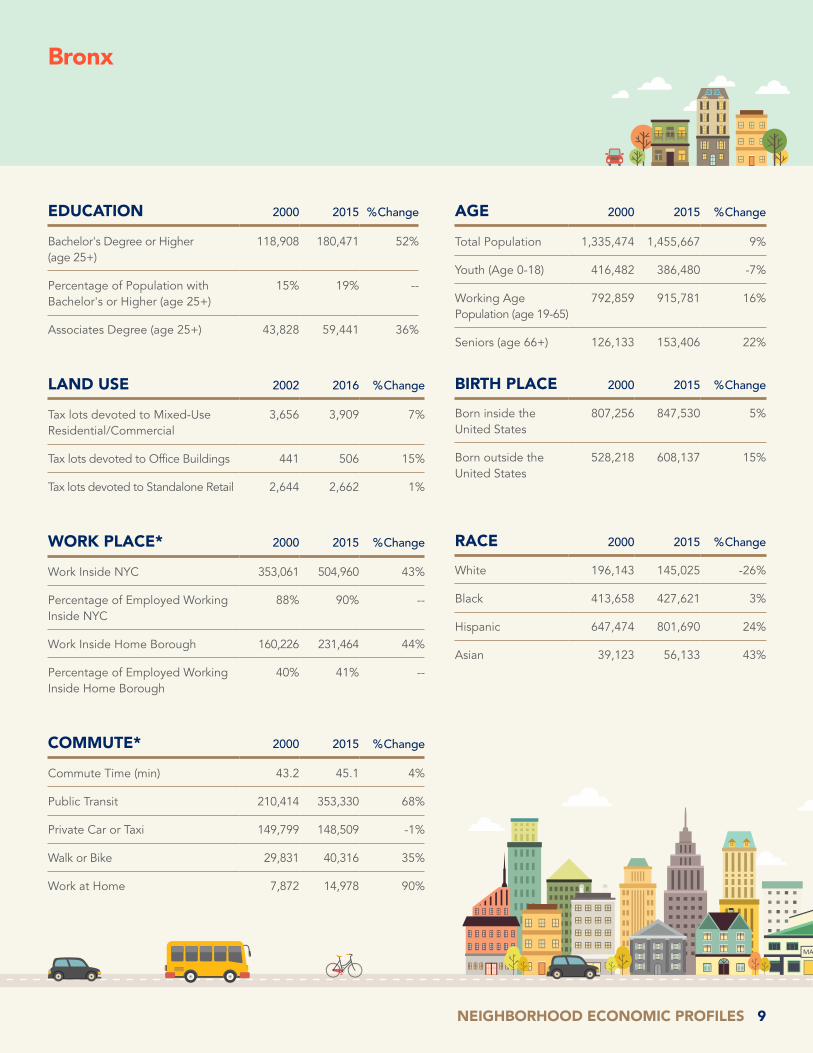
NEIGHBORHOOD ECONOMIC PROFILES 9
EDUCATION 2000 2015 % Change
Bachelor's Degree or Higher (age 25+)
118,908 180,471 52%
Percentage of Population with Bachelor's or Higher (age 25+)
15% 19% --
Associates Degree (age 25+) 43,828 59,441 36%
LAND USE 2002 2016 % Change
Tax lots devoted to Mixed-Use Residential/Commercial
3,656 3,909 7%
Tax lots devoted to Office Buildings 441 506 15%
Tax lots devoted to Standalone Retail 2,644 2,662 1%
WORK PLACE* 2000 2015 % Change
Work Inside NYC 353,061 504,960 43%
Percentage of Employed Working Inside NYC
88% 90% --
Work Inside Home Borough 160,226 231,464 44%
Percentage of Employed Working Inside Home Borough
40% 41% --
COMMUTE* 2000 2015 % Change
Commute Time (min) 43.2 45.1 4%
Public Transit 210,414 353,330 68%
Private Car or Taxi 149,799 148,509 -1%
Walk or Bike 29,831 40,316 35%
Work at Home 7,872 14,978 90%
AGE 2000 2015 % Change
Total Population 1,335,474 1,455,667 9%
Youth (Age 0-18) 416,482 386,480 -7%
Working Age Population (age 19-65)
792,859 915,781 16%
Seniors (age 66+) 126,133 153,406 22%
RACE 2000 2015 % Change
White 196,143 145,025 -26%
Black 413,658 427,621 3%
Hispanic 647,474 801,690 24%
Asian 39,123 56,133 43%
BIRTH PLACE 2000 2015 % Change
Born inside the United States
807,256 847,530 5%
Born outside the United States
528,218 608,137 15%
Bronx

10 NEW YORK CITY COMPTROLLER SCOTT M. STRINGER
UNEMPLOYMENT RATE IN 2015*
10.8%down from 23.6% in 2000
NUMBER OF BUSINESSES
3,491up 31% from 2000 to 2015
MEDIAN HOUSEHOLD INCOME
$25,000ranked 55 out of 55 neighborhoods
BX01 & BX02
NEIGHBORHOOD ECONOMIC PROFILE
Hunts Point, Longwood & Melrose
EMPLOYMENT* 2000 2015 % Change
Employed 28,451 54,976 93%
Unemployed 8,784 6,678 -24%
Unemployment Rate 23.6% 10.8% --
Out of School & Work (age 18-24) 8,409 7,544 -10%
% Out of School & Work (age 18-24) 46% 37% --
INDIVIDUAL INCOME*º 2000 2015 % Change
$25,000 or less 62,753 76,115 21%
$25,001 - $50,000 16,390 19,266 18%
$50,001 - $75,000 4,301 4,585 7%
$75,001+ 2,053 3,097 51%
NUMBER OF BUSINESSES 2000 2015 % Change
Construction 161 212 32%
Manufacturing 208 146 -30%
Wholesale Trade 333 352 6%
Retail Trade 567 797 41%
- Supermarkets (with 10+ Employees) 11 21 91%
Transportation, Warehousing 94 151 61%
Information 13 33 154%
Finance, Insurance 51 75 47%
- Retail Banks 19 24 26%
Real Estate, Rental, Leasing 280 358 28%
Professional, Scientific, Technical 99 125 26%
- Legal and Accounting 67 84 25%
- Architecture and Design 7 9 29%
- Computer Systems Design 1 5 400%
Administrative, Waste Management 83 109 31%
Educational 30 54 80%
Health Care, Social Assistance 233 379 63%
Arts, Entertainment, Recreation 11 23 109%
- Performing Arts Companies 1 1 0%
Accommodation, Food 150 311 107%
- Hotels and Motels 0 6 N/A
- Food Services and Drinking Places 145 295 103%
*Statistics are for working age population (19-65). ºInflation Adjusted.

NEIGHBORHOOD ECONOMIC PROFILES 11
EDUCATION 2000 2015 % Change
Bachelor's Degree or Higher (age 25+)
3,779 11,802 212%
Percentage of Population with Bachelor's or Higher (age 25+)
5% 12% --
Associates Degree (age 25+) 2,679 4,318 61%
LAND USE 2002 2016 % Change
Tax lots devoted to Mixed-Use Residential/Commercial
589 678 15%
Tax lots devoted to Office Buildings 72 86 19%
Tax lots devoted to Standalone Retail 359 352 -2%
WORK PLACE* 2000 2015 % Change
Work Inside NYC 26,012 49,841 92%
Percentage of Employed Working Inside NYC
94% 94% --
Work Inside Home Borough 12,573 20,820 66%
Percentage of Employed Working Inside Home Borough
46% 39% --
COMMUTE* 2000 2015 % Change
Commute Time (min) 42.5 46.9 10%
Public Transit 16,239 37,886 133%
Private Car or Taxi 6,622 9,544 44%
Walk or Bike 3,790 4,006 6%
Work at Home 719 1,588 121%
AGE 2000 2015 % Change
Total Population 142,204 165,490 16%
Youth (Age 0-18) 48,313 48,680 1%
Working Age Population (age 19-65)
85,497 103,063 21%
Seniors (age 66+) 8,394 13,747 64%
RACE 2000 2015 % Change
White 3,269 3,608 10%
Black 38,481 48,264 25%
Hispanic 97,089 109,857 13%
Asian 1,009 1,565 55%
BIRTH PLACE 2000 2015 % Change
Born inside the United States
85,813 98,228 14%
Born outside the United States
56,391 67,262 19%
BX01 & BX02 | Hunts Point, Longwood & Melrose
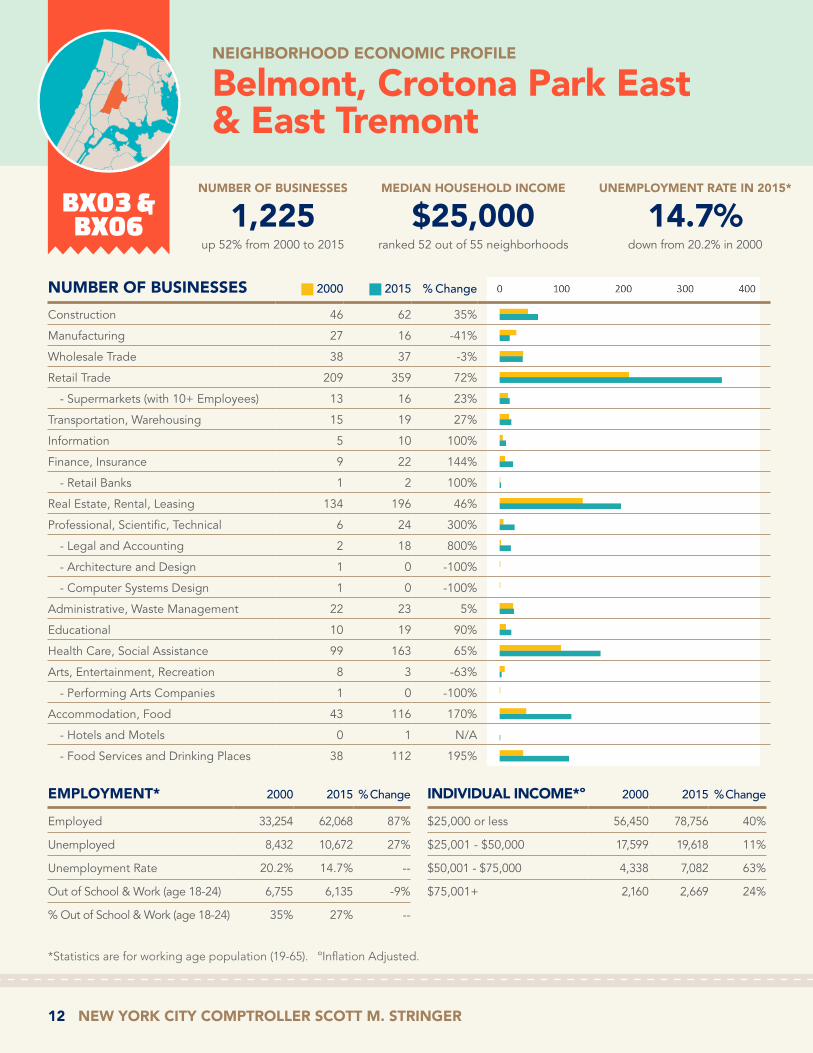
12 NEW YORK CITY COMPTROLLER SCOTT M. STRINGER
UNEMPLOYMENT RATE IN 2015*
14.7%down from 20.2% in 2000
NUMBER OF BUSINESSES
1,225up 52% from 2000 to 2015
MEDIAN HOUSEHOLD INCOME
$25,000ranked 52 out of 55 neighborhoods
BX03 & BX06
NEIGHBORHOOD ECONOMIC PROFILE
Belmont, Crotona Park East & East Tremont
EMPLOYMENT* 2000 2015 % Change
Employed 33,254 62,068 87%
Unemployed 8,432 10,672 27%
Unemployment Rate 20.2% 14.7% --
Out of School & Work (age 18-24) 6,755 6,135 -9%
% Out of School & Work (age 18-24) 35% 27% --
INDIVIDUAL INCOME*º 2000 2015 % Change
$25,000 or less 56,450 78,756 40%
$25,001 - $50,000 17,599 19,618 11%
$50,001 - $75,000 4,338 7,082 63%
$75,001+ 2,160 2,669 24%
NUMBER OF BUSINESSES 2000 2015 % Change
Construction 46 62 35%
Manufacturing 27 16 -41%
Wholesale Trade 38 37 -3%
Retail Trade 209 359 72%
- Supermarkets (with 10+ Employees) 13 16 23%
Transportation, Warehousing 15 19 27%
Information 5 10 100%
Finance, Insurance 9 22 144%
- Retail Banks 1 2 100%
Real Estate, Rental, Leasing 134 196 46%
Professional, Scientific, Technical 6 24 300%
- Legal and Accounting 2 18 800%
- Architecture and Design 1 0 -100%
- Computer Systems Design 1 0 -100%
Administrative, Waste Management 22 23 5%
Educational 10 19 90%
Health Care, Social Assistance 99 163 65%
Arts, Entertainment, Recreation 8 3 -63%
- Performing Arts Companies 1 0 -100%
Accommodation, Food 43 116 170%
- Hotels and Motels 0 1 N/A
- Food Services and Drinking Places 38 112 195%
*Statistics are for working age population (19-65). ºInflation Adjusted.

NEIGHBORHOOD ECONOMIC PROFILES 13
EDUCATION 2000 2015 % Change
Bachelor's Degree or Higher (age 25+)
5,554 13,257 139%
Percentage of Population with Bachelor's or Higher (age 25+)
8% 13% --
Associates Degree (age 25+) 3,589 6,227 74%
LAND USE 2002 2016 % Change
Tax lots devoted to Mixed-Use Residential/Commercial
610 699 15%
Tax lots devoted to Office Buildings 38 47 24%
Tax lots devoted to Standalone Retail 336 321 -4%
WORK PLACE* 2000 2015 % Change
Work Inside NYC 29,261 57,169 95%
Percentage of Employed Working Inside NYC
91% 95% --
Work Inside Home Borough 14,535 30,037 107%
Percentage of Employed Working Inside Home Borough
45% 50% --
COMMUTE* 2000 2015 % Change
Commute Time (min) 44.5 43.2 -3%
Public Transit 18,955 38,521 103%
Private Car or Taxi 8,780 14,980 71%
Walk or Bike 3,616 4,966 37%
Work at Home 474 1,561 229%
AGE 2000 2015 % Change
Total Population 140,777 175,359 25%
Youth (Age 0-18) 50,608 53,267 5%
Working Age Population (age 19-65)
80,547 108,125 34%
Seniors (age 66+) 9,622 13,967 45%
RACE 2000 2015 % Change
White 7,756 7,676 -1%
Black 48,249 51,669 7%
Hispanic 81,114 112,568 39%
Asian 990 1,206 22%
BIRTH PLACE 2000 2015 % Change
Born inside the United States
89,792 110,617 23%
Born outside the United States
50,985 64,742 27%
BX03 & BX06 | Belmont, Crotona Park East & East Tremont

14 NEW YORK CITY COMPTROLLER SCOTT M. STRINGER
UNEMPLOYMENT RATE IN 2015*
7.0%down from 16.6% in 2000
NUMBER OF BUSINESSES
768up 45% from 2000 to 2015
MEDIAN HOUSEHOLD INCOME
$25,000ranked 54 out of 55 neighborhoods
BX04
NEIGHBORHOOD ECONOMIC PROFILE
Concourse, Highbridge & Mount Eden
EMPLOYMENT* 2000 2015 % Change
Employed 35,558 58,670 65%
Unemployed 7,065 4,410 -38%
Unemployment Rate 16.6% 7.0% --
Out of School & Work (age 18-24) 5,118 3,598 -30%
% Out of School & Work (age 18-24) 39% 20% --
INDIVIDUAL INCOME*º 2000 2015 % Change
$25,000 or less 50,498 71,149 41%
$25,001 - $50,000 17,831 19,263 8%
$50,001 - $75,000 4,517 4,626 2%
$75,001+ 2,547 3,276 29%
NUMBER OF BUSINESSES 2000 2015 % Change
Construction 10 31 210%
Manufacturing 8 6 -25%
Wholesale Trade 8 9 13%
Retail Trade 157 240 53%
- Supermarkets (with 10+ Employees) 2 11 450%
Transportation, Warehousing 7 17 143%
Information 4 4 0%
Finance, Insurance 15 19 27%
- Retail Banks 4 4 0%
Real Estate, Rental, Leasing 91 108 19%
Professional, Scientific, Technical 21 16 -24%
- Legal and Accounting 15 12 -20%
- Architecture and Design 1 1 0%
- Computer Systems Design 2 1 -50%
Administrative, Waste Management 13 10 -23%
Educational 5 12 140%
Health Care, Social Assistance 56 92 64%
Arts, Entertainment, Recreation 2 1 -50%
- Performing Arts Companies 1 0 -100%
Accommodation, Food 37 87 135%
- Hotels and Motels 1 1 0%
- Food Services and Drinking Places 33 82 148%
*Statistics are for working age population (19-65). ºInflation Adjusted.

NEIGHBORHOOD ECONOMIC PROFILES 15
EDUCATION 2000 2015 % Change
Bachelor's Degree or Higher (age 25+)
5,685 14,162 149%
Percentage of Population with Bachelor's or Higher (age 25+)
8% 15% --
Associates Degree (age 25+) 3,912 4,426 13%
LAND USE 2002 2016 % Change
Tax lots devoted to Mixed-Use Residential/Commercial
301 317 5%
Tax lots devoted to Office Buildings 15 17 13%
Tax lots devoted to Standalone Retail 178 180 1%
WORK PLACE* 2000 2015 % Change
Work Inside NYC 31,107 54,321 75%
Percentage of Employed Working Inside NYC
91% 94% --
Work Inside Home Borough 12,922 22,463 74%
Percentage of Employed Working Inside Home Borough
38% 39% --
COMMUTE* 2000 2015 % Change
Commute Time (min) 43.2 40.7 -6%
Public Transit 20,860 41,645 100%
Private Car or Taxi 9,382 9,529 2%
Walk or Bike 3,053 5,822 91%
Work at Home 743 621 -16%
AGE 2000 2015 % Change
Total Population 130,582 154,021 18%
Youth (Age 0-18) 46,277 43,683 -6%
Working Age Population (age 19-65)
75,393 98,314 30%
Seniors (age 66+) 8,912 12,024 35%
RACE 2000 2015 % Change
White 1,975 3,522 78%
Black 47,098 42,365 -10%
Hispanic 76,263 101,561 33%
Asian 1,794 3,038 69%
BIRTH PLACE 2000 2015 % Change
Born inside the United States
71,329 77,640 9%
Born outside the United States
59,253 76,381 29%
BX04 | Concourse, Highbridge & Mount Eden

16 NEW YORK CITY COMPTROLLER SCOTT M. STRINGER
UNEMPLOYMENT RATE IN 2015*
6.8%down from 18.6% in 2000
NUMBER OF BUSINESSES
1,549up 37% from 2000 to 2015
MEDIAN HOUSEHOLD INCOME
$25,000ranked 53 out of 55 neighborhoods
BX05
NEIGHBORHOOD ECONOMIC PROFILE
Morris Heights, Fordham South & Mount Hope
EMPLOYMENT* 2000 2015 % Change
Employed 37,648 55,187 47%
Unemployed 8,596 4,028 -53%
Unemployment Rate 18.6% 6.8% --
Out of School & Work (age 18-24) 6,171 3,979 -36%
% Out of School & Work (age 18-24) 40% 24% --
INDIVIDUAL INCOME*º 2000 2015 % Change
$25,000 or less 54,271 64,881 20%
$25,001 - $50,000 18,132 19,633 8%
$50,001 - $75,000 4,794 3,822 -20%
$75,001+ 2,486 1,752 -30%
NUMBER OF BUSINESSES 2000 2015 % Change
Construction 45 61 36%
Manufacturing 25 20 -20%
Wholesale Trade 57 49 -14%
Retail Trade 285 431 51%
- Supermarkets (with 10+ Employees) 8 16 100%
Transportation, Warehousing 18 25 39%
Information 11 14 27%
Finance, Insurance 27 32 19%
- Retail Banks 5 8 60%
Real Estate, Rental, Leasing 203 247 22%
Professional, Scientific, Technical 13 38 192%
- Legal and Accounting 4 26 550%
- Architecture and Design 2 1 -50%
- Computer Systems Design 0 5 N/A
Administrative, Waste Management 25 22 -12%
Educational 19 25 32%
Health Care, Social Assistance 143 223 56%
Arts, Entertainment, Recreation 1 1 0%
- Performing Arts Companies 0 0 N/A
Accommodation, Food 78 151 94%
- Hotels and Motels 1 3 200%
- Food Services and Drinking Places 68 136 100%
*Statistics are for working age population (19-65). ºInflation Adjusted.

NEIGHBORHOOD ECONOMIC PROFILES 17
EDUCATION 2000 2015 % Change
Bachelor's Degree or Higher (age 25+)
6,075 11,285 86%
Percentage of Population with Bachelor's or Higher (age 25+)
8% 13% --
Associates Degree (age 25+) 3,662 5,571 52%
LAND USE 2002 2016 % Change
Tax lots devoted to Mixed-Use Residential/Commercial
247 259 5%
Tax lots devoted to Office Buildings 17 22 29%
Tax lots devoted to Standalone Retail 197 202 3%
WORK PLACE* 2000 2015 % Change
Work Inside NYC 32,818 50,712 55%
Percentage of Employed Working Inside NYC
91% 93% --
Work Inside Home Borough 14,281 24,665 73%
Percentage of Employed Working Inside Home Borough
40% 45% --
COMMUTE* 2000 2015 % Change
Commute Time (min) 43.9 40.5 -8%
Public Transit 22,600 38,440 70%
Private Car or Taxi 9,487 10,616 12%
Walk or Bike 2,595 3,586 38%
Work at Home 1,018 1,715 68%
AGE 2000 2015 % Change
Total Population 136,018 144,081 6%
Youth (Age 0-18) 50,441 45,249 -10%
Working Age Population (age 19-65)
79,683 90,088 13%
Seniors (age 66+) 5,894 8,744 48%
RACE 2000 2015 % Change
White 2,102 1,073 -49%
Black 43,488 42,840 -1%
Hispanic 83,751 96,809 16%
Asian 2,166 1,540 -29%
BIRTH PLACE 2000 2015 % Change
Born inside the United States
73,002 73,820 1%
Born outside the United States
63,016 70,261 11%
BX05 | Morris Heights, Fordham South & Mount Hope

18 NEW YORK CITY COMPTROLLER SCOTT M. STRINGER
UNEMPLOYMENT RATE IN 2015*
14.5%up from 14.4% in 2000
NUMBER OF BUSINESSES
3,067up 20% from 2000 to 2015
MEDIAN HOUSEHOLD INCOME
$32,260ranked 49 out of 55 neighborhoods
BX07
NEIGHBORHOOD ECONOMIC PROFILE
Bedford Park, Fordham North & Norwood
EMPLOYMENT* 2000 2015 % Change
Employed 40,534 54,449 34%
Unemployed 6,813 9,206 35%
Unemployment Rate 14.4% 14.5% --
Out of School & Work (age 18-24) 4,697 3,711 -21%
% Out of School & Work (age 18-24) 32% 26% --
INDIVIDUAL INCOME*º 2000 2015 % Change
$25,000 or less 46,916 56,560 21%
$25,001 - $50,000 19,862 21,234 7%
$50,001 - $75,000 7,426 5,179 -30%
$75,001+ 3,755 3,066 -18%
NUMBER OF BUSINESSES 2000 2015 % Change
Construction 113 146 29%
Manufacturing 44 28 -36%
Wholesale Trade 56 44 -21%
Retail Trade 644 852 32%
- Supermarkets (with 10+ Employees) 17 31 82%
Transportation, Warehousing 25 36 44%
Information 18 33 83%
Finance, Insurance 66 91 38%
- Retail Banks 25 29 16%
Real Estate, Rental, Leasing 578 530 -8%
Professional, Scientific, Technical 70 81 16%
- Legal and Accounting 42 52 24%
- Architecture and Design 6 5 -17%
- Computer Systems Design 3 5 67%
Administrative, Waste Management 64 69 8%
Educational 38 48 26%
Health Care, Social Assistance 278 401 44%
Arts, Entertainment, Recreation 18 23 28%
- Performing Arts Companies 2 3 50%
Accommodation, Food 207 343 66%
- Hotels and Motels 2 3 50%
- Food Services and Drinking Places 195 325 67%
*Statistics are for working age population (19-65). ºInflation Adjusted.

NEIGHBORHOOD ECONOMIC PROFILES 19
EDUCATION 2000 2015 % Change
Bachelor's Degree or Higher (age 25+)
11,989 14,231 19%
Percentage of Population with Bachelor's or Higher (age 25+)
16% 17% --
Associates Degree (age 25+) 4,041 4,222 4%
LAND USE 2002 2016 % Change
Tax lots devoted to Mixed-Use Residential/Commercial
289 312 8%
Tax lots devoted to Office Buildings 38 38 0%
Tax lots devoted to Standalone Retail 226 218 -4%
WORK PLACE* 2000 2015 % Change
Work Inside NYC 34,357 48,185 40%
Percentage of Employed Working Inside NYC
88% 91% --
Work Inside Home Borough 15,444 19,007 23%
Percentage of Employed Working Inside Home Borough
40% 36% --
COMMUTE* 2000 2015 % Change
Commute Time (min) 40.8 46.6 14%
Public Transit 22,736 36,720 62%
Private Car or Taxi 11,046 9,931 -10%
Walk or Bike 4,083 4,892 20%
Work at Home 863 1,371 59%
AGE 2000 2015 % Change
Total Population 131,430 130,042 -1%
Youth (Age 0-18) 43,960 33,747 -23%
Working Age Population (age 19-65)
77,959 86,039 10%
Seniors (age 66+) 9,511 10,256 8%
RACE 2000 2015 % Change
White 14,856 9,345 -37%
Black 23,776 18,419 -23%
Hispanic 78,690 91,988 17%
Asian 9,602 7,041 -27%
BIRTH PLACE 2000 2015 % Change
Born inside the United States
68,187 64,987 -5%
Born outside the United States
63,243 65,055 3%
BX07 | Bedford Park, Fordham North & Norwood

20 NEW YORK CITY COMPTROLLER SCOTT M. STRINGER
UNEMPLOYMENT RATE IN 2015*
7.9%down from 9.2% in 2000
NUMBER OF BUSINESSES
1,573up 19% from 2000 to 2015
MEDIAN HOUSEHOLD INCOME
$64,400ranked 17 out of 55 neighborhoods
BX08
NEIGHBORHOOD ECONOMIC PROFILE
Riverdale, Fieldston & Kingsbridge
EMPLOYMENT* 2000 2015 % Change
Employed 39,679 48,723 23%
Unemployed 4,031 4,155 3%
Unemployment Rate 9.2% 7.9% --
Out of School & Work (age 18-24) 2,068 1,262 -39%
% Out of School & Work (age 18-24) 23% 14% --
INDIVIDUAL INCOME*º 2000 2015 % Change
$25,000 or less 27,999 35,074 25%
$25,001 - $50,000 14,177 12,732 -10%
$50,001 - $75,000 9,850 7,923 -20%
$75,001+ 11,212 12,195 9%
NUMBER OF BUSINESSES 2000 2015 % Change
Construction 63 74 17%
Manufacturing 17 8 -53%
Wholesale Trade 42 28 -33%
Retail Trade 194 196 1%
- Supermarkets (with 10+ Employees) 7 9 29%
Transportation, Warehousing 11 14 27%
Information 21 25 19%
Finance, Insurance 34 43 26%
- Retail Banks 14 17 21%
Real Estate, Rental, Leasing 201 277 38%
Professional, Scientific, Technical 78 114 46%
- Legal and Accounting 18 38 111%
- Architecture and Design 8 12 50%
- Computer Systems Design 15 13 -13%
Administrative, Waste Management 44 58 32%
Educational 27 40 48%
Health Care, Social Assistance 200 251 26%
Arts, Entertainment, Recreation 24 27 13%
- Performing Arts Companies 3 1 -67%
Accommodation, Food 109 170 56%
- Hotels and Motels 2 2 0%
- Food Services and Drinking Places 95 152 60%
*Statistics are for working age population (19-65). ºInflation Adjusted.

NEIGHBORHOOD ECONOMIC PROFILES 21
EDUCATION 2000 2015 % Change
Bachelor's Degree or Higher (age 25+)
24,777 34,181 38%
Percentage of Population with Bachelor's or Higher (age 25+)
34% 44% --
Associates Degree (age 25+) 3,557 4,510 27%
LAND USE 2002 2016 % Change
Tax lots devoted to Mixed-Use Residential/Commercial
124 145 17%
Tax lots devoted to Office Buildings 29 30 3%
Tax lots devoted to Standalone Retail 147 158 7%
WORK PLACE* 2000 2015 % Change
Work Inside NYC 33,561 40,028 19%
Percentage of Employed Working Inside NYC
87% 86% --
Work Inside Home Borough 12,740 14,006 10%
Percentage of Employed Working Inside Home Borough
33% 30% --
COMMUTE* 2000 2015 % Change
Commute Time (min) 41 46.4 13%
Public Transit 18,103 27,625 53%
Private Car or Taxi 16,923 12,697 -25%
Walk or Bike 2,569 3,786 47%
Work at Home 862 2,308 168%
AGE 2000 2015 % Change
Total Population 106,386 112,428 6%
Youth (Age 0-18) 26,390 26,647 1%
Working Age Population (age 19-65)
63,238 67,924 7%
Seniors (age 66+) 16,758 17,857 7%
RACE 2000 2015 % Change
White 44,198 39,176 -11%
Black 14,147 17,109 21%
Hispanic 40,432 48,323 20%
Asian 4,670 5,986 28%
BIRTH PLACE 2000 2015 % Change
Born inside the United States
66,841 74,261 11%
Born outside the United States
39,545 38,167 -3%
BX08 | Riverdale, Fieldston & Kingsbridge

22 NEW YORK CITY COMPTROLLER SCOTT M. STRINGER
UNEMPLOYMENT RATE IN 2015*
11.4%down from 12.3% in 2000
NUMBER OF BUSINESSES
2,044up 20% from 2000 to 2015
MEDIAN HOUSEHOLD INCOME
$37,400ranked 46 out of 55 neighborhoods
BX09
NEIGHBORHOOD ECONOMIC PROFILE
Castle Hill, Clason Point & Parkchester
EMPLOYMENT* 2000 2015 % Change
Employed 56,946 71,024 25%
Unemployed 8,001 9,174 15%
Unemployment Rate 12.3% 11.4% --
Out of School & Work (age 18-24) 5,580 5,415 -3%
% Out of School & Work (age 18-24) 33% 29% --
INDIVIDUAL INCOME*º 2000 2015 % Change
$25,000 or less 57,635 70,576 22%
$25,001 - $50,000 29,129 24,177 -17%
$50,001 - $75,000 11,892 11,566 -3%
$75,001+ 6,414 5,586 -13%
NUMBER OF BUSINESSES 2000 2015 % Change
Construction 118 130 10%
Manufacturing 38 23 -39%
Wholesale Trade 71 64 -10%
Retail Trade 443 543 23%
- Supermarkets (with 10+ Employees) 16 19 19%
Transportation, Warehousing 35 71 103%
Information 16 34 113%
Finance, Insurance 43 63 47%
- Retail Banks 14 24 71%
Real Estate, Rental, Leasing 232 201 -13%
Professional, Scientific, Technical 47 80 70%
- Legal and Accounting 24 58 142%
- Architecture and Design 5 8 60%
- Computer Systems Design 9 2 -78%
Administrative, Waste Management 39 45 15%
Educational 28 34 21%
Health Care, Social Assistance 200 232 16%
Arts, Entertainment, Recreation 16 17 6%
- Performing Arts Companies 0 0 N/A
Accommodation, Food 135 230 70%
- Hotels and Motels 0 0 N/A
- Food Services and Drinking Places 133 224 68%
*Statistics are for working age population (19-65). ºInflation Adjusted.

NEIGHBORHOOD ECONOMIC PROFILES 23
EDUCATION 2000 2015 % Change
Bachelor's Degree or Higher (age 25+)
13,378 16,911 26%
Percentage of Population with Bachelor's or Higher (age 25+)
13% 15% --
Associates Degree (age 25+) 6,689 7,274 9%
LAND USE 2002 2016 % Change
Tax lots devoted to Mixed-Use Residential/Commercial
299 290 -3%
Tax lots devoted to Office Buildings 25 34 36%
Tax lots devoted to Standalone Retail 244 262 7%
WORK PLACE* 2000 2015 % Change
Work Inside NYC 51,149 62,024 21%
Percentage of Employed Working Inside NYC
92% 91% --
Work Inside Home Borough 21,806 28,708 32%
Percentage of Employed Working Inside Home Borough
39% 42% --
COMMUTE* 2000 2015 % Change
Commute Time (min) 46.4 45 -3%
Public Transit 30,593 43,429 42%
Private Car or Taxi 20,241 19,305 -5%
Walk or Bike 3,277 4,289 31%
Work at Home 893 997 12%
AGE 2000 2015 % Change
Total Population 175,216 178,262 2%
Youth (Age 0-18) 54,580 45,351 -17%
Working Age Population (age 19-65)
105,070 111,905 7%
Seniors (age 66+) 15,566 21,006 35%
RACE 2000 2015 % Change
White 8,470 7,790 -8%
Black 55,569 49,293 -11%
Hispanic 97,620 102,928 5%
Asian 7,250 16,059 122%
BIRTH PLACE 2000 2015 % Change
Born inside the United States
108,239 105,044 -3%
Born outside the United States
66,977 73,218 9%
BX09 | Castle Hill, Clason Point & Parkchester

24 NEW YORK CITY COMPTROLLER SCOTT M. STRINGER
UNEMPLOYMENT RATE IN 2015*
8.7%up from 6.1% in 2000
NUMBER OF BUSINESSES
2,365up 21% from 2000 to 2015
MEDIAN HOUSEHOLD INCOME
$48,700ranked 31 out of 55 neighborhoods
BX10
NEIGHBORHOOD ECONOMIC PROFILE
Co-op City, Pelham Bay & Schuylerville
EMPLOYMENT* 2000 2015 % Change
Employed 45,186 50,040 11%
Unemployed 2,957 4,742 60%
Unemployment Rate 6.1% 8.7% --
Out of School & Work (age 18-24) 1,907 1,581 -17%
% Out of School & Work (age 18-24) 20% 14% --
INDIVIDUAL INCOME*º 2000 2015 % Change
$25,000 or less 25,056 33,302 33%
$25,001 - $50,000 17,918 17,677 -1%
$50,001 - $75,000 13,596 8,735 -36%
$75,001+ 10,873 11,450 5%
NUMBER OF BUSINESSES 2000 2015 % Change
Construction 199 244 23%
Manufacturing 58 39 -33%
Wholesale Trade 68 79 16%
Retail Trade 373 426 14%
- Supermarkets (with 10+ Employees) 12 15 25%
Transportation, Warehousing 37 50 35%
Information 26 33 27%
Finance, Insurance 72 76 6%
- Retail Banks 24 32 33%
Real Estate, Rental, Leasing 156 190 22%
Professional, Scientific, Technical 90 127 41%
- Legal and Accounting 45 73 62%
- Architecture and Design 14 15 7%
- Computer Systems Design 5 6 20%
Administrative, Waste Management 62 79 27%
Educational 19 40 111%
Health Care, Social Assistance 286 379 33%
Arts, Entertainment, Recreation 39 38 -3%
- Performing Arts Companies 2 2 0%
Accommodation, Food 181 264 46%
- Hotels and Motels 7 6 -14%
- Food Services and Drinking Places 161 243 51%
*Statistics are for working age population (19-65). ºInflation Adjusted.
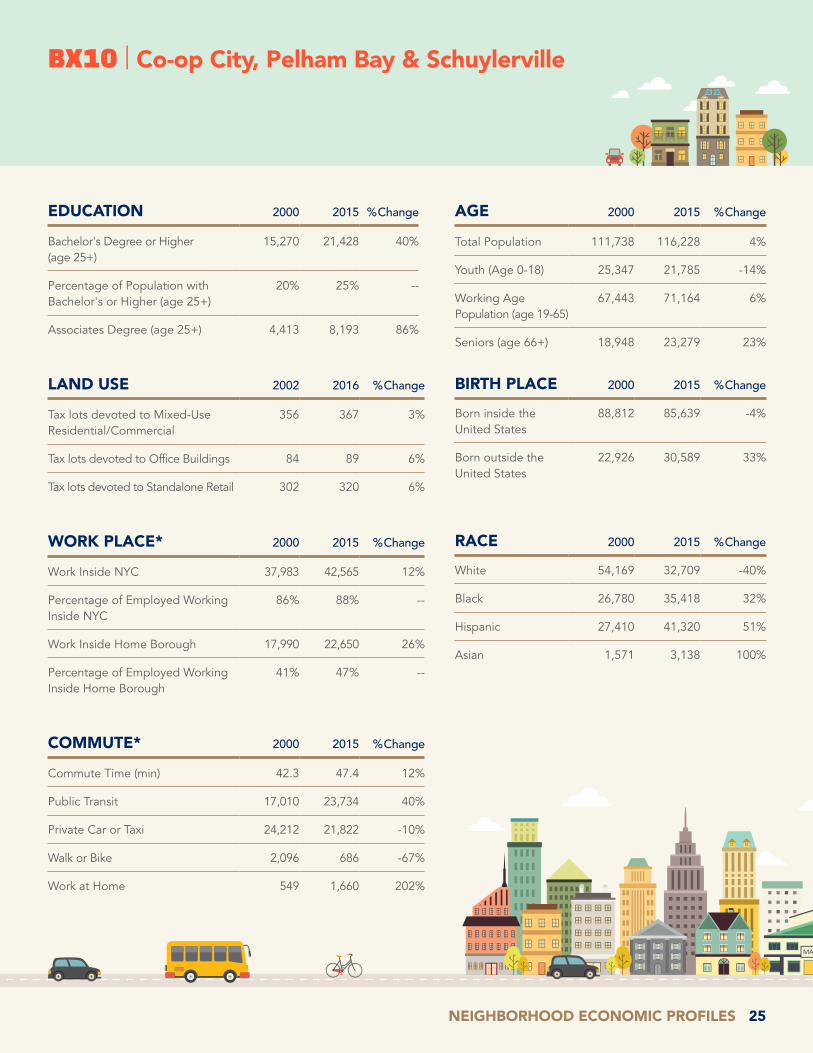
NEIGHBORHOOD ECONOMIC PROFILES 25
EDUCATION 2000 2015 % Change
Bachelor's Degree or Higher (age 25+)
15,270 21,428 40%
Percentage of Population with Bachelor's or Higher (age 25+)
20% 25% --
Associates Degree (age 25+) 4,413 8,193 86%
LAND USE 2002 2016 % Change
Tax lots devoted to Mixed-Use Residential/Commercial
356 367 3%
Tax lots devoted to Office Buildings 84 89 6%
Tax lots devoted to Standalone Retail 302 320 6%
WORK PLACE* 2000 2015 % Change
Work Inside NYC 37,983 42,565 12%
Percentage of Employed Working Inside NYC
86% 88% --
Work Inside Home Borough 17,990 22,650 26%
Percentage of Employed Working Inside Home Borough
41% 47% --
COMMUTE* 2000 2015 % Change
Commute Time (min) 42.3 47.4 12%
Public Transit 17,010 23,734 40%
Private Car or Taxi 24,212 21,822 -10%
Walk or Bike 2,096 686 -67%
Work at Home 549 1,660 202%
AGE 2000 2015 % Change
Total Population 111,738 116,228 4%
Youth (Age 0-18) 25,347 21,785 -14%
Working Age Population (age 19-65)
67,443 71,164 6%
Seniors (age 66+) 18,948 23,279 23%
RACE 2000 2015 % Change
White 54,169 32,709 -40%
Black 26,780 35,418 32%
Hispanic 27,410 41,320 51%
Asian 1,571 3,138 100%
BIRTH PLACE 2000 2015 % Change
Born inside the United States
88,812 85,639 -4%
Born outside the United States
22,926 30,589 33%
BX10 | Co-op City, Pelham Bay & Schuylerville

26 NEW YORK CITY COMPTROLLER SCOTT M. STRINGER
UNEMPLOYMENT RATE IN 2015*
10.8%up from 7.5% in 2000
NUMBER OF BUSINESSES
675up 19% from 2000 to 2015
MEDIAN HOUSEHOLD INCOME
$44,400ranked 41 out of 55 neighborhoods
BX11
NEIGHBORHOOD ECONOMIC PROFILE
Pelham Parkway, Morris Park & Laconia
EMPLOYMENT* 2000 2015 % Change
Employed 44,424 56,741 28%
Unemployed 3,583 6,853 91%
Unemployment Rate 7.5% 10.8% --
Out of School & Work (age 18-24) 2,056 2,391 16%
% Out of School & Work (age 18-24) 18% 18% --
INDIVIDUAL INCOME*º 2000 2015 % Change
$25,000 or less 34,329 52,064 52%
$25,001 - $50,000 21,768 19,822 -9%
$50,001 - $75,000 10,300 8,623 -16%
$75,001+ 7,869 6,178 -21%
NUMBER OF BUSINESSES 2000 2015 % Change
Construction 57 86 51%
Manufacturing 16 12 -25%
Wholesale Trade 15 13 -13%
Retail Trade 113 148 31%
- Supermarkets (with 10+ Employees) 4 4 0%
Transportation, Warehousing 12 23 92%
Information 4 4 0%
Finance, Insurance 28 22 -21%
- Retail Banks 4 5 25%
Real Estate, Rental, Leasing 35 26 -26%
Professional, Scientific, Technical 25 41 64%
- Legal and Accounting 15 26 73%
- Architecture and Design 0 3 N/A
- Computer Systems Design 2 3 50%
Administrative, Waste Management 22 19 -14%
Educational 11 9 -18%
Health Care, Social Assistance 87 114 31%
Arts, Entertainment, Recreation 8 5 -38%
- Performing Arts Companies 1 0 -100%
Accommodation, Food 47 63 34%
- Hotels and Motels 5 5 0%
- Food Services and Drinking Places 38 55 45%
*Statistics are for working age population (19-65). ºInflation Adjusted.

NEIGHBORHOOD ECONOMIC PROFILES 27
EDUCATION 2000 2015 % Change
Bachelor's Degree or Higher (age 25+)
17,380 20,729 19%
Percentage of Population with Bachelor's or Higher (age 25+)
21% 23% --
Associates Degree (age 25+) 4,948 6,426 30%
LAND USE 2002 2016 % Change
Tax lots devoted to Mixed-Use Residential/Commercial
384 383 0%
Tax lots devoted to Office Buildings 83 91 10%
Tax lots devoted to Standalone Retail 262 269 3%
WORK PLACE* 2000 2015 % Change
Work Inside NYC 36,337 49,056 35%
Percentage of Employed Working Inside NYC
85% 89% --
Work Inside Home Borough 19,269 24,035 25%
Percentage of Employed Working Inside Home Borough
45% 43% --
COMMUTE* 2000 2015 % Change
Commute Time (min) 39.1 46 18%
Public Transit 18,523 32,362 75%
Private Car or Taxi 20,205 17,061 -16%
Walk or Bike 3,085 3,931 27%
Work at Home 874 1,982 127%
AGE 2000 2015 % Change
Total Population 121,704 133,779 10%
Youth (Age 0-18) 29,817 31,606 6%
Working Age Population (age 19-65)
74,266 86,687 17%
Seniors (age 66+) 17,621 15,486 -12%
RACE 2000 2015 % Change
White 44,710 27,546 -38%
Black 23,628 30,626 30%
Hispanic 40,361 61,567 53%
Asian 7,876 11,890 51%
BIRTH PLACE 2000 2015 % Change
Born inside the United States
74,183 79,507 7%
Born outside the United States
47,521 54,272 14%
BX11 | Pelham Parkway, Morris Park & Laconia

28 NEW YORK CITY COMPTROLLER SCOTT M. STRINGER
UNEMPLOYMENT RATE IN 2015*
8.9%down from 10.7% in 2000
NUMBER OF BUSINESSES
948up 14% from 2000 to 2015
MEDIAN HOUSEHOLD INCOME
$45,000ranked 36 out of 55 neighborhoods
BX12
NEIGHBORHOOD ECONOMIC PROFILE
Wakefield, Williamsbridge & Woodlawn
EMPLOYMENT* 2000 2015 % Change
Employed 51,680 63,737 23%
Unemployed 6,179 6,245 1%
Unemployment Rate 10.7% 8.9% --
Out of School & Work (age 18-24) 3,497 2,707 -23%
% Out of School & Work (age 18-24) 26% 19% --
INDIVIDUAL INCOME*º 2000 2015 % Change
$25,000 or less 37,880 51,707 37%
$25,001 - $50,000 24,695 24,423 -1%
$50,001 - $75,000 12,742 8,407 -34%
$75,001+ 8,446 7,935 -6%
NUMBER OF BUSINESSES 2000 2015 % Change
Construction 109 130 19%
Manufacturing 41 29 -29%
Wholesale Trade 34 24 -29%
Retail Trade 154 190 23%
- Supermarkets (with 10+ Employees) 3 6 100%
Transportation, Warehousing 14 26 86%
Information 11 14 27%
Finance, Insurance 22 25 14%
- Retail Banks 6 7 17%
Real Estate, Rental, Leasing 102 84 -18%
Professional, Scientific, Technical 24 40 67%
- Legal and Accounting 16 26 63%
- Architecture and Design 4 6 50%
- Computer Systems Design 2 3 50%
Administrative, Waste Management 22 17 -23%
Educational 13 15 15%
Health Care, Social Assistance 81 112 38%
Arts, Entertainment, Recreation 3 8 167%
- Performing Arts Companies 0 0 N/A
Accommodation, Food 60 111 85%
- Hotels and Motels 3 4 33%
- Food Services and Drinking Places 52 104 100%
*Statistics are for working age population (19-65). ºInflation Adjusted.

NEIGHBORHOOD ECONOMIC PROFILES 29
EDUCATION 2000 2015 % Change
Bachelor's Degree or Higher (age 25+)
15,021 22,485 50%
Percentage of Population with Bachelor's or Higher (age 25+)
17% 23% --
Associates Degree (age 25+) 6,338 8,274 31%
LAND USE 2002 2016 % Change
Tax lots devoted to Mixed-Use Residential/Commercial
457 459 0%
Tax lots devoted to Office Buildings 40 52 30%
Tax lots devoted to Standalone Retail 393 380 -3%
WORK PLACE* 2000 2015 % Change
Work Inside NYC 40,476 51,059 26%
Percentage of Employed Working Inside NYC
80% 83% --
Work Inside Home Borough 18,666 25,073 34%
Percentage of Employed Working Inside Home Borough
37% 41% --
COMMUTE* 2000 2015 % Change
Commute Time (min) 46.6 48.5 4%
Public Transit 24,795 32,968 33%
Private Car or Taxi 22,901 23,024 1%
Walk or Bike 1,667 4,352 161%
Work at Home 877 1,175 34%
AGE 2000 2015 % Change
Total Population 139,419 145,977 5%
Youth (Age 0-18) 40,749 36,465 -11%
Working Age Population (age 19-65)
83,763 92,472 10%
Seniors (age 66+) 14,907 17,040 14%
RACE 2000 2015 % Change
White 14,638 12,580 -14%
Black 92,442 91,618 -1%
Hispanic 24,744 34,769 41%
Asian 2,195 4,670 113%
BIRTH PLACE 2000 2015 % Change
Born inside the United States
81,058 77,787 -4%
Born outside the United States
58,361 68,190 17%
BX12 | Wakefield, Williamsbridge & Woodlawn

30 NEW YORK CITY COMPTROLLER SCOTT M. STRINGER
UNEMPLOYMENT RATE IN 2015*
7.7%down from 9.9% in 2000
NUMBER OF BUSINESSES
56,341up 48% from 2000 to 2015
MEDIAN HOUSEHOLD INCOME
$50,200
NEIGHBORHOOD ECONOMIC PROFILE
Brooklyn
EMPLOYMENT* 2000 2015 % Change
Employed 891,613 1,181,172 32%
Unemployed 98,495 98,209 0%
Unemployment Rate 9.9% 7.7% --
Out of School & Work (age 18-24) 65,520 43,181 -34%
% Out of School & Work (age 18-24) 26% 18% --
INDIVIDUAL INCOME*º 2000 2015 % Change
$25,000 or less 795,437 892,168 12%
$25,001 - $50,000 363,011 375,166 3%
$50,001 - $75,000 180,818 189,619 5%
$75,001+ 162,800 237,883 46%
NUMBER OF BUSINESSES 2000 2015 % Change
Construction 2,724 4,123 51%
Manufacturing 2,425 1,796 -26%
Wholesale Trade 3,071 3,707 21%
Retail Trade 7,077 10,605 50%
- Supermarkets (with 10+ Employees) 167 295 77%
Transportation, Warehousing 1,088 1,645 51%
Information 444 1,067 140%
Finance, Insurance 1,002 1,426 42%
- Retail Banks 264 397 50%
Real Estate, Rental, Leasing 3,465 4,774 38%
Professional, Scientific, Technical 2,566 5,060 97%
- Legal and Accounting 911 1,593 75%
- Architecture and Design 293 871 197%
- Computer Systems Design 685 855 25%
Administrative, Waste Management 1,292 1,677 30%
Educational 497 1,088 119%
Health Care, Social Assistance 4,462 6,531 46%
Arts, Entertainment, Recreation 344 976 184%
- Performing Arts Companies 42 116 176%
Accommodation, Food 2,320 5,514 138%
- Hotels and Motels 18 61 239%
- Food Services and Drinking Places 2,153 5,198 141%
*Statistics are for working age population (19-65). ºInflation Adjusted.

NEIGHBORHOOD ECONOMIC PROFILES 31
EDUCATION 2000 2015 % Change
Bachelor's Degree or Higher (age 25+)
342,656 623,380 82%
Percentage of Population with Bachelor's or Higher (age 25+)
22% 35% --
Associates Degree (age 25+) 89,494 103,800 16%
LAND USE 2002 2016 % Change
Tax lots devoted to Mixed-Use Residential/Commercial
21,902 23,124 6%
Tax lots devoted to Office Buildings 1,049 1,361 30%
Tax lots devoted to Standalone Retail 5,560 6,242 12%
WORK PLACE* 2000 2015 % Change
Work Inside NYC 820,719 1,110,530 35%
Percentage of Employed Working Inside NYC
95% 96% --
Work Inside Home Borough 409,559 576,524 41%
Percentage of Employed Working Inside Home Borough
47% 50% --
COMMUTE* 2000 2015 % Change
Commute Time (min) 43.1 42 -3%
Public Transit 491,158 720,663 47%
Private Car or Taxi 273,872 261,005 -5%
Walk or Bike 77,613 124,450 60%
Work at Home 19,394 42,308 118%
AGE 2000 2015 % Change
Total Population 2,452,377 2,636,745 8%
Youth (Age 0-18) 684,446 640,618 -6%
Working Age Population (age 19-65)
1,502,066 1,694,836 13%
Seniors (age 66+) 265,865 301,291 13%
RACE 2000 2015 % Change
White 857,894 941,108 10%
Black 841,050 799,214 -5%
Hispanic 479,647 513,751 7%
Asian 182,869 315,467 73%
BIRTH PLACE 2000 2015 % Change
Born inside the United States
1,422,482 1,549,728 9%
Born outside the United States
1,029,895 1,087,017 6%
Brooklyn

32 NEW YORK CITY COMPTROLLER SCOTT M. STRINGER
UNEMPLOYMENT RATE IN 2015*
5.1%down from 9.6% in 2000
NUMBER OF BUSINESSES
5,338up 70% from 2000 to 2015
MEDIAN HOUSEHOLD INCOME
$70,000ranked 14 out of 55 neighborhoods
BK01
NEIGHBORHOOD ECONOMIC PROFILE
Greenpoint & Williamsburg
EMPLOYMENT* 2000 2015 % Change
Employed 49,726 86,297 74%
Unemployed 5,274 4,627 -12%
Unemployment Rate 9.6% 5.1% --
Out of School & Work (age 18-24) 4,364 1,273 -71%
% Out of School & Work (age 18-24) 27% 9% --
INDIVIDUAL INCOME*º 2000 2015 % Change
$25,000 or less 50,648 48,488 -4%
$25,001 - $50,000 21,366 26,494 24%
$50,001 - $75,000 8,795 16,498 88%
$75,001+ 5,212 24,144 363%
NUMBER OF BUSINESSES 2000 2015 % Change
Construction 339 506 49%
Manufacturing 400 271 -32%
Wholesale Trade 456 442 -3%
Retail Trade 552 911 65%
- Supermarkets (with 10+ Employees) 16 25 56%
Transportation, Warehousing 124 121 -2%
Information 31 169 445%
Finance, Insurance 50 108 116%
- Retail Banks 13 24 85%
Real Estate, Rental, Leasing 234 465 99%
Professional, Scientific, Technical 123 540 339%
- Legal and Accounting 34 94 176%
- Architecture and Design 32 147 359%
- Computer Systems Design 18 99 450%
Administrative, Waste Management 104 160 54%
Educational 29 69 138%
Health Care, Social Assistance 143 215 50%
Arts, Entertainment, Recreation 16 177 1006%
- Performing Arts Companies 2 15 650%
Accommodation, Food 182 690 279%
- Hotels and Motels 0 8 N/A
- Food Services and Drinking Places 171 648 279%
*Statistics are for working age population (19-65). ºInflation Adjusted.
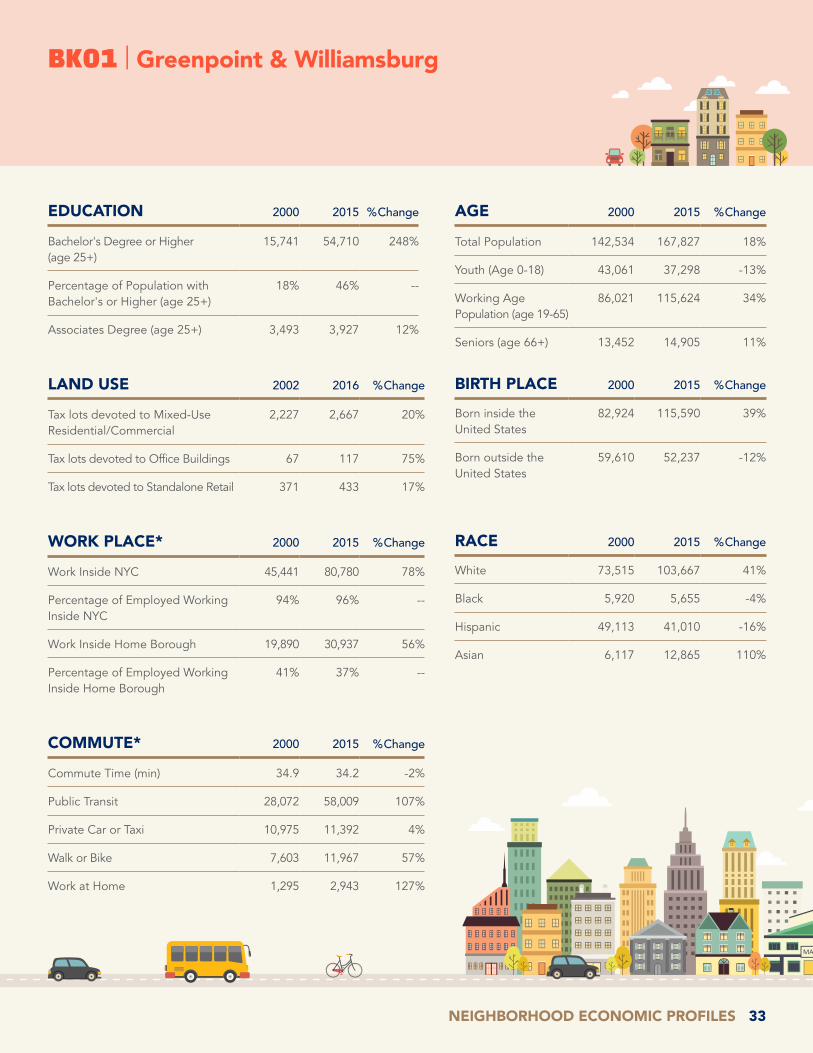
NEIGHBORHOOD ECONOMIC PROFILES 33
EDUCATION 2000 2015 % Change
Bachelor's Degree or Higher (age 25+)
15,741 54,710 248%
Percentage of Population with Bachelor's or Higher (age 25+)
18% 46% --
Associates Degree (age 25+) 3,493 3,927 12%
LAND USE 2002 2016 % Change
Tax lots devoted to Mixed-Use Residential/Commercial
2,227 2,667 20%
Tax lots devoted to Office Buildings 67 117 75%
Tax lots devoted to Standalone Retail 371 433 17%
WORK PLACE* 2000 2015 % Change
Work Inside NYC 45,441 80,780 78%
Percentage of Employed Working Inside NYC
94% 96% --
Work Inside Home Borough 19,890 30,937 56%
Percentage of Employed Working Inside Home Borough
41% 37% --
COMMUTE* 2000 2015 % Change
Commute Time (min) 34.9 34.2 -2%
Public Transit 28,072 58,009 107%
Private Car or Taxi 10,975 11,392 4%
Walk or Bike 7,603 11,967 57%
Work at Home 1,295 2,943 127%
AGE 2000 2015 % Change
Total Population 142,534 167,827 18%
Youth (Age 0-18) 43,061 37,298 -13%
Working Age Population (age 19-65)
86,021 115,624 34%
Seniors (age 66+) 13,452 14,905 11%
RACE 2000 2015 % Change
White 73,515 103,667 41%
Black 5,920 5,655 -4%
Hispanic 49,113 41,010 -16%
Asian 6,117 12,865 110%
BIRTH PLACE 2000 2015 % Change
Born inside the United States
82,924 115,590 39%
Born outside the United States
59,610 52,237 -12%
BK01 | Greenpoint & Williamsburg

34 NEW YORK CITY COMPTROLLER SCOTT M. STRINGER
UNEMPLOYMENT RATE IN 2015*
7.1%down from 9.8% in 2000
NUMBER OF BUSINESSES
5,939up 51% from 2000 to 2015
MEDIAN HOUSEHOLD INCOME
$87,800ranked 7 out of 55 neighborhoods
BK02
NEIGHBORHOOD ECONOMIC PROFILE
Brooklyn Heights & Fort Greene
EMPLOYMENT* 2000 2015 % Change
Employed 51,426 71,115 38%
Unemployed 5,618 5,454 -3%
Unemployment Rate 9.8% 7.1% --
Out of School & Work (age 18-24) 3,241 2,291 -29%
% Out of School & Work (age 18-24) 25% 19% --
INDIVIDUAL INCOME*º 2000 2015 % Change
$25,000 or less 35,457 38,444 8%
$25,001 - $50,000 17,330 15,918 -8%
$50,001 - $75,000 11,344 11,054 -3%
$75,001+ 16,491 32,318 96%
NUMBER OF BUSINESSES 2000 2015 % Change
Construction 166 218 31%
Manufacturing 251 190 -24%
Wholesale Trade 248 291 17%
Retail Trade 607 850 40%
- Supermarkets (with 10+ Employees) 10 29 190%
Transportation, Warehousing 56 69 23%
Information 78 247 217%
Finance, Insurance 104 185 78%
- Retail Banks 30 54 80%
Real Estate, Rental, Leasing 350 481 37%
Professional, Scientific, Technical 525 998 90%
- Legal and Accounting 305 335 10%
- Architecture and Design 77 242 214%
- Computer Systems Design 55 130 136%
Administrative, Waste Management 104 167 61%
Educational 50 135 170%
Health Care, Social Assistance 448 573 28%
Arts, Entertainment, Recreation 60 230 283%
- Performing Arts Companies 10 30 200%
Accommodation, Food 294 667 127%
- Hotels and Motels 3 8 167%
- Food Services and Drinking Places 269 623 132%
*Statistics are for working age population (19-65). ºInflation Adjusted.

NEIGHBORHOOD ECONOMIC PROFILES 35
EDUCATION 2000 2015 % Change
Bachelor's Degree or Higher (age 25+)
34,188 61,549 80%
Percentage of Population with Bachelor's or Higher (age 25+)
43% 62% --
Associates Degree (age 25+) 3,417 2,461 -28%
LAND USE 2002 2016 % Change
Tax lots devoted to Mixed-Use Residential/Commercial
996 1,189 19%
Tax lots devoted to Office Buildings 139 135 -3%
Tax lots devoted to Standalone Retail 346 287 -17%
WORK PLACE* 2000 2015 % Change
Work Inside NYC 47,936 68,152 42%
Percentage of Employed Working Inside NYC
95% 97% --
Work Inside Home Borough 16,769 25,360 51%
Percentage of Employed Working Inside Home Borough
33% 36% --
COMMUTE* 2000 2015 % Change
Commute Time (min) 35.7 34.4 -4%
Public Transit 33,282 46,655 40%
Private Car or Taxi 9,095 6,532 -28%
Walk or Bike 5,571 12,223 119%
Work at Home 2,158 4,953 130%
AGE 2000 2015 % Change
Total Population 113,068 134,828 19%
Youth (Age 0-18) 22,437 24,911 11%
Working Age Population (age 19-65)
80,622 97,734 21%
Seniors (age 66+) 10,009 12,183 22%
RACE 2000 2015 % Change
White 36,711 62,461 70%
Black 44,673 32,096 -28%
Hispanic 22,420 20,519 -8%
Asian 4,508 13,645 203%
BIRTH PLACE 2000 2015 % Change
Born inside the United States
86,882 103,097 19%
Born outside the United States
26,186 31,731 21%
BK02 | Brooklyn Heights & Fort Greene

36 NEW YORK CITY COMPTROLLER SCOTT M. STRINGER
UNEMPLOYMENT RATE IN 2015*
11.9%down from 17.0% in 2000
NUMBER OF BUSINESSES
1,421up 67% from 2000 to 2015
MEDIAN HOUSEHOLD INCOME
$35,000ranked 47 out of 55 neighborhoods
BK03
NEIGHBORHOOD ECONOMIC PROFILE
Bedford-Stuyvesant
EMPLOYMENT* 2000 2015 % Change
Employed 34,772 60,676 74%
Unemployed 7,104 8,198 15%
Unemployment Rate 17.0% 11.9% --
Out of School & Work (age 18-24) 5,059 4,186 -17%
% Out of School & Work (age 18-24) 37% 28% --
INDIVIDUAL INCOME*º 2000 2015 % Change
$25,000 or less 43,303 53,360 23%
$25,001 - $50,000 16,652 19,854 19%
$50,001 - $75,000 7,094 10,328 46%
$75,001+ 3,777 9,054 140%
NUMBER OF BUSINESSES 2000 2015 % Change
Construction 51 64 25%
Manufacturing 24 14 -42%
Wholesale Trade 28 41 46%
Retail Trade 214 371 73%
- Supermarkets (with 10+ Employees) 8 12 50%
Transportation, Warehousing 14 23 64%
Information 6 16 167%
Finance, Insurance 21 32 52%
- Retail Banks 8 11 38%
Real Estate, Rental, Leasing 69 109 58%
Professional, Scientific, Technical 15 60 300%
- Legal and Accounting 5 17 240%
- Architecture and Design 0 12 N/A
- Computer Systems Design 2 5 150%
Administrative, Waste Management 17 23 35%
Educational 13 36 177%
Health Care, Social Assistance 149 170 14%
Arts, Entertainment, Recreation 9 23 156%
- Performing Arts Companies 1 4 300%
Accommodation, Food 58 217 274%
- Hotels and Motels 1 3 200%
- Food Services and Drinking Places 55 204 271%
*Statistics are for working age population (19-65). ºInflation Adjusted.

NEIGHBORHOOD ECONOMIC PROFILES 37
EDUCATION 2000 2015 % Change
Bachelor's Degree or Higher (age 25+)
7,085 25,631 262%
Percentage of Population with Bachelor's or Higher (age 25+)
10% 28% --
Associates Degree (age 25+) 3,306 5,562 68%
LAND USE 2002 2016 % Change
Tax lots devoted to Mixed-Use Residential/Commercial
1,517 1,457 -4%
Tax lots devoted to Office Buildings 41 44 7%
Tax lots devoted to Standalone Retail 266 247 -7%
WORK PLACE* 2000 2015 % Change
Work Inside NYC 31,843 58,382 83%
Percentage of Employed Working Inside NYC
95% 98% --
Work Inside Home Borough 15,988 29,741 86%
Percentage of Employed Working Inside Home Borough
48% 50% --
COMMUTE* 2000 2015 % Change
Commute Time (min) 44.6 39.6 -11%
Public Transit 21,326 39,205 84%
Private Car or Taxi 8,942 9,812 10%
Walk or Bike 2,396 7,927 231%
Work at Home 741 2,397 223%
AGE 2000 2015 % Change
Total Population 121,057 150,691 24%
Youth (Age 0-18) 40,735 45,493 12%
Working Age Population (age 19-65)
70,826 92,596 31%
Seniors (age 66+) 9,496 12,602 33%
RACE 2000 2015 % Change
White 3,087 41,203 1235%
Black 90,732 75,237 -17%
Hispanic 23,457 27,112 16%
Asian 562 3,664 552%
BIRTH PLACE 2000 2015 % Change
Born inside the United States
92,770 119,430 29%
Born outside the United States
28,287 31,261 11%
BK03 | Bedford-Stuyvesant

38 NEW YORK CITY COMPTROLLER SCOTT M. STRINGER
UNEMPLOYMENT RATE IN 2015*
7.6%down from 15.7% in 2000
NUMBER OF BUSINESSES
2,433up 63% from 2000 to 2015
MEDIAN HOUSEHOLD INCOME
$45,000ranked 38 out of 55 neighborhoods
BK04
NEIGHBORHOOD ECONOMIC PROFILE
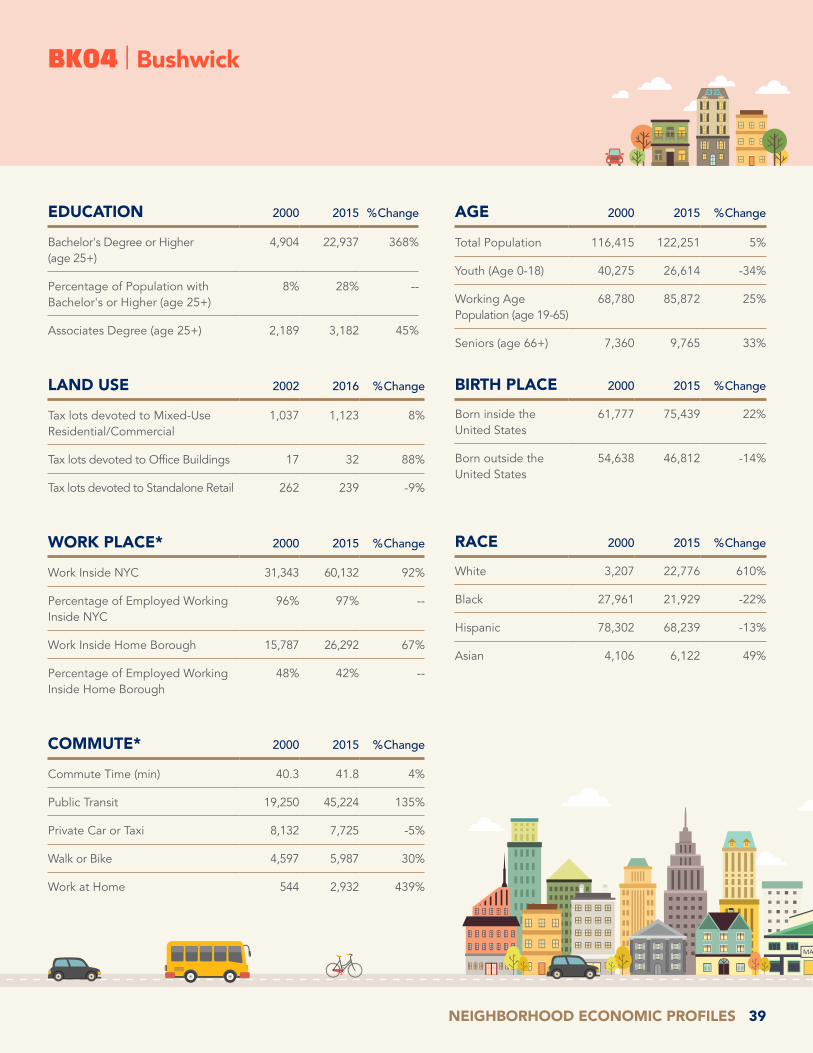
Bushwick
EMPLOYMENT* 2000 2015 % Change
Employed 33,809 63,205 87%
Unemployed 6,296 5,201 -17%
Unemployment Rate 15.7% 7.6% --
Out of School & Work (age 18-24) 5,205 2,272 -56%
% Out of School & Work (age 18-24) 35% 16% --
INDIVIDUAL INCOME*º 2000 2015 % Change
$25,000 or less 46,974 46,799 0%
$25,001 - $50,000 15,571 23,324 50%
$50,001 - $75,000 4,147 8,894 114%
$75,001+ 2,088 6,855 228%
NUMBER OF BUSINESSES 2000 2015 % Change
Construction 84 152 81%
Manufacturing 271 171 -37%
Wholesale Trade 204 286 40%
Retail Trade 329 564 71%
- Supermarkets (with 10+ Employees) 7 9 29%
Transportation, Warehousing 31 58 87%
Information 10 49 390%
Finance, Insurance 24 37 54%
- Retail Banks 6 11 83%
Real Estate, Rental, Leasing 80 156 95%
Professional, Scientific, Technical 15 123 720%
- Legal and Accounting 3 26 767%
- Architecture and Design 4 33 725%
- Computer Systems Design 1 29 2800%
Administrative, Waste Management 55 66 20%
Educational 11 30 173%
Health Care, Social Assistance 132 180 36%
Arts, Entertainment, Recreation 5 35 600%
- Performing Arts Companies 1 4 300%
Accommodation, Food 74 303 309%
- Hotels and Motels 1 4 300%
- Food Services and Drinking Places 71 285 301%
*Statistics are for working age population (19-65). ºInflation Adjusted.
NEIGHBORHOOD ECONOMIC PROFILES 39
EDUCATION 2000 2015 % Change
Bachelor's Degree or Higher (age 25+)
4,904 22,937 368%
Percentage of Population with Bachelor's or Higher (age 25+)
8% 28% --
Associates Degree (age 25+) 2,189 3,182 45%
LAND USE 2002 2016 % Change
Tax lots devoted to Mixed-Use Residential/Commercial
1,037 1,123 8%
Tax lots devoted to Office Buildings 17 32 88%
Tax lots devoted to Standalone Retail 262 239 -9%
WORK PLACE* 2000 2015 % Change
Work Inside NYC 31,343 60,132 92%
Percentage of Employed Working Inside NYC
96% 97% --
Work Inside Home Borough 15,787 26,292 67%
Percentage of Employed Working Inside Home Borough
48% 42% --
COMMUTE* 2000 2015 % Change
Commute Time (min) 40.3 41.8 4%
Public Transit 19,250 45,224 135%
Private Car or Taxi 8,132 7,725 -5%
Walk or Bike 4,597 5,987 30%
Work at Home 544 2,932 439%
AGE 2000 2015 % Change
Total Population 116,415 122,251 5%
Youth (Age 0-18) 40,275 26,614 -34%
Working Age Population (age 19-65)
68,780 85,872 25%
Seniors (age 66+) 7,360 9,765 33%
RACE 2000 2015 % Change
White 3,207 22,776 610%
Black 27,961 21,929 -22%
Hispanic 78,302 68,239 -13%
Asian 4,106 6,122 49%
BIRTH PLACE 2000 2015 % Change
Born inside the United States
61,777 75,439 22%
Born outside the United States
54,638 46,812 -14%
BK04 | Bushwick

40 NEW YORK CITY COMPTROLLER SCOTT M. STRINGER
UNEMPLOYMENT RATE IN 2015*
6.5%down from 15.5% in 2000
NUMBER OF BUSINESSES
2,032up 49% from 2000 to 2015
MEDIAN HOUSEHOLD INCOME
$34,200ranked 48 out of 55 neighborhoods
BK05
NEIGHBORHOOD ECONOMIC PROFILE
East New York & Starrett City
EMPLOYMENT* 2000 2015 % Change
Employed 41,473 65,097 57%
Unemployed 7,580 4,524 -40%
Unemployment Rate 15.5% 6.5% --
Out of School & Work (age 18-24) 4,911 5,369 9%
% Out of School & Work (age 18-24) 30% 29% --
INDIVIDUAL INCOME*º 2000 2015 % Change
$25,000 or less 50,128 61,020 22%
$25,001 - $50,000 21,108 25,541 21%
$50,001 - $75,000 8,179 7,053 -14%
$75,001+ 4,667 6,206 33%
NUMBER OF BUSINESSES 2000 2015 % Change
Construction 61 121 98%
Manufacturing 126 72 -43%
Wholesale Trade 127 153 20%
Retail Trade 325 584 80%
- Supermarkets (with 10+ Employees) 7 29 314%
Transportation, Warehousing 60 78 30%
Information 9 16 78%
Finance, Insurance 33 32 -3%
- Retail Banks 10 10 0%
Real Estate, Rental, Leasing 68 87 28%
Professional, Scientific, Technical 20 42 110%
- Legal and Accounting 9 27 200%
- Architecture and Design 1 2 100%
- Computer Systems Design 4 2 -50%
Administrative, Waste Management 42 59 40%
Educational 17 32 88%
Health Care, Social Assistance 156 254 63%
Arts, Entertainment, Recreation 4 4 0%
- Performing Arts Companies 0 0 N/A
Accommodation, Food 82 224 173%
- Hotels and Motels 3 7 133%
- Food Services and Drinking Places 75 213 184%
*Statistics are for working age population (19-65). ºInflation Adjusted.

NEIGHBORHOOD ECONOMIC PROFILES 41
EDUCATION 2000 2015 % Change
Bachelor's Degree or Higher (age 25+)
8,343 15,186 82%
Percentage of Population with Bachelor's or Higher (age 25+)
10% 15% --
Associates Degree (age 25+) 4,372 4,916 12%
LAND USE 2002 2016 % Change
Tax lots devoted to Mixed-Use Residential/Commercial
1,115 1,170 5%
Tax lots devoted to Office Buildings 34 33 -3%
Tax lots devoted to Standalone Retail 257 329 28%
WORK PLACE* 2000 2015 % Change
Work Inside NYC 37,169 62,387 68%
Percentage of Employed Working Inside NYC
94% 99% --
Work Inside Home Borough 18,652 33,819 81%
Percentage of Employed Working Inside Home Borough
47% 53% --
COMMUTE* 2000 2015 % Change
Commute Time (min) 48 46.2 -4%
Public Transit 21,140 42,060 99%
Private Car or Taxi 15,073 17,096 13%
Walk or Bike 2,728 2,906 7%
Work at Home 535 1,190 122%
AGE 2000 2015 % Change
Total Population 143,427 158,867 11%
Youth (Age 0-18) 48,128 43,539 -10%
Working Age Population (age 19-65)
84,082 99,820 19%
Seniors (age 66+) 11,217 15,508 38%
RACE 2000 2015 % Change
White 8,091 4,629 -43%
Black 65,863 77,086 17%
Hispanic 56,633 63,724 13%
Asian 5,201 7,213 39%
BIRTH PLACE 2000 2015 % Change
Born inside the United States
84,226 89,088 6%
Born outside the United States
59,201 69,779 18%
BK05 | East New York & Starrett City

42 NEW YORK CITY COMPTROLLER SCOTT M. STRINGER
UNEMPLOYMENT RATE IN 2015*
4.9%down from 5.1% in 2000
NUMBER OF BUSINESSES
3,474up 63% from 2000 to 2015
MEDIAN HOUSEHOLD INCOME
$115,500ranked 2 out of 55 neighborhoods
BK06
NEIGHBORHOOD ECONOMIC PROFILE
Park Slope, Carroll Gardens & Red Hook
EMPLOYMENT* 2000 2015 % Change
Employed 59,020 67,112 14%
Unemployed 3,201 3,434 7%
Unemployment Rate 5.1% 4.9% --
Out of School & Work (age 18-24) 1,986 691 -65%
% Out of School & Work (age 18-24) 24% 13% --
INDIVIDUAL INCOME*º 2000 2015 % Change
$25,000 or less 24,796 20,202 -19%
$25,001 - $50,000 17,439 12,411 -29%
$50,001 - $75,000 14,967 14,363 -4%
$75,001+ 20,783 35,076 69%
NUMBER OF BUSINESSES 2000 2015 % Change
Construction 229 252 10%
Manufacturing 163 128 -21%
Wholesale Trade 173 166 -4%
Retail Trade 333 438 32%
- Supermarkets (with 10+ Employees) 11 15 36%
Transportation, Warehousing 80 85 6%
Information 53 148 179%
Finance, Insurance 44 64 45%
- Retail Banks 15 23 53%
Real Estate, Rental, Leasing 111 233 110%
Professional, Scientific, Technical 182 429 136%
- Legal and Accounting 38 60 58%
- Architecture and Design 40 137 243%
- Computer Systems Design 49 69 41%
Administrative, Waste Management 55 90 64%
Educational 28 79 182%
Health Care, Social Assistance 183 301 64%
Arts, Entertainment, Recreation 40 170 325%
- Performing Arts Companies 9 23 156%
Accommodation, Food 176 473 169%
- Hotels and Motels 1 7 600%
- Food Services and Drinking Places 163 447 174%
*Statistics are for working age population (19-65). ºInflation Adjusted.

NEIGHBORHOOD ECONOMIC PROFILES 43
EDUCATION 2000 2015 % Change
Bachelor's Degree or Higher (age 25+)
41,567 66,487 60%
Percentage of Population with Bachelor's or Higher (age 25+)
52% 75% --
Associates Degree (age 25+) 3,235 1,902 -41%
LAND USE 2002 2016 % Change
Tax lots devoted to Mixed-Use Residential/Commercial
1,593 1,622 2%
Tax lots devoted to Office Buildings 53 64 21%
Tax lots devoted to Standalone Retail 196 207 6%
WORK PLACE* 2000 2015 % Change
Work Inside NYC 54,747 64,950 19%
Percentage of Employed Working Inside NYC
95% 98% --
Work Inside Home Borough 18,766 24,011 28%
Percentage of Employed Working Inside Home Borough
33% 36% --
COMMUTE* 2000 2015 % Change
Commute Time (min) 37.8 38 1%
Public Transit 38,611 45,685 18%
Private Car or Taxi 10,173 6,792 -33%
Walk or Bike 5,791 8,395 45%
Work at Home 2,996 5,504 84%
AGE 2000 2015 % Change
Total Population 108,376 116,919 8%
Youth (Age 0-18) 21,312 23,766 12%
Working Age Population (age 19-65)
77,985 82,052 5%
Seniors (age 66+) 9,079 11,101 22%
RACE 2000 2015 % Change
White 60,318 78,361 30%
Black 12,422 7,104 -43%
Hispanic 25,814 18,171 -30%
Asian 4,779 9,016 89%
BIRTH PLACE 2000 2015 % Change
Born inside the United States
82,271 91,248 11%
Born outside the United States
26,105 25,671 -2%
BK06 | Park Slope, Carroll Gardens & Red Hook

44 NEW YORK CITY COMPTROLLER SCOTT M. STRINGER
UNEMPLOYMENT RATE IN 2015*
5.6%down from 8.2% in 2000
NUMBER OF BUSINESSES
3,925up 59% from 2000 to 2015
MEDIAN HOUSEHOLD INCOME
$47,600ranked 32 out of 55 neighborhoods
BK07
NEIGHBORHOOD ECONOMIC PROFILE
Sunset Park & Windsor Terrace
EMPLOYMENT* 2000 2015 % Change
Employed 51,043 68,454 34%
Unemployed 4,585 4,023 -12%
Unemployment Rate 8.2% 5.6% --
Out of School & Work (age 18-24) 4,181 2,302 -45%
% Out of School & Work (age 18-24) 27% 19% --
INDIVIDUAL INCOME*º 2000 2015 % Change
$25,000 or less 52,238 63,978 22%
$25,001 - $50,000 19,304 16,802 -13%
$50,001 - $75,000 8,948 8,610 -4%
$75,001+ 6,601 7,886 19%
NUMBER OF BUSINESSES 2000 2015 % Change
Construction 219 334 53%
Manufacturing 424 272 -36%
Wholesale Trade 369 562 52%
Retail Trade 437 847 94%
- Supermarkets (with 10+ Employees) 13 16 23%
Transportation, Warehousing 51 118 131%
Information 23 47 104%
Finance, Insurance 67 95 42%
- Retail Banks 11 20 82%
Real Estate, Rental, Leasing 124 177 43%
Professional, Scientific, Technical 69 168 143%
- Legal and Accounting 16 62 288%
- Architecture and Design 16 25 56%
- Computer Systems Design 18 25 39%
Administrative, Waste Management 68 110 62%
Educational 20 50 150%
Health Care, Social Assistance 128 292 128%
Arts, Entertainment, Recreation 9 21 133%
- Performing Arts Companies 1 5 400%
Accommodation, Food 152 410 170%
- Hotels and Motels 0 5 N/A
- Food Services and Drinking Places 148 395 167%
*Statistics are for working age population (19-65). ºInflation Adjusted.

NEIGHBORHOOD ECONOMIC PROFILES 45
EDUCATION 2000 2015 % Change
Bachelor's Degree or Higher (age 25+)
13,384 27,935 109%
Percentage of Population with Bachelor's or Higher (age 25+)
16% 28% --
Associates Degree (age 25+) 3,608 3,348 -7%
LAND USE 2002 2016 % Change
Tax lots devoted to Mixed-Use Residential/Commercial
1,297 1,461 13%
Tax lots devoted to Office Buildings 37 66 78%
Tax lots devoted to Standalone Retail 198 288 45%
WORK PLACE* 2000 2015 % Change
Work Inside NYC 47,093 63,319 34%
Percentage of Employed Working Inside NYC
95% 95% --
Work Inside Home Borough 24,914 35,820 44%
Percentage of Employed Working Inside Home Borough
50% 54% --
COMMUTE* 2000 2015 % Change
Commute Time (min) 41 42.5 4%
Public Transit 28,445 42,910 51%
Private Car or Taxi 12,913 10,166 -21%
Walk or Bike 7,015 10,927 56%
Work at Home 823 2,510 205%
AGE 2000 2015 % Change
Total Population 136,334 149,719 10%
Youth (Age 0-18) 37,426 39,284 5%
Working Age Population (age 19-65)
87,091 97,276 12%
Seniors (age 66+) 11,817 13,159 11%
RACE 2000 2015 % Change
White 30,542 36,054 18%
Black 4,685 2,733 -42%
Hispanic 65,026 56,855 -13%
Asian 30,293 51,558 70%
BIRTH PLACE 2000 2015 % Change
Born inside the United States
62,093 69,562 12%
Born outside the United States
74,241 80,157 8%
BK07 | Sunset Park & Windsor Terrace

46 NEW YORK CITY COMPTROLLER SCOTT M. STRINGER
UNEMPLOYMENT RATE IN 2015*
6.3%down from 13.6% in 2000
NUMBER OF BUSINESSES
1,971up 94% from 2000 to 2015
MEDIAN HOUSEHOLD INCOME
$45,000ranked 39 out of 55 neighborhoods
BK08
NEIGHBORHOOD ECONOMIC PROFILE
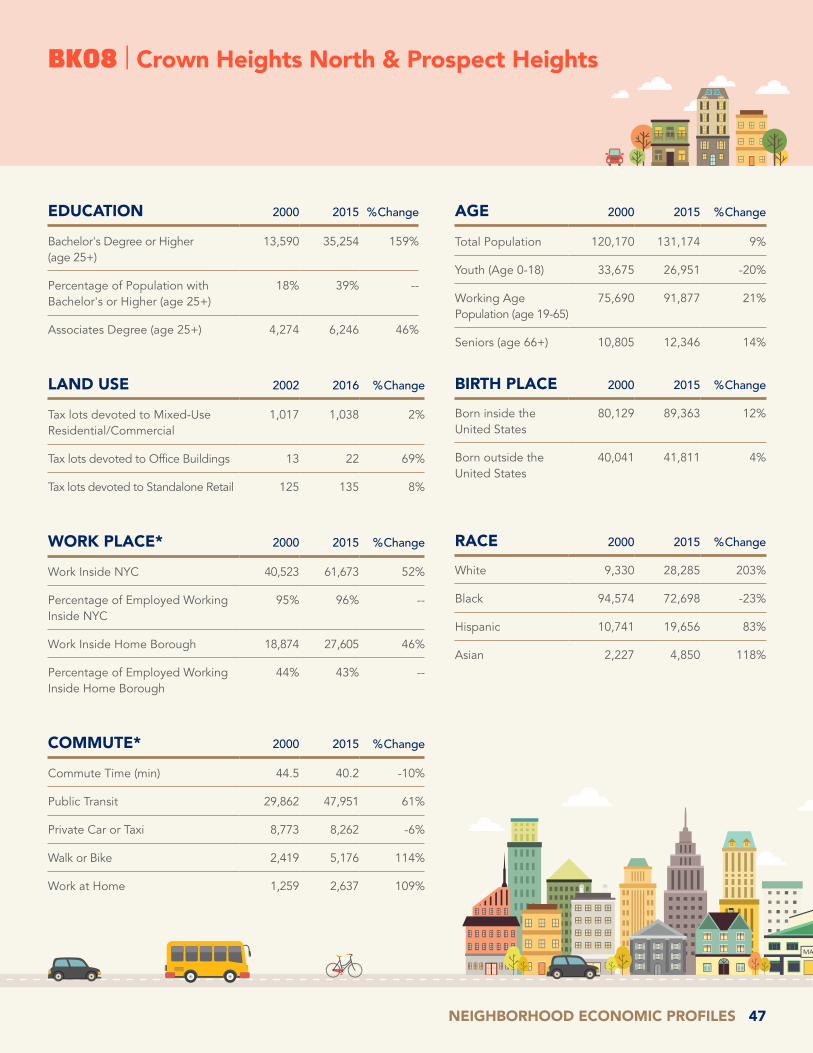
Crown Heights North & Prospect Heights
EMPLOYMENT* 2000 2015 % Change
Employed 43,999 65,752 49%
Unemployed 6,949 4,422 -36%
Unemployment Rate 13.6% 6.3% --
Out of School & Work (age 18-24) 3,874 3,090 -20%
% Out of School & Work (age 18-24) 28% 21% --
INDIVIDUAL INCOME*º 2000 2015 % Change
$25,000 or less 39,275 44,327 13%
$25,001 - $50,000 20,746 23,369 13%
$50,001 - $75,000 9,122 12,221 34%
$75,001+ 6,547 11,960 83%
NUMBER OF BUSINESSES 2000 2015 % Change
Construction 40 67 68%
Manufacturing 42 37 -12%
Wholesale Trade 46 62 35%
Retail Trade 175 322 84%
- Supermarkets (with 10+ Employees) 6 17 183%
Transportation, Warehousing 24 29 21%
Information 16 65 306%
Finance, Insurance 17 21 24%
- Retail Banks 6 8 33%
Real Estate, Rental, Leasing 119 224 88%
Professional, Scientific, Technical 39 195 400%
- Legal and Accounting 12 37 208%
- Architecture and Design 6 53 783%
- Computer Systems Design 11 29 164%
Administrative, Waste Management 31 50 61%
Educational 36 52 44%
Health Care, Social Assistance 164 219 34%
Arts, Entertainment, Recreation 20 75 275%
- Performing Arts Companies 1 9 800%
Accommodation, Food 50 291 482%
- Hotels and Motels 0 1 N/A
- Food Services and Drinking Places 43 278 547%
*Statistics are for working age population (19-65). ºInflation Adjusted.
NEIGHBORHOOD ECONOMIC PROFILES 47
EDUCATION 2000 2015 % Change
Bachelor's Degree or Higher (age 25+)
13,590 35,254 159%
Percentage of Population with Bachelor's or Higher (age 25+)
18% 39% --
Associates Degree (age 25+) 4,274 6,246 46%
LAND USE 2002 2016 % Change
Tax lots devoted to Mixed-Use Residential/Commercial
1,017 1,038 2%
Tax lots devoted to Office Buildings 13 22 69%
Tax lots devoted to Standalone Retail 125 135 8%
WORK PLACE* 2000 2015 % Change
Work Inside NYC 40,523 61,673 52%
Percentage of Employed Working Inside NYC
95% 96% --
Work Inside Home Borough 18,874 27,605 46%
Percentage of Employed Working Inside Home Borough
44% 43% --
COMMUTE* 2000 2015 % Change
Commute Time (min) 44.5 40.2 -10%
Public Transit 29,862 47,951 61%
Private Car or Taxi 8,773 8,262 -6%
Walk or Bike 2,419 5,176 114%
Work at Home 1,259 2,637 109%
AGE 2000 2015 % Change
Total Population 120,170 131,174 9%
Youth (Age 0-18) 33,675 26,951 -20%
Working Age Population (age 19-65)
75,690 91,877 21%
Seniors (age 66+) 10,805 12,346 14%
RACE 2000 2015 % Change
White 9,330 28,285 203%
Black 94,574 72,698 -23%
Hispanic 10,741 19,656 83%
Asian 2,227 4,850 118%
BIRTH PLACE 2000 2015 % Change
Born inside the United States
80,129 89,363 12%
Born outside the United States
40,041 41,811 4%
BK08 | Crown Heights North & Prospect Heights

48 NEW YORK CITY COMPTROLLER SCOTT M. STRINGER
UNEMPLOYMENT RATE IN 2015*
7.7%down from 12.6% in 2000
NUMBER OF BUSINESSES
750up 80% from 2000 to 2015
MEDIAN HOUSEHOLD INCOME
$45,600ranked 35 out of 55 neighborhoods
BK09
NEIGHBORHOOD ECONOMIC PROFILE
Crown Heights South, Prospect Lefferts & Wingate
EMPLOYMENT* 2000 2015 % Change
Employed 42,930 53,620 25%
Unemployed 6,166 4,450 -28%
Unemployment Rate 12.6% 7.7% --
Out of School & Work (age 18-24) 2,509 1,466 -42%
% Out of School & Work (age 18-24) 21% 14% --
INDIVIDUAL INCOME*º 2000 2015 % Change
$25,000 or less 37,042 39,119 6%
$25,001 - $50,000 20,525 22,818 11%
$50,001 - $75,000 7,948 7,713 -3%
$75,001+ 4,827 4,977 3%
NUMBER OF BUSINESSES 2000 2015 % Change
Construction 20 29 45%
Manufacturing 8 11 38%
Wholesale Trade 19 12 -37%
Retail Trade 76 169 122%
- Supermarkets (with 10+ Employees) 4 6 50%
Transportation, Warehousing 3 7 133%
Information 4 29 625%
Finance, Insurance 8 16 100%
- Retail Banks 2 3 50%
Real Estate, Rental, Leasing 84 100 19%
Professional, Scientific, Technical 8 50 525%
- Legal and Accounting 4 12 200%
- Architecture and Design 1 9 800%
- Computer Systems Design 1 8 700%
Administrative, Waste Management 10 15 50%
Educational 6 15 150%
Health Care, Social Assistance 64 96 50%
Arts, Entertainment, Recreation 3 10 233%
- Performing Arts Companies 0 1 N/A
Accommodation, Food 33 80 142%
- Hotels and Motels 0 0 N/A
- Food Services and Drinking Places 31 76 145%
*Statistics are for working age population (19-65). ºInflation Adjusted.

NEIGHBORHOOD ECONOMIC PROFILES 49
EDUCATION 2000 2015 % Change
Bachelor's Degree or Higher (age 25+)
10,221 20,899 104%
Percentage of Population with Bachelor's or Higher (age 25+)
14% 26% --
Associates Degree (age 25+) 4,852 6,048 25%
LAND USE 2002 2016 % Change
Tax lots devoted to Mixed-Use Residential/Commercial
775 763 -2%
Tax lots devoted to Office Buildings 22 28 27%
Tax lots devoted to Standalone Retail 75 120 60%
WORK PLACE* 2000 2015 % Change
Work Inside NYC 38,600 51,595 34%
Percentage of Employed Working Inside NYC
94% 98% --
Work Inside Home Borough 19,255 26,394 37%
Percentage of Employed Working Inside Home Borough
47% 50% --
COMMUTE* 2000 2015 % Change
Commute Time (min) 47 40.2 -14%
Public Transit 27,673 38,248 38%
Private Car or Taxi 9,709 6,258 -36%
Walk or Bike 2,955 5,432 84%
Work at Home 729 2,610 258%
AGE 2000 2015 % Change
Total Population 114,012 115,368 1%
Youth (Age 0-18) 32,938 25,611 -22%
Working Age Population (age 19-65)
70,342 74,627 6%
Seniors (age 66+) 10,732 15,130 41%
RACE 2000 2015 % Change
White 9,499 24,726 160%
Black 90,754 74,499 -18%
Hispanic 9,289 9,554 3%
Asian 592 2,611 341%
BIRTH PLACE 2000 2015 % Change
Born inside the United States
56,131 60,959 9%
Born outside the United States
57,881 54,409 -6%
BK09 | Crown Heights South, Prospect Lefferts & Wingate

50 NEW YORK CITY COMPTROLLER SCOTT M. STRINGER
UNEMPLOYMENT RATE IN 2015*
8.5%up from 6.1% in 2000
NUMBER OF BUSINESSES
2,933up 22% from 2000 to 2015
MEDIAN HOUSEHOLD INCOME
$64,250ranked 18 out of 55 neighborhoods
BK10
NEIGHBORHOOD ECONOMIC PROFILE
Bay Ridge & Dyker Heights
EMPLOYMENT* 2000 2015 % Change
Employed 52,415 55,940 7%
Unemployed 3,411 5,226 53%
Unemployment Rate 6.1% 8.5% --
Out of School & Work (age 18-24) 2,166 1,384 -36%
% Out of School & Work (age 18-24) 23% 15% --
INDIVIDUAL INCOME*º 2000 2015 % Change
$25,000 or less 33,888 40,989 21%
$25,001 - $50,000 17,016 13,972 -18%
$50,001 - $75,000 13,150 10,080 -23%
$75,001+ 14,945 15,922 7%
NUMBER OF BUSINESSES 2000 2015 % Change
Construction 230 262 14%
Manufacturing 57 37 -35%
Wholesale Trade 86 119 38%
Retail Trade 381 424 11%
- Supermarkets (with 10+ Employees) 7 11 57%
Transportation, Warehousing 25 78 212%
Information 20 23 15%
Finance, Insurance 98 122 24%
- Retail Banks 34 42 24%
Real Estate, Rental, Leasing 205 257 25%
Professional, Scientific, Technical 194 261 35%
- Legal and Accounting 80 108 35%
- Architecture and Design 16 32 100%
- Computer Systems Design 56 48 -14%
Administrative, Waste Management 108 96 -11%
Educational 28 60 114%
Health Care, Social Assistance 444 495 11%
Arts, Entertainment, Recreation 16 26 63%
- Performing Arts Companies 0 1 N/A
Accommodation, Food 214 319 49%
- Hotels and Motels 2 2 0%
- Food Services and Drinking Places 204 306 50%
*Statistics are for working age population (19-65). ºInflation Adjusted.

NEIGHBORHOOD ECONOMIC PROFILES 51
EDUCATION 2000 2015 % Change
Bachelor's Degree or Higher (age 25+)
28,888 38,846 34%
Percentage of Population with Bachelor's or Higher (age 25+)
32% 43% --
Associates Degree (age 25+) 4,833 5,110 6%
LAND USE 2002 2016 % Change
Tax lots devoted to Mixed-Use Residential/Commercial
1,748 1,784 2%
Tax lots devoted to Office Buildings 91 92 1%
Tax lots devoted to Standalone Retail 260 276 6%
WORK PLACE* 2000 2015 % Change
Work Inside NYC 48,485 51,535 6%
Percentage of Employed Working Inside NYC
94% 95% --
Work Inside Home Borough 23,564 27,547 17%
Percentage of Employed Working Inside Home Borough
46% 51% --
COMMUTE* 2000 2015 % Change
Commute Time (min) 41.6 41.9 1%
Public Transit 26,090 28,503 9%
Private Car or Taxi 19,676 18,746 -5%
Walk or Bike 4,523 5,066 12%
Work at Home 943 1,769 88%
AGE 2000 2015 % Change
Total Population 122,506 122,116 0%
Youth (Age 0-18) 24,135 22,763 -6%
Working Age Population (age 19-65)
78,999 80,963 2%
Seniors (age 66+) 19,372 18,390 -5%
RACE 2000 2015 % Change
White 85,312 67,858 -20%
Black 1,382 1,544 12%
Hispanic 12,853 19,617 53%
Asian 15,705 30,682 95%
BIRTH PLACE 2000 2015 % Change
Born inside the United States
74,135 68,538 -8%
Born outside the United States
48,371 53,578 11%
BK10 | Bay Ridge & Dyker Heights

52 NEW YORK CITY COMPTROLLER SCOTT M. STRINGER
UNEMPLOYMENT RATE IN 2015*
8.2%up from 6.6% in 2000
NUMBER OF BUSINESSES
6,336up 41% from 2000 to 2015
MEDIAN HOUSEHOLD INCOME
$44,700ranked 40 out of 55 neighborhoods
BK11
NEIGHBORHOOD ECONOMIC PROFILE
Bensonhurst & Bath Beach
EMPLOYMENT* 2000 2015 % Change
Employed 64,643 82,677 28%
Unemployed 4,571 7,370 61%
Unemployment Rate 6.6% 8.2% --
Out of School & Work (age 18-24) 3,045 1,483 -51%
% Out of School & Work (age 18-24) 20% 10% --
INDIVIDUAL INCOME*º 2000 2015 % Change
$25,000 or less 58,167 70,677 22%
$25,001 - $50,000 23,305 24,449 5%
$50,001 - $75,000 13,721 12,528 -9%
$75,001+ 11,856 12,848 8%
NUMBER OF BUSINESSES 2000 2015 % Change
Construction 368 588 60%
Manufacturing 185 156 -16%
Wholesale Trade 344 478 39%
Retail Trade 911 1,279 40%
- Supermarkets (with 10+ Employees) 18 33 83%
Transportation, Warehousing 147 298 103%
Information 46 46 0%
Finance, Insurance 136 183 35%
- Retail Banks 29 41 41%
Real Estate, Rental, Leasing 362 498 38%
Professional, Scientific, Technical 424 561 32%
- Legal and Accounting 108 202 87%
- Architecture and Design 23 46 100%
- Computer Systems Design 166 106 -36%
Administrative, Waste Management 170 221 30%
Educational 62 131 111%
Health Care, Social Assistance 413 693 68%
Arts, Entertainment, Recreation 30 42 40%
- Performing Arts Companies 5 2 -60%
Accommodation, Food 246 468 90%
- Hotels and Motels 1 3 200%
- Food Services and Drinking Places 219 444 103%
*Statistics are for working age population (19-65). ºInflation Adjusted.

NEIGHBORHOOD ECONOMIC PROFILES 53
EDUCATION 2000 2015 % Change
Bachelor's Degree or Higher (age 25+)
24,761 37,268 51%
Percentage of Population with Bachelor's or Higher (age 25+)
20% 28% --
Associates Degree (age 25+) 6,957 10,788 55%
LAND USE 2002 2016 % Change
Tax lots devoted to Mixed-Use Residential/Commercial
1,663 1,736 4%
Tax lots devoted to Office Buildings 62 84 35%
Tax lots devoted to Standalone Retail 527 566 7%
WORK PLACE* 2000 2015 % Change
Work Inside NYC 58,794 75,805 29%
Percentage of Employed Working Inside NYC
93% 96% --
Work Inside Home Borough 29,280 41,452 42%
Percentage of Employed Working Inside Home Borough
46% 52% --
COMMUTE* 2000 2015 % Change
Commute Time (min) 44.9 46.3 3%
Public Transit 34,505 45,179 31%
Private Car or Taxi 22,322 24,045 8%
Walk or Bike 4,945 7,648 55%
Work at Home 885 1,647 86%
AGE 2000 2015 % Change
Total Population 171,385 187,880 10%
Youth (Age 0-18) 36,689 41,939 14%
Working Age Population (age 19-65)
107,049 120,502 13%
Seniors (age 66+) 27,647 25,439 -8%
RACE 2000 2015 % Change
White 111,826 77,393 -31%
Black 680 2,126 213%
Hispanic 14,120 29,049 106%
Asian 39,744 76,603 93%
BIRTH PLACE 2000 2015 % Change
Born inside the United States
82,180 77,412 -6%
Born outside the United States
89,205 110,468 24%
BK11 | Bensonhurst & Bath Beach

54 NEW YORK CITY COMPTROLLER SCOTT M. STRINGER
UNEMPLOYMENT RATE IN 2015*
5.3%down from 7.3% in 2000
NUMBER OF BUSINESSES
4,809up 48% from 2000 to 2015
MEDIAN HOUSEHOLD INCOME
$44,300ranked 42 out of 55 neighborhoods
BK12
NEIGHBORHOOD ECONOMIC PROFILE
Borough Park, Kensington & Ocean Parkway
EMPLOYMENT* 2000 2015 % Change
Employed 50,138 55,478 11%
Unemployed 3,965 3,107 -22%
Unemployment Rate 7.3% 5.3% --
Out of School & Work (age 18-24) 4,066 1,896 -53%
% Out of School & Work (age 18-24) 24% 13% --
INDIVIDUAL INCOME*º 2000 2015 % Change
$25,000 or less 50,858 56,844 12%
$25,001 - $50,000 17,617 14,352 -19%
$50,001 - $75,000 9,371 7,814 -17%
$75,001+ 8,374 7,218 -14%
NUMBER OF BUSINESSES 2000 2015 % Change
Construction 249 493 98%
Manufacturing 192 175 -9%
Wholesale Trade 334 402 20%
Retail Trade 529 865 64%
- Supermarkets (with 10+ Employees) 9 15 67%
Transportation, Warehousing 61 115 89%
Information 27 56 107%
Finance, Insurance 76 146 92%
- Retail Banks 14 33 136%
Real Estate, Rental, Leasing 555 715 29%
Professional, Scientific, Technical 160 317 98%
- Legal and Accounting 48 89 85%
- Architecture and Design 29 55 90%
- Computer Systems Design 37 49 32%
Administrative, Waste Management 94 157 67%
Educational 57 113 98%
Health Care, Social Assistance 324 457 41%
Arts, Entertainment, Recreation 15 30 100%
- Performing Arts Companies 5 10 100%
Accommodation, Food 105 254 142%
- Hotels and Motels 2 5 150%
- Food Services and Drinking Places 92 225 145%
*Statistics are for working age population (19-65). ºInflation Adjusted.

NEIGHBORHOOD ECONOMIC PROFILES 55
EDUCATION 2000 2015 % Change
Bachelor's Degree or Higher (age 25+)
19,725 24,372 24%
Percentage of Population with Bachelor's or Higher (age 25+)
22% 27% --
Associates Degree (age 25+) 4,714 5,528 17%
LAND USE 2002 2016 % Change
Tax lots devoted to Mixed-Use Residential/Commercial
1,819 1,891 4%
Tax lots devoted to Office Buildings 101 134 33%
Tax lots devoted to Standalone Retail 462 551 19%
WORK PLACE* 2000 2015 % Change
Work Inside NYC 46,437 51,857 12%
Percentage of Employed Working Inside NYC
95% 96% --
Work Inside Home Borough 28,983 36,536 26%
Percentage of Employed Working Inside Home Borough
59% 68% --
COMMUTE* 2000 2015 % Change
Commute Time (min) 36.9 35.1 -5%
Public Transit 21,009 20,876 -1%
Private Car or Taxi 18,006 17,287 -4%
Walk or Bike 8,231 12,927 57%
Work at Home 1,398 2,578 84%
AGE 2000 2015 % Change
Total Population 160,633 162,019 1%
Youth (Age 0-18) 54,046 59,483 10%
Working Age Population (age 19-65)
86,220 86,228 0%
Seniors (age 66+) 20,367 16,308 -20%
RACE 2000 2015 % Change
White 113,048 110,408 -2%
Black 5,154 5,692 10%
Hispanic 17,638 17,621 0%
Asian 18,461 23,578 28%
BIRTH PLACE 2000 2015 % Change
Born inside the United States
93,017 107,214 15%
Born outside the United States
67,616 54,805 -19%
BK12 | Borough Park, Kensington & Ocean Parkway

56 NEW YORK CITY COMPTROLLER SCOTT M. STRINGER
UNEMPLOYMENT RATE IN 2015*
15.5%up from 9.0% in 2000
NUMBER OF BUSINESSES
706up 43% from 2000 to 2015
MEDIAN HOUSEHOLD INCOME
$41,000ranked 44 out of 55 neighborhoods
BK13
NEIGHBORHOOD ECONOMIC PROFILE
Brighton Beach & Coney Island
EMPLOYMENT* 2000 2015 % Change
Employed 36,353 46,084 27%
Unemployed 3,578 8,466 137%
Unemployment Rate 9.0% 15.5% --
Out of School & Work (age 18-24) 3,374 1,034 -69%
% Out of School & Work (age 18-24) 31% 12% --
INDIVIDUAL INCOME*º 2000 2015 % Change
$25,000 or less 39,923 44,928 13%
$25,001 - $50,000 14,970 15,422 3%
$50,001 - $75,000 6,908 6,067 -12%
$75,001+ 5,270 7,282 38%
NUMBER OF BUSINESSES 2000 2015 % Change
Construction 32 52 63%
Manufacturing 12 16 33%
Wholesale Trade 23 38 65%
Retail Trade 73 120 64%
- Supermarkets (with 10+ Employees) 2 4 100%
Transportation, Warehousing 41 46 12%
Information 2 6 200%
Finance, Insurance 11 16 45%
- Retail Banks 5 7 40%
Real Estate, Rental, Leasing 33 33 0%
Professional, Scientific, Technical 52 74 42%
- Legal and Accounting 11 24 118%
- Architecture and Design 3 5 67%
- Computer Systems Design 25 17 -32%
Administrative, Waste Management 18 16 -11%
Educational 1 8 700%
Health Care, Social Assistance 62 124 100%
Arts, Entertainment, Recreation 18 13 -28%
- Performing Arts Companies 0 2 N/A
Accommodation, Food 38 53 39%
- Hotels and Motels 1 0 -100%
- Food Services and Drinking Places 33 49 48%
*Statistics are for working age population (19-65). ºInflation Adjusted.

NEIGHBORHOOD ECONOMIC PROFILES 57
EDUCATION 2000 2015 % Change
Bachelor's Degree or Higher (age 25+)
18,560 34,224 84%
Percentage of Population with Bachelor's or Higher (age 25+)
23% 38% --
Associates Degree (age 25+) 6,292 6,507 3%
LAND USE 2002 2016 % Change
Tax lots devoted to Mixed-Use Residential/Commercial
352 391 11%
Tax lots devoted to Office Buildings 33 50 52%
Tax lots devoted to Standalone Retail 212 226 7%
WORK PLACE* 2000 2015 % Change
Work Inside NYC 33,556 42,838 28%
Percentage of Employed Working Inside NYC
95% 96% --
Work Inside Home Borough 20,015 28,275 41%
Percentage of Employed Working Inside Home Borough
57% 63% --
COMMUTE* 2000 2015 % Change
Commute Time (min) 45.6 43.7 -4%
Public Transit 18,336 23,209 27%
Private Car or Taxi 12,705 14,008 10%
Walk or Bike 3,466 6,353 83%
Work at Home 605 1,037 71%
AGE 2000 2015 % Change
Total Population 116,574 122,845 5%
Youth (Age 0-18) 27,610 25,576 -7%
Working Age Population (age 19-65)
67,071 73,699 10%
Seniors (age 66+) 21,893 23,570 8%
RACE 2000 2015 % Change
White 67,082 69,219 3%
Black 17,337 13,460 -22%
Hispanic 18,387 19,425 6%
Asian 10,013 18,287 83%
BIRTH PLACE 2000 2015 % Change
Born inside the United States
57,637 51,758 -10%
Born outside the United States
58,937 71,087 21%
BK13 | Brighton Beach & Coney Island
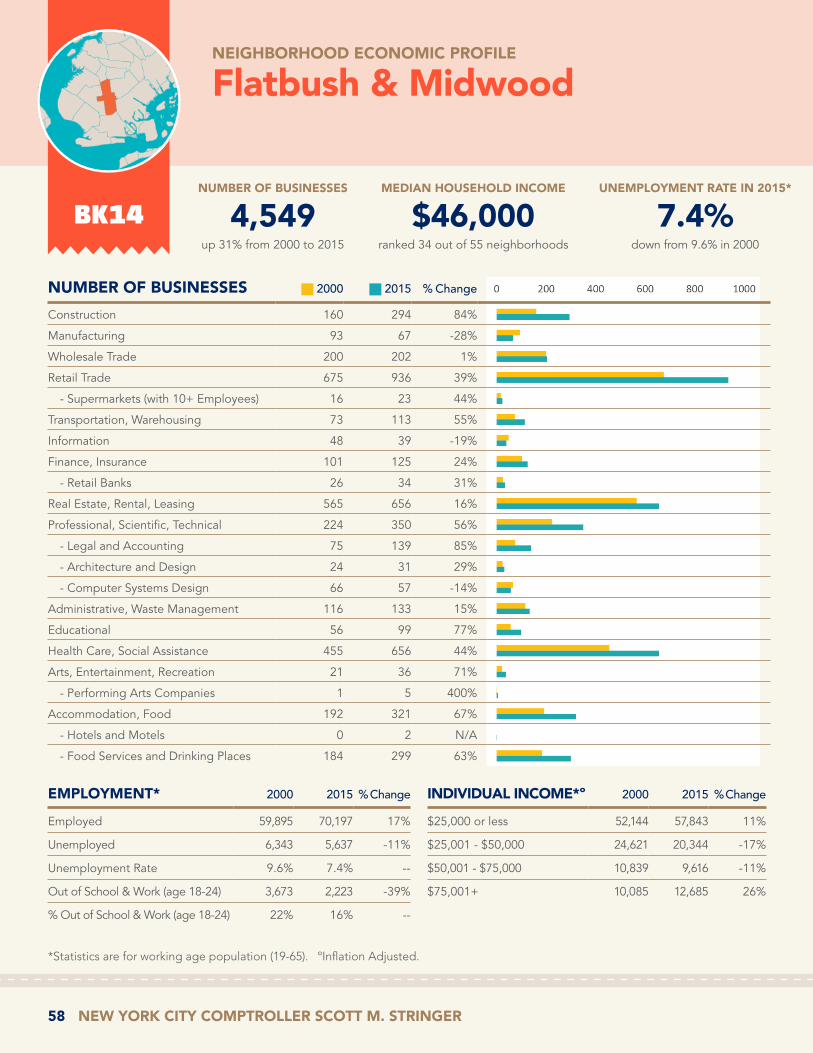
58 NEW YORK CITY COMPTROLLER SCOTT M. STRINGER
UNEMPLOYMENT RATE IN 2015*
7.4%down from 9.6% in 2000
NUMBER OF BUSINESSES
4,549up 31% from 2000 to 2015
MEDIAN HOUSEHOLD INCOME
$46,000ranked 34 out of 55 neighborhoods
BK14
NEIGHBORHOOD ECONOMIC PROFILE
Flatbush & Midwood
EMPLOYMENT* 2000 2015 % Change
Employed 59,895 70,197 17%
Unemployed 6,343 5,637 -11%
Unemployment Rate 9.6% 7.4% --
Out of School & Work (age 18-24) 3,673 2,223 -39%
% Out of School & Work (age 18-24) 22% 16% --
INDIVIDUAL INCOME*º 2000 2015 % Change
$25,000 or less 52,144 57,843 11%
$25,001 - $50,000 24,621 20,344 -17%
$50,001 - $75,000 10,839 9,616 -11%
$75,001+ 10,085 12,685 26%
NUMBER OF BUSINESSES 2000 2015 % Change
Construction 160 294 84%
Manufacturing 93 67 -28%
Wholesale Trade 200 202 1%
Retail Trade 675 936 39%
- Supermarkets (with 10+ Employees) 16 23 44%
Transportation, Warehousing 73 113 55%
Information 48 39 -19%
Finance, Insurance 101 125 24%
- Retail Banks 26 34 31%
Real Estate, Rental, Leasing 565 656 16%
Professional, Scientific, Technical 224 350 56%
- Legal and Accounting 75 139 85%
- Architecture and Design 24 31 29%
- Computer Systems Design 66 57 -14%
Administrative, Waste Management 116 133 15%
Educational 56 99 77%
Health Care, Social Assistance 455 656 44%
Arts, Entertainment, Recreation 21 36 71%
- Performing Arts Companies 1 5 400%
Accommodation, Food 192 321 67%
- Hotels and Motels 0 2 N/A
- Food Services and Drinking Places 184 299 63%
*Statistics are for working age population (19-65). ºInflation Adjusted.

NEIGHBORHOOD ECONOMIC PROFILES 59
EDUCATION 2000 2015 % Change
Bachelor's Degree or Higher (age 25+)
24,572 40,775 66%
Percentage of Population with Bachelor's or Higher (age 25+)
24% 38% --
Associates Degree (age 25+) 6,316 7,691 22%
LAND USE 2002 2016 % Change
Tax lots devoted to Mixed-Use Residential/Commercial
1,087 1,167 7%
Tax lots devoted to Office Buildings 53 90 70%
Tax lots devoted to Standalone Retail 418 446 7%
WORK PLACE* 2000 2015 % Change
Work Inside NYC 55,582 64,984 17%
Percentage of Employed Working Inside NYC
95% 97% --
Work Inside Home Borough 28,299 39,371 39%
Percentage of Employed Working Inside Home Borough
48% 59% --
COMMUTE* 2000 2015 % Change
Commute Time (min) 46 43.5 -6%
Public Transit 35,019 40,693 16%
Private Car or Taxi 17,804 16,020 -10%
Walk or Bike 4,152 7,098 71%
Work at Home 1,276 2,578 102%
AGE 2000 2015 % Change
Total Population 163,638 163,207 0%
Youth (Age 0-18) 48,688 42,856 -12%
Working Age Population (age 19-65)
97,689 100,488 3%
Seniors (age 66+) 17,261 19,863 15%
RACE 2000 2015 % Change
White 61,230 63,555 4%
Black 61,464 52,567 -14%
Hispanic 20,354 24,105 18%
Asian 12,882 17,015 32%
BIRTH PLACE 2000 2015 % Change
Born inside the United States
79,036 91,394 16%
Born outside the United States
84,602 71,813 -15%
BK14 | Flatbush & Midwood

60 NEW YORK CITY COMPTROLLER SCOTT M. STRINGER
UNEMPLOYMENT RATE IN 2015*
7.3%up from 5.8% in 2000
NUMBER OF BUSINESSES
4,779up 42% from 2000 to 2015
MEDIAN HOUSEHOLD INCOME
$55,800ranked 25 out of 55 neighborhoods
BK15
NEIGHBORHOOD ECONOMIC PROFILE
Sheepshead Bay, Gerritsen Beach & Homecrest
EMPLOYMENT* 2000 2015 % Change
Employed 56,371 65,175 16%
Unemployed 3,478 5,137 48%
Unemployment Rate 5.8% 7.3% --
Out of School & Work (age 18-24) 2,499 1,880 -25%
% Out of School & Work (age 18-24) 18% 16% --
INDIVIDUAL INCOME*º 2000 2015 % Change
$25,000 or less 44,604 43,925 -2%
$25,001 - $50,000 20,285 20,564 1%
$50,001 - $75,000 11,559 12,346 7%
$75,001+ 13,871 13,927 0%
NUMBER OF BUSINESSES 2000 2015 % Change
Construction 187 324 73%
Manufacturing 67 69 3%
Wholesale Trade 176 239 36%
Retail Trade 581 756 30%
- Supermarkets (with 10+ Employees) 7 20 186%
Transportation, Warehousing 151 249 65%
Information 38 48 26%
Finance, Insurance 101 125 24%
- Retail Banks 30 47 57%
Real Estate, Rental, Leasing 210 305 45%
Professional, Scientific, Technical 346 637 84%
- Legal and Accounting 88 251 185%
- Architecture and Design 9 32 256%
- Computer Systems Design 150 145 -3%
Administrative, Waste Management 167 176 5%
Educational 38 79 108%
Health Care, Social Assistance 632 987 56%
Arts, Entertainment, Recreation 34 43 26%
- Performing Arts Companies 1 2 100%
Accommodation, Food 200 302 51%
- Hotels and Motels 3 2 -33%
- Food Services and Drinking Places 185 289 56%
*Statistics are for working age population (19-65). ºInflation Adjusted.

NEIGHBORHOOD ECONOMIC PROFILES 61
EDUCATION 2000 2015 % Change
Bachelor's Degree or Higher (age 25+)
30,253 41,324 37%
Percentage of Population with Bachelor's or Higher (age 25+)
29% 40% --
Associates Degree (age 25+) 8,112 6,234 -23%
LAND USE 2002 2016 % Change
Tax lots devoted to Mixed-Use Residential/Commercial
1,091 1,150 5%
Tax lots devoted to Office Buildings 141 179 27%
Tax lots devoted to Standalone Retail 586 667 14%
WORK PLACE* 2000 2015 % Change
Work Inside NYC 52,055 60,044 15%
Percentage of Employed Working Inside NYC
95% 96% --
Work Inside Home Borough 27,869 32,542 17%
Percentage of Employed Working Inside Home Borough
51% 52% --
COMMUTE* 2000 2015 % Change
Commute Time (min) 43.2 45.7 6%
Public Transit 25,584 33,236 30%
Private Car or Taxi 24,396 22,255 -9%
Walk or Bike 3,446 5,409 57%
Work at Home 1,230 1,790 46%
AGE 2000 2015 % Change
Total Population 150,967 147,246 -2%
Youth (Age 0-18) 35,041 33,200 -5%
Working Age Population (age 19-65)
90,319 90,762 0%
Seniors (age 66+) 25,607 23,284 -9%
RACE 2000 2015 % Change
White 113,981 95,758 -16%
Black 5,220 4,119 -21%
Hispanic 9,641 20,312 111%
Asian 18,684 24,440 31%
BIRTH PLACE 2000 2015 % Change
Born inside the United States
81,308 69,140 -15%
Born outside the United States
69,659 78,106 12%
BK15 | Sheepshead Bay, Gerritsen Beach & Homecrest

62 NEW YORK CITY COMPTROLLER SCOTT M. STRINGER
UNEMPLOYMENT RATE IN 2015*
14.6%down from 20.4% in 2000
NUMBER OF BUSINESSES
1,247up 60% from 2000 to 2015
MEDIAN HOUSEHOLD INCOME
$26,400ranked 51 out of 55 neighborhoods
BK16
NEIGHBORHOOD ECONOMIC PROFILE
Brownsville & Ocean Hill
EMPLOYMENT* 2000 2015 % Change
Employed 29,240 44,187 51%
Unemployed 7,498 7,542 1%
Unemployment Rate 20.4% 14.6% --
Out of School & Work (age 18-24) 4,607 4,038 -12%
% Out of School & Work (age 18-24) 37% 29% --
INDIVIDUAL INCOME*º 2000 2015 % Change
$25,000 or less 40,998 54,212 32%
$25,001 - $50,000 14,758 17,498 19%
$50,001 - $75,000 4,608 5,590 21%
$75,001+ 2,606 3,135 20%
NUMBER OF BUSINESSES 2000 2015 % Change
Construction 35 49 40%
Manufacturing 26 21 -19%
Wholesale Trade 25 25 0%
Retail Trade 260 425 63%
- Supermarkets (with 10+ Employees) 10 12 20%
Transportation, Warehousing 8 19 138%
Information 5 13 160%
Finance, Insurance 10 15 50%
- Retail Banks 2 4 100%
Real Estate, Rental, Leasing 65 79 22%
Professional, Scientific, Technical 10 39 290%
- Legal and Accounting 2 17 750%
- Architecture and Design 1 3 200%
- Computer Systems Design 2 7 250%
Administrative, Waste Management 17 24 41%
Educational 11 33 200%
Health Care, Social Assistance 123 180 46%
Arts, Entertainment, Recreation 11 11 0%
- Performing Arts Companies 0 0 N/A
Accommodation, Food 36 139 286%
- Hotels and Motels 0 3 N/A
- Food Services and Drinking Places 34 134 294%
*Statistics are for working age population (19-65). ºInflation Adjusted.

NEIGHBORHOOD ECONOMIC PROFILES 63
EDUCATION 2000 2015 % Change
Bachelor's Degree or Higher (age 25+)
4,993 12,291 146%
Percentage of Population with Bachelor's or Higher (age 25+)
8% 15% --
Associates Degree (age 25+) 2,676 6,087 127%
LAND USE 2002 2016 % Change
Tax lots devoted to Mixed-Use Residential/Commercial
608 606 0%
Tax lots devoted to Office Buildings 17 24 41%
Tax lots devoted to Standalone Retail 269 327 22%
WORK PLACE* 2000 2015 % Change
Work Inside NYC 26,820 41,633 55%
Percentage of Employed Working Inside NYC
96% 97% --
Work Inside Home Borough 14,505 23,974 65%
Percentage of Employed Working Inside Home Borough
52% 56% --
COMMUTE* 2000 2015 % Change
Commute Time (min) 46.5 46.6 0%
Public Transit 17,648 33,228 88%
Private Car or Taxi 7,713 7,646 -1%
Walk or Bike 1,996 1,785 -11%
Work at Home 402 417 4%
AGE 2000 2015 % Change
Total Population 114,262 127,633 12%
Youth (Age 0-18) 43,431 34,003 -22%
Working Age Population (age 19-65)
62,970 80,435 28%
Seniors (age 66+) 7,861 13,195 68%
RACE 2000 2015 % Change
White 781 2,910 273%
Black 87,105 90,393 4%
Hispanic 22,671 30,283 34%
Asian 686 2,487 263%
BIRTH PLACE 2000 2015 % Change
Born inside the United States
82,484 82,508 0%
Born outside the United States
31,778 45,125 42%
BK16 | Brownsville & Ocean Hill

64 NEW YORK CITY COMPTROLLER SCOTT M. STRINGER
UNEMPLOYMENT RATE IN 2015*
7.1%down from 10.9% in 2000
NUMBER OF BUSINESSES
887up 32% from 2000 to 2015
MEDIAN HOUSEHOLD INCOME
$49,200ranked 30 out of 55 neighborhoods
BK17
NEIGHBORHOOD ECONOMIC PROFILE
East Flatbush, Farragut & Rugby
EMPLOYMENT* 2000 2015 % Change
Employed 56,255 64,971 15%
Unemployed 6,892 4,936 -28%
Unemployment Rate 10.9% 7.1% --
Out of School & Work (age 18-24) 3,630 2,998 -17%
% Out of School & Work (age 18-24) 22% 23% --
INDIVIDUAL INCOME*º 2000 2015 % Change
$25,000 or less 47,120 45,171 -4%
$25,001 - $50,000 28,177 26,044 -8%
$50,001 - $75,000 10,747 11,267 5%
$75,001+ 6,635 7,109 7%
NUMBER OF BUSINESSES 2000 2015 % Change
Construction 38 44 16%
Manufacturing 33 23 -30%
Wholesale Trade 38 46 21%
Retail Trade 128 202 58%
- Supermarkets (with 10+ Employees) 6 7 17%
Transportation, Warehousing 45 26 -42%
Information 3 6 100%
Finance, Insurance 16 17 6%
- Retail Banks 4 5 25%
Real Estate, Rental, Leasing 43 43 0%
Professional, Scientific, Technical 19 24 26%
- Legal and Accounting 7 10 43%
- Architecture and Design 3 0 -100%
- Computer Systems Design 2 5 150%
Administrative, Waste Management 12 15 25%
Educational 14 25 79%
Health Care, Social Assistance 105 153 46%
Arts, Entertainment, Recreation 7 7 0%
- Performing Arts Companies 2 3 50%
Accommodation, Food 34 89 162%
- Hotels and Motels 0 1 N/A
- Food Services and Drinking Places 31 77 148%
*Statistics are for working age population (19-65). ºInflation Adjusted.

NEIGHBORHOOD ECONOMIC PROFILES 65
EDUCATION 2000 2015 % Change
Bachelor's Degree or Higher (age 25+)
14,117 20,379 44%
Percentage of Population with Bachelor's or Higher (age 25+)
16% 21% --
Associates Degree (age 25+) 6,598 5,652 -14%
LAND USE 2002 2016 % Change
Tax lots devoted to Mixed-Use Residential/Commercial
1,080 1,098 2%
Tax lots devoted to Office Buildings 29 36 24%
Tax lots devoted to Standalone Retail 269 331 23%
WORK PLACE* 2000 2015 % Change
Work Inside NYC 51,185 61,262 20%
Percentage of Employed Working Inside NYC
94% 96% --
Work Inside Home Borough 27,126 33,328 23%
Percentage of Employed Working Inside Home Borough
50% 52% --
COMMUTE* 2000 2015 % Change
Commute Time (min) 50.6 47.1 -7%
Public Transit 33,120 42,150 27%
Private Car or Taxi 17,518 16,398 -6%
Walk or Bike 3,058 3,759 23%
Work at Home 591 1,432 142%
AGE 2000 2015 % Change
Total Population 146,623 143,004 -2%
Youth (Age 0-18) 41,764 32,865 -21%
Working Age Population (age 19-65)
92,679 89,591 -3%
Seniors (age 66+) 12,180 20,548 69%
RACE 2000 2015 % Change
White 2,954 4,297 45%
Black 128,995 125,436 -3%
Hispanic 8,019 9,732 21%
Asian 2,029 857 -58%
BIRTH PLACE 2000 2015 % Change
Born inside the United States
65,671 65,450 0%
Born outside the United States
80,952 77,554 -4%
BK17 | East Flatbush, Farragut & Rugby
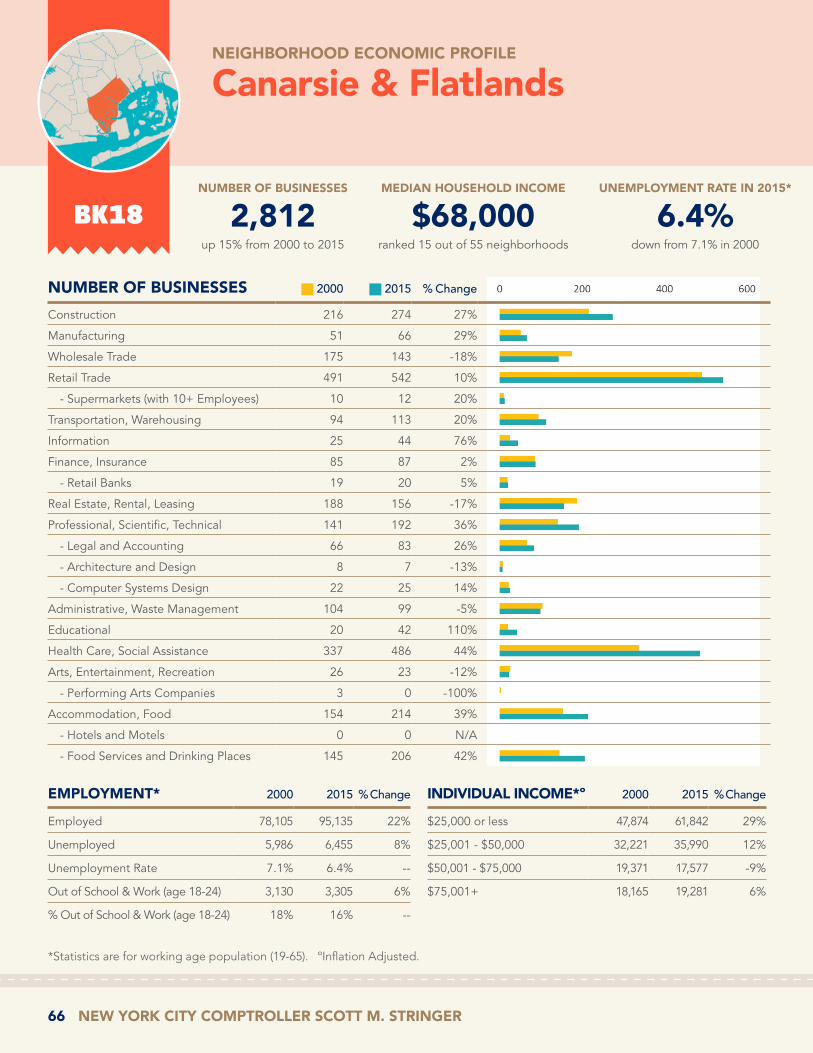
66 NEW YORK CITY COMPTROLLER SCOTT M. STRINGER
UNEMPLOYMENT RATE IN 2015*
6.4%down from 7.1% in 2000
NUMBER OF BUSINESSES
2,812up 15% from 2000 to 2015
MEDIAN HOUSEHOLD INCOME
$68,000ranked 15 out of 55 neighborhoods
BK18
NEIGHBORHOOD ECONOMIC PROFILE
Canarsie & Flatlands
EMPLOYMENT* 2000 2015 % Change
Employed 78,105 95,135 22%
Unemployed 5,986 6,455 8%
Unemployment Rate 7.1% 6.4% --
Out of School & Work (age 18-24) 3,130 3,305 6%
% Out of School & Work (age 18-24) 18% 16% --
INDIVIDUAL INCOME*º 2000 2015 % Change
$25,000 or less 47,874 61,842 29%
$25,001 - $50,000 32,221 35,990 12%
$50,001 - $75,000 19,371 17,577 -9%
$75,001+ 18,165 19,281 6%
NUMBER OF BUSINESSES 2000 2015 % Change
Construction 216 274 27%
Manufacturing 51 66 29%
Wholesale Trade 175 143 -18%
Retail Trade 491 542 10%
- Supermarkets (with 10+ Employees) 10 12 20%
Transportation, Warehousing 94 113 20%
Information 25 44 76%
Finance, Insurance 85 87 2%
- Retail Banks 19 20 5%
Real Estate, Rental, Leasing 188 156 -17%
Professional, Scientific, Technical 141 192 36%
- Legal and Accounting 66 83 26%
- Architecture and Design 8 7 -13%
- Computer Systems Design 22 25 14%
Administrative, Waste Management 104 99 -5%
Educational 20 42 110%
Health Care, Social Assistance 337 486 44%
Arts, Entertainment, Recreation 26 23 -12%
- Performing Arts Companies 3 0 -100%
Accommodation, Food 154 214 39%
- Hotels and Motels 0 0 N/A
- Food Services and Drinking Places 145 206 42%
*Statistics are for working age population (19-65). ºInflation Adjusted.
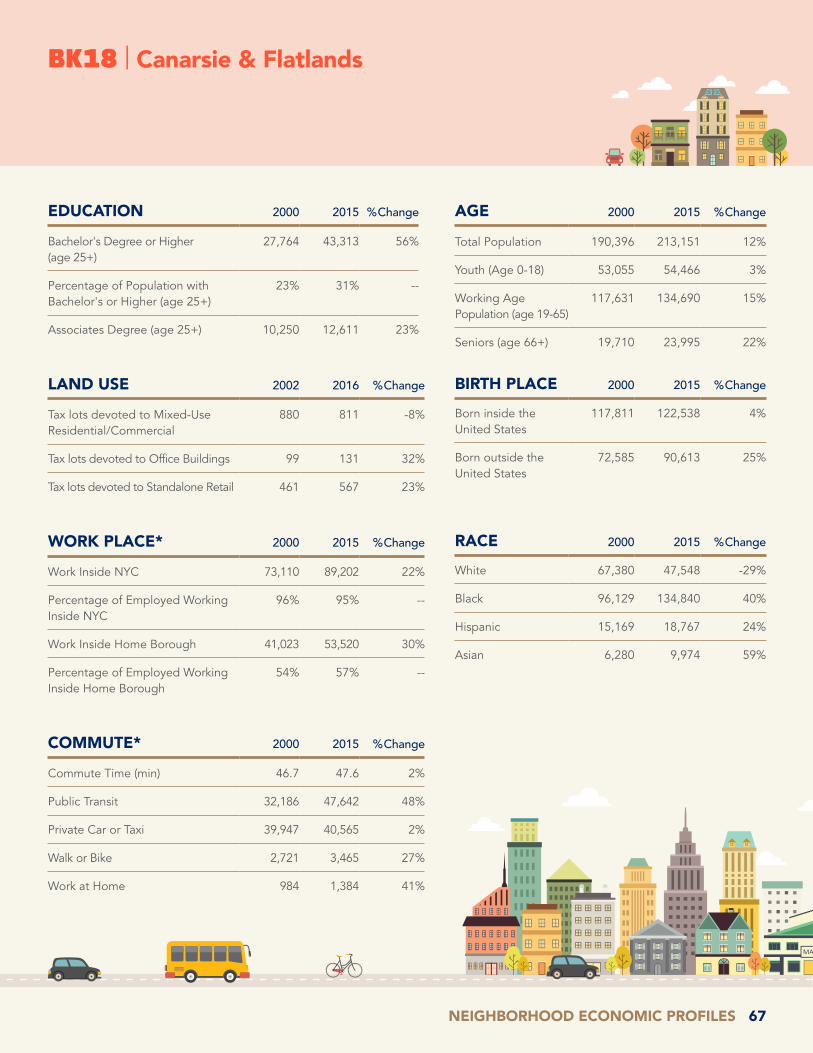
NEIGHBORHOOD ECONOMIC PROFILES 67
EDUCATION 2000 2015 % Change
Bachelor's Degree or Higher (age 25+)
27,764 43,313 56%
Percentage of Population with Bachelor's or Higher (age 25+)
23% 31% --
Associates Degree (age 25+) 10,250 12,611 23%
LAND USE 2002 2016 % Change
Tax lots devoted to Mixed-Use Residential/Commercial
880 811 -8%
Tax lots devoted to Office Buildings 99 131 32%
Tax lots devoted to Standalone Retail 461 567 23%
WORK PLACE* 2000 2015 % Change
Work Inside NYC 73,110 89,202 22%
Percentage of Employed Working Inside NYC
96% 95% --
Work Inside Home Borough 41,023 53,520 30%
Percentage of Employed Working Inside Home Borough
54% 57% --
COMMUTE* 2000 2015 % Change
Commute Time (min) 46.7 47.6 2%
Public Transit 32,186 47,642 48%
Private Car or Taxi 39,947 40,565 2%
Walk or Bike 2,721 3,465 27%
Work at Home 984 1,384 41%
AGE 2000 2015 % Change
Total Population 190,396 213,151 12%
Youth (Age 0-18) 53,055 54,466 3%
Working Age Population (age 19-65)
117,631 134,690 15%
Seniors (age 66+) 19,710 23,995 22%
RACE 2000 2015 % Change
White 67,380 47,548 -29%
Black 96,129 134,840 40%
Hispanic 15,169 18,767 24%
Asian 6,280 9,974 59%
BIRTH PLACE 2000 2015 % Change
Born inside the United States
117,811 122,538 4%
Born outside the United States
72,585 90,613 25%
BK18 | Canarsie & Flatlands

68 NEW YORK CITY COMPTROLLER SCOTT M. STRINGER
UNEMPLOYMENT RATE IN 2015*
5.9%down from 8.1% in 2000
NUMBER OF BUSINESSES
105,553down -2% from 2000 to 2015
MEDIAN HOUSEHOLD INCOME
$74,600
NEIGHBORHOOD ECONOMIC PROFILE
Manhattan
EMPLOYMENT* 2000 2015 % Change
Employed 740,660 862,722 16%
Unemployed 65,689 54,342 -17%
Unemployment Rate 8.1% 5.9% --
Out of School & Work (age 18-24) 26,520 19,315 -27%
% Out of School & Work (age 18-24) 17% 13% --
INDIVIDUAL INCOME*º 2000 2015 % Change
$25,000 or less 446,009 471,968 6%
$25,001 - $50,000 205,814 202,822 -1%
$50,001 - $75,000 145,044 146,536 1%
$75,001+ 298,623 343,390 15%
NUMBER OF BUSINESSES 2000 2015 % Change
Construction 1,971 2,020 2%
Manufacturing 4,191 1,880 -55%
Wholesale Trade 11,249 8,139 -28%
Retail Trade 11,621 11,517 -1%
- Supermarkets (with 10+ Employees) 227 312 37%
Transportation, Warehousing 1,104 781 -29%
Information 4,555 4,484 -2%
Finance, Insurance 10,911 7,265 -33%
- Retail Banks 867 1,014 17%
Real Estate, Rental, Leasing 8,433 9,825 17%
Professional, Scientific, Technical 17,014 17,941 5%
- Legal and Accounting 5,243 5,332 2%
- Architecture and Design 3,161 3,368 7%
- Computer Systems Design 2,271 2,357 4%
Administrative, Waste Management 4,935 4,486 -9%
Educational 1,085 1,669 54%
Health Care, Social Assistance 6,616 8,283 25%
Arts, Entertainment, Recreation 3,193 4,572 43%
- Performing Arts Companies 825 868 5%
Accommodation, Food 7,710 10,014 30%
- Hotels and Motels 262 434 66%
- Food Services and Drinking Places 6,815 8,842 30%
*Statistics are for working age population (19-65). ºInflation Adjusted.

NEIGHBORHOOD ECONOMIC PROFILES 69
EDUCATION 2000 2015 % Change
Bachelor's Degree or Higher (age 25+)
558,096 760,051 36%
Percentage of Population with Bachelor's or Higher (age 25+)
49% 61% --
Associates Degree (age 25+) 37,592 46,451 24%
LAND USE 2002 2016 % Change
Tax lots devoted to Mixed-Use Residential/Commercial
9,432 11,341 20%
Tax lots devoted to Office Buildings 2,083 2,325 12%
Tax lots devoted to Standalone Retail 2,853 2,445 -14%
WORK PLACE* 2000 2015 % Change
Work Inside NYC 674,890 793,118 18%
Percentage of Employed Working Inside NYC
93% 94% --
Work Inside Home Borough 605,712 709,806 17%
Percentage of Employed Working Inside Home Borough
84% 84% --
COMMUTE* 2000 2015 % Change
Commute Time (min) 30.3 31.6 4%
Public Transit 404,132 510,236 26%
Private Car or Taxi 113,567 79,547 -30%
Walk or Bike 160,965 196,646 22%
Work at Home 39,257 54,070 38%
AGE 2000 2015 % Change
Total Population 1,549,982 1,644,184 6%
Youth (Age 0-18) 276,233 255,173 -8%
Working Age Population (age 19-65)
1,095,490 1,164,716 6%
Seniors (age 66+) 178,259 224,295 26%
RACE 2000 2015 % Change
White 703,110 767,991 9%
Black 234,525 202,973 -13%
Hispanic 427,171 426,420 0%
Asian 143,180 199,524 39%
BIRTH PLACE 2000 2015 % Change
Born inside the United States
1,022,865 1,109,355 8%
Born outside the United States
527,117 534,829 1%
Manhattan
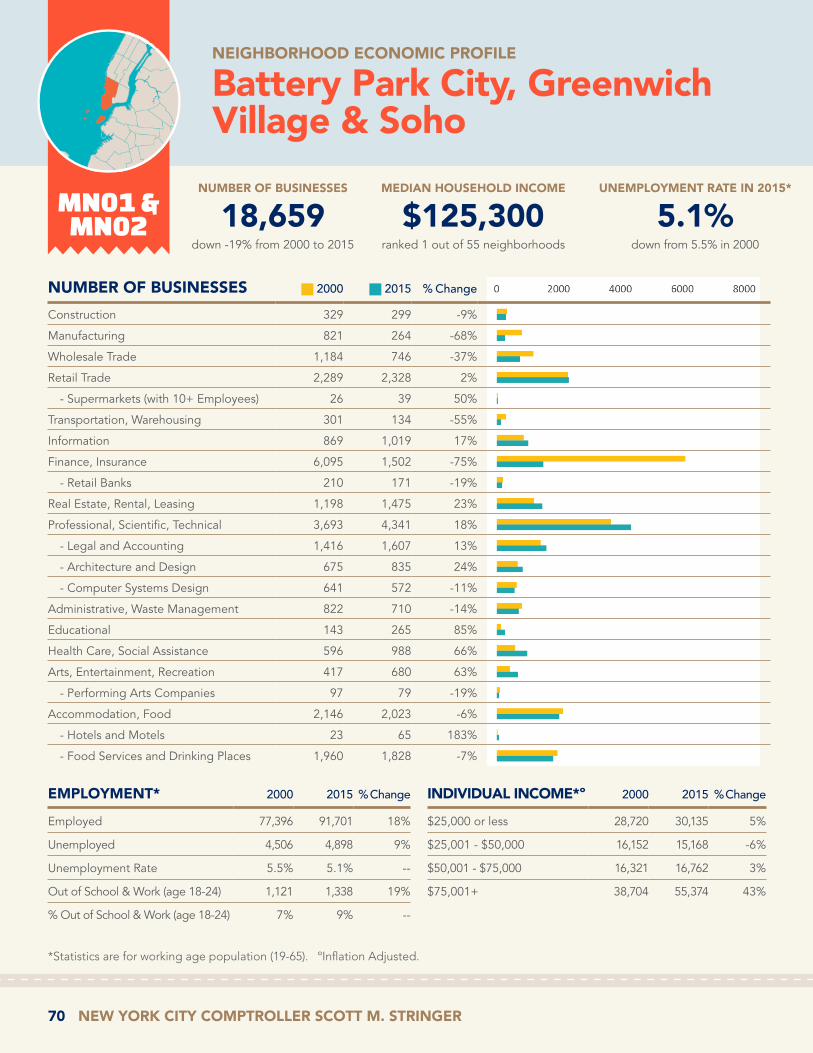
70 NEW YORK CITY COMPTROLLER SCOTT M. STRINGER
UNEMPLOYMENT RATE IN 2015*
5.1%down from 5.5% in 2000
NUMBER OF BUSINESSES
18,659down -19% from 2000 to 2015
MEDIAN HOUSEHOLD INCOME
$125,300ranked 1 out of 55 neighborhoods
MN01 & MN02
NEIGHBORHOOD ECONOMIC PROFILE
Battery Park City, Greenwich Village & Soho
EMPLOYMENT* 2000 2015 % Change
Employed 77,396 91,701 18%
Unemployed 4,506 4,898 9%
Unemployment Rate 5.5% 5.1% --
Out of School & Work (age 18-24) 1,121 1,338 19%
% Out of School & Work (age 18-24) 7% 9% --
INDIVIDUAL INCOME*º 2000 2015 % Change
$25,000 or less 28,720 30,135 5%
$25,001 - $50,000 16,152 15,168 -6%
$50,001 - $75,000 16,321 16,762 3%
$75,001+ 38,704 55,374 43%
NUMBER OF BUSINESSES 2000 2015 % Change
Construction 329 299 -9%
Manufacturing 821 264 -68%
Wholesale Trade 1,184 746 -37%
Retail Trade 2,289 2,328 2%
- Supermarkets (with 10+ Employees) 26 39 50%
Transportation, Warehousing 301 134 -55%
Information 869 1,019 17%
Finance, Insurance 6,095 1,502 -75%
- Retail Banks 210 171 -19%
Real Estate, Rental, Leasing 1,198 1,475 23%
Professional, Scientific, Technical 3,693 4,341 18%
- Legal and Accounting 1,416 1,607 13%
- Architecture and Design 675 835 24%
- Computer Systems Design 641 572 -11%
Administrative, Waste Management 822 710 -14%
Educational 143 265 85%
Health Care, Social Assistance 596 988 66%
Arts, Entertainment, Recreation 417 680 63%
- Performing Arts Companies 97 79 -19%
Accommodation, Food 2,146 2,023 -6%
- Hotels and Motels 23 65 183%
- Food Services and Drinking Places 1,960 1,828 -7%
*Statistics are for working age population (19-65). ºInflation Adjusted.

NEIGHBORHOOD ECONOMIC PROFILES 71
EDUCATION 2000 2015 % Change
Bachelor's Degree or Higher (age 25+)
68,823 102,255 49%
Percentage of Population with Bachelor's or Higher (age 25+)
70% 85% --
Associates Degree (age 25+) 2,314 2,931 27%
LAND USE 2002 2016 % Change
Tax lots devoted to Mixed-Use Residential/Commercial
1,638 2,212 35%
Tax lots devoted to Office Buildings 461 516 12%
Tax lots devoted to Standalone Retail 634 509 -20%
WORK PLACE* 2000 2015 % Change
Work Inside NYC 71,357 86,133 21%
Percentage of Employed Working Inside NYC
95% 95% --
Work Inside Home Borough 67,267 82,253 22%
Percentage of Employed Working Inside Home Borough
89% 91% --
COMMUTE* 2000 2015 % Change
Commute Time (min) 24.3 23.5 -3%
Public Transit 39,554 44,347 12%
Private Car or Taxi 8,576 5,930 -31%
Walk or Bike 20,617 31,749 54%
Work at Home 5,854 8,435 44%
AGE 2000 2015 % Change
Total Population 125,451 153,447 22%
Youth (Age 0-18) 13,169 21,637 64%
Working Age Population (age 19-65)
99,897 117,439 18%
Seniors (age 66+) 12,385 14,371 16%
RACE 2000 2015 % Change
White 91,570 106,534 16%
Black 3,637 4,260 17%
Hispanic 7,317 8,038 10%
Asian 18,768 28,942 54%
BIRTH PLACE 2000 2015 % Change
Born inside the United States
92,957 111,225 20%
Born outside the United States
32,494 42,222 30%
MN01 & MN02 | Battery Park City, Greenwich Village & Soho

72 NEW YORK CITY COMPTROLLER SCOTT M. STRINGER
UNEMPLOYMENT RATE IN 2015*
5.7%down from 9.8% in 2000
NUMBER OF BUSINESSES
8,561up 25% from 2000 to 2015
MEDIAN HOUSEHOLD INCOME
$40,000ranked 45 out of 55 neighborhoods
MN03
NEIGHBORHOOD ECONOMIC PROFILE
Chinatown & Lower East Side
EMPLOYMENT* 2000 2015 % Change
Employed 71,265 78,477 10%
Unemployed 7,743 4,701 -39%
Unemployment Rate 9.8% 5.7% --
Out of School & Work (age 18-24) 3,995 1,652 -59%
% Out of School & Work (age 18-24) 19% 8% --
INDIVIDUAL INCOME*º 2000 2015 % Change
$25,000 or less 66,304 60,346 -9%
$25,001 - $50,000 23,187 17,584 -24%
$50,001 - $75,000 12,439 13,553 9%
$75,001+ 12,396 24,797 100%
NUMBER OF BUSINESSES 2000 2015 % Change
Construction 192 198 3%
Manufacturing 228 125 -45%
Wholesale Trade 486 336 -31%
Retail Trade 1,098 1,196 9%
- Supermarkets (with 10+ Employees) 24 36 50%
Transportation, Warehousing 56 71 27%
Information 224 335 50%
Finance, Insurance 133 200 50%
- Retail Banks 40 58 45%
Real Estate, Rental, Leasing 655 815 24%
Professional, Scientific, Technical 851 1,120 32%
- Legal and Accounting 80 154 93%
- Architecture and Design 283 316 12%
- Computer Systems Design 138 177 28%
Administrative, Waste Management 222 233 5%
Educational 82 115 40%
Health Care, Social Assistance 522 632 21%
Arts, Entertainment, Recreation 181 650 259%
- Performing Arts Companies 53 81 53%
Accommodation, Food 1,021 1,496 47%
- Hotels and Motels 9 32 256%
- Food Services and Drinking Places 962 1,419 48%
*Statistics are for working age population (19-65). ºInflation Adjusted.
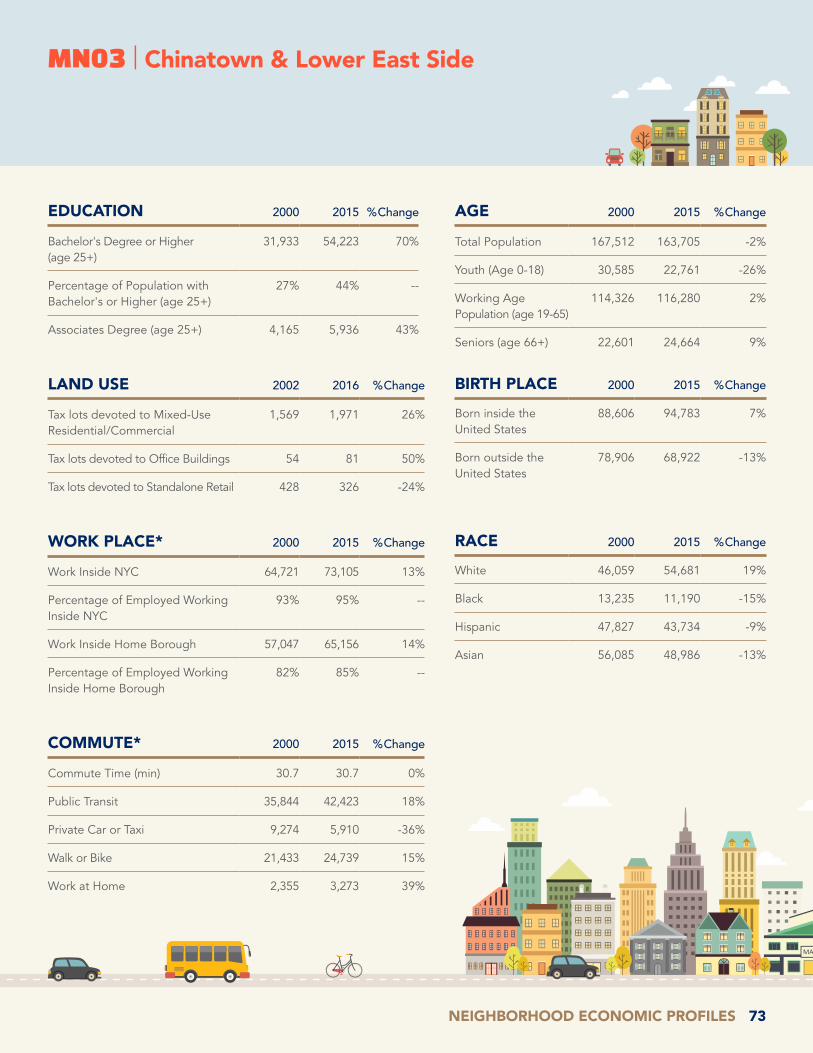
NEIGHBORHOOD ECONOMIC PROFILES 73
EDUCATION 2000 2015 % Change
Bachelor's Degree or Higher (age 25+)
31,933 54,223 70%
Percentage of Population with Bachelor's or Higher (age 25+)
27% 44% --
Associates Degree (age 25+) 4,165 5,936 43%
LAND USE 2002 2016 % Change
Tax lots devoted to Mixed-Use Residential/Commercial
1,569 1,971 26%
Tax lots devoted to Office Buildings 54 81 50%
Tax lots devoted to Standalone Retail 428 326 -24%
WORK PLACE* 2000 2015 % Change
Work Inside NYC 64,721 73,105 13%
Percentage of Employed Working Inside NYC
93% 95% --
Work Inside Home Borough 57,047 65,156 14%
Percentage of Employed Working Inside Home Borough
82% 85% --
COMMUTE* 2000 2015 % Change
Commute Time (min) 30.7 30.7 0%
Public Transit 35,844 42,423 18%
Private Car or Taxi 9,274 5,910 -36%
Walk or Bike 21,433 24,739 15%
Work at Home 2,355 3,273 39%
AGE 2000 2015 % Change
Total Population 167,512 163,705 -2%
Youth (Age 0-18) 30,585 22,761 -26%
Working Age Population (age 19-65)
114,326 116,280 2%
Seniors (age 66+) 22,601 24,664 9%
RACE 2000 2015 % Change
White 46,059 54,681 19%
Black 13,235 11,190 -15%
Hispanic 47,827 43,734 -9%
Asian 56,085 48,986 -13%
BIRTH PLACE 2000 2015 % Change
Born inside the United States
88,606 94,783 7%
Born outside the United States
78,906 68,922 -13%
MN03 | Chinatown & Lower East Side
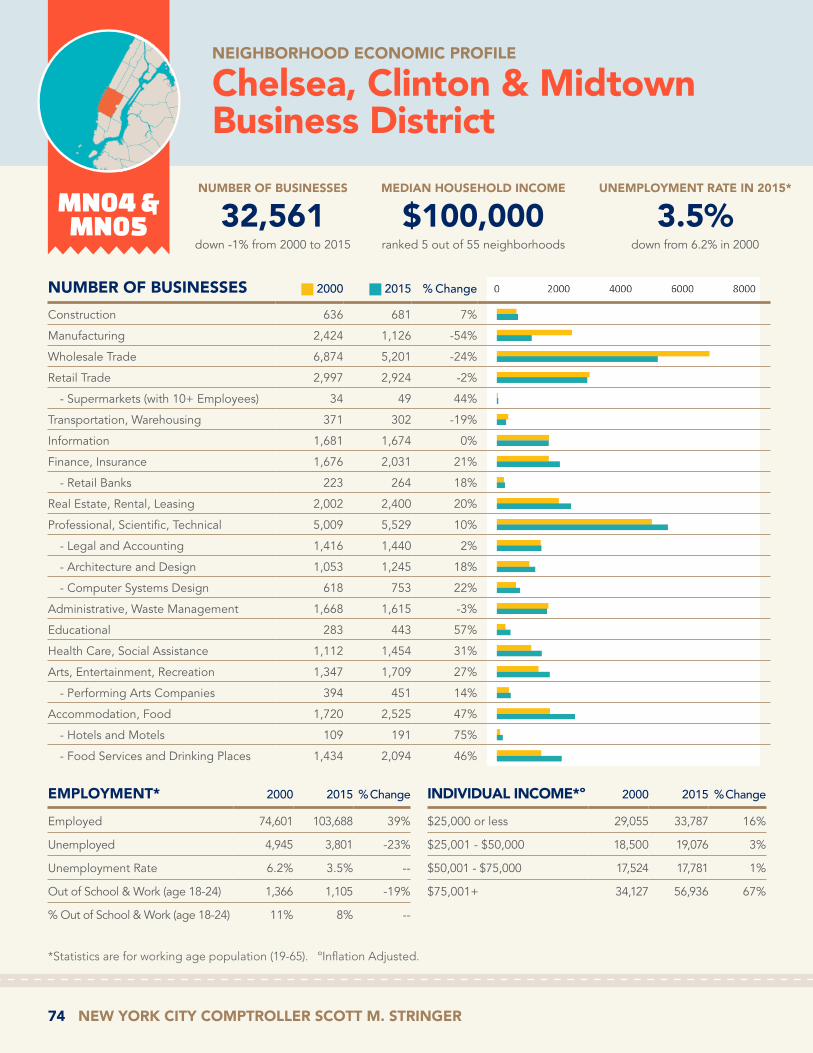
74 NEW YORK CITY COMPTROLLER SCOTT M. STRINGER
UNEMPLOYMENT RATE IN 2015*
3.5%down from 6.2% in 2000
NUMBER OF BUSINESSES
32,561down -1% from 2000 to 2015
MEDIAN HOUSEHOLD INCOME
$100,000ranked 5 out of 55 neighborhoods
MN04 & MN05
NEIGHBORHOOD ECONOMIC PROFILE
Chelsea, Clinton & Midtown Business District
EMPLOYMENT* 2000 2015 % Change
Employed 74,601 103,688 39%
Unemployed 4,945 3,801 -23%
Unemployment Rate 6.2% 3.5% --
Out of School & Work (age 18-24) 1,366 1,105 -19%
% Out of School & Work (age 18-24) 11% 8% --
INDIVIDUAL INCOME*º 2000 2015 % Change
$25,000 or less 29,055 33,787 16%
$25,001 - $50,000 18,500 19,076 3%
$50,001 - $75,000 17,524 17,781 1%
$75,001+ 34,127 56,936 67%
NUMBER OF BUSINESSES 2000 2015 % Change
Construction 636 681 7%
Manufacturing 2,424 1,126 -54%
Wholesale Trade 6,874 5,201 -24%
Retail Trade 2,997 2,924 -2%
- Supermarkets (with 10+ Employees) 34 49 44%
Transportation, Warehousing 371 302 -19%
Information 1,681 1,674 0%
Finance, Insurance 1,676 2,031 21%
- Retail Banks 223 264 18%
Real Estate, Rental, Leasing 2,002 2,400 20%
Professional, Scientific, Technical 5,009 5,529 10%
- Legal and Accounting 1,416 1,440 2%
- Architecture and Design 1,053 1,245 18%
- Computer Systems Design 618 753 22%
Administrative, Waste Management 1,668 1,615 -3%
Educational 283 443 57%
Health Care, Social Assistance 1,112 1,454 31%
Arts, Entertainment, Recreation 1,347 1,709 27%
- Performing Arts Companies 394 451 14%
Accommodation, Food 1,720 2,525 47%
- Hotels and Motels 109 191 75%
- Food Services and Drinking Places 1,434 2,094 46%
*Statistics are for working age population (19-65). ºInflation Adjusted.

NEIGHBORHOOD ECONOMIC PROFILES 75
EDUCATION 2000 2015 % Change
Bachelor's Degree or Higher (age 25+)
62,024 100,110 61%
Percentage of Population with Bachelor's or Higher (age 25+)
62% 75% --
Associates Degree (age 25+) 3,046 4,007 32%
LAND USE 2002 2016 % Change
Tax lots devoted to Mixed-Use Residential/Commercial
1,082 1,620 50%
Tax lots devoted to Office Buildings 1,065 1,261 18%
Tax lots devoted to Standalone Retail 708 648 -8%
WORK PLACE* 2000 2015 % Change
Work Inside NYC 68,614 94,123 37%
Percentage of Employed Working Inside NYC
93% 93% --
Work Inside Home Borough 64,181 85,912 34%
Percentage of Employed Working Inside Home Borough
87% 85% --
COMMUTE* 2000 2015 % Change
Commute Time (min) 24 27.1 13%
Public Transit 34,570 50,733 47%
Private Car or Taxi 8,815 7,145 -19%
Walk or Bike 25,070 36,304 45%
Work at Home 4,654 5,265 13%
AGE 2000 2015 % Change
Total Population 123,136 159,649 30%
Youth (Age 0-18) 11,424 14,114 24%
Working Age Population (age 19-65)
99,206 127,580 29%
Seniors (age 66+) 12,506 17,955 44%
RACE 2000 2015 % Change
White 79,338 95,943 21%
Black 8,193 8,820 8%
Hispanic 19,844 22,298 12%
Asian 11,661 28,883 148%
BIRTH PLACE 2000 2015 % Change
Born inside the United States
87,027 112,221 29%
Born outside the United States
36,109 47,428 31%
MN04 & MN05 | Chelsea, Clinton & Midtown Business District

76 NEW YORK CITY COMPTROLLER SCOTT M. STRINGER
UNEMPLOYMENT RATE IN 2015*
4.4%up from 4.2% in 2000
NUMBER OF BUSINESSES
22,381down -8% from 2000 to 2015
MEDIAN HOUSEHOLD INCOME
$103,000ranked 3 out of 55 neighborhoods
MN06
NEIGHBORHOOD ECONOMIC PROFILE
Murray Hill, Gramercy & Stuyvesant Town
EMPLOYMENT* 2000 2015 % Change
Employed 88,909 83,850 -6%
Unemployed 3,911 3,838 -2%
Unemployment Rate 4.2% 4.4% --
Out of School & Work (age 18-24) 957 1,299 36%
% Out of School & Work (age 18-24) 7% 8% --
INDIVIDUAL INCOME*º 2000 2015 % Change
$25,000 or less 24,948 25,641 3%
$25,001 - $50,000 18,829 13,635 -28%
$50,001 - $75,000 19,329 18,279 -5%
$75,001+ 49,956 48,634 -3%
NUMBER OF BUSINESSES 2000 2015 % Change
Construction 403 388 -4%
Manufacturing 471 204 -57%
Wholesale Trade 2,111 1,369 -35%
Retail Trade 1,802 1,521 -16%
- Supermarkets (with 10+ Employees) 27 49 81%
Transportation, Warehousing 231 126 -45%
Information 1,244 930 -25%
Finance, Insurance 2,486 2,797 13%
- Retail Banks 281 334 19%
Real Estate, Rental, Leasing 2,027 2,039 1%
Professional, Scientific, Technical 5,595 4,856 -13%
- Legal and Accounting 2,054 1,826 -11%
- Architecture and Design 784 586 -25%
- Computer Systems Design 525 528 1%
Administrative, Waste Management 1,613 1,324 -18%
Educational 228 267 17%
Health Care, Social Assistance 1,254 1,681 34%
Arts, Entertainment, Recreation 629 633 1%
- Performing Arts Companies 131 113 -14%
Accommodation, Food 1,170 1,553 33%
- Hotels and Motels 80 101 26%
- Food Services and Drinking Places 974 1,316 35%
*Statistics are for working age population (19-65). ºInflation Adjusted.

NEIGHBORHOOD ECONOMIC PROFILES 77
EDUCATION 2000 2015 % Change
Bachelor's Degree or Higher (age 25+)
83,323 97,202 17%
Percentage of Population with Bachelor's or Higher (age 25+)
70% 85% --
Associates Degree (age 25+) 4,580 1,988 -57%
LAND USE 2002 2016 % Change
Tax lots devoted to Mixed-Use Residential/Commercial
773 839 9%
Tax lots devoted to Office Buildings 219 174 -21%
Tax lots devoted to Standalone Retail 196 172 -12%
WORK PLACE* 2000 2015 % Change
Work Inside NYC 82,067 79,876 -3%
Percentage of Employed Working Inside NYC
94% 96% --
Work Inside Home Borough 75,688 75,338 0%
Percentage of Employed Working Inside Home Borough
87% 91% --
COMMUTE* 2000 2015 % Change
Commute Time (min) 26 26.9 3%
Public Transit 38,074 38,117 0%
Private Car or Taxi 13,727 6,109 -55%
Walk or Bike 30,048 32,966 10%
Work at Home 5,035 6,007 19%
AGE 2000 2015 % Change
Total Population 144,479 140,778 -3%
Youth (Age 0-18) 12,270 10,635 -13%
Working Age Population (age 19-65)
113,062 106,189 -6%
Seniors (age 66+) 19,147 23,954 25%
RACE 2000 2015 % Change
White 109,713 98,774 -10%
Black 5,158 6,166 20%
Hispanic 10,335 9,380 -9%
Asian 14,926 23,681 59%
BIRTH PLACE 2000 2015 % Change
Born inside the United States
107,878 105,001 -3%
Born outside the United States
36,601 35,777 -2%
MN06 | Murray Hill, Gramercy & Stuyvesant Town

78 NEW YORK CITY COMPTROLLER SCOTT M. STRINGER
UNEMPLOYMENT RATE IN 2015*
3.5%down from 4.0% in 2000
NUMBER OF BUSINESSES
6,513up 10% from 2000 to 2015
MEDIAN HOUSEHOLD INCOME
$89,560ranked 6 out of 55 neighborhoods
MN07
NEIGHBORHOOD ECONOMIC PROFILE
Upper West Side & West Side
EMPLOYMENT* 2000 2015 % Change
Employed 111,622 99,559 -11%
Unemployed 4,602 3,581 -22%
Unemployment Rate 4.0% 3.5% --
Out of School & Work (age 18-24) 1,356 2,786 105%
% Out of School & Work (age 18-24) 11% 25% --
INDIVIDUAL INCOME*º 2000 2015 % Change
$25,000 or less 36,456 39,242 8%
$25,001 - $50,000 23,499 18,526 -21%
$50,001 - $75,000 21,715 15,570 -28%
$75,001+ 61,229 53,089 -13%
NUMBER OF BUSINESSES 2000 2015 % Change
Construction 118 97 -18%
Manufacturing 68 43 -37%
Wholesale Trade 166 136 -18%
Retail Trade 744 666 -10%
- Supermarkets (with 10+ Employees) 34 40 18%
Transportation, Warehousing 30 17 -43%
Information 258 236 -9%
Finance, Insurance 120 193 61%
- Retail Banks 29 50 72%
Real Estate, Rental, Leasing 802 942 17%
Professional, Scientific, Technical 807 814 1%
- Legal and Accounting 110 91 -17%
- Architecture and Design 133 142 7%
- Computer Systems Design 207 145 -30%
Administrative, Waste Management 198 175 -12%
Educational 121 219 81%
Health Care, Social Assistance 628 763 21%
Arts, Entertainment, Recreation 364 473 30%
- Performing Arts Companies 107 84 -21%
Accommodation, Food 508 656 29%
- Hotels and Motels 17 20 18%
- Food Services and Drinking Places 452 564 25%
*Statistics are for working age population (19-65). ºInflation Adjusted.

NEIGHBORHOOD ECONOMIC PROFILES 79
EDUCATION 2000 2015 % Change
Bachelor's Degree or Higher (age 25+)
106,486 109,874 3%
Percentage of Population with Bachelor's or Higher (age 25+)
68% 73% --
Associates Degree (age 25+) 4,273 3,681 -14%
LAND USE 2002 2016 % Change
Tax lots devoted to Mixed-Use Residential/Commercial
677 737 9%
Tax lots devoted to Office Buildings 33 31 -6%
Tax lots devoted to Standalone Retail 81 54 -33%
WORK PLACE* 2000 2015 % Change
Work Inside NYC 102,564 91,956 -10%
Percentage of Employed Working Inside NYC
94% 94% --
Work Inside Home Borough 95,455 85,872 -10%
Percentage of Employed Working Inside Home Borough
87% 88% --
COMMUTE* 2000 2015 % Change
Commute Time (min) 29.9 32.5 9%
Public Transit 69,189 67,171 -3%
Private Car or Taxi 16,030 8,742 -45%
Walk or Bike 15,411 12,817 -17%
Work at Home 8,363 8,947 7%
AGE 2000 2015 % Change
Total Population 194,640 189,347 -3%
Youth (Age 0-18) 26,900 27,825 3%
Working Age Population (age 19-65)
142,899 126,427 -12%
Seniors (age 66+) 24,841 35,095 41%
RACE 2000 2015 % Change
White 131,693 125,982 -4%
Black 17,804 15,257 -14%
Hispanic 29,827 24,953 -16%
Asian 10,455 15,195 45%
BIRTH PLACE 2000 2015 % Change
Born inside the United States
144,428 140,516 -3%
Born outside the United States
50,212 48,831 -3%
MN07 | Upper West Side & West Side

80 NEW YORK CITY COMPTROLLER SCOTT M. STRINGER
UNEMPLOYMENT RATE IN 2015*
3.6%up from 3.3% in 2000
NUMBER OF BUSINESSES
9,068up 0% from 2000 to 2015
MEDIAN HOUSEHOLD INCOME
$100,000ranked 4 out of 55 neighborhoods
MN08
NEIGHBORHOOD ECONOMIC PROFILE
Upper East Side
EMPLOYMENT* 2000 2015 % Change
Employed 128,185 112,721 -12%
Unemployed 4,390 4,199 -4%
Unemployment Rate 3.3% 3.6% --
Out of School & Work (age 18-24) 1,165 154 -87%
% Out of School & Work (age 18-24) 9% 2% --
INDIVIDUAL INCOME*º 2000 2015 % Change
$25,000 or less 34,018 30,669 -10%
$25,001 - $50,000 24,988 25,896 4%
$50,001 - $75,000 25,540 20,739 -19%
$75,001+ 76,375 59,676 -22%
NUMBER OF BUSINESSES 2000 2015 % Change
Construction 154 142 -8%
Manufacturing 107 59 -45%
Wholesale Trade 321 236 -26%
Retail Trade 1,369 1,249 -9%
- Supermarkets (with 10+ Employees) 37 36 -3%
Transportation, Warehousing 48 33 -31%
Information 192 145 -24%
Finance, Insurance 263 314 19%
- Retail Banks 49 67 37%
Real Estate, Rental, Leasing 903 978 8%
Professional, Scientific, Technical 875 856 -2%
- Legal and Accounting 115 91 -21%
- Architecture and Design 202 180 -11%
- Computer Systems Design 114 111 -3%
Administrative, Waste Management 271 244 -10%
Educational 127 178 40%
Health Care, Social Assistance 1,828 1,770 -3%
Arts, Entertainment, Recreation 192 256 33%
- Performing Arts Companies 26 26 0%
Accommodation, Food 693 783 13%
- Hotels and Motels 20 16 -20%
- Food Services and Drinking Places 627 702 12%
*Statistics are for working age population (19-65). ºInflation Adjusted.

NEIGHBORHOOD ECONOMIC PROFILES 81
EDUCATION 2000 2015 % Change
Bachelor's Degree or Higher (age 25+)
133,595 134,350 1%
Percentage of Population with Bachelor's or Higher (age 25+)
75% 79% --
Associates Degree (age 25+) 4,632 6,341 37%
LAND USE 2002 2016 % Change
Tax lots devoted to Mixed-Use Residential/Commercial
1,633 1,589 -3%
Tax lots devoted to Office Buildings 154 141 -8%
Tax lots devoted to Standalone Retail 227 214 -6%
WORK PLACE* 2000 2015 % Change
Work Inside NYC 118,549 101,125 -15%
Percentage of Employed Working Inside NYC
94% 93% --
Work Inside Home Borough 110,093 93,075 -15%
Percentage of Employed Working Inside Home Borough
88% 86% --
COMMUTE* 2000 2015 % Change
Commute Time (min) 30 30.9 3%
Public Transit 70,612 63,046 -11%
Private Car or Taxi 23,268 15,126 -35%
Walk or Bike 23,525 24,184 3%
Work at Home 7,316 4,039 -45%
AGE 2000 2015 % Change
Total Population 216,825 214,820 -1%
Youth (Age 0-18) 26,723 35,286 32%
Working Age Population (age 19-65)
160,921 136,980 -15%
Seniors (age 66+) 29,181 42,554 46%
RACE 2000 2015 % Change
White 179,089 161,373 -10%
Black 6,096 6,417 5%
Hispanic 13,496 17,280 28%
Asian 14,365 22,293 55%
BIRTH PLACE 2000 2015 % Change
Born inside the United States
164,553 161,080 -2%
Born outside the United States
52,272 53,740 3%
MN08 | Upper East Side

82 NEW YORK CITY COMPTROLLER SCOTT M. STRINGER
UNEMPLOYMENT RATE IN 2015*
6.7%down from 16.8% in 2000
NUMBER OF BUSINESSES
1,876up 49% from 2000 to 2015
MEDIAN HOUSEHOLD INCOME
$50,000ranked 28 out of 55 neighborhoods
MN09
NEIGHBORHOOD ECONOMIC PROFILE
Hamilton Heights, Manhattanville & West Harlem
EMPLOYMENT* 2000 2015 % Change
Employed 45,509 61,838 36%
Unemployed 9,167 4,448 -51%
Unemployment Rate 16.8% 6.7% --
Out of School & Work (age 18-24) 3,072 1,782 -42%
% Out of School & Work (age 18-24) 15% 9% --
INDIVIDUAL INCOME*º 2000 2015 % Change
$25,000 or less 49,877 54,606 9%
$25,001 - $50,000 17,786 17,958 1%
$50,001 - $75,000 8,279 8,055 -3%
$75,001+ 8,526 12,384 45%
NUMBER OF BUSINESSES 2000 2015 % Change
Construction 36 59 64%
Manufacturing 17 8 -53%
Wholesale Trade 27 23 -15%
Retail Trade 261 336 29%
- Supermarkets (with 10+ Employees) 10 13 30%
Transportation, Warehousing 10 16 60%
Information 30 60 100%
Finance, Insurance 27 58 115%
- Retail Banks 9 22 144%
Real Estate, Rental, Leasing 169 288 70%
Professional, Scientific, Technical 29 120 314%
- Legal and Accounting 10 29 190%
- Architecture and Design 8 22 175%
- Computer Systems Design 2 22 1000%
Administrative, Waste Management 32 29 -9%
Educational 39 58 49%
Health Care, Social Assistance 134 198 48%
Arts, Entertainment, Recreation 21 53 152%
- Performing Arts Companies 7 10 43%
Accommodation, Food 118 232 97%
- Hotels and Motels 2 4 100%
- Food Services and Drinking Places 100 211 111%
*Statistics are for working age population (19-65). ºInflation Adjusted.

NEIGHBORHOOD ECONOMIC PROFILES 83
EDUCATION 2000 2015 % Change
Bachelor's Degree or Higher (age 25+)
24,983 46,054 84%
Percentage of Population with Bachelor's or Higher (age 25+)
32% 51% --
Associates Degree (age 25+) 3,218 2,212 -31%
LAND USE 2002 2016 % Change
Tax lots devoted to Mixed-Use Residential/Commercial
309 313 1%
Tax lots devoted to Office Buildings 13 20 54%
Tax lots devoted to Standalone Retail 57 53 -7%
WORK PLACE* 2000 2015 % Change
Work Inside NYC 40,702 55,857 37%
Percentage of Employed Working Inside NYC
93% 92% --
Work Inside Home Borough 34,439 47,209 37%
Percentage of Employed Working Inside Home Borough
79% 78% --
COMMUTE* 2000 2015 % Change
Commute Time (min) 33.9 37.6 11%
Public Transit 27,648 43,723 58%
Private Car or Taxi 6,300 6,135 -3%
Walk or Bike 7,738 7,788 1%
Work at Home 1,776 3,076 73%
AGE 2000 2015 % Change
Total Population 125,179 132,694 6%
Youth (Age 0-18) 29,434 23,816 -19%
Working Age Population (age 19-65)
84,468 93,003 10%
Seniors (age 66+) 11,277 15,875 41%
RACE 2000 2015 % Change
White 26,272 40,797 55%
Black 35,708 21,126 -41%
Hispanic 51,168 52,616 3%
Asian 7,679 12,595 64%
BIRTH PLACE 2000 2015 % Change
Born inside the United States
75,693 78,850 4%
Born outside the United States
49,486 53,844 9%
MN09 | Hamilton Heights, Manhattanville & West Harlem
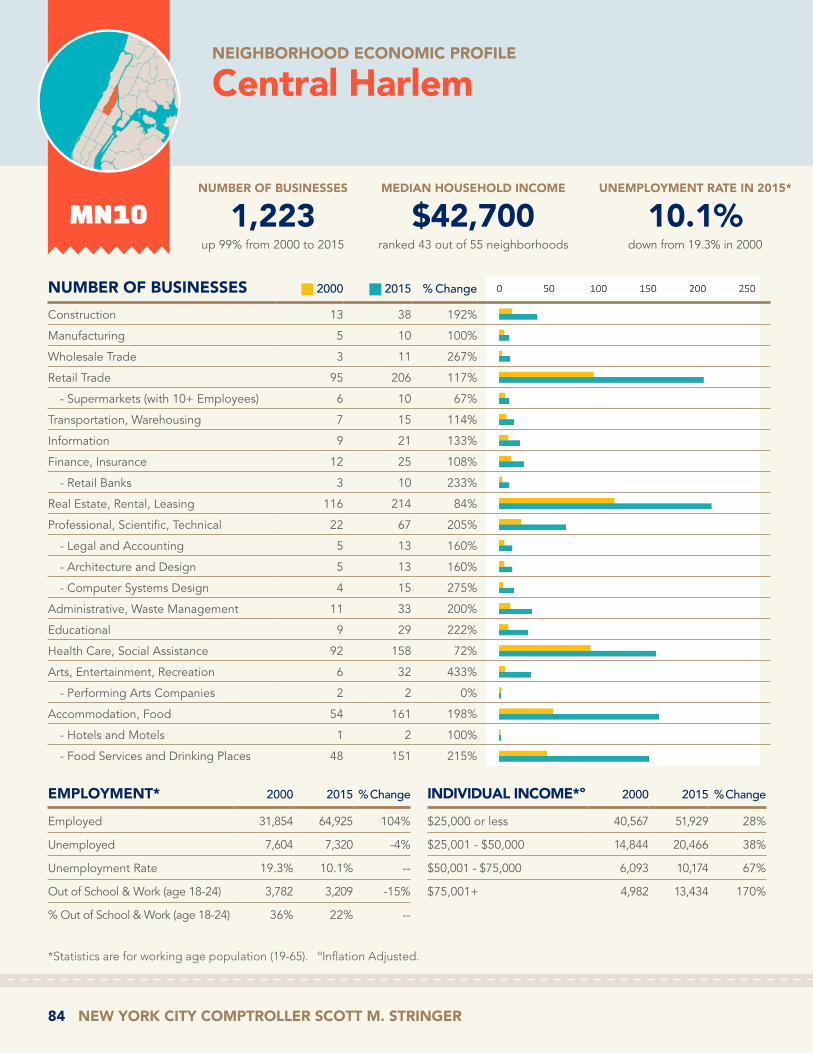
84 NEW YORK CITY COMPTROLLER SCOTT M. STRINGER
UNEMPLOYMENT RATE IN 2015*
10.1%down from 19.3% in 2000
NUMBER OF BUSINESSES
1,223up 99% from 2000 to 2015
MEDIAN HOUSEHOLD INCOME
$42,700ranked 43 out of 55 neighborhoods
MN10
NEIGHBORHOOD ECONOMIC PROFILE
Central Harlem
EMPLOYMENT* 2000 2015 % Change
Employed 31,854 64,925 104%
Unemployed 7,604 7,320 -4%
Unemployment Rate 19.3% 10.1% --
Out of School & Work (age 18-24) 3,782 3,209 -15%
% Out of School & Work (age 18-24) 36% 22% --
INDIVIDUAL INCOME*º 2000 2015 % Change
$25,000 or less 40,567 51,929 28%
$25,001 - $50,000 14,844 20,466 38%
$50,001 - $75,000 6,093 10,174 67%
$75,001+ 4,982 13,434 170%
NUMBER OF BUSINESSES 2000 2015 % Change
Construction 13 38 192%
Manufacturing 5 10 100%
Wholesale Trade 3 11 267%
Retail Trade 95 206 117%
- Supermarkets (with 10+ Employees) 6 10 67%
Transportation, Warehousing 7 15 114%
Information 9 21 133%
Finance, Insurance 12 25 108%
- Retail Banks 3 10 233%
Real Estate, Rental, Leasing 116 214 84%
Professional, Scientific, Technical 22 67 205%
- Legal and Accounting 5 13 160%
- Architecture and Design 5 13 160%
- Computer Systems Design 4 15 275%
Administrative, Waste Management 11 33 200%
Educational 9 29 222%
Health Care, Social Assistance 92 158 72%
Arts, Entertainment, Recreation 6 32 433%
- Performing Arts Companies 2 2 0%
Accommodation, Food 54 161 198%
- Hotels and Motels 1 2 100%
- Food Services and Drinking Places 48 151 215%
*Statistics are for working age population (19-65). ºInflation Adjusted.

NEIGHBORHOOD ECONOMIC PROFILES 85
EDUCATION 2000 2015 % Change
Bachelor's Degree or Higher (age 25+)
10,238 35,574 247%
Percentage of Population with Bachelor's or Higher (age 25+)
15% 38% --
Associates Degree (age 25+) 3,267 6,208 90%
LAND USE 2002 2016 % Change
Tax lots devoted to Mixed-Use Residential/Commercial
611 708 16%
Tax lots devoted to Office Buildings 26 34 31%
Tax lots devoted to Standalone Retail 139 102 -27%
WORK PLACE* 2000 2015 % Change
Work Inside NYC 29,555 60,461 105%
Percentage of Employed Working Inside NYC
96% 95% --
Work Inside Home Borough 23,778 51,258 116%
Percentage of Employed Working Inside Home Borough
77% 81% --
COMMUTE* 2000 2015 % Change
Commute Time (min) 36.6 36 -2%
Public Transit 21,250 48,662 129%
Private Car or Taxi 5,375 6,213 16%
Walk or Bike 3,381 5,727 69%
Work at Home 580 2,989 415%
AGE 2000 2015 % Change
Total Population 110,838 140,123 26%
Youth (Age 0-18) 31,757 33,298 5%
Working Age Population (age 19-65)
66,486 96,003 44%
Seniors (age 66+) 12,595 10,822 -14%
RACE 2000 2015 % Change
White 2,235 21,152 846%
Black 84,675 76,091 -10%
Hispanic 18,903 34,972 85%
Asian 1,244 4,165 235%
BIRTH PLACE 2000 2015 % Change
Born inside the United States
87,358 105,168 20%
Born outside the United States
23,480 34,955 49%
MN10 | Central Harlem

86 NEW YORK CITY COMPTROLLER SCOTT M. STRINGER
UNEMPLOYMENT RATE IN 2015*
12.2%down from 16.2% in 2000
NUMBER OF BUSINESSES
1,710up 58% from 2000 to 2015
MEDIAN HOUSEHOLD INCOME
$27,000ranked 50 out of 55 neighborhoods
MN11
NEIGHBORHOOD ECONOMIC PROFILE
East Harlem
EMPLOYMENT* 2000 2015 % Change
Employed 33,246 49,344 48%
Unemployed 6,410 6,879 7%
Unemployment Rate 16.2% 12.2% --
Out of School & Work (age 18-24) 4,439 2,021 -54%
% Out of School & Work (age 18-24) 34% 17% --
INDIVIDUAL INCOME*º 2000 2015 % Change
$25,000 or less 46,304 49,195 6%
$25,001 - $50,000 14,857 13,099 -12%
$50,001 - $75,000 5,546 11,151 101%
$75,001+ 4,249 7,807 84%
NUMBER OF BUSINESSES 2000 2015 % Change
Construction 48 67 40%
Manufacturing 25 18 -28%
Wholesale Trade 34 30 -12%
Retail Trade 281 414 47%
- Supermarkets (with 10+ Employees) 11 16 45%
Transportation, Warehousing 10 20 100%
Information 15 21 40%
Finance, Insurance 28 38 36%
- Retail Banks 6 12 100%
Real Estate, Rental, Leasing 98 196 100%
Professional, Scientific, Technical 29 71 145%
- Legal and Accounting 8 22 175%
- Architecture and Design 7 11 57%
- Computer Systems Design 2 9 350%
Administrative, Waste Management 31 30 -3%
Educational 23 45 96%
Health Care, Social Assistance 162 246 52%
Arts, Entertainment, Recreation 15 27 80%
- Performing Arts Companies 4 8 100%
Accommodation, Food 86 253 194%
- Hotels and Motels 1 2 100%
- Food Services and Drinking Places 76 233 207%
*Statistics are for working age population (19-65). ºInflation Adjusted.

NEIGHBORHOOD ECONOMIC PROFILES 87
EDUCATION 2000 2015 % Change
Bachelor's Degree or Higher (age 25+)
9,703 26,147 169%
Percentage of Population with Bachelor's or Higher (age 25+)
13% 31% --
Associates Degree (age 25+) 2,443 2,737 12%
LAND USE 2002 2016 % Change
Tax lots devoted to Mixed-Use Residential/Commercial
644 790 23%
Tax lots devoted to Office Buildings 34 43 26%
Tax lots devoted to Standalone Retail 202 189 -6%
WORK PLACE* 2000 2015 % Change
Work Inside NYC 30,879 47,454 54%
Percentage of Employed Working Inside NYC
97% 96% --
Work Inside Home Borough 24,848 39,797 60%
Percentage of Employed Working Inside Home Borough
78% 81% --
COMMUTE* 2000 2015 % Change
Commute Time (min) 35.8 35.1 -2%
Public Transit 21,664 36,118 67%
Private Car or Taxi 4,404 4,264 -3%
Walk or Bike 5,400 6,662 23%
Work at Home 525 1,954 272%
AGE 2000 2015 % Change
Total Population 117,733 122,204 4%
Youth (Age 0-18) 34,219 27,577 -19%
Working Age Population (age 19-65)
70,956 81,252 15%
Seniors (age 66+) 12,558 13,375 7%
RACE 2000 2015 % Change
White 8,444 16,449 95%
Black 39,758 37,258 -6%
Hispanic 63,431 59,040 -7%
Asian 2,599 8,203 216%
BIRTH PLACE 2000 2015 % Change
Born inside the United States
77,408 87,620 13%
Born outside the United States
40,325 34,584 -14%
MN11 | East Harlem

88 NEW YORK CITY COMPTROLLER SCOTT M. STRINGER
UNEMPLOYMENT RATE IN 2015*
8.4%down from 13.7% in 2000
NUMBER OF BUSINESSES
3,001up 21% from 2000 to 2015
MEDIAN HOUSEHOLD INCOME
$45,000ranked 37 out of 55 neighborhoods
MN12
NEIGHBORHOOD ECONOMIC PROFILE
Washington Heights, Inwood & Marble Hill
EMPLOYMENT* 2000 2015 % Change
Employed 78,073 116,619 49%
Unemployed 12,411 10,677 -14%
Unemployment Rate 13.7% 8.4% --
Out of School & Work (age 18-24) 5,267 3,969 -25%
% Out of School & Work (age 18-24) 21% 20% --
INDIVIDUAL INCOME*º 2000 2015 % Change
$25,000 or less 89,760 96,418 7%
$25,001 - $50,000 33,172 41,414 25%
$50,001 - $75,000 12,258 14,472 18%
$75,001+ 8,079 11,259 39%
NUMBER OF BUSINESSES 2000 2015 % Change
Construction 42 51 21%
Manufacturing 25 23 -8%
Wholesale Trade 43 51 19%
Retail Trade 685 677 -1%
- Supermarkets (with 10+ Employees) 18 24 33%
Transportation, Warehousing 40 47 18%
Information 33 43 30%
Finance, Insurance 71 107 51%
- Retail Banks 17 26 53%
Real Estate, Rental, Leasing 463 478 3%
Professional, Scientific, Technical 104 167 61%
- Legal and Accounting 29 59 103%
- Architecture and Design 11 18 64%
- Computer Systems Design 20 25 25%
Administrative, Waste Management 67 93 39%
Educational 30 50 67%
Health Care, Social Assistance 288 393 36%
Arts, Entertainment, Recreation 21 59 181%
- Performing Arts Companies 4 14 250%
Accommodation, Food 194 332 71%
- Hotels and Motels 0 1 N/A
- Food Services and Drinking Places 182 324 78%
*Statistics are for working age population (19-65). ºInflation Adjusted.

NEIGHBORHOOD ECONOMIC PROFILES 89
EDUCATION 2000 2015 % Change
Bachelor's Degree or Higher (age 25+)
26,988 54,262 101%
Percentage of Population with Bachelor's or Higher (age 25+)
19% 32% --
Associates Degree (age 25+) 5,654 10,410 84%
LAND USE 2002 2016 % Change
Tax lots devoted to Mixed-Use Residential/Commercial
496 562 13%
Tax lots devoted to Office Buildings 24 24 0%
Tax lots devoted to Standalone Retail 181 178 -2%
WORK PLACE* 2000 2015 % Change
Work Inside NYC 65,882 103,028 56%
Percentage of Employed Working Inside NYC
87% 90% --
Work Inside Home Borough 52,916 83,936 59%
Percentage of Employed Working Inside Home Borough
70% 73% --
COMMUTE* 2000 2015 % Change
Commute Time (min) 40.3 38.7 -4%
Public Transit 45,727 75,896 66%
Private Car or Taxi 17,798 13,973 -21%
Walk or Bike 8,342 13,710 64%
Work at Home 2,799 10,085 260%
AGE 2000 2015 % Change
Total Population 224,189 227,417 1%
Youth (Age 0-18) 59,752 38,224 -36%
Working Age Population (age 19-65)
143,269 163,563 14%
Seniors (age 66+) 21,168 25,630 21%
RACE 2000 2015 % Change
White 28,697 46,306 61%
Black 20,261 16,388 -19%
Hispanic 165,023 154,109 -7%
Asian 5,398 6,581 22%
BIRTH PLACE 2000 2015 % Change
Born inside the United States
96,957 112,891 16%
Born outside the United States
127,232 114,526 -10%
MN12 | Washington Heights, Inwood & Marble Hill

90 NEW YORK CITY COMPTROLLER SCOTT M. STRINGER
UNEMPLOYMENT RATE IN 2015*
6.9%down from 7.3% in 2000
NUMBER OF BUSINESSES
48,477up 33% from 2000 to 2015
MEDIAN HOUSEHOLD INCOME
$60,000
NEIGHBORHOOD ECONOMIC PROFILE
Queens
EMPLOYMENT* 2000 2015 % Change
Employed 909,507 1,099,049 21%
Unemployed 71,211 81,421 14%
Unemployment Rate 7.3% 6.9% --
Out of School & Work (age 18-24) 43,363 28,223 -35%
% Out of School & Work (age 18-24) 21% 14% --
INDIVIDUAL INCOME*º 2000 2015 % Change
$25,000 or less 666,537 792,843 19%
$25,001 - $50,000 373,342 366,059 -2%
$50,001 - $75,000 203,858 186,924 -8%
$75,001+ 172,653 193,507 12%
NUMBER OF BUSINESSES 2000 2015 % Change
Construction 3,727 5,594 50%
Manufacturing 1,871 1,267 -32%
Wholesale Trade 2,780 3,205 15%
Retail Trade 6,113 7,797 28%
- Supermarkets (with 10+ Employees) 181 246 36%
Transportation, Warehousing 1,862 2,377 28%
Information 429 533 24%
Finance, Insurance 1,136 1,477 30%
- Retail Banks 365 481 32%
Real Estate, Rental, Leasing 2,426 3,069 27%
Professional, Scientific, Technical 2,255 3,612 60%
- Legal and Accounting 876 1,559 78%
- Architecture and Design 272 497 83%
- Computer Systems Design 522 588 13%
Administrative, Waste Management 1,257 1,801 43%
Educational 447 770 72%
Health Care, Social Assistance 3,679 5,334 45%
Arts, Entertainment, Recreation 285 488 71%
- Performing Arts Companies 22 38 73%
Accommodation, Food 2,734 5,026 84%
- Hotels and Motels 46 107 133%
- Food Services and Drinking Places 2,519 4,655 85%
*Statistics are for working age population (19-65). ºInflation Adjusted.

NEIGHBORHOOD ECONOMIC PROFILES 91
EDUCATION 2000 2015 % Change
Bachelor's Degree or Higher (age 25+)
364,220 519,935 43%
Percentage of Population with Bachelor's or Higher (age 25+)
24% 31% --
Associates Degree (age 25+) 85,533 120,486 41%
LAND USE 2002 2016 % Change
Tax lots devoted to Mixed-Use Residential/Commercial
10,768 12,083 12%
Tax lots devoted to Office Buildings 1,363 1,409 3%
Tax lots devoted to Standalone Retail 5,756 6,327 10%
WORK PLACE* 2000 2015 % Change
Work Inside NYC 782,599 951,460 22%
Percentage of Employed Working Inside NYC
88% 89% --
Work Inside Home Borough 342,965 449,385 31%
Percentage of Employed Working Inside Home Borough
39% 42% --
COMMUTE* 2000 2015 % Change
Commute Time (min) 42.7 43.7 2%
Public Transit 414,936 554,044 34%
Private Car or Taxi 400,642 420,211 5%
Walk or Bike 50,397 64,970 29%
Work at Home 15,845 25,486 61%
AGE 2000 2015 % Change
Total Population 2,217,765 2,340,745 6%
Youth (Age 0-18) 531,654 501,550 -6%
Working Age Population (age 19-65)
1,416,390 1,539,333 9%
Seniors (age 66+) 269,721 299,862 11%
RACE 2000 2015 % Change
White 732,861 594,878 -19%
Black 420,787 404,330 -4%
Hispanic 544,667 656,031 20%
Asian 392,784 593,105 51%
BIRTH PLACE 2000 2015 % Change
Born inside the United States
1,145,980 1,165,635 2%
Born outside the United States
1,071,785 1,175,110 10%
Queens

92 NEW YORK CITY COMPTROLLER SCOTT M. STRINGER
UNEMPLOYMENT RATE IN 2015*
6.4%down from 7.9% in 2000
NUMBER OF BUSINESSES
4,089up 26% from 2000 to 2015
MEDIAN HOUSEHOLD INCOME
$60,000ranked 20 out of 55 neighborhoods
QN01
NEIGHBORHOOD ECONOMIC PROFILE
Astoria & Long Island City
EMPLOYMENT* 2000 2015 % Change
Employed 79,790 95,453 20%
Unemployed 6,830 6,499 -5%
Unemployment Rate 7.9% 6.4% --
Out of School & Work (age 18-24) 4,528 1,319 -71%
% Out of School & Work (age 18-24) 21% 9% --
INDIVIDUAL INCOME*º 2000 2015 % Change
$25,000 or less 64,462 56,886 -12%
$25,001 - $50,000 34,028 31,174 -8%
$50,001 - $75,000 17,997 20,543 14%
$75,001+ 12,726 18,877 48%
NUMBER OF BUSINESSES 2000 2015 % Change
Construction 567 641 13%
Manufacturing 177 101 -43%
Wholesale Trade 196 185 -6%
Retail Trade 585 619 6%
- Supermarkets (with 10+ Employees) 13 19 46%
Transportation, Warehousing 104 115 11%
Information 30 74 147%
Finance, Insurance 103 134 30%
- Retail Banks 27 43 59%
Real Estate, Rental, Leasing 259 320 24%
Professional, Scientific, Technical 171 307 80%
- Legal and Accounting 84 130 55%
- Architecture and Design 18 38 111%
- Computer Systems Design 29 46 59%
Administrative, Waste Management 104 131 26%
Educational 26 62 138%
Health Care, Social Assistance 238 328 38%
Arts, Entertainment, Recreation 15 57 280%
- Performing Arts Companies 1 7 600%
Accommodation, Food 282 545 93%
- Hotels and Motels 0 2 N/A
- Food Services and Drinking Places 270 523 94%
*Statistics are for working age population (19-65). ºInflation Adjusted.

NEIGHBORHOOD ECONOMIC PROFILES 93
EDUCATION 2000 2015 % Change
Bachelor's Degree or Higher (age 25+)
32,545 61,521 89%
Percentage of Population with Bachelor's or Higher (age 25+)
25% 46% --
Associates Degree (age 25+) 5,933 6,508 10%
LAND USE 2002 2016 % Change
Tax lots devoted to Mixed-Use Residential/Commercial
1,448 1,645 14%
Tax lots devoted to Office Buildings 153 176 15%
Tax lots devoted to Standalone Retail 605 591 -2%
WORK PLACE* 2000 2015 % Change
Work Inside NYC 73,802 87,579 19%
Percentage of Employed Working Inside NYC
95% 95% --
Work Inside Home Borough 25,313 28,526 13%
Percentage of Employed Working Inside Home Borough
33% 31% --
COMMUTE* 2000 2015 % Change
Commute Time (min) 36.1 39.1 8%
Public Transit 47,694 66,279 39%
Private Car or Taxi 21,681 14,634 -33%
Walk or Bike 6,756 7,698 14%
Work at Home 1,200 3,503 192%
AGE 2000 2015 % Change
Total Population 190,035 175,371 -8%
Youth (Age 0-18) 39,008 27,503 -29%
Working Age Population (age 19-65)
129,213 127,480 -1%
Seniors (age 66+) 21,814 20,388 -7%
RACE 2000 2015 % Change
White 85,769 86,313 1%
Black 12,810 9,354 -27%
Hispanic 51,963 46,899 -10%
Asian 24,574 29,000 18%
BIRTH PLACE 2000 2015 % Change
Born inside the United States
92,625 98,663 7%
Born outside the United States
97,410 76,708 -21%
QN01 | Astoria & Long Island City

94 NEW YORK CITY COMPTROLLER SCOTT M. STRINGER
UNEMPLOYMENT RATE IN 2015*
5.0%down from 6.5% in 2000
NUMBER OF BUSINESSES
5,421up 20% from 2000 to 2015
MEDIAN HOUSEHOLD INCOME
$60,000ranked 21 out of 55 neighborhoods
QN02
NEIGHBORHOOD ECONOMIC PROFILE
Sunnyside & Woodside
EMPLOYMENT* 2000 2015 % Change
Employed 60,789 74,410 22%
Unemployed 4,195 3,928 -6%
Unemployment Rate 6.5% 5.0% --
Out of School & Work (age 18-24) 2,925 1,701 -42%
% Out of School & Work (age 18-24) 23% 20% --
INDIVIDUAL INCOME*º 2000 2015 % Change
$25,000 or less 47,728 47,415 -1%
$25,001 - $50,000 25,237 26,255 4%
$50,001 - $75,000 12,191 10,535 -14%
$75,001+ 8,877 15,300 72%
NUMBER OF BUSINESSES 2000 2015 % Change
Construction 623 713 14%
Manufacturing 598 414 -31%
Wholesale Trade 582 538 -8%
Retail Trade 542 649 20%
- Supermarkets (with 10+ Employees) 17 18 6%
Transportation, Warehousing 189 255 35%
Information 64 78 22%
Finance, Insurance 102 170 67%
- Retail Banks 35 40 14%
Real Estate, Rental, Leasing 309 369 19%
Professional, Scientific, Technical 210 411 96%
- Legal and Accounting 38 91 139%
- Architecture and Design 48 110 129%
- Computer Systems Design 57 81 42%
Administrative, Waste Management 137 191 39%
Educational 25 53 112%
Health Care, Social Assistance 146 259 77%
Arts, Entertainment, Recreation 39 110 182%
- Performing Arts Companies 3 9 200%
Accommodation, Food 307 570 86%
- Hotels and Motels 2 24 1100%
- Food Services and Drinking Places 287 505 76%
*Statistics are for working age population (19-65). ºInflation Adjusted.

NEIGHBORHOOD ECONOMIC PROFILES 95
EDUCATION 2000 2015 % Change
Bachelor's Degree or Higher (age 25+)
24,197 40,814 69%
Percentage of Population with Bachelor's or Higher (age 25+)
25% 37% --
Associates Degree (age 25+) 5,445 7,230 33%
LAND USE 2002 2016 % Change
Tax lots devoted to Mixed-Use Residential/Commercial
552 651 18%
Tax lots devoted to Office Buildings 145 143 -1%
Tax lots devoted to Standalone Retail 290 301 4%
WORK PLACE* 2000 2015 % Change
Work Inside NYC 55,293 67,134 21%
Percentage of Employed Working Inside NYC
94% 92% --
Work Inside Home Borough 19,668 19,312 -2%
Percentage of Employed Working Inside Home Borough
33% 26% --
COMMUTE* 2000 2015 % Change
Commute Time (min) 37.2 39.4 6%
Public Transit 38,477 50,084 30%
Private Car or Taxi 14,328 17,095 19%
Walk or Bike 4,530 3,789 -16%
Work at Home 1,115 1,954 75%
AGE 2000 2015 % Change
Total Population 135,259 144,833 7%
Youth (Age 0-18) 27,735 27,414 -1%
Working Age Population (age 19-65)
94,033 99,505 6%
Seniors (age 66+) 13,491 17,914 33%
RACE 2000 2015 % Change
White 39,047 38,257 -2%
Black 3,051 2,976 -2%
Hispanic 46,045 45,302 -2%
Asian 41,085 54,995 34%
BIRTH PLACE 2000 2015 % Change
Born inside the United States
50,296 61,682 23%
Born outside the United States
84,963 83,151 -2%
QN02 | Sunnyside & Woodside

96 NEW YORK CITY COMPTROLLER SCOTT M. STRINGER
UNEMPLOYMENT RATE IN 2015*
5.0%down from 9.6% in 2000
NUMBER OF BUSINESSES
2,564up 33% from 2000 to 2015
MEDIAN HOUSEHOLD INCOME
$50,800ranked 27 out of 55 neighborhoods
QN03
NEIGHBORHOOD ECONOMIC PROFILE
Jackson Heights & North Corona
EMPLOYMENT* 2000 2015 % Change
Employed 66,852 91,451 37%
Unemployed 7,114 4,833 -32%
Unemployment Rate 9.6% 5.0% --
Out of School & Work (age 18-24) 4,754 2,734 -42%
% Out of School & Work (age 18-24) 24% 15% --
INDIVIDUAL INCOME*º 2000 2015 % Change
$25,000 or less 63,454 76,649 21%
$25,001 - $50,000 29,681 26,648 -10%
$50,001 - $75,000 11,021 12,428 13%
$75,001+ 8,436 8,105 -4%
NUMBER OF BUSINESSES 2000 2015 % Change
Construction 121 230 90%
Manufacturing 38 35 -8%
Wholesale Trade 72 79 10%
Retail Trade 455 548 20%
- Supermarkets (with 10+ Employees) 11 15 36%
Transportation, Warehousing 72 123 71%
Information 25 24 -4%
Finance, Insurance 59 83 41%
- Retail Banks 17 25 47%
Real Estate, Rental, Leasing 167 191 14%
Professional, Scientific, Technical 107 166 55%
- Legal and Accounting 44 91 107%
- Architecture and Design 8 21 163%
- Computer Systems Design 27 16 -41%
Administrative, Waste Management 70 89 27%
Educational 22 44 100%
Health Care, Social Assistance 190 250 32%
Arts, Entertainment, Recreation 10 18 80%
- Performing Arts Companies 2 2 0%
Accommodation, Food 210 366 74%
- Hotels and Motels 8 11 38%
- Food Services and Drinking Places 190 334 76%
*Statistics are for working age population (19-65). ºInflation Adjusted.

NEIGHBORHOOD ECONOMIC PROFILES 97
EDUCATION 2000 2015 % Change
Bachelor's Degree or Higher (age 25+)
19,717 24,057 22%
Percentage of Population with Bachelor's or Higher (age 25+)
18% 19% --
Associates Degree (age 25+) 5,699 6,893 21%
LAND USE 2002 2016 % Change
Tax lots devoted to Mixed-Use Residential/Commercial
649 759 17%
Tax lots devoted to Office Buildings 65 64 -2%
Tax lots devoted to Standalone Retail 437 478 9%
WORK PLACE* 2000 2015 % Change
Work Inside NYC 59,779 85,633 43%
Percentage of Employed Working Inside NYC
92% 96% --
Work Inside Home Borough 26,090 38,488 48%
Percentage of Employed Working Inside Home Borough
40% 43% --
COMMUTE* 2000 2015 % Change
Commute Time (min) 41.1 40.4 -2%
Public Transit 36,773 54,840 49%
Private Car or Taxi 21,462 24,634 15%
Walk or Bike 5,016 7,842 56%
Work at Home 1,454 1,355 -7%
AGE 2000 2015 % Change
Total Population 175,586 186,337 6%
Youth (Age 0-18) 45,617 44,175 -3%
Working Age Population (age 19-65)
112,592 123,830 10%
Seniors (age 66+) 17,377 18,332 5%
RACE 2000 2015 % Change
White 25,566 20,561 -20%
Black 16,080 8,885 -45%
Hispanic 104,117 126,967 22%
Asian 24,484 28,237 15%
BIRTH PLACE 2000 2015 % Change
Born inside the United States
60,597 70,778 17%
Born outside the United States
114,989 115,559 0%
QN03 | Jackson Heights & North Corona

98 NEW YORK CITY COMPTROLLER SCOTT M. STRINGER
UNEMPLOYMENT RATE IN 2015*
4.1%down from 9.7% in 2000
NUMBER OF BUSINESSES
3,119up 39% from 2000 to 2015
MEDIAN HOUSEHOLD INCOME
$47,000ranked 33 out of 55 neighborhoods
QN04
NEIGHBORHOOD ECONOMIC PROFILE
Elmhurst & South Corona
EMPLOYMENT* 2000 2015 % Change
Employed 56,943 61,668 8%
Unemployed 6,110 2,652 -57%
Unemployment Rate 9.7% 4.1% --
Out of School & Work (age 18-24) 4,076 1,245 -69%
% Out of School & Work (age 18-24) 24% 10% --
INDIVIDUAL INCOME*º 2000 2015 % Change
$25,000 or less 55,088 55,148 0%
$25,001 - $50,000 25,376 20,273 -20%
$50,001 - $75,000 9,127 6,369 -30%
$75,001+ 6,093 4,007 -34%
NUMBER OF BUSINESSES 2000 2015 % Change
Construction 158 267 69%
Manufacturing 100 82 -18%
Wholesale Trade 148 150 1%
Retail Trade 506 735 45%
- Supermarkets (with 10+ Employees) 10 18 80%
Transportation, Warehousing 54 96 78%
Information 32 36 13%
Finance, Insurance 55 82 49%
- Retail Banks 21 24 14%
Real Estate, Rental, Leasing 140 192 37%
Professional, Scientific, Technical 87 147 69%
- Legal and Accounting 43 75 74%
- Architecture and Design 6 17 183%
- Computer Systems Design 20 20 0%
Administrative, Waste Management 77 90 17%
Educational 24 28 17%
Health Care, Social Assistance 241 331 37%
Arts, Entertainment, Recreation 14 18 29%
- Performing Arts Companies 1 1 0%
Accommodation, Food 197 406 106%
- Hotels and Motels 4 7 75%
- Food Services and Drinking Places 184 379 106%
*Statistics are for working age population (19-65). ºInflation Adjusted.
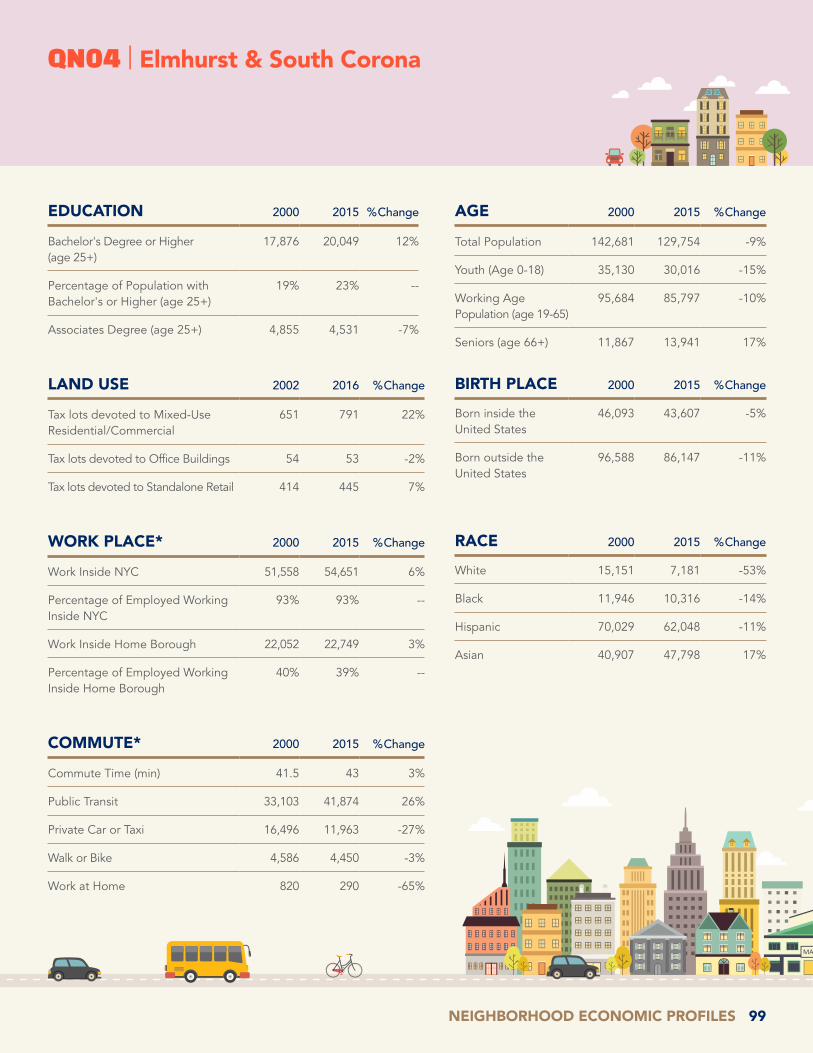
NEIGHBORHOOD ECONOMIC PROFILES 99
EDUCATION 2000 2015 % Change
Bachelor's Degree or Higher (age 25+)
17,876 20,049 12%
Percentage of Population with Bachelor's or Higher (age 25+)
19% 23% --
Associates Degree (age 25+) 4,855 4,531 -7%
LAND USE 2002 2016 % Change
Tax lots devoted to Mixed-Use Residential/Commercial
651 791 22%
Tax lots devoted to Office Buildings 54 53 -2%
Tax lots devoted to Standalone Retail 414 445 7%
WORK PLACE* 2000 2015 % Change
Work Inside NYC 51,558 54,651 6%
Percentage of Employed Working Inside NYC
93% 93% --
Work Inside Home Borough 22,052 22,749 3%
Percentage of Employed Working Inside Home Borough
40% 39% --
COMMUTE* 2000 2015 % Change
Commute Time (min) 41.5 43 3%
Public Transit 33,103 41,874 26%
Private Car or Taxi 16,496 11,963 -27%
Walk or Bike 4,586 4,450 -3%
Work at Home 820 290 -65%
AGE 2000 2015 % Change
Total Population 142,681 129,754 -9%
Youth (Age 0-18) 35,130 30,016 -15%
Working Age Population (age 19-65)
95,684 85,797 -10%
Seniors (age 66+) 11,867 13,941 17%
RACE 2000 2015 % Change
White 15,151 7,181 -53%
Black 11,946 10,316 -14%
Hispanic 70,029 62,048 -11%
Asian 40,907 47,798 17%
BIRTH PLACE 2000 2015 % Change
Born inside the United States
46,093 43,607 -5%
Born outside the United States
96,588 86,147 -11%
QN04 | Elmhurst & South Corona

100 NEW YORK CITY COMPTROLLER SCOTT M. STRINGER
UNEMPLOYMENT RATE IN 2015*
5.1%down from 7.3% in 2000
NUMBER OF BUSINESSES
3,904up 38% from 2000 to 2015
MEDIAN HOUSEHOLD INCOME
$62,000ranked 19 out of 55 neighborhoods
QN05
NEIGHBORHOOD ECONOMIC PROFILE
Ridgewood, Glendale & Middle Village
EMPLOYMENT* 2000 2015 % Change
Employed 67,524 89,091 32%
Unemployed 5,308 4,762 -10%
Unemployment Rate 7.3% 5.1% --
Out of School & Work (age 18-24) 3,053 2,772 -9%
% Out of School & Work (age 18-24) 20% 17% --
INDIVIDUAL INCOME*º 2000 2015 % Change
$25,000 or less 48,245 56,657 17%
$25,001 - $50,000 30,057 32,370 8%
$50,001 - $75,000 15,996 17,552 10%
$75,001+ 11,997 15,409 28%
NUMBER OF BUSINESSES 2000 2015 % Change
Construction 426 859 102%
Manufacturing 305 199 -35%
Wholesale Trade 321 412 28%
Retail Trade 508 639 26%
- Supermarkets (with 10+ Employees) 11 19 73%
Transportation, Warehousing 95 127 34%
Information 13 23 77%
Finance, Insurance 69 87 26%
- Retail Banks 28 45 61%
Real Estate, Rental, Leasing 107 159 49%
Professional, Scientific, Technical 115 184 60%
- Legal and Accounting 45 67 49%
- Architecture and Design 17 32 88%
- Computer Systems Design 18 35 94%
Administrative, Waste Management 102 134 31%
Educational 24 35 46%
Health Care, Social Assistance 199 274 38%
Arts, Entertainment, Recreation 19 30 58%
- Performing Arts Companies 0 1 N/A
Accommodation, Food 173 324 87%
- Hotels and Motels 1 3 200%
- Food Services and Drinking Places 162 314 94%
*Statistics are for working age population (19-65). ºInflation Adjusted.

NEIGHBORHOOD ECONOMIC PROFILES 101
EDUCATION 2000 2015 % Change
Bachelor's Degree or Higher (age 25+)
18,250 32,485 78%
Percentage of Population with Bachelor's or Higher (age 25+)
16% 26% --
Associates Degree (age 25+) 6,140 9,053 47%
LAND USE 2002 2016 % Change
Tax lots devoted to Mixed-Use Residential/Commercial
1,691 1,776 5%
Tax lots devoted to Office Buildings 96 92 -4%
Tax lots devoted to Standalone Retail 372 412 11%
WORK PLACE* 2000 2015 % Change
Work Inside NYC 60,876 82,940 36%
Percentage of Employed Working Inside NYC
92% 95% --
Work Inside Home Borough 24,786 35,583 44%
Percentage of Employed Working Inside Home Borough
38% 41% --
COMMUTE* 2000 2015 % Change
Commute Time (min) 39 40.8 5%
Public Transit 29,039 47,435 63%
Private Car or Taxi 31,013 31,374 1%
Walk or Bike 4,787 6,222 30%
Work at Home 951 2,641 178%
AGE 2000 2015 % Change
Total Population 167,870 186,377 11%
Youth (Age 0-18) 39,695 45,900 16%
Working Age Population (age 19-65)
106,295 121,988 15%
Seniors (age 66+) 21,880 18,489 -15%
RACE 2000 2015 % Change
White 104,735 98,622 -6%
Black 1,843 2,428 32%
Hispanic 46,291 69,122 49%
Asian 10,383 13,958 34%
BIRTH PLACE 2000 2015 % Change
Born inside the United States
101,988 107,384 5%
Born outside the United States
65,882 78,993 20%
QN05 | Ridgewood, Glendale & Middle Village

102 NEW YORK CITY COMPTROLLER SCOTT M. STRINGER
UNEMPLOYMENT RATE IN 2015*
6.8%up from 5.5% in 2000
NUMBER OF BUSINESSES
3,285up 14% from 2000 to 2015
MEDIAN HOUSEHOLD INCOME
$73,000ranked 12 out of 55 neighborhoods
QN06
NEIGHBORHOOD ECONOMIC PROFILE
Forest Hills & Rego Park
EMPLOYMENT* 2000 2015 % Change
Employed 50,217 58,277 16%
Unemployed 2,924 4,226 45%
Unemployment Rate 5.5% 6.8% --
Out of School & Work (age 18-24) 1,125 1,453 29%
% Out of School & Work (age 18-24) 15% 24% --
INDIVIDUAL INCOME*º 2000 2015 % Change
$25,000 or less 27,246 31,373 15%
$25,001 - $50,000 16,240 15,878 -2%
$50,001 - $75,000 12,837 9,856 -23%
$75,001+ 16,527 21,007 27%
NUMBER OF BUSINESSES 2000 2015 % Change
Construction 97 128 32%
Manufacturing 57 25 -56%
Wholesale Trade 149 162 9%
Retail Trade 398 428 8%
- Supermarkets (with 10+ Employees) 12 17 42%
Transportation, Warehousing 98 65 -34%
Information 51 36 -29%
Finance, Insurance 101 109 8%
- Retail Banks 34 43 26%
Real Estate, Rental, Leasing 297 306 3%
Professional, Scientific, Technical 333 452 36%
- Legal and Accounting 141 219 55%
- Architecture and Design 24 32 33%
- Computer Systems Design 105 90 -14%
Administrative, Waste Management 118 103 -13%
Educational 39 65 67%
Health Care, Social Assistance 515 670 30%
Arts, Entertainment, Recreation 25 35 40%
- Performing Arts Companies 2 5 150%
Accommodation, Food 173 273 58%
- Hotels and Motels 2 1 -50%
- Food Services and Drinking Places 163 262 61%
*Statistics are for working age population (19-65). ºInflation Adjusted.

NEIGHBORHOOD ECONOMIC PROFILES 103
EDUCATION 2000 2015 % Change
Bachelor's Degree or Higher (age 25+)
39,482 52,015 32%
Percentage of Population with Bachelor's or Higher (age 25+)
46% 55% --
Associates Degree (age 25+) 5,233 6,609 26%
LAND USE 2002 2016 % Change
Tax lots devoted to Mixed-Use Residential/Commercial
267 332 24%
Tax lots devoted to Office Buildings 46 50 9%
Tax lots devoted to Standalone Retail 243 242 0%
WORK PLACE* 2000 2015 % Change
Work Inside NYC 44,075 52,421 19%
Percentage of Employed Working Inside NYC
90% 92% --
Work Inside Home Borough 14,290 18,662 31%
Percentage of Employed Working Inside Home Borough
29% 33% --
COMMUTE* 2000 2015 % Change
Commute Time (min) 43.4 40.8 -6%
Public Transit 28,629 34,392 20%
Private Car or Taxi 16,366 15,823 -3%
Walk or Bike 2,311 3,753 62%
Work at Home 1,503 2,272 51%
AGE 2000 2015 % Change
Total Population 112,457 127,840 14%
Youth (Age 0-18) 19,151 28,415 48%
Working Age Population (age 19-65)
72,850 78,114 7%
Seniors (age 66+) 20,456 21,311 4%
RACE 2000 2015 % Change
White 70,290 64,666 -8%
Black 2,459 4,291 75%
Hispanic 12,579 17,110 36%
Asian 23,644 36,875 56%
BIRTH PLACE 2000 2015 % Change
Born inside the United States
51,396 60,331 17%
Born outside the United States
61,061 67,509 11%
QN06 | Forest Hills & Rego Park
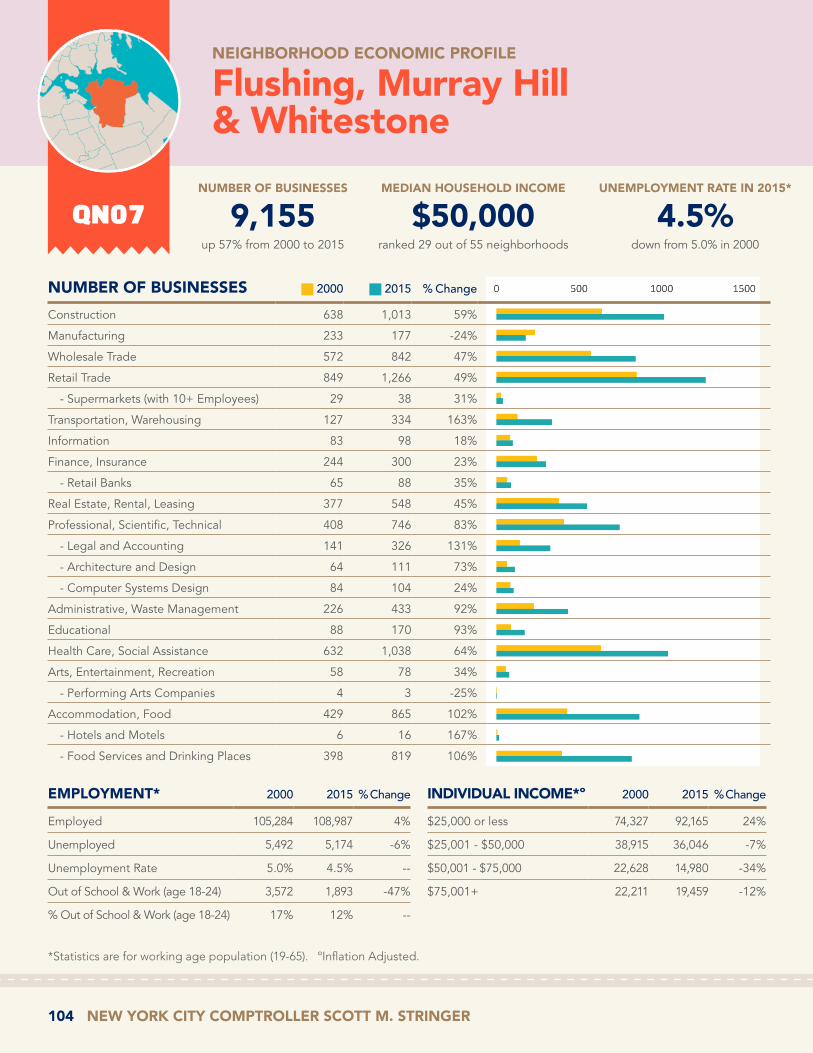
104 NEW YORK CITY COMPTROLLER SCOTT M. STRINGER
UNEMPLOYMENT RATE IN 2015*
4.5%down from 5.0% in 2000
NUMBER OF BUSINESSES
9,155up 57% from 2000 to 2015
MEDIAN HOUSEHOLD INCOME
$50,000ranked 29 out of 55 neighborhoods
QN07
NEIGHBORHOOD ECONOMIC PROFILE
Flushing, Murray Hill & Whitestone
EMPLOYMENT* 2000 2015 % Change
Employed 105,284 108,987 4%
Unemployed 5,492 5,174 -6%
Unemployment Rate 5.0% 4.5% --
Out of School & Work (age 18-24) 3,572 1,893 -47%
% Out of School & Work (age 18-24) 17% 12% --
INDIVIDUAL INCOME*º 2000 2015 % Change
$25,000 or less 74,327 92,165 24%
$25,001 - $50,000 38,915 36,046 -7%
$50,001 - $75,000 22,628 14,980 -34%
$75,001+ 22,211 19,459 -12%
NUMBER OF BUSINESSES 2000 2015 % Change
Construction 638 1,013 59%
Manufacturing 233 177 -24%
Wholesale Trade 572 842 47%
Retail Trade 849 1,266 49%
- Supermarkets (with 10+ Employees) 29 38 31%
Transportation, Warehousing 127 334 163%
Information 83 98 18%
Finance, Insurance 244 300 23%
- Retail Banks 65 88 35%
Real Estate, Rental, Leasing 377 548 45%
Professional, Scientific, Technical 408 746 83%
- Legal and Accounting 141 326 131%
- Architecture and Design 64 111 73%
- Computer Systems Design 84 104 24%
Administrative, Waste Management 226 433 92%
Educational 88 170 93%
Health Care, Social Assistance 632 1,038 64%
Arts, Entertainment, Recreation 58 78 34%
- Performing Arts Companies 4 3 -25%
Accommodation, Food 429 865 102%
- Hotels and Motels 6 16 167%
- Food Services and Drinking Places 398 819 106%
*Statistics are for working age population (19-65). ºInflation Adjusted.

NEIGHBORHOOD ECONOMIC PROFILES 105
EDUCATION 2000 2015 % Change
Bachelor's Degree or Higher (age 25+)
49,147 51,472 5%
Percentage of Population with Bachelor's or Higher (age 25+)
28% 27% --
Associates Degree (age 25+) 9,816 16,704 70%
LAND USE 2002 2016 % Change
Tax lots devoted to Mixed-Use Residential/Commercial
838 1,229 47%
Tax lots devoted to Office Buildings 192 206 7%
Tax lots devoted to Standalone Retail 806 896 11%
WORK PLACE* 2000 2015 % Change
Work Inside NYC 88,139 92,254 5%
Percentage of Employed Working Inside NYC
86% 87% --
Work Inside Home Borough 45,870 54,861 20%
Percentage of Employed Working Inside Home Borough
45% 52% --
COMMUTE* 2000 2015 % Change
Commute Time (min) 41.5 39.6 -5%
Public Transit 36,635 38,852 6%
Private Car or Taxi 56,451 54,615 -3%
Walk or Bike 7,388 10,805 46%
Work at Home 1,842 1,687 -8%
AGE 2000 2015 % Change
Total Population 245,230 247,749 1%
Youth (Age 0-18) 49,852 42,241 -15%
Working Age Population (age 19-65)
158,081 162,650 3%
Seniors (age 66+) 37,297 42,858 15%
RACE 2000 2015 % Change
White 100,637 59,247 -41%
Black 7,397 4,780 -35%
Hispanic 40,480 40,041 -1%
Asian 88,746 137,525 55%
BIRTH PLACE 2000 2015 % Change
Born inside the United States
116,400 96,373 -17%
Born outside the United States
128,830 151,376 18%
QN07 | Flushing, Murray Hill & Whitestone
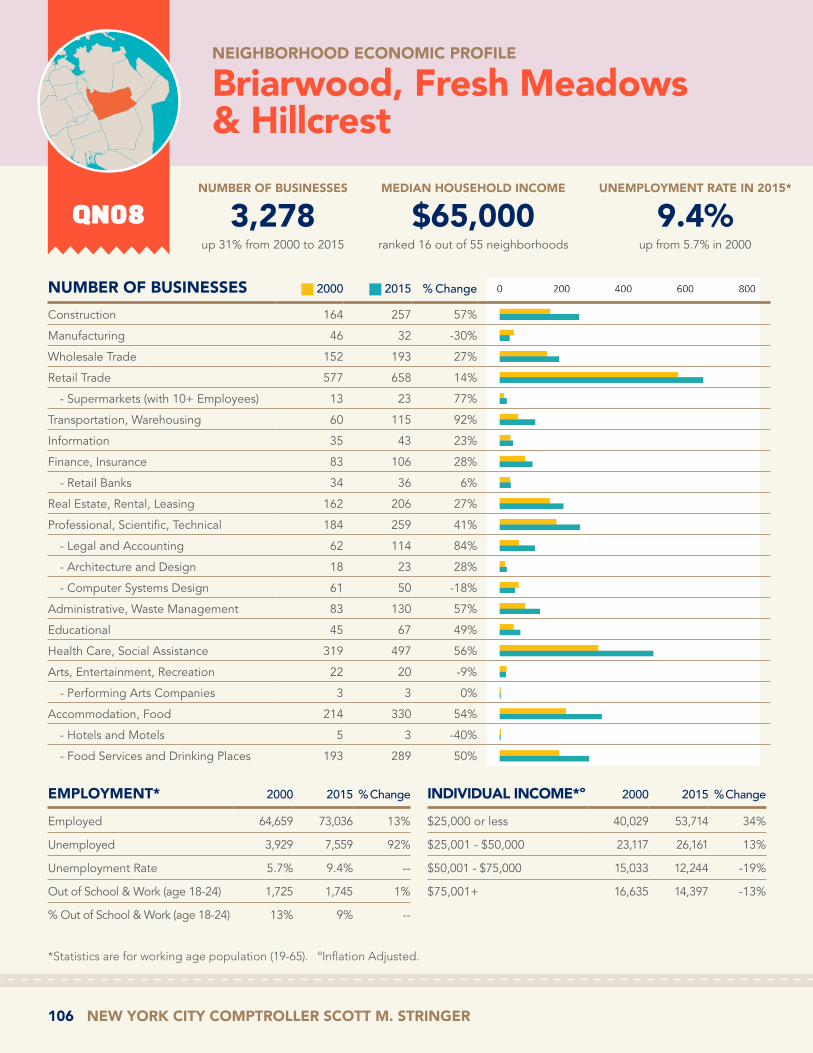
106 NEW YORK CITY COMPTROLLER SCOTT M. STRINGER
UNEMPLOYMENT RATE IN 2015*
9.4%up from 5.7% in 2000
NUMBER OF BUSINESSES
3,278up 31% from 2000 to 2015
MEDIAN HOUSEHOLD INCOME
$65,000ranked 16 out of 55 neighborhoods
QN08
NEIGHBORHOOD ECONOMIC PROFILE
Briarwood, Fresh Meadows & Hillcrest
EMPLOYMENT* 2000 2015 % Change
Employed 64,659 73,036 13%
Unemployed 3,929 7,559 92%
Unemployment Rate 5.7% 9.4% --
Out of School & Work (age 18-24) 1,725 1,745 1%
% Out of School & Work (age 18-24) 13% 9% --
INDIVIDUAL INCOME*º 2000 2015 % Change
$25,000 or less 40,029 53,714 34%
$25,001 - $50,000 23,117 26,161 13%
$50,001 - $75,000 15,033 12,244 -19%
$75,001+ 16,635 14,397 -13%
NUMBER OF BUSINESSES 2000 2015 % Change
Construction 164 257 57%
Manufacturing 46 32 -30%
Wholesale Trade 152 193 27%
Retail Trade 577 658 14%
- Supermarkets (with 10+ Employees) 13 23 77%
Transportation, Warehousing 60 115 92%
Information 35 43 23%
Finance, Insurance 83 106 28%
- Retail Banks 34 36 6%
Real Estate, Rental, Leasing 162 206 27%
Professional, Scientific, Technical 184 259 41%
- Legal and Accounting 62 114 84%
- Architecture and Design 18 23 28%
- Computer Systems Design 61 50 -18%
Administrative, Waste Management 83 130 57%
Educational 45 67 49%
Health Care, Social Assistance 319 497 56%
Arts, Entertainment, Recreation 22 20 -9%
- Performing Arts Companies 3 3 0%
Accommodation, Food 214 330 54%
- Hotels and Motels 5 3 -40%
- Food Services and Drinking Places 193 289 50%
*Statistics are for working age population (19-65). ºInflation Adjusted.
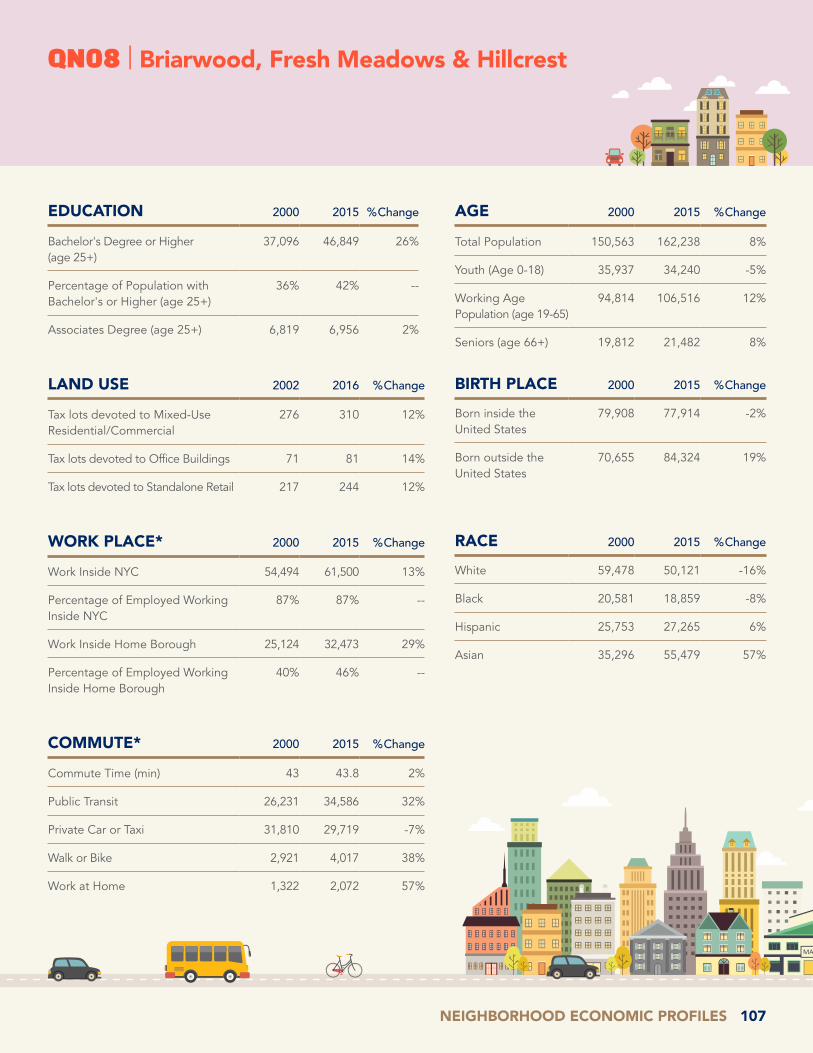
NEIGHBORHOOD ECONOMIC PROFILES 107
EDUCATION 2000 2015 % Change
Bachelor's Degree or Higher (age 25+)
37,096 46,849 26%
Percentage of Population with Bachelor's or Higher (age 25+)
36% 42% --
Associates Degree (age 25+) 6,819 6,956 2%
LAND USE 2002 2016 % Change
Tax lots devoted to Mixed-Use Residential/Commercial
276 310 12%
Tax lots devoted to Office Buildings 71 81 14%
Tax lots devoted to Standalone Retail 217 244 12%
WORK PLACE* 2000 2015 % Change
Work Inside NYC 54,494 61,500 13%
Percentage of Employed Working Inside NYC
87% 87% --
Work Inside Home Borough 25,124 32,473 29%
Percentage of Employed Working Inside Home Borough
40% 46% --
COMMUTE* 2000 2015 % Change
Commute Time (min) 43 43.8 2%
Public Transit 26,231 34,586 32%
Private Car or Taxi 31,810 29,719 -7%
Walk or Bike 2,921 4,017 38%
Work at Home 1,322 2,072 57%
AGE 2000 2015 % Change
Total Population 150,563 162,238 8%
Youth (Age 0-18) 35,937 34,240 -5%
Working Age Population (age 19-65)
94,814 106,516 12%
Seniors (age 66+) 19,812 21,482 8%
RACE 2000 2015 % Change
White 59,478 50,121 -16%
Black 20,581 18,859 -8%
Hispanic 25,753 27,265 6%
Asian 35,296 55,479 57%
BIRTH PLACE 2000 2015 % Change
Born inside the United States
79,908 77,914 -2%
Born outside the United States
70,655 84,324 19%
QN08 | Briarwood, Fresh Meadows & Hillcrest
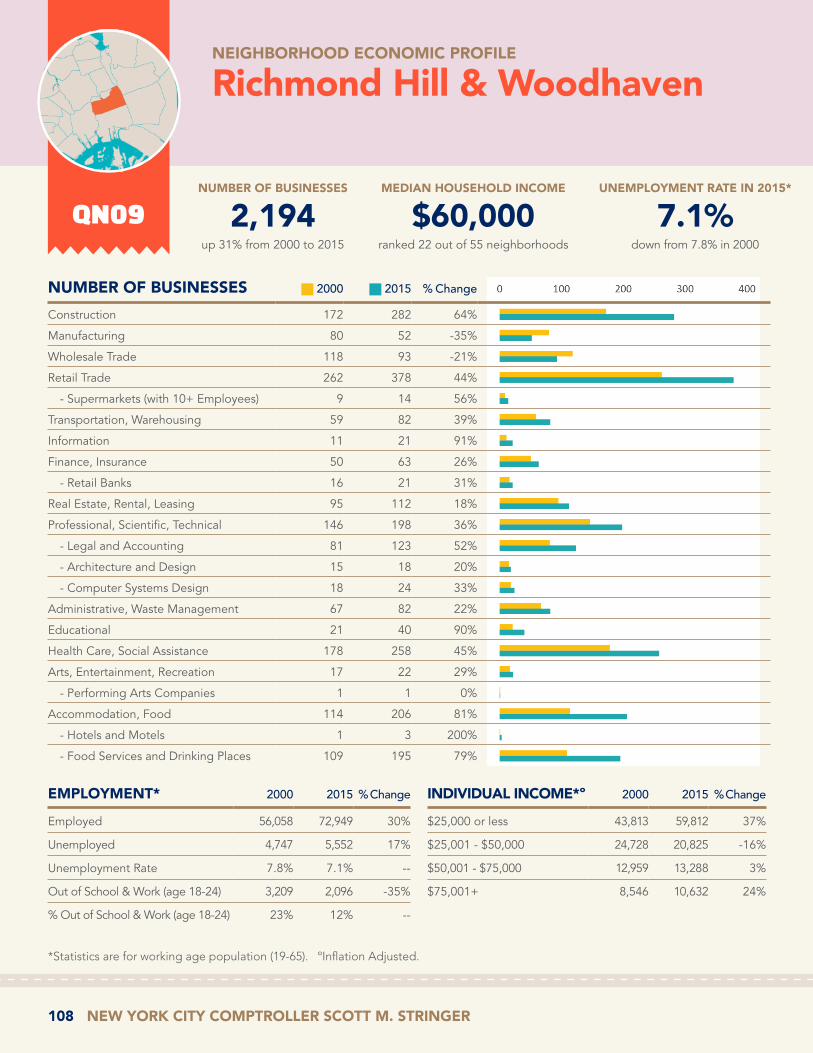
108 NEW YORK CITY COMPTROLLER SCOTT M. STRINGER
UNEMPLOYMENT RATE IN 2015*
7.1%down from 7.8% in 2000
NUMBER OF BUSINESSES
2,194up 31% from 2000 to 2015
MEDIAN HOUSEHOLD INCOME
$60,000ranked 22 out of 55 neighborhoods
QN09
NEIGHBORHOOD ECONOMIC PROFILE
Richmond Hill & Woodhaven
EMPLOYMENT* 2000 2015 % Change
Employed 56,058 72,949 30%
Unemployed 4,747 5,552 17%
Unemployment Rate 7.8% 7.1% --
Out of School & Work (age 18-24) 3,209 2,096 -35%
% Out of School & Work (age 18-24) 23% 12% --
INDIVIDUAL INCOME*º 2000 2015 % Change
$25,000 or less 43,813 59,812 37%
$25,001 - $50,000 24,728 20,825 -16%
$50,001 - $75,000 12,959 13,288 3%
$75,001+ 8,546 10,632 24%
NUMBER OF BUSINESSES 2000 2015 % Change
Construction 172 282 64%
Manufacturing 80 52 -35%
Wholesale Trade 118 93 -21%
Retail Trade 262 378 44%
- Supermarkets (with 10+ Employees) 9 14 56%
Transportation, Warehousing 59 82 39%
Information 11 21 91%
Finance, Insurance 50 63 26%
- Retail Banks 16 21 31%
Real Estate, Rental, Leasing 95 112 18%
Professional, Scientific, Technical 146 198 36%
- Legal and Accounting 81 123 52%
- Architecture and Design 15 18 20%
- Computer Systems Design 18 24 33%
Administrative, Waste Management 67 82 22%
Educational 21 40 90%
Health Care, Social Assistance 178 258 45%
Arts, Entertainment, Recreation 17 22 29%
- Performing Arts Companies 1 1 0%
Accommodation, Food 114 206 81%
- Hotels and Motels 1 3 200%
- Food Services and Drinking Places 109 195 79%
*Statistics are for working age population (19-65). ºInflation Adjusted.

NEIGHBORHOOD ECONOMIC PROFILES 109
EDUCATION 2000 2015 % Change
Bachelor's Degree or Higher (age 25+)
17,913 30,526 70%
Percentage of Population with Bachelor's or Higher (age 25+)
20% 29% --
Associates Degree (age 25+) 5,273 8,075 53%
LAND USE 2002 2016 % Change
Tax lots devoted to Mixed-Use Residential/Commercial
1,169 1,284 10%
Tax lots devoted to Office Buildings 85 91 7%
Tax lots devoted to Standalone Retail 339 401 18%
WORK PLACE* 2000 2015 % Change
Work Inside NYC 49,541 63,329 28%
Percentage of Employed Working Inside NYC
91% 90% --
Work Inside Home Borough 21,798 30,131 38%
Percentage of Employed Working Inside Home Borough
40% 43% --
COMMUTE* 2000 2015 % Change
Commute Time (min) 44.6 45.8 3%
Public Transit 27,602 38,304 39%
Private Car or Taxi 23,742 25,394 7%
Walk or Bike 2,501 4,542 82%
Work at Home 757 1,471 94%
AGE 2000 2015 % Change
Total Population 140,173 158,582 13%
Youth (Age 0-18) 37,571 38,215 2%
Working Age Population (age 19-65)
90,046 104,557 16%
Seniors (age 66+) 12,556 15,810 26%
RACE 2000 2015 % Change
White 40,366 25,867 -36%
Black 11,305 11,628 3%
Hispanic 47,437 68,960 45%
Asian 23,350 39,388 69%
BIRTH PLACE 2000 2015 % Change
Born inside the United States
66,571 75,932 14%
Born outside the United States
73,602 82,650 12%
QN09 | Richmond Hill & Woodhaven
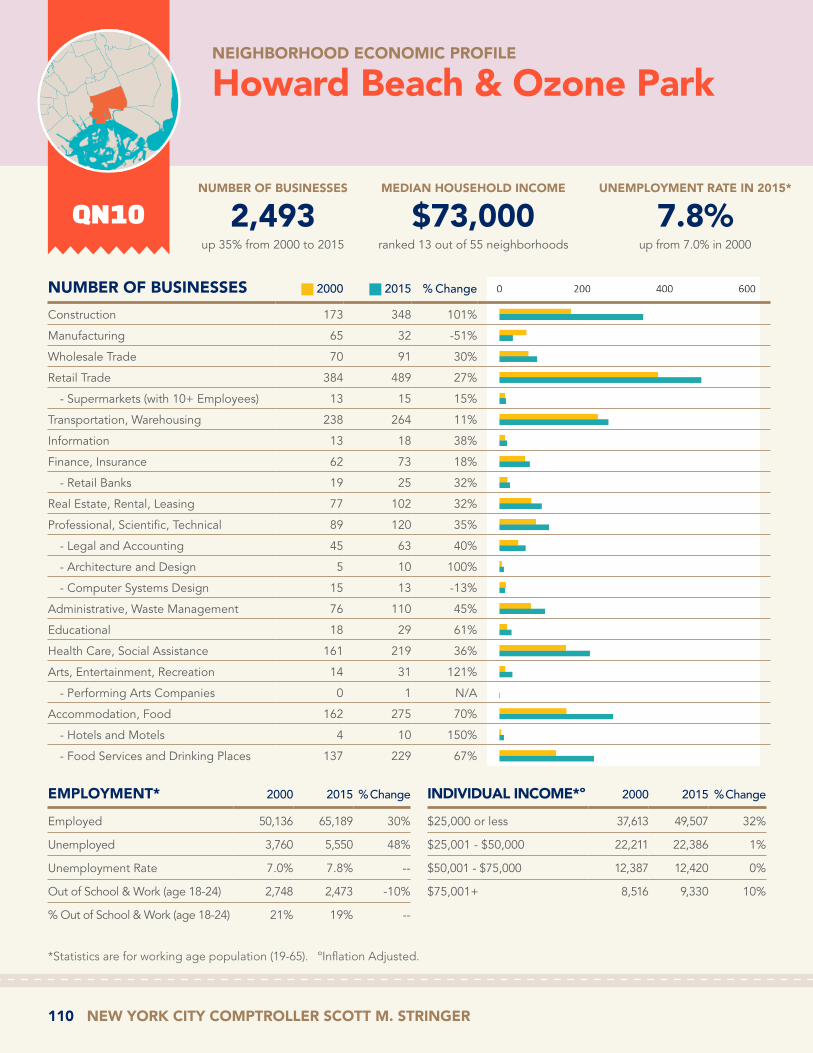
110 NEW YORK CITY COMPTROLLER SCOTT M. STRINGER
UNEMPLOYMENT RATE IN 2015*
7.8%up from 7.0% in 2000
NUMBER OF BUSINESSES
2,493up 35% from 2000 to 2015
MEDIAN HOUSEHOLD INCOME
$73,000ranked 13 out of 55 neighborhoods
QN10
NEIGHBORHOOD ECONOMIC PROFILE
Howard Beach & Ozone Park
EMPLOYMENT* 2000 2015 % Change
Employed 50,136 65,189 30%
Unemployed 3,760 5,550 48%
Unemployment Rate 7.0% 7.8% --
Out of School & Work (age 18-24) 2,748 2,473 -10%
% Out of School & Work (age 18-24) 21% 19% --
INDIVIDUAL INCOME*º 2000 2015 % Change
$25,000 or less 37,613 49,507 32%
$25,001 - $50,000 22,211 22,386 1%
$50,001 - $75,000 12,387 12,420 0%
$75,001+ 8,516 9,330 10%
NUMBER OF BUSINESSES 2000 2015 % Change
Construction 173 348 101%
Manufacturing 65 32 -51%
Wholesale Trade 70 91 30%
Retail Trade 384 489 27%
- Supermarkets (with 10+ Employees) 13 15 15%
Transportation, Warehousing 238 264 11%
Information 13 18 38%
Finance, Insurance 62 73 18%
- Retail Banks 19 25 32%
Real Estate, Rental, Leasing 77 102 32%
Professional, Scientific, Technical 89 120 35%
- Legal and Accounting 45 63 40%
- Architecture and Design 5 10 100%
- Computer Systems Design 15 13 -13%
Administrative, Waste Management 76 110 45%
Educational 18 29 61%
Health Care, Social Assistance 161 219 36%
Arts, Entertainment, Recreation 14 31 121%
- Performing Arts Companies 0 1 N/A
Accommodation, Food 162 275 70%
- Hotels and Motels 4 10 150%
- Food Services and Drinking Places 137 229 67%
*Statistics are for working age population (19-65). ºInflation Adjusted.

NEIGHBORHOOD ECONOMIC PROFILES 111
EDUCATION 2000 2015 % Change
Bachelor's Degree or Higher (age 25+)
11,331 22,980 103%
Percentage of Population with Bachelor's or Higher (age 25+)
13% 24% --
Associates Degree (age 25+) 4,695 6,120 30%
LAND USE 2002 2016 % Change
Tax lots devoted to Mixed-Use Residential/Commercial
813 804 -1%
Tax lots devoted to Office Buildings 66 63 -5%
Tax lots devoted to Standalone Retail 384 486 27%
WORK PLACE* 2000 2015 % Change
Work Inside NYC 43,951 57,400 31%
Percentage of Employed Working Inside NYC
90% 89% --
Work Inside Home Borough 20,433 28,303 39%
Percentage of Employed Working Inside Home Borough
42% 44% --
COMMUTE* 2000 2015 % Change
Commute Time (min) 43.1 47.2 9%
Public Transit 19,296 27,793 44%
Private Car or Taxi 26,452 32,113 21%
Walk or Bike 1,836 1,667 -9%
Work at Home 734 1,652 125%
AGE 2000 2015 % Change
Total Population 129,660 135,831 5%
Youth (Age 0-18) 34,214 26,845 -22%
Working Age Population (age 19-65)
80,727 93,643 16%
Seniors (age 66+) 14,719 15,343 4%
RACE 2000 2015 % Change
White 44,324 33,276 -25%
Black 21,039 18,707 -11%
Hispanic 24,347 33,124 36%
Asian 18,358 35,326 92%
BIRTH PLACE 2000 2015 % Change
Born inside the United States
75,091 68,622 -9%
Born outside the United States
54,569 67,209 23%
QN10 | Howard Beach & Ozone Park
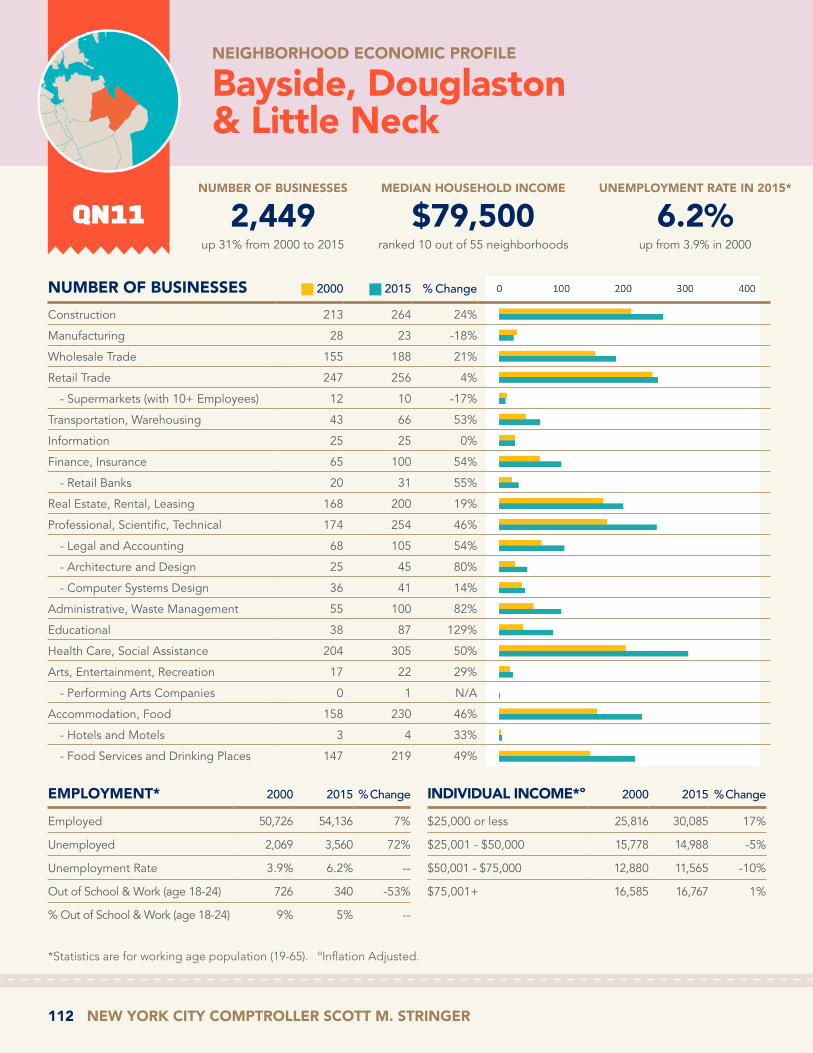
112 NEW YORK CITY COMPTROLLER SCOTT M. STRINGER
UNEMPLOYMENT RATE IN 2015*
6.2%up from 3.9% in 2000
NUMBER OF BUSINESSES
2,449up 31% from 2000 to 2015
MEDIAN HOUSEHOLD INCOME
$79,500ranked 10 out of 55 neighborhoods
QN11
NEIGHBORHOOD ECONOMIC PROFILE
Bayside, Douglaston & Little Neck
EMPLOYMENT* 2000 2015 % Change
Employed 50,726 54,136 7%
Unemployed 2,069 3,560 72%
Unemployment Rate 3.9% 6.2% --
Out of School & Work (age 18-24) 726 340 -53%
% Out of School & Work (age 18-24) 9% 5% --
INDIVIDUAL INCOME*º 2000 2015 % Change
$25,000 or less 25,816 30,085 17%
$25,001 - $50,000 15,778 14,988 -5%
$50,001 - $75,000 12,880 11,565 -10%
$75,001+ 16,585 16,767 1%
NUMBER OF BUSINESSES 2000 2015 % Change
Construction 213 264 24%
Manufacturing 28 23 -18%
Wholesale Trade 155 188 21%
Retail Trade 247 256 4%
- Supermarkets (with 10+ Employees) 12 10 -17%
Transportation, Warehousing 43 66 53%
Information 25 25 0%
Finance, Insurance 65 100 54%
- Retail Banks 20 31 55%
Real Estate, Rental, Leasing 168 200 19%
Professional, Scientific, Technical 174 254 46%
- Legal and Accounting 68 105 54%
- Architecture and Design 25 45 80%
- Computer Systems Design 36 41 14%
Administrative, Waste Management 55 100 82%
Educational 38 87 129%
Health Care, Social Assistance 204 305 50%
Arts, Entertainment, Recreation 17 22 29%
- Performing Arts Companies 0 1 N/A
Accommodation, Food 158 230 46%
- Hotels and Motels 3 4 33%
- Food Services and Drinking Places 147 219 49%
*Statistics are for working age population (19-65). ºInflation Adjusted.

NEIGHBORHOOD ECONOMIC PROFILES 113
EDUCATION 2000 2015 % Change
Bachelor's Degree or Higher (age 25+)
31,639 38,698 22%
Percentage of Population with Bachelor's or Higher (age 25+)
38% 44% --
Associates Degree (age 25+) 5,146 7,549 47%
LAND USE 2002 2016 % Change
Tax lots devoted to Mixed-Use Residential/Commercial
331 354 7%
Tax lots devoted to Office Buildings 112 121 8%
Tax lots devoted to Standalone Retail 309 318 3%
WORK PLACE* 2000 2015 % Change
Work Inside NYC 40,051 42,940 7%
Percentage of Employed Working Inside NYC
81% 81% --
Work Inside Home Borough 20,006 23,573 18%
Percentage of Employed Working Inside Home Borough
40% 44% --
COMMUTE* 2000 2015 % Change
Commute Time (min) 40.9 43.4 6%
Public Transit 13,831 14,497 5%
Private Car or Taxi 32,990 35,992 9%
Walk or Bike 1,534 1,045 -32%
Work at Home 1,245 1,654 33%
AGE 2000 2015 % Change
Total Population 114,217 113,391 -1%
Youth (Age 0-18) 23,674 20,248 -14%
Working Age Population (age 19-65)
71,059 73,405 3%
Seniors (age 66+) 19,484 19,738 1%
RACE 2000 2015 % Change
White 68,033 45,074 -34%
Black 2,213 2,379 8%
Hispanic 10,034 14,134 41%
Asian 30,584 49,455 62%
BIRTH PLACE 2000 2015 % Change
Born inside the United States
72,567 61,207 -16%
Born outside the United States
41,650 52,184 25%
QN11 | Bayside, Douglaston & Little Neck

114 NEW YORK CITY COMPTROLLER SCOTT M. STRINGER
UNEMPLOYMENT RATE IN 2015*
10.6%up from 10.0% in 2000
NUMBER OF BUSINESSES
3,021up 29% from 2000 to 2015
MEDIAN HOUSEHOLD INCOME
$60,000ranked 23 out of 55 neighborhoods
QN12
NEIGHBORHOOD ECONOMIC PROFILE
Jamaica, Hollis & St. Albans
EMPLOYMENT* 2000 2015 % Change
Employed 82,980 110,441 33%
Unemployed 9,244 13,105 42%
Unemployment Rate 10.0% 10.6% --
Out of School & Work (age 18-24) 5,868 4,551 -22%
% Out of School & Work (age 18-24) 26% 19% --
INDIVIDUAL INCOME*º 2000 2015 % Change
$25,000 or less 64,783 84,004 30%
$25,001 - $50,000 38,802 40,889 5%
$50,001 - $75,000 18,693 19,362 4%
$75,001+ 10,756 13,048 21%
NUMBER OF BUSINESSES 2000 2015 % Change
Construction 140 249 78%
Manufacturing 85 61 -28%
Wholesale Trade 147 159 8%
Retail Trade 358 536 50%
- Supermarkets (with 10+ Employees) 12 15 25%
Transportation, Warehousing 479 439 -8%
Information 18 28 56%
Finance, Insurance 54 64 19%
- Retail Banks 17 24 41%
Real Estate, Rental, Leasing 100 146 46%
Professional, Scientific, Technical 89 142 60%
- Legal and Accounting 34 65 91%
- Architecture and Design 9 12 33%
- Computer Systems Design 14 25 79%
Administrative, Waste Management 64 81 27%
Educational 27 32 19%
Health Care, Social Assistance 237 372 57%
Arts, Entertainment, Recreation 5 11 120%
- Performing Arts Companies 2 4 100%
Accommodation, Food 150 294 96%
- Hotels and Motels 9 19 111%
- Food Services and Drinking Places 127 257 102%
*Statistics are for working age population (19-65). ºInflation Adjusted.

NEIGHBORHOOD ECONOMIC PROFILES 115
EDUCATION 2000 2015 % Change
Bachelor's Degree or Higher (age 25+)
20,925 33,136 58%
Percentage of Population with Bachelor's or Higher (age 25+)
15% 20% --
Associates Degree (age 25+) 8,295 13,866 67%
LAND USE 2002 2016 % Change
Tax lots devoted to Mixed-Use Residential/Commercial
1,283 1,339 4%
Tax lots devoted to Office Buildings 137 130 -5%
Tax lots devoted to Standalone Retail 680 777 14%
WORK PLACE* 2000 2015 % Change
Work Inside NYC 69,909 91,554 31%
Percentage of Employed Working Inside NYC
86% 85% --
Work Inside Home Borough 34,671 50,151 45%
Percentage of Employed Working Inside Home Borough
43% 47% --
COMMUTE* 2000 2015 % Change
Commute Time (min) 49.8 49.7 0%
Public Transit 38,337 53,032 38%
Private Car or Taxi 38,740 46,870 21%
Walk or Bike 2,630 5,005 90%
Work at Home 1,171 2,024 73%
AGE 2000 2015 % Change
Total Population 218,003 247,323 13%
Youth (Age 0-18) 62,444 60,852 -3%
Working Age Population (age 19-65)
133,034 157,303 18%
Seniors (age 66+) 22,525 29,168 29%
RACE 2000 2015 % Change
White 4,585 3,024 -34%
Black 161,228 154,943 -4%
Hispanic 28,828 42,065 46%
Asian 9,664 31,309 224%
BIRTH PLACE 2000 2015 % Change
Born inside the United States
140,535 143,627 2%
Born outside the United States
77,468 103,696 34%
QN12 | Jamaica, Hollis & St. Albans

116 NEW YORK CITY COMPTROLLER SCOTT M. STRINGER
UNEMPLOYMENT RATE IN 2015*
7.4%up from 6.1% in 2000
NUMBER OF BUSINESSES
2,357up 31% from 2000 to 2015
MEDIAN HOUSEHOLD INCOME
$81,900ranked 8 out of 55 neighborhoods
QN13
NEIGHBORHOOD ECONOMIC PROFILE
Queens Village, Cambria Heights & Rosedale
EMPLOYMENT* 2000 2015 % Change
Employed 82,670 96,881 17%
Unemployed 5,391 7,796 45%
Unemployment Rate 6.1% 7.4% --
Out of School & Work (age 18-24) 2,555 2,545 0%
% Out of School & Work (age 18-24) 15% 14% --
INDIVIDUAL INCOME*º 2000 2015 % Change
$25,000 or less 44,001 61,154 39%
$25,001 - $50,000 34,803 35,616 2%
$50,001 - $75,000 21,918 18,137 -17%
$75,001+ 18,317 18,236 0%
NUMBER OF BUSINESSES 2000 2015 % Change
Construction 171 258 51%
Manufacturing 42 24 -43%
Wholesale Trade 73 74 1%
Retail Trade 290 386 33%
- Supermarkets (with 10+ Employees) 10 11 10%
Transportation, Warehousing 222 267 20%
Information 17 15 -12%
Finance, Insurance 68 79 16%
- Retail Banks 20 25 25%
Real Estate, Rental, Leasing 109 134 23%
Professional, Scientific, Technical 103 156 51%
- Legal and Accounting 31 69 123%
- Architecture and Design 10 15 50%
- Computer Systems Design 31 33 6%
Administrative, Waste Management 51 86 69%
Educational 32 36 13%
Health Care, Social Assistance 241 312 29%
Arts, Entertainment, Recreation 20 22 10%
- Performing Arts Companies 3 0 -100%
Accommodation, Food 92 208 126%
- Hotels and Motels 1 4 300%
- Food Services and Drinking Places 86 200 133%
*Statistics are for working age population (19-65). ºInflation Adjusted.

NEIGHBORHOOD ECONOMIC PROFILES 117
EDUCATION 2000 2015 % Change
Bachelor's Degree or Higher (age 25+)
30,772 41,781 36%
Percentage of Population with Bachelor's or Higher (age 25+)
24% 29% --
Associates Degree (age 25+) 8,601 15,326 78%
LAND USE 2002 2016 % Change
Tax lots devoted to Mixed-Use Residential/Commercial
606 628 4%
Tax lots devoted to Office Buildings 100 102 2%
Tax lots devoted to Standalone Retail 461 532 15%
WORK PLACE* 2000 2015 % Change
Work Inside NYC 63,740 73,231 15%
Percentage of Employed Working Inside NYC
79% 78% --
Work Inside Home Borough 29,506 41,742 41%
Percentage of Employed Working Inside Home Borough
37% 45% --
COMMUTE* 2000 2015 % Change
Commute Time (min) 49.5 49.8 1%
Public Transit 27,030 35,575 32%
Private Car or Taxi 50,555 53,378 6%
Walk or Bike 1,405 2,360 68%
Work at Home 1,294 2,205 70%
AGE 2000 2015 % Change
Total Population 192,302 203,198 6%
Youth (Age 0-18) 51,174 40,926 -20%
Working Age Population (age 19-65)
119,039 133,143 12%
Seniors (age 66+) 22,089 29,129 32%
RACE 2000 2015 % Change
White 35,343 22,844 -35%
Black 106,930 110,624 3%
Hispanic 19,657 28,374 44%
Asian 20,049 30,658 53%
BIRTH PLACE 2000 2015 % Change
Born inside the United States
115,820 115,490 0%
Born outside the United States
76,482 87,708 15%
QN13 | Queens Village, Cambria Heights & Rosedale

118 NEW YORK CITY COMPTROLLER SCOTT M. STRINGER
UNEMPLOYMENT RATE IN 2015*
11.7%up from 10.5% in 2000
NUMBER OF BUSINESSES
1,148up 32% from 2000 to 2015
MEDIAN HOUSEHOLD INCOME
$55,700ranked 26 out of 55 neighborhoods
QN14
NEIGHBORHOOD ECONOMIC PROFILE
Far Rockaway, Breezy Point & Broad Channel
EMPLOYMENT* 2000 2015 % Change
Employed 34,879 47,080 35%
Unemployed 4,098 6,225 52%
Unemployment Rate 10.5% 11.7% --
Out of School & Work (age 18-24) 2,499 1,356 -46%
% Out of School & Work (age 18-24) 26% 12% --
INDIVIDUAL INCOME*º 2000 2015 % Change
$25,000 or less 29,932 38,274 28%
$25,001 - $50,000 14,369 16,550 15%
$50,001 - $75,000 8,191 7,645 -7%
$75,001+ 6,431 8,933 39%
NUMBER OF BUSINESSES 2000 2015 % Change
Construction 64 85 33%
Manufacturing 17 10 -41%
Wholesale Trade 25 39 56%
Retail Trade 152 210 38%
- Supermarkets (with 10+ Employees) 9 14 56%
Transportation, Warehousing 22 29 32%
Information 12 14 17%
Finance, Insurance 21 27 29%
- Retail Banks 12 11 -8%
Real Estate, Rental, Leasing 59 84 42%
Professional, Scientific, Technical 39 70 79%
- Legal and Accounting 19 21 11%
- Architecture and Design 5 13 160%
- Computer Systems Design 7 10 43%
Administrative, Waste Management 27 41 52%
Educational 18 22 22%
Health Care, Social Assistance 178 221 24%
Arts, Entertainment, Recreation 10 14 40%
- Performing Arts Companies 0 0 N/A
Accommodation, Food 73 134 84%
- Hotels and Motels 0 0 N/A
- Food Services and Drinking Places 66 130 97%
*Statistics are for working age population (19-65). ºInflation Adjusted.

NEIGHBORHOOD ECONOMIC PROFILES 119
EDUCATION 2000 2015 % Change
Bachelor's Degree or Higher (age 25+)
13,330 23,552 77%
Percentage of Population with Bachelor's or Higher (age 25+)
21% 30% --
Associates Degree (age 25+) 3,583 5,066 41%
LAND USE 2002 2016 % Change
Tax lots devoted to Mixed-Use Residential/Commercial
194 181 -7%
Tax lots devoted to Office Buildings 41 37 -10%
Tax lots devoted to Standalone Retail 199 204 3%
WORK PLACE* 2000 2015 % Change
Work Inside NYC 27,391 38,894 42%
Percentage of Employed Working Inside NYC
81% 84% --
Work Inside Home Borough 13,358 24,831 86%
Percentage of Employed Working Inside Home Borough
40% 54% --
COMMUTE* 2000 2015 % Change
Commute Time (min) 46.1 51 11%
Public Transit 12,259 16,501 35%
Private Car or Taxi 18,556 26,607 43%
Walk or Bike 2,196 1,775 -19%
Work at Home 437 706 62%
AGE 2000 2015 % Change
Total Population 103,729 121,921 18%
Youth (Age 0-18) 30,452 34,560 13%
Working Age Population (age 19-65)
58,923 71,402 21%
Seniors (age 66+) 14,354 15,959 11%
RACE 2000 2015 % Change
White 39,537 39,825 1%
Black 41,905 44,160 5%
Hispanic 17,107 34,620 102%
Asian 1,660 3,102 87%
BIRTH PLACE 2000 2015 % Change
Born inside the United States
76,093 84,025 10%
Born outside the United States
27,636 37,896 37%
QN14 | Far Rockaway, Breezy Point & Broad Channel

120 NEW YORK CITY COMPTROLLER SCOTT M. STRINGER
UNEMPLOYMENT RATE IN 2015*
5.2%down from 5.8% in 2000
NUMBER OF BUSINESSES
9,122up 22% from 2000 to 2015
MEDIAN HOUSEHOLD INCOME
$71,000
NEIGHBORHOOD ECONOMIC PROFILE
Staten Island
EMPLOYMENT* 2000 2015 % Change
Employed 189,255 200,652 6%
Unemployed 11,570 11,057 -4%
Unemployment Rate 5.8% 5.2% --
Out of School & Work (age 18-24) 7,162 7,441 4%
% Out of School & Work (age 18-24) 19% 18% --
INDIVIDUAL INCOME*º 2000 2015 % Change
$25,000 or less 111,284 139,034 25%
$25,001 - $50,000 61,334 63,351 3%
$50,001 - $75,000 47,301 40,616 -14%
$75,001+ 60,450 54,441 -10%
NUMBER OF BUSINESSES 2000 2015 % Change
Construction 946 1,207 28%
Manufacturing 166 135 -19%
Wholesale Trade 371 385 4%
Retail Trade 1,232 1,371 11%
- Supermarkets (with 10+ Employees) 23 38 65%
Transportation, Warehousing 232 309 33%
Information 103 115 12%
Finance, Insurance 306 382 25%
- Retail Banks 89 129 45%
Real Estate, Rental, Leasing 257 328 28%
Professional, Scientific, Technical 749 905 21%
- Legal and Accounting 311 408 31%
- Architecture and Design 88 91 3%
- Computer Systems Design 171 136 -20%
Administrative, Waste Management 397 442 11%
Educational 101 163 61%
Health Care, Social Assistance 941 1,326 41%
Arts, Entertainment, Recreation 92 140 52%
- Performing Arts Companies 6 7 17%
Accommodation, Food 567 827 46%
- Hotels and Motels 8 8 0%
- Food Services and Drinking Places 513 769 50%
*Statistics are for working age population (19-65). ºInflation Adjusted.
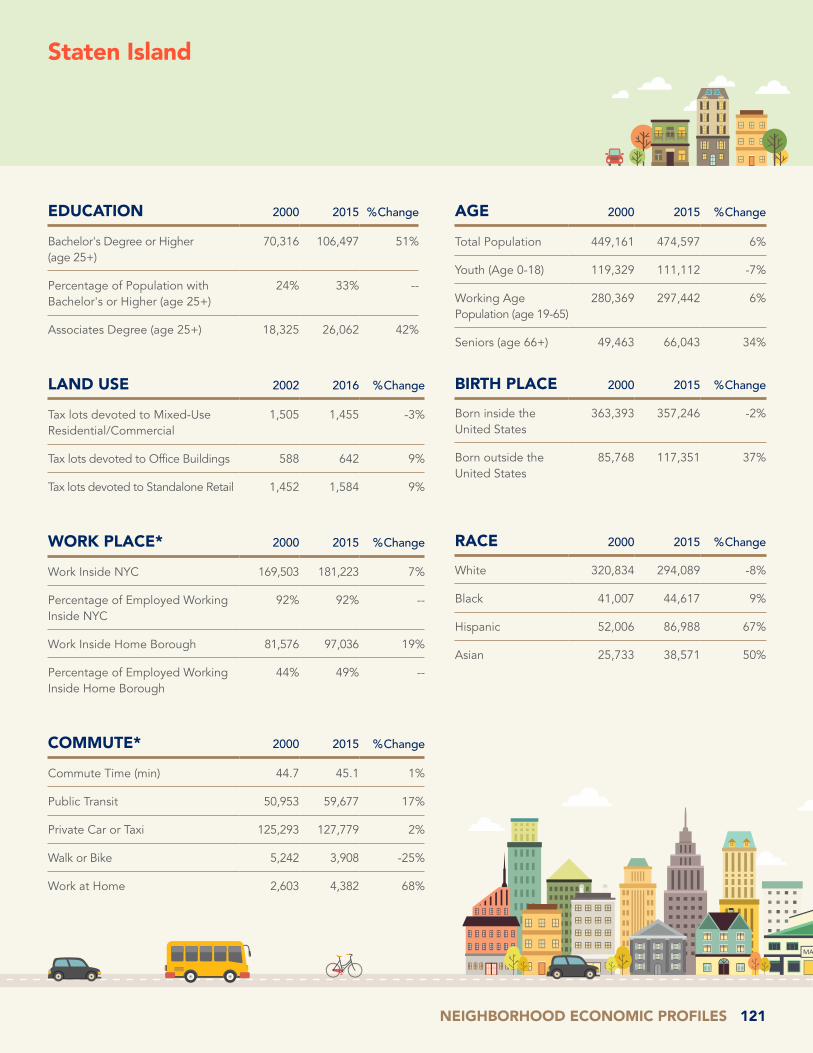
NEIGHBORHOOD ECONOMIC PROFILES 121
EDUCATION 2000 2015 % Change
Bachelor's Degree or Higher (age 25+)
70,316 106,497 51%
Percentage of Population with Bachelor's or Higher (age 25+)
24% 33% --
Associates Degree (age 25+) 18,325 26,062 42%
LAND USE 2002 2016 % Change
Tax lots devoted to Mixed-Use Residential/Commercial
1,505 1,455 -3%
Tax lots devoted to Office Buildings 588 642 9%
Tax lots devoted to Standalone Retail 1,452 1,584 9%
WORK PLACE* 2000 2015 % Change
Work Inside NYC 169,503 181,223 7%
Percentage of Employed Working Inside NYC
92% 92% --
Work Inside Home Borough 81,576 97,036 19%
Percentage of Employed Working Inside Home Borough
44% 49% --
COMMUTE* 2000 2015 % Change
Commute Time (min) 44.7 45.1 1%
Public Transit 50,953 59,677 17%
Private Car or Taxi 125,293 127,779 2%
Walk or Bike 5,242 3,908 -25%
Work at Home 2,603 4,382 68%
AGE 2000 2015 % Change
Total Population 449,161 474,597 6%
Youth (Age 0-18) 119,329 111,112 -7%
Working Age Population (age 19-65)
280,369 297,442 6%
Seniors (age 66+) 49,463 66,043 34%
RACE 2000 2015 % Change
White 320,834 294,089 -8%
Black 41,007 44,617 9%
Hispanic 52,006 86,988 67%
Asian 25,733 38,571 50%
BIRTH PLACE 2000 2015 % Change
Born inside the United States
363,393 357,246 -2%
Born outside the United States
85,768 117,351 37%
Staten Island

122 NEW YORK CITY COMPTROLLER SCOTT M. STRINGER
UNEMPLOYMENT RATE IN 2015*
4.9%down from 8.8% in 2000
NUMBER OF BUSINESSES
2,702up 19% from 2000 to 2015
MEDIAN HOUSEHOLD INCOME
$56,600ranked 24 out of 55 neighborhoods
SI01
NEIGHBORHOOD ECONOMIC PROFILE
Port Richmond, Stapleton & Mariners Harbor
EMPLOYMENT* 2000 2015 % Change
Employed 64,901 68,780 6%
Unemployed 6,244 3,579 -43%
Unemployment Rate 8.8% 4.9% --
Out of School & Work (age 18-24) 3,659 2,873 -21%
% Out of School & Work (age 18-24) 24% 17% --
INDIVIDUAL INCOME*º 2000 2015 % Change
$25,000 or less 43,190 56,589 31%
$25,001 - $50,000 22,984 21,879 -5%
$50,001 - $75,000 15,494 13,361 -14%
$75,001+ 17,110 15,234 -11%
NUMBER OF BUSINESSES 2000 2015 % Change
Construction 242 337 39%
Manufacturing 71 56 -21%
Wholesale Trade 120 100 -17%
Retail Trade 337 454 35%
- Supermarkets (with 10+ Employees) 6 10 67%
Transportation, Warehousing 64 84 31%
Information 25 30 20%
Finance, Insurance 83 90 8%
- Retail Banks 30 39 30%
Real Estate, Rental, Leasing 89 98 10%
Professional, Scientific, Technical 251 239 -5%
- Legal and Accounting 133 123 -8%
- Architecture and Design 39 32 -18%
- Computer Systems Design 29 28 -3%
Administrative, Waste Management 86 97 13%
Educational 31 31 0%
Health Care, Social Assistance 345 423 23%
Arts, Entertainment, Recreation 26 36 38%
- Performing Arts Companies 3 3 0%
Accommodation, Food 151 262 74%
- Hotels and Motels 0 1 N/A
- Food Services and Drinking Places 136 247 82%
*Statistics are for working age population (19-65). ºInflation Adjusted.

NEIGHBORHOOD ECONOMIC PROFILES 123
EDUCATION 2000 2015 % Change
Bachelor's Degree or Higher (age 25+)
24,549 35,795 46%
Percentage of Population with Bachelor's or Higher (age 25+)
24% 32% --
Associates Degree (age 25+) 6,508 7,689 18%
LAND USE 2002 2016 % Change
Tax lots devoted to Mixed-Use Residential/Commercial
923 892 -3%
Tax lots devoted to Office Buildings 253 264 4%
Tax lots devoted to Standalone Retail 640 673 5%
WORK PLACE* 2000 2015 % Change
Work Inside NYC 59,177 64,281 9%
Percentage of Employed Working Inside NYC
94% 95% --
Work Inside Home Borough 30,850 37,490 22%
Percentage of Employed Working Inside Home Borough
49% 56% --
COMMUTE* 2000 2015 % Change
Commute Time (min) 43.9 41.6 -5%
Public Transit 21,813 24,894 14%
Private Car or Taxi 37,205 37,260 0%
Walk or Bike 2,917 2,634 -10%
Work at Home 993 1,660 67%
AGE 2000 2015 % Change
Total Population 162,319 170,422 5%
Youth (Age 0-18) 45,957 43,836 -5%
Working Age Population (age 19-65)
98,778 107,063 8%
Seniors (age 66+) 17,584 19,523 11%
RACE 2000 2015 % Change
White 82,356 58,971 -28%
Black 36,027 38,884 8%
Hispanic 29,438 52,261 78%
Asian 8,535 15,033 76%
BIRTH PLACE 2000 2015 % Change
Born inside the United States
124,428 121,044 -3%
Born outside the United States
37,891 49,378 30%
SI01 | Port Richmond, Stapleton & Mariners Harbor

124 NEW YORK CITY COMPTROLLER SCOTT M. STRINGER
UNEMPLOYMENT RATE IN 2015*
5.4%up from 4.9% in 2000
NUMBER OF BUSINESSES
3,979up 19% from 2000 to 2015
MEDIAN HOUSEHOLD INCOME
$73,100ranked 11 out of 55 neighborhoods
SI02
NEIGHBORHOOD ECONOMIC PROFILE
New Springville & South Beach
EMPLOYMENT* 2000 2015 % Change
Employed 54,539 56,858 4%
Unemployed 2,801 3,230 15%
Unemployment Rate 4.9% 5.4% --
Out of School & Work (age 18-24) 1,755 1,576 -10%
% Out of School & Work (age 18-24) 17% 14% --
INDIVIDUAL INCOME*º 2000 2015 % Change
$25,000 or less 32,274 40,196 25%
$25,001 - $50,000 17,402 20,015 15%
$50,001 - $75,000 14,039 10,073 -28%
$75,001+ 18,125 16,323 -10%
NUMBER OF BUSINESSES 2000 2015 % Change
Construction 369 467 27%
Manufacturing 48 43 -10%
Wholesale Trade 161 171 6%
Retail Trade 650 622 -4%
- Supermarkets (with 10+ Employees) 12 19 58%
Transportation, Warehousing 98 137 40%
Information 53 51 -4%
Finance, Insurance 150 190 27%
- Retail Banks 42 58 38%
Real Estate, Rental, Leasing 114 153 34%
Professional, Scientific, Technical 332 420 27%
- Legal and Accounting 137 207 51%
- Architecture and Design 26 26 0%
- Computer Systems Design 89 63 -29%
Administrative, Waste Management 175 195 11%
Educational 49 78 59%
Health Care, Social Assistance 399 594 49%
Arts, Entertainment, Recreation 34 61 79%
- Performing Arts Companies 1 4 300%
Accommodation, Food 276 352 28%
- Hotels and Motels 7 6 -14%
- Food Services and Drinking Places 247 322 30%
*Statistics are for working age population (19-65). ºInflation Adjusted.

NEIGHBORHOOD ECONOMIC PROFILES 125
EDUCATION 2000 2015 % Change
Bachelor's Degree or Higher (age 25+)
22,314 32,258 45%
Percentage of Population with Bachelor's or Higher (age 25+)
25% 33% --
Associates Degree (age 25+) 4,992 7,434 49%
LAND USE 2002 2016 % Change
Tax lots devoted to Mixed-Use Residential/Commercial
301 309 3%
Tax lots devoted to Office Buildings 197 233 18%
Tax lots devoted to Standalone Retail 493 541 10%
WORK PLACE* 2000 2015 % Change
Work Inside NYC 48,669 50,895 5%
Percentage of Employed Working Inside NYC
92% 90% --
Work Inside Home Borough 22,089 24,782 12%
Percentage of Employed Working Inside Home Borough
42% 44% --
COMMUTE* 2000 2015 % Change
Commute Time (min) 42.5 46.9 10%
Public Transit 13,581 16,786 24%
Private Car or Taxi 37,173 37,276 0%
Walk or Bike 1,646 722 -56%
Work at Home 516 1,462 183%
AGE 2000 2015 % Change
Total Population 131,283 136,544 4%
Youth (Age 0-18) 32,836 29,838 -9%
Working Age Population (age 19-65)
81,840 86,607 6%
Seniors (age 66+) 16,607 20,099 21%
RACE 2000 2015 % Change
White 100,272 90,909 -9%
Black 3,473 4,466 29%
Hispanic 12,610 20,157 60%
Asian 12,507 18,209 46%
BIRTH PLACE 2000 2015 % Change
Born inside the United States
104,086 97,249 -7%
Born outside the United States
27,197 39,295 44%
SI02 | New Springville & South Beach

126 NEW YORK CITY COMPTROLLER SCOTT M. STRINGER
UNEMPLOYMENT RATE IN 2015*
5.4%up from 3.5% in 2000
NUMBER OF BUSINESSES
2,441up 32% from 2000 to 2015
MEDIAN HOUSEHOLD INCOME
$80,000ranked 9 out of 55 neighborhoods
SI03
NEIGHBORHOOD ECONOMIC PROFILE
Tottenville, Great Kills & Annadale
EMPLOYMENT* 2000 2015 % Change
Employed 69,815 75,014 7%
Unemployed 2,525 4,248 68%
Unemployment Rate 3.5% 5.4% --
Out of School & Work (age 18-24) 1,748 2,992 71%
% Out of School & Work (age 18-24) 14% 21% --
INDIVIDUAL INCOME*º 2000 2015 % Change
$25,000 or less 35,820 42,249 18%
$25,001 - $50,000 20,948 21,457 2%
$50,001 - $75,000 17,768 17,182 -3%
$75,001+ 25,215 22,884 -9%
NUMBER OF BUSINESSES 2000 2015 % Change
Construction 335 403 20%
Manufacturing 47 36 -23%
Wholesale Trade 90 114 27%
Retail Trade 245 295 20%
- Supermarkets (with 10+ Employees) 5 9 80%
Transportation, Warehousing 70 88 26%
Information 25 34 36%
Finance, Insurance 73 102 40%
- Retail Banks 17 32 88%
Real Estate, Rental, Leasing 54 77 43%
Professional, Scientific, Technical 166 246 48%
- Legal and Accounting 41 78 90%
- Architecture and Design 23 33 43%
- Computer Systems Design 53 45 -15%
Administrative, Waste Management 136 150 10%
Educational 21 54 157%
Health Care, Social Assistance 197 309 57%
Arts, Entertainment, Recreation 32 43 34%
- Performing Arts Companies 2 0 -100%
Accommodation, Food 140 213 52%
- Hotels and Motels 1 1 0%
- Food Services and Drinking Places 130 200 54%
*Statistics are for working age population (19-65). ºInflation Adjusted.

NEIGHBORHOOD ECONOMIC PROFILES 127
EDUCATION 2000 2015 % Change
Bachelor's Degree or Higher (age 25+)
23,453 38,444 64%
Percentage of Population with Bachelor's or Higher (age 25+)
23% 32% --
Associates Degree (age 25+) 6,825 10,939 60%
LAND USE 2002 2016 % Change
Tax lots devoted to Mixed-Use Residential/Commercial
281 254 -10%
Tax lots devoted to Office Buildings 138 145 5%
Tax lots devoted to Standalone Retail 319 370 16%
WORK PLACE* 2000 2015 % Change
Work Inside NYC 61,657 66,047 7%
Percentage of Employed Working Inside NYC
90% 90% --
Work Inside Home Borough 28,637 34,764 21%
Percentage of Employed Working Inside Home Borough
42% 47% --
COMMUTE* 2000 2015 % Change
Commute Time (min) 47.1 46.9 0%
Public Transit 15,559 17,997 16%
Private Car or Taxi 50,915 53,243 5%
Walk or Bike 679 552 -19%
Work at Home 1,094 1,260 15%
AGE 2000 2015 % Change
Total Population 155,559 167,631 8%
Youth (Age 0-18) 40,536 37,438 -8%
Working Age Population (age 19-65)
99,751 103,772 4%
Seniors (age 66+) 15,272 26,421 73%
RACE 2000 2015 % Change
White 138,206 144,209 4%
Black 1,507 1,267 -16%
Hispanic 9,958 14,570 46%
Asian 4,691 5,329 14%
BIRTH PLACE 2000 2015 % Change
Born inside the United States
134,879 138,953 3%
Born outside the United States
20,680 28,678 39%
SI03 | Tottenville, Great Kills & Annadale

128 NEW YORK CITY COMPTROLLER SCOTT M. STRINGER
New York City’s 55 “neighborhoods” are derived from the United State Census Bureau’s “Public Use Micro Areas.” Business Data is from the Census Bureau’s “ZIP Code Business Patterns,” 2000 and 2015. Zip codes were converted to PUMAs using a crosswalk developed by Frank Donnelly, Geospatial Data Librarian at Baruch College. Land Use data is from the Department of City Planning’s “Primary Land Use Tax Lot Output,” 2002a and 2016v2. All other data is from the Census Bureau’s 2000 Census and 2015 American Community Survey.

NEIGHBORHOOD ECONOMIC PROFILES 129

NEW YORK CITY COMPTROLLER
SCOTT M. STRINGER
1 Centre Street, New York, NY 10007 • (212) 669-3500 • www.comptroller.nyc.gov • brand16 @NYCComptroller