m emoran dum - nasa · research m emoran dum buffet tests of an attacec-airsiane model wit"...
TRANSCRIPT
RESEARCH M EMORAN DUM
BUFFET TESTS OF AN ATTACEC-AIRSIANE MODEL WIT" EMPHASIS
ON ANALYSIS OF DATA FROM WXND-TUNNEL TESTS
By Don D. Davis, Jr., and Dewey E. Wornom
Langley Aeronautical Laboratory Langley Field, Va.
NATIONAL ADVISORY COMMITTEE FOR AERONAUTICS
WASHINGTON February 21, 1958
....... ........... . . . . . 0 . ...... *:*C~FIDTNJI#E. : ...... 0 . 0 . 0 . . e . . ........ ......................... . . . . . . .
https://ntrs.nasa.gov/search.jsp?R=19630002658 2018-09-16T06:40:29+00:00Z
NATIONAL ADVISORY C m I m FOR AERONAUTICS
RESEARCH MEMORANDUM
BUFFET TESTS OF AN ATTACK-AIRPLANE MODEL W I T H EMPHASIS
ON ANALYSIS OF IlATA FROM WIIW-TUNNEL TESTS
By Don D. Davis, Jr., and Dewey E. Wornom
The buffet character is t ics of a l/lO-scale m o d e l of an at tack air- plane have been investigated at Mach numbers from 0.80 to 1.00. had a modified de l ta plan form with an NACA 0008 (modified) a i r f o i l sec- t ion a t the root and an NACA 0005 (modified) a i r f o i l section at the tip, a leading-edge sweep of 41.11°, an aspect r a t i o of 2-91, and a taper r a t i o of 0.226. wing-leading-edge extension with camber, an addition t o the w i n g t r a i l i n g edge sweeping it forward 100, and & area addition t o the rearward fuse- lage section. In the speed range where the buffet boundary of the basic configuration was lowest, the buffet intensi ty was reduced substant ia l ly when these modifications were added t o the model.
The w i n g
Modifications t o the basic configuration included a tapered
During buffet, the wing vibrated primarily i n the first symmetrical mode. the case f o r airplanes i n f l i g h t a t these speeds but, instead, w a s mostly s t ruc tura l apparently because of f r ic t ion i n a dovetail jo in t . r e su l t , any attempt to predict f l i g h t buffet s t resses from the results of this investigation m u s t be based on an estimate of the aerodynamic damping f o r the airplane.
The damping of the vibration w a s not primarily aerodynamic as is
As a
A technique is described fo r making wind-tunnel buffet measurements
Equations are derived fo r the buffet response of a p la te l ike and f o r deducing the system damping fromthe power spectrum of the wing vibration. wing, the s t ruc tura l character is t ics of which are described by mass and flexibil i ty-influence-coefficient matrices.
For the mathematical model of the buffeting wing there i s a re la t ion-
The experimental results show that this same relationship holds ship that connects the band width, the peak response, and the mean-square response. f o r the actual buffeting wing.
In designing buffet models, it is desirable t o keep the s t ruc tura l damping very low, because the aerodynamic damping r a t i o i s much lower f o r so l id metal model wings than f o r actual airplane wings.
CONFIDENTIAL
IMTRODUC TION
Several attempts have been made t o es tabl ish a correlation between the buffet boundary of an airplane and some quantity tha t i s observable i n wind-tunnel t e s t s of a model. s t a t i c l i f t character is t ics have been used with some success f o r this picrpose ( re fs . 1 and 2 ) , as have measurements of wake-pressure fluctua- t ions ( r e f . 3 ) . by placing s t r a i n gages on the wings ( r e f . 3 ) . With the a i d of s t r a i n gages and modern data-handling techniques, it has recently become possible t o give serious consideration t o the more d i f f i c u l t problem of predicting, from wind-tunnel data, the loads tha t w i l l be encountered during buffeting i n f l i gh t .
Certain quantit ies associated with the
The buffeting of models has a lso been observed d i rec t ly
The suggestion i s made i n reference 4 t ha t the methods of generalized Anal- harmonic analysis can be applied t o the problem of airplane buffet .
yses of f l i g h t buffet data have since indicated the va l id i ty of t h i s approach ( r e f s . 5 and 6 ) . been derived fo r predicting f l i g h t buffet loads from model test.s i n a wind tunnel. Two comparisons between f l i g h t and wind-tunnel data are presented i n reference 7 and the correlation, while perhaps not en t i re ly adequate, is certainly very encouraging.
By using these same techniques, a method has
The primary purpose of the present buffet investigation w a s t o make a wind-tunnel study of the buffet character is t ics of a model of an attack airplane and, i n par t icular , t o evaluate the e f f ec t s of cer ta in modifications on the buffet character is t ics . The t e s t s were conducted a t Mach numbers from 0.80 t o 1.00 i n the Langley 8-foot transonic pres- sure tunnel.
The instrumentation that w a s used w a s i n accordance with the method of reference 7, and the tests were designed i n such a way as t o provide a check on some of the assumptions of that reference. The resu l t s show that an important assumption regarding the system damping did not apply i n th i s test. determining why this assumption did not apply, and t o presenting the ana lys i s techniques that w e r e developed t o circumvent this d i f f icu l ty . This material i s of par t icu lar i n t e r e s t t o those readers who w i l l be required t o conduct buffet tests o r t o in te rpre t the results of such tests.
Consequently, a large part of this paper is devoted t o
square of absolute value of system admittance
matrix of f l e x i b i l i t y influence coefficients
CONFIDENTIAL ....................... .......... . . . . . . .... . 0 . . 0 . 0 . ...... . . . . . . . . . . . . . . . . . . . . . . . . . .. . 0 . 0 . . e . . . . . . . .........................
. . . . . . . ......................... ........ . . . . . . . . . . . . . . . . . . . . . 0 . 0 . 0 . ...... . . . 0 . 0 . 0 0 .. .... NACA RM L 5 7 ~ ~ 5 . ~ ..... :.mmmm&*. .............. 3
b
C
wing span, f t
wing chord, f t
S Cav average chord, f t
L i f t l i f t coefficient, - ¶S CL
C
c N , l
f
f 1
FO
FS
kS
Ll
m
first-mode generalized l if t-curve slope f o r damping com- ponent of aerodynamic force due to wing vibration,
\
m , per radian s2
generalized normal-force coeff ic ient f o r first-mode N1 @l
vibration, -
frequency, cps
natural frequency of f irst symmetrical w i n g mode, cps
anplitude of force exciting vibration, l b
dimensionless s t ructural fac tor , 2 ; f J E ~ s t ruc tura l damping factor
constant relating the damping component of loca l pressure d i f f e ren t i a l due t o w i n g vibration t o loca l angle of attack ( in radians) and free-stream dynamic pressure
physical factor , y \IF%, ft2-lb1/'
generalized damping constant f o r first-mode w i n g vibra- lb-sec
f t t ion,
mass, slugs
.......... ....................... 0 . 0 . 0 . . . .... . . . . . . . . . . . . . . . . . . . . . . . ...... 0 . 0 . 0 . . . . . ........ ......................... . . . . . . .
4
d Y )
mm M
M,
n
N1
9
R
rn
S
......................... 0 . 0 . . . . . . . . . 0 . 0 . . . . . . . . . . . . . . . . . . . . . . . . . ...... 0 . 0 . . . . .... . . . . .......... .... * . & ~ ~ J ~ ~ * : ..... ..*NACA mi ~ 5 7 ~ 1 3
. .
wing mass per u n i t span, s lugs / f t
mass of an element of the wing, slugs
f r ee -stream Mach number
diagonal i n e r t i a matrix f o r wing, made up of the
effect ive moment ( for first-mode vibrat ion) of mass out-
elements mm
board of point y (Y - Yg)m(Y)wl(Y)dY, s lug-f t
generalized w i n g mass f o r nth-mode vibration, PI2
m(Y )wn2 (Y 1 dY, slugs m J-bb
integer denoting wing vibration mode
time-dependent generalized ( f o r first-mode vibrat ion) buffet force acting on wing, Apmsm'p, (l), l b
m
column matrix representing a s e t of s t a t i c loads applied t o w i n g
local pressure difference (between bottom and top surfaces of wing) that excites the buffet vibration
free-stream dynamic pressure, lb/sq f t
Reynolds number based on mean aerodynamic chord of 12.96 in .
time-dependent displacement of w i n g element fo r which ,(n) = 1
wing area, sq f t
....................... .......... . . . . . . ..e. . . . a 0 . 0 . . . . . . . . . . . . . . . . . . . . . . . . . . . . . . 0 . 0 . 0 . . . . . . . . ......................... ......
S1 weighted wing area for first-mode bending, Pb /2
s2 weighted w i n g area for first-mode bending,
c(Y)w,2(Y)ay, sq ft
area of mth element of w i n g , sq f t sm t i m e , sec t
kinet ic energy of vibrating system, lb-f t
dynamic m a t r i x fo r w i n g , [A] [MI
free-stream velocity, f t /sec
T
v deflection of wing e las t ic axis i n nth wing bending
mode, normalized t o unit deflection a t the wing t i p
spanwise distance from fuselage center l ine , f t
spanwise distance from fuselage center l i ne t o strain-gage. location, f t
ver t ica l displacement z
time-dependent displacement of the mth w i n g element, f t %I
U
P
7
angle of attack, deg o r radians
phase angle by w h i c h displacement lags the force
aerodynamic m i n g r a t i o based on c r i t i c a l damping,
a i r density P
root-mean-square value Q
normalized deflection of mth w i n g element f o r wing vibra- t ion i n the nth normal mode
CONFIDENTIAL
6
0
w
cun CDr
R
"r
......................... . . . . . . . 0 . . . . . . . . . . . . . . . . . 0 . . . . ...... .
~ 0 . w . . ........ 0 . 0 . .... .............. =*=c*mmNymQ: .... : : .... m C A RM L57m3 ,
power spectra: density
c i rcu lar frequency, &f, radians/sec
undamped natural c i r cu la r frequency f o r nth mode
resonant frequency
frequency r a t io , w/'yl
resonant frequency r a t io , %/%
frequency r a t i o a t half-power point %/e
nn difference between frequency r a t i o a t half-power point above Rr and frequency r a t i o a t half-power point below Rr
Subscripts :
M buffet bending moment
n nth natural mode, where n i s any integer
r a t resonance
Dots over symbols denote derivatives with respect t o t i m e .
APPARATUS AND TESTS
Tunnel
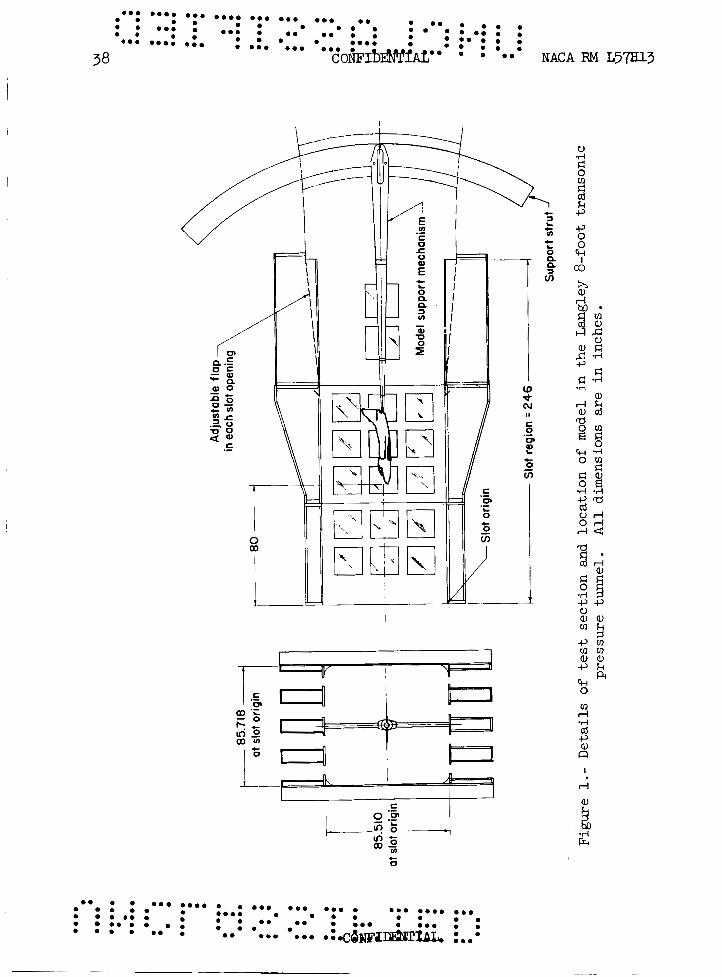
The investigation w a s conducted i n the Langley 8-foot transonic pressure tunnel which is a single-return tunnel with a rectangular s l o t t e d t e s t section ( f ig . 1) capable of permitting continuous operation through the transonic speed range a t stagnation pressures from 1/4 t o 1 atmosphere. Automatic temperature controls maintained a constant and uniform stagnation temperature of 120° F during the t e s t s . the dew point w a s maintained a t 0' F or lower.
I n order t o prevent condensation,
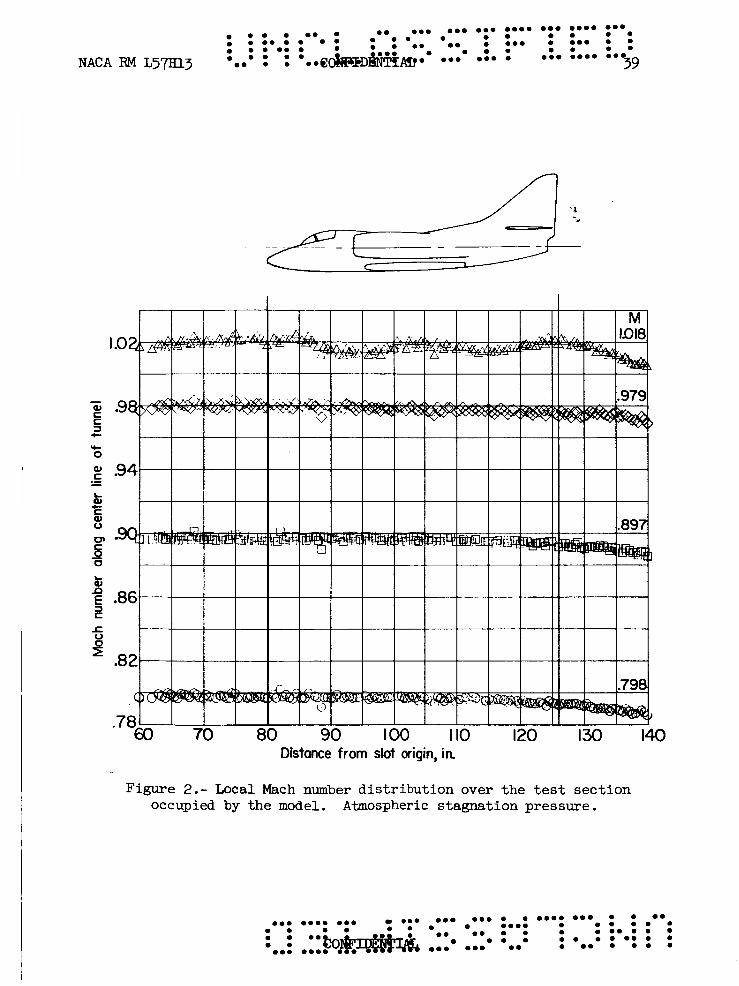
Local Mach number distributions over the test-section length occupied by the model are shown i n f igure 2. These dis t r ibu t ions were obtained a t a stagnation pressure of 1 atmosphere from a multiorifice ax ia l survey tube on the tunnel center l i n e . Changes i n stagnation pressure have e s sen t i a l ly
COIEIDENTIAL ....................... .......... . . . . . . .... . 0 . . 0 . 0 . ...... . . . . . . . . . . . . . . . . . ........ . . . . 0 . w . e . . . . . . . . .........................
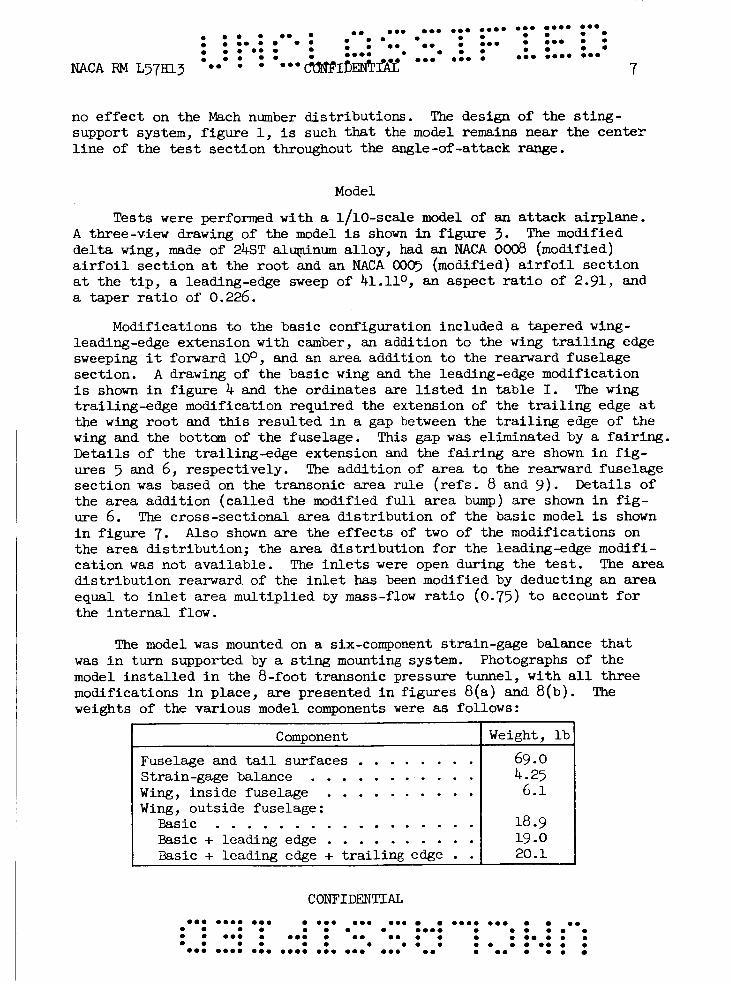
no ef fec t on the Mach number distributions. support system, figure 1, is such that the model remains near the center l i n e of the test section throughout the angle-of-attack range.
The design of the s t ing-
Model
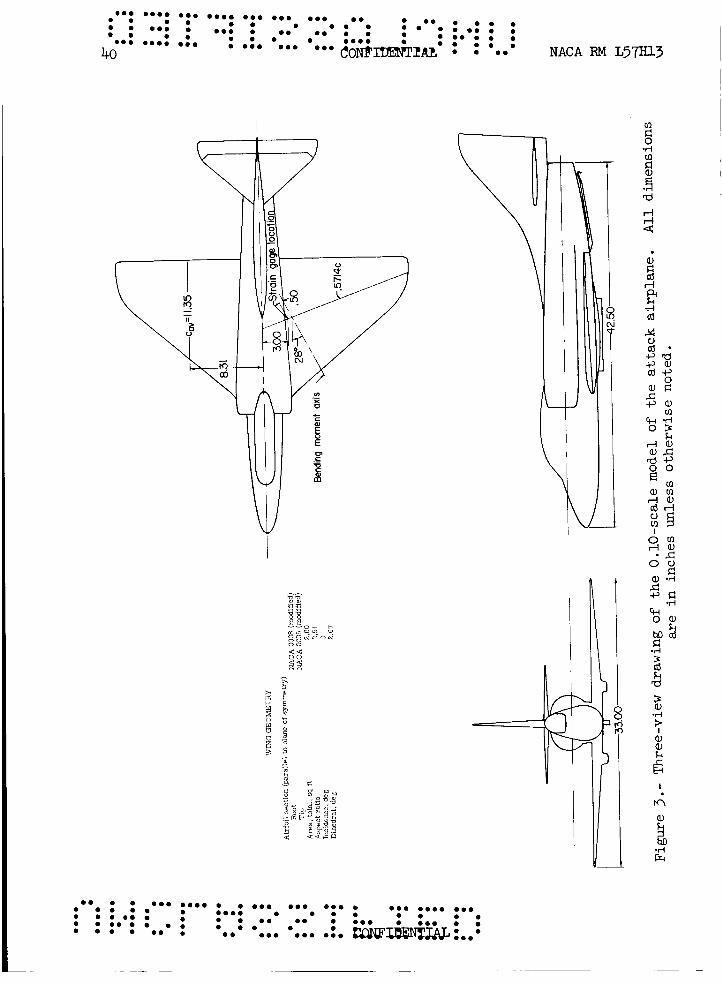
T e s t s were performed with a l/l0-scale model of an attack airplane. A three-view drawing of the model i s shown i n figure 3. de l ta wing, made of 24ST alLqninum alloy, had an NACA 0008 (modified) a i r f o i l section a t the root and an NACA 0005 (modified) a i r f o i l section a t the t i p , a leading-edge sweep of 41.110, an aspect r a t i o of 2.91, and a taper r a t i o of 0.226.
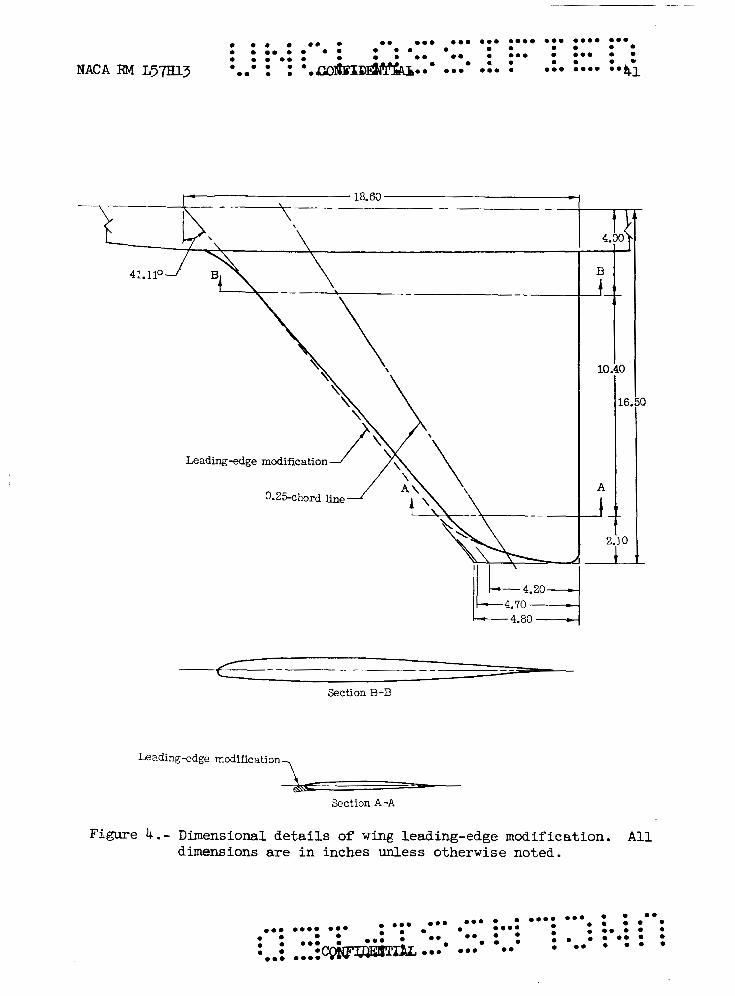
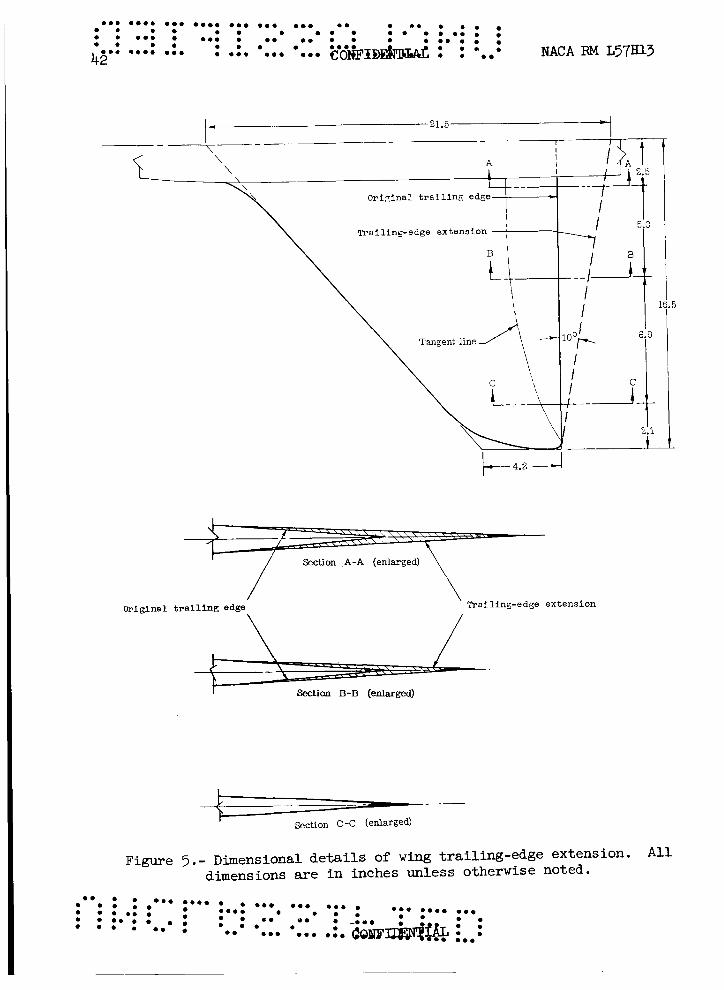
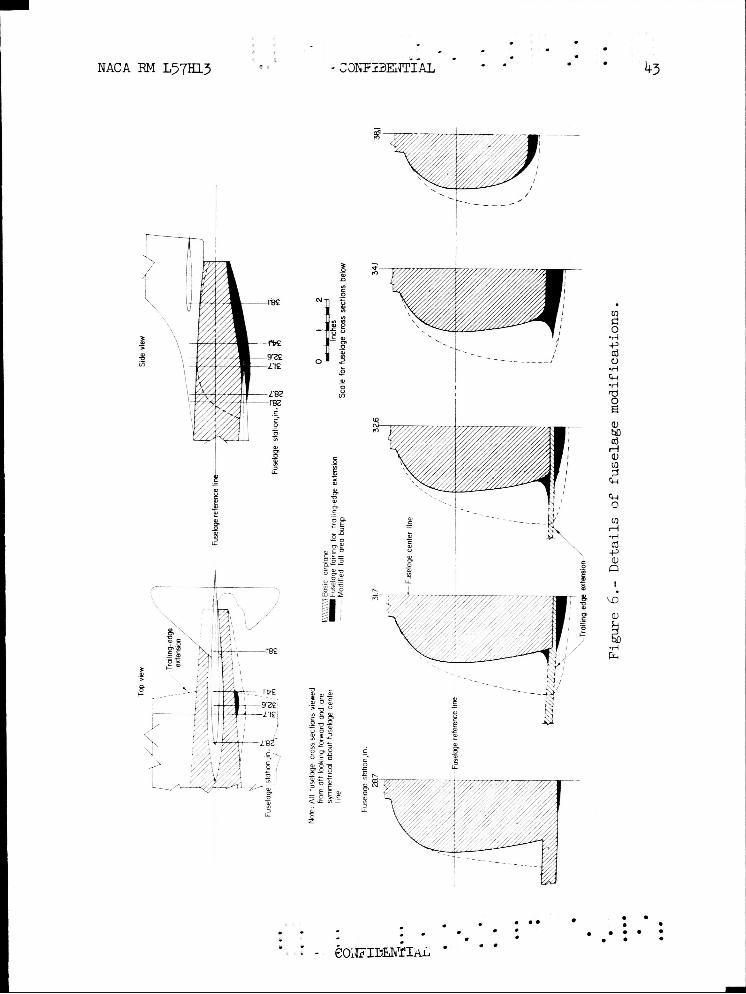
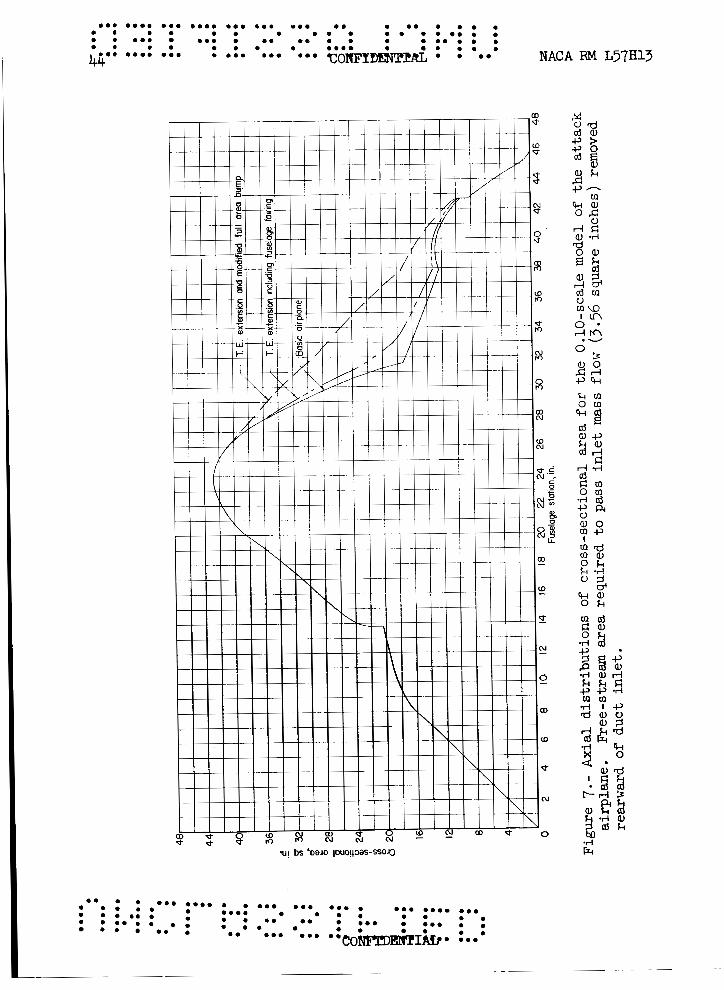
Modifications t o the basic configuration included a tapered wing- leading-edge extension with camber, an addition t o the w i n g t r a i l i n g edge sweeping it forward loo, and an area addition t o the rearward fuselage section. i s shown i n figure 4 and the ordinates are l i s t e d i n table I. trailing-edge modification required the extension of the t r a i l i n g edge a t the w i n g root and this resulted i n a gap between the t r a i l i n g edge of the wing and the bottom of the fuselage. Details of the trailing-edge extension and the fa i r ing are shown i n f ig - ures 5 and 6, respectively. section w a s based on the transonic area rule ( re fs . 8 and 9) . Details of the area addition (cal led the modified fu l l area bump) are shown i n f ig - ure 6. The cross-sectional area dis t r ibut ion of the basic model is shown i n figure 7. the area distribution; the area distribution fo r the leading-edge modifi- cation was not available. The inlets were open during the t e s t . "he area dis t r ibut ion rearward of the i n l e t has been modified by deducting an area equal t o i n l e t area multiplied by mass-flow r a t i o (0.75) t o account f o r the in te rna l flow.
"he modified
A drawing of the basic wing and the leading-edge modification The w i n g
This gap w a s eliminated by a fairing.
The addition of area t o the rearward fuselage
A l s o shown are the e f fec ts of two of the modifications on
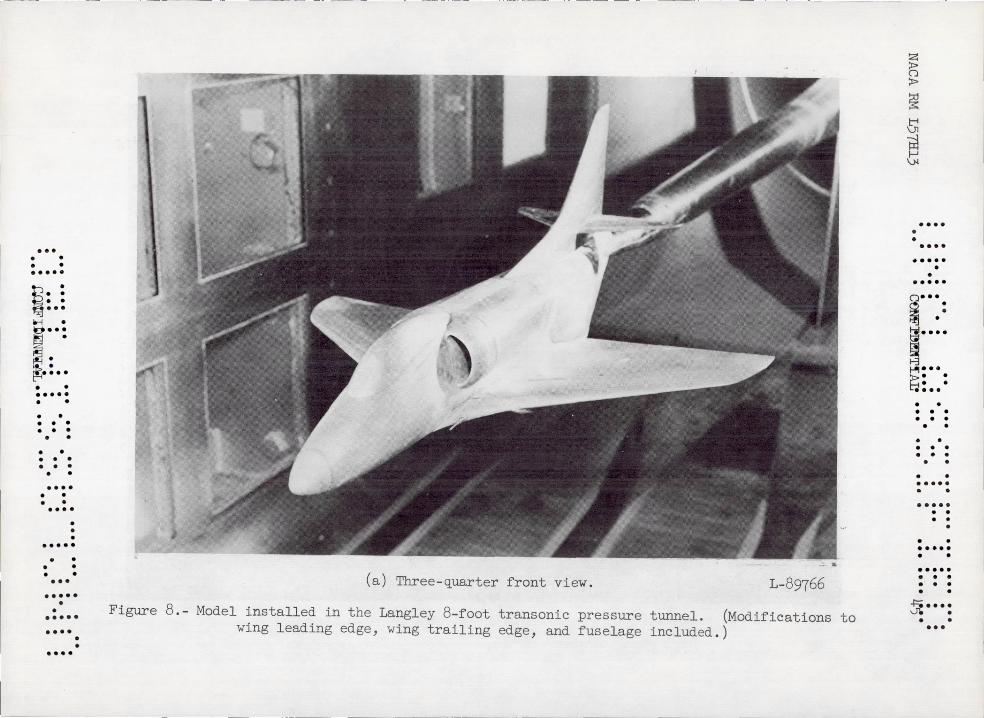
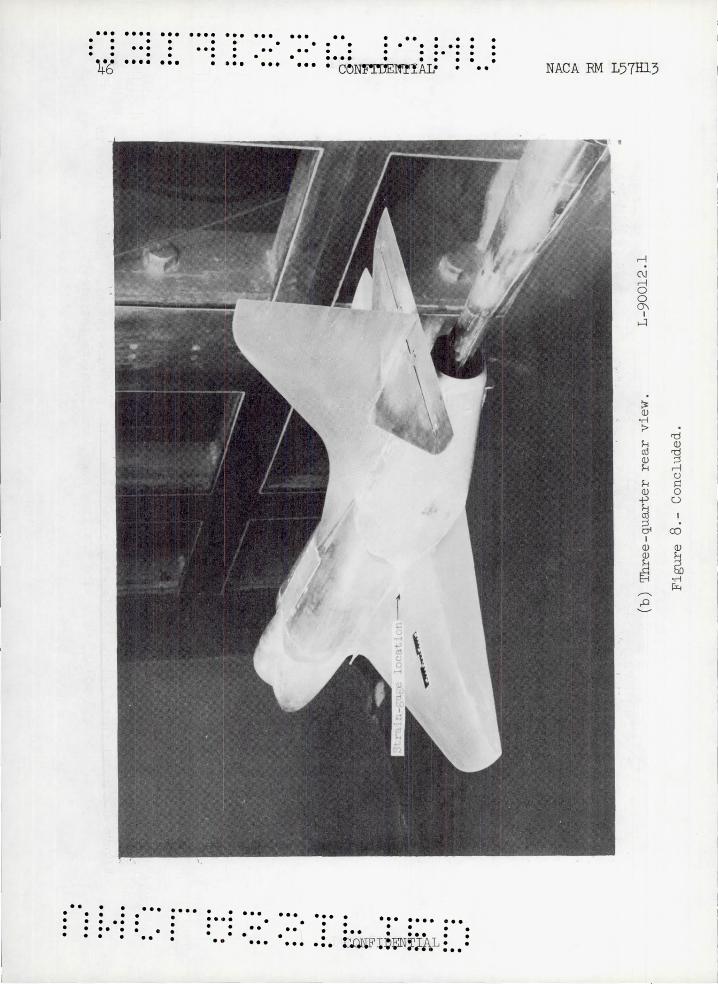
The model w a s mounted on a six-component strain-gage balance tha t w a s i n turn supported by a sting mounting system. model ins ta l led i n the 8-foot transonic pressure tunnel, with a l l three modifications i n place, are presented i n figures 8(a) and 8 (b ) . weights of the various model components were as follows:
Photographs of the
The
Component
Fuselage and t a i l surfaces . . . . . . . . Strain-gage balance . . . . . . . . . . . W i n g , inside fuselage . . . . . . . . . . Wing, outside fuselage :
Basic . . . . . . . . . . . . . . . . . Basic + leading edge . . . . . . . . . . Basic + leading edge + t r a i l i ng edge . .
CONFIDENTIAL
18.9 19.0 20.1
.......... orno e.. ..a .... e.. 0 . 0 . 0 . 0 . . . ..a. . 0 . 0 . . ................ . .e..* . 0 . 0 . 0 . . 0 . . ........ ......................... . .* . 0 .
. ......................... . . . . . . . 0 . 0 . . . . ........ . . . . . . . . . . . . . . . . ...... ....... c;sIb*fl&. ....... 0 . . . . .... .. 0 . . .......... 0 . 0 . 0 . .
NACA RM L57a3 8
Mode
Rigid-body ve r t i ca l t rans la t ion (on s t ing ) . . Rigid-body pitching . . . . . . . . . . . . . Rigid-body ro l l i ng . . . . . . . . . . . . . . Fi r s t wing mode . . . . . . . . . . . . . . . Second wing mode . . . . . . . . . . . . . . . Third wing mode . . . . . . . . . . . . . . .
Natural frequency, cps
7 14 1 22- 4
184 240 388
In connection with the type of buffet analysis t h a t i s used. i n ref- erence 6, cer ta in constants are reqilired. have the following values based on the mode shape used i n reference 6:
For t h i s model, these constants
FS dimensionless s t ruc tu ra l fac tor , 0.052
kS physical fac tor , 2,197 ft2-1b1l2
Instrumentation
The model l i f t w a s determined from the normal force and chord force indicated by a six-component e l e c t r i c a l strain-gage balance t h a t w a s mounted within the model. of the basic wing, 2.60 square f e e t . calibrations of the balance and repea tab i l i ty of data, the l i f t coef f i - cient is estimated t o be acc7urate within kO.007 f o r data taken a t a stagnation pressure of 0.80 atmosphere and 50.017 f o r data taken a t a stagnation pressure of 0.33 atmosphere.
The l i f t coefficients are based on the area Through consideration of the s t a t i c
Angle of a t tack w a s determined with a pendulum-type strain-gage uni t located i n the model support s t r u t . ljalance deflections under load. The e s t i r a t e d accuracy of the angle of attack i s 0. lo.
Corrections were made f o r s t i ng and
A bending-momect strain-gage bridge w a s mounted i n a recess a t the 57.14-percent-chord location near the root of the l e f t wing as shown i n f i g u r e s 3 and 8 ( b ) . Analysis of s t a t i c load calibrations showed t h a t
CONFIDENTIAL 0. ..a. ..e e.. e.. .......... . . . . . . .... . . . . 0 . 0 . ...... . . . . . . . . . . . . . . . . . ........ . 0 . . 0 . 0 . 0 . . . . . . . . .........................
t h i s bridge measured pure bending moment about an axis tha t in te rsec ts the longitudinal ax is of the model a t an angle of 28O. noment a x i s i s shown i n figure 3 .
The bending-
D-wing the tests, the output of the bending-moment gage w a s recorded on magnetic tape. each tes t point. The power spectral density was determined from the tape record by m e a n s of the equipment and procedure described i n reference 10. The f i l t e r band width used i n the a n a l y s i s varied from 30 cps, f o r a broad picture of the overall spectrum, t o 1L cps f o r detailed study of the spec-
4 trum i n the v ic in i ty of the natural frequency of the first mode of the wing.
A record of about 45 seconds i n duration w a s taken a t
Tests
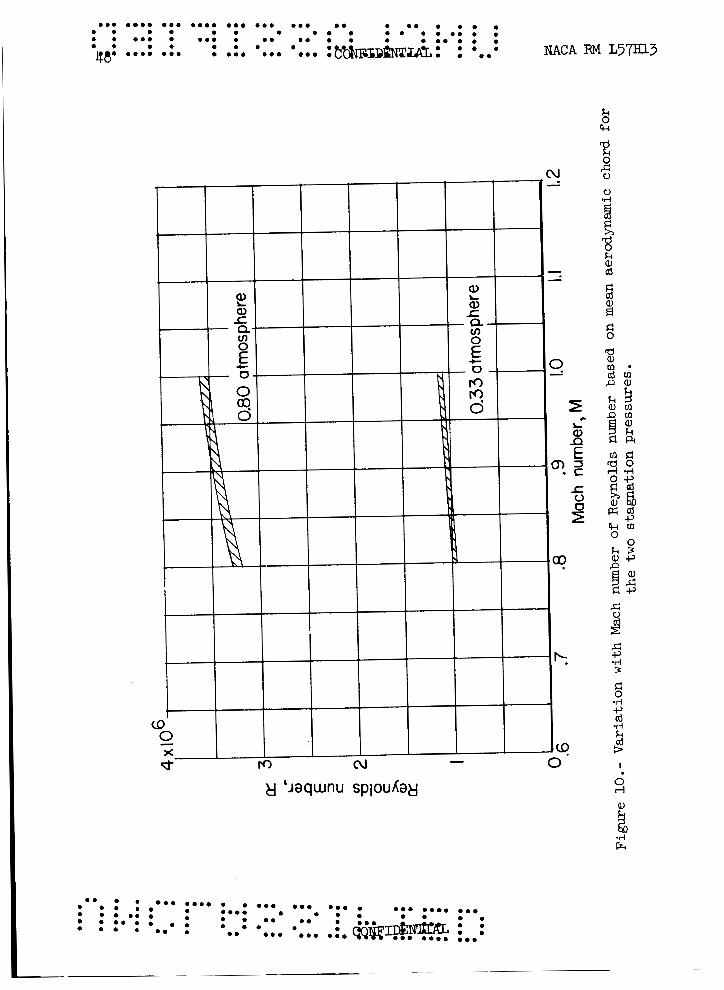
Buffet t e s t s were made a t Mach numbers from 0.80 t o 1.00, with an angle-of-attack range of approximately -4O t o go. were tes ted a t a tunnel stagnation pressure of 0.80 atmosphere. force limits prevented tes t ing a t higher pressure.) the e f f ec t of density on the magnitude of the b u f f e t bending moment, the basic configuration w a s a l so tes ted a t a much lower stagnation pressure, 0.33 atmosphere. The Reynolds number ranges f o r the two stagnation pres- sures are shown i n figure 10.
All configurations (Balance
In order t o determine
RESULTS AND DISCUSSION
The discussion s t a r t s with an examination of the frequency spectrum of the wing bending moment i n order t o learn which vibration modes a re evident and which are s ignif icant . The e f f ec t of a i r density on the root- mean-square tending moment i s then shown, and is followed by an extensive examination of the system damping coefficients. The resu l t s of t h i s p a r t of the analysis determined the process that w a s used t o reduce the buf fe t data. The next section covers the buffet input force and the e f fec t of the modifications on t h i s force. The discussion closes with coments regarding the prediction of f l i g h t buffet loads from wind-tunnel t e s t s .
Frequency Spectrum of Iknding Moment
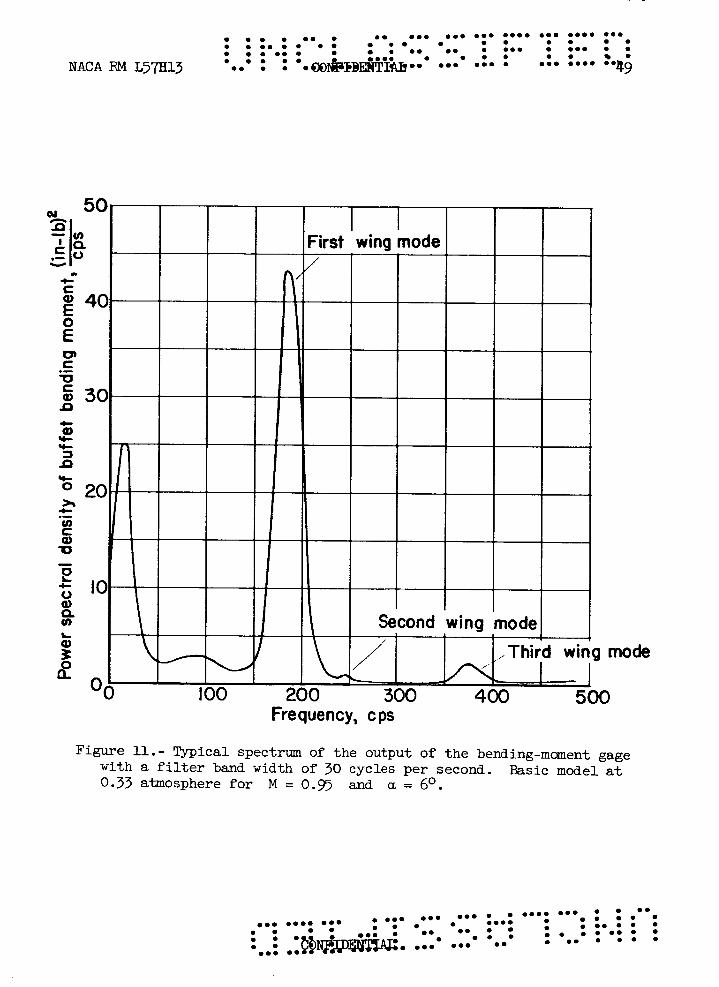
The power spectral density of the output of the bending-moment gage, as determined by e l ec t r i ca l analysis with a f i l t e r band width of 30 cps, i s p lo t ted i n figure 11 fo r a typical buffet condition. These re su l t s are f o r a l i f t coefficient beyond the buffet boundary a t a Mach number
CONFIDENTIAL
0.0 0.00 0.0 0 0.0 0.0 0.0 0 0 . 0 0 0 0 . 0 0 0 0 0 . 0 . 0 . 0 0 0.00 0 0 0 0 . 0 0 0 moo 0 0 0 0 0 0 0 . 0 0 . , 0 0 0 0 0 . 0 . 0 . 0 0 0 0 0 0 0 0 . 0 0 0
0.0 0.00 0.. o... 0.0 0.0 0.0 0 0 0 0 0 0 0 0 0
. ......................... . . . . . . . . . . . . . . . . . . . . . . . . . . ...... 0 . .... . . . . 0 . 0 . 0 . . 0 .
0 . ........ .......... .... * y o ~ ~ f f i ~ T ~ ~ ~ - i ..... ..hAcA m ~ 5 7 ~ 1 3 10
of 0.95. t r a t i o n of energy i n a few narrow frequency bands. that f o r the purposes of analysis the model and supporting structure could be regarded as a system with only a few degrees of freedom.
The most s t r iking feature of t h i s spectrum i s the high concen- The indication is
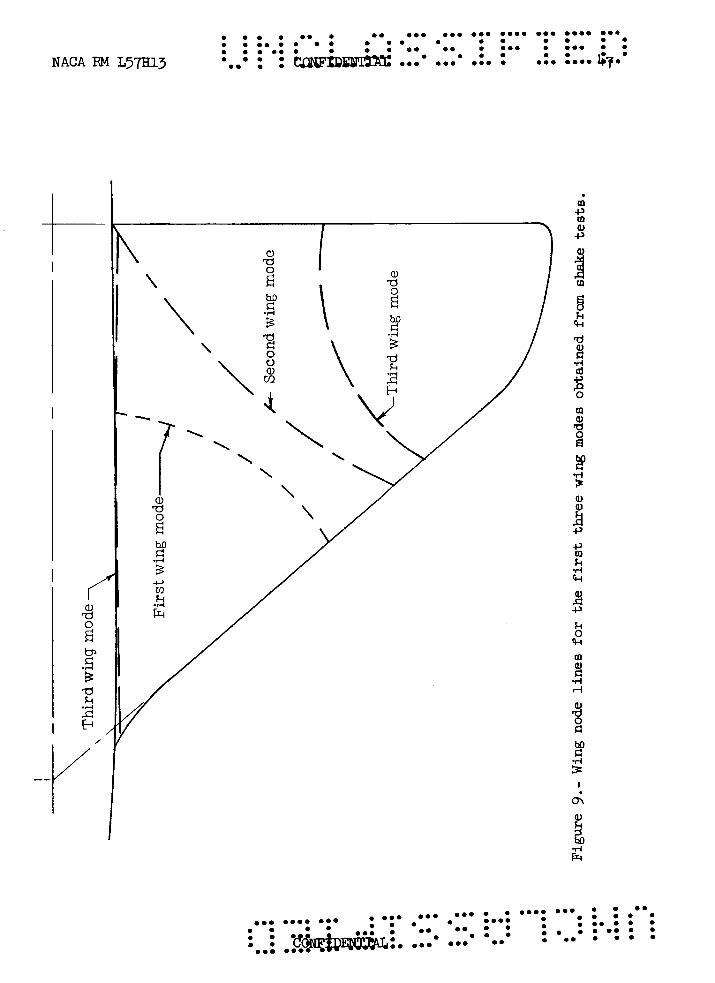
Influence of support f l e x i b i l i t y . - The low-frequency peak shown i n figure 11 was found t o be present throughout the investigation. The shake t e s t s show the presence of three well-defined low-frequency modes t h a t are connected with the f l e x i b i l i t y of the s t ing and the strain-gage balance. In order t o determine which of these modes was responsible f o r the observed low-frequency response, the data f o r several test points were analyzed w i t h a 3-cps band width f i l t e r . Samples of these analyses are shown i n figure 12. Figure 12(a) shows data obtained a t a = Oo a t a Mach number of 0.95. Peaks are observed a t frequencies tha t correspond approximately t o the natural frequencies of ver t ical t ranslat ion and roll ing, respectively. The ver t ica l t ranslat ion response predominates. Figure 12(b) shows similar resu l t s obtained during buffet (a = bo) . the change i n scale. The same two modes are present, but i n t h i s case the rol l ing response predominates. These resu l t s indicate tha t the buffet excitation contains sizable antisymmetrical components even a t low f r e - quencies. The spectral-density values i n figure 12(b) are much higher than those i n figure 11 because of the increase i n tunnel pressure and the decrease i n f i l t e r band width.
Note
Because support f l e x i b i l i t y i s a fac tor that i s not present i n f l i g h t , it i s desirable t o eliminate the e f fec ts of the low-frequency response i n the analysis of the wind-tunnel data. F i r s t , there is the d i rec t contribution of the low-frequency response t o the wing stress. garding the low-frequency p a r t of the power spectrum i n the analysis and i n the discussion that follows. Second, there i s the poss ib i l i ty t h a t the low-frequency motion of the w i n g might change the flow over the wing i n such a manner that the buffet exci ta t ion a t higher frequencies would be affected. This effect is assumed t o be negligible. In this connection, a previous investigation (ref. 11) showed that osc i l la t ing an a i r f o i l a t one frequency had negligible effect on the random air forces due t o turbu- lence and buffeting a t higher frequencies under the conditions of t ha t experiment.
Two ef fec ts must be considered.
This contribution w i l l be eliminated simply by disre-
In buffet testing, it is highly desirable t o have the support roll frequency far removed from the first w i n g bending frequency. condition cannot be satisfied, it i s necessary t o take steps t o remove the roll response from the output by other m e a n s , as f o r instance by combining l e f t - and right-wing gage outputs i n such a way as t o cancel the antisymnetrical outputs.
If this
Wing modes.- In addition t o the low-frequency peak i n the spectrum shown i n figure 11, which is to be neglected, there a re several other
CONF IDESTIAL ....................... .......... . 0 . 0 . . .... . . . . 0 . 0 . ...... . . . . . . . . . . . . . . . . . ........ . 0 . . 0 . 0 . 0 . . 0 . . 0 . . .........................
peaks. bending frequency. Smaller peaks are shown a t frequencies corresponding t o the natural frequencies of the second and t h i r d w i n g modes. The first mode obviously dominates the response of the w i n g i n buffet . This r e su l t i s i n agreement with ful l -scale f l i g h t data ( refs . 5 and 7) that show the predominant influence of the first mode fo r wings of various plan forms, including a a- percent-thick 60° triangular wing (ref. 7 ) .
Most prominent i s the peak i n the v ic in i ty of the wing first
2
Because the power i n the second and t h i r d wing modes i s small com- pared with that i n the first mode, a study of the large peak by i tself should provide a good indication of the buffet character is t ics of the w i n g . I n the remainder of this paper, therefore, only the first-mode response of the wing is considered. The root-mean-square bending moments t h a t are presented w e r e determined by integration of the spectrum between limits of l5O and 210 cps.
Effect of Density on Root-Mean-Square Bending Moment
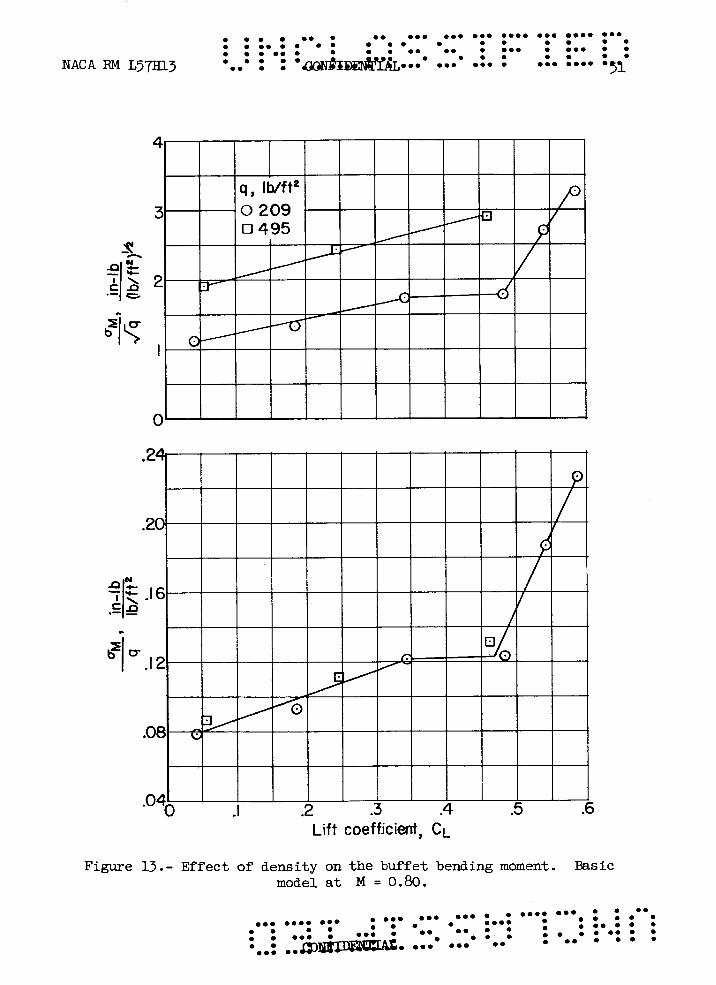
A change i n the air density affects the magnitudes of both the force tha t excites the bidfet v i b r a t i m and the aerodynamic damping due t o the motion of the wing. a l t i tude have shown (refs. 6 and 7 ) tha t the net result is that the root- mean-square buffet stress i s approximately proportional t o the square root of the dynamic pressure. In these f l i g h t s a t constant Mach number, the velocity variation was much smaller than the density variation. Therefore, the resu l t s indicate t h a t the bending stress is proportional t o the square root of the density. Analytically, t h i s r e s u l t would be expected i f the danping were predominantly aerodynamic, as w a s assumed i n reference 7. In order t o determine the e f f ec t of density on the buf- f e t s t resses of the wind-tunnel model, the basic configuration was tes ted a t two different values of tunnel stagnation pressure. The resu l t s , f o r a Mach number of 0.80, are shown i n figure 13 where the r a t io s w/q and oMILfi a re plotted as functions of t ion pressures are identical; hence, q varies only because p varies . The resu l t s shown i n figure 13 indicate, therefore, that the root-mean- square bending moment i s more nearly proportional t o p than t o 6. Thus, the e f fec t of a i r density on the buffet in tens i ty i s different fo r t h i s Eodel than fo r airplanes f o r which f l i g h t data are available. A s a r e su l t , the equation presented i n reference 7 (essent ia l ly , eq. (Blk 1 ;;ith g = 0) cannot logically be used as a basis fo r the reduction and Xnaljisis of these data, nor can it be used t o predict f l i g h t b d f e t loads from the &ita fo r t h i s model. One of the basic assumptions mdcrlyin& t h i s t j iffet equstion apparently has been violated i n t h i s t e s t .
Flight tests at a constant Mach number and varying
CL. The veloci t ies a t the two stagna-
CONFIDENTIAL
0.0 00.0 0.0 0 0.0 0.0 0.0 0 0 0 .00 0 0 0 0 0 0 0 0 . 0 . 0 . 0 0 0.0 0 0 0 0 0 . 0 0 0 0.0 0 0 0 0 0 0 0 0. 0 0 0 0 . 0 0 . 0 0 . 0 . 0 . 0 0 0 0 0 . 0 0 . 0 0 0
0.0 0.00 0.0 0.00 0.0 0.0 0.a 0 0 0 0 . 0 0 . 0
. ......................... 0 . . . . . . . . . 0 . 0 . 0 . ........ . . . . . . . . . . . . . . . . . . . ...... . . . .... .. 0 . . .......... 0 . .... 0 .
. . .COl .~~D~&ff . . ..... NACA RM L57m3 12
After observation of the preceding resu l t s , it w a s obvious t h a t a new technique for data reduction w a s required. Before such a technique could be developed, however, it was necessary t o determine the reason fo r the observed difference between f l i g h t and model resu l t s i n the effect of density on the bending moment due t o buffet . A study of the system damping coefficients proved most informative, and the r e su l t s of t h i s study are presented i n some d e t a i l i n the following section. The reader who i s interested only i n the buffet resu l t s of the present investigation may f ind them by turning t o the section en t i t l ed "Buffet Input Force. I t
System Damping Coefficients
Determination of damping coefficients.- I n the case of forced vibra- t ion of a single-degree-of-freedom l inear system, it i s possible t o infer the value of the system damping from the shape of the response curve of the system. Two independent methods are available fo r t h i s purpose and they are derived i n appendix A. ship between the mean-square response and the peak response:
One method makes use of the relat ion-
where zo2 is the mean-square response and @ (Q,) i s the peak response
of the system. width a t the half-power points and the frequency of resonance:
zO
The other method uses the relationship between the band
y + E = - M 1 2 2
where aR power points. which the spec t ra l density is exactly one-half as high as the spec t ra l density a t resonance (peak response). equation (Al2) and equation (Al5) in appendix A. investigation, the measured quantity were the w i n g bending moment, would be inser ted i n equation (1) f o r the mean-square response and would be inserted fo r the peak response.
i s the difference between the frequency ra t ios a t the two half- The half-power points are those points on the spectrum a t
These two equations are given as
aM2 %(sir)
If, i n an experimental
Two assumptions a re required t o ju s t i fy the use of these relat ion- The f i r s t i s the assumption that ships i n the analysis of buffet data.
CONFIDENTIAL ....................... .......... . 0 . 0 . . .... . 0 . . 0 . 0 . ...... . . . . . . . . . . . . . . . . . ........ . 0 . . 0 . 0 . 0 . . 0 . . 0 . . .........................
the wing behaves l i k e a single-degree-of-freedom system i n the v ic in i ty of the natural frequency of the first symetr ica l mode. assumption i s that the system input is independent of the frequency i n the range where the output is significant. t h i s frequency range is so narrow that the assumption w i l l be substan- t i a l l y s a t i s f i e d by any reasonably smooth input spectrum, and therefore, the asumption seems reasonable.
The second
For the buffeting model,
I n e i the r of the two methods f o r obtaining the damping coefficient, it i s e s sen t i a l that the band width of the f i l t e r that i s used t o obtain the spectrum be considerably l e s s than the band width of the system being studied. f igure 11 i s much too large and, i n fact, it proved necessary t o use the smallest available filter band width, about l1 cps, t o obtain the damping
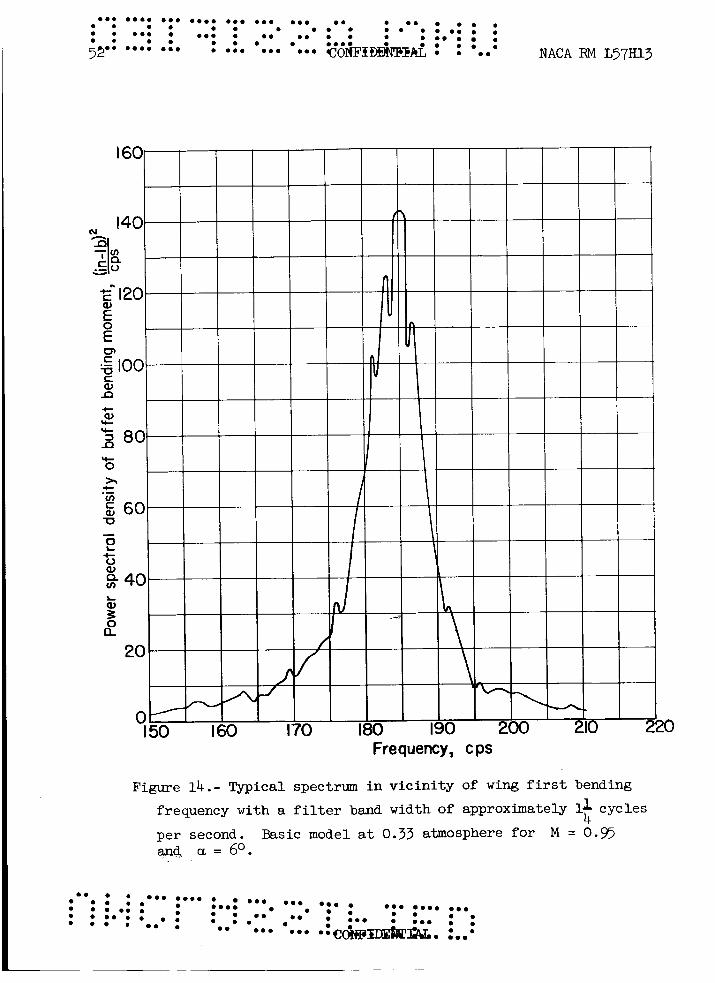
coefficients f o r this w i n g . width analysis i s presented i n figure 14. 'Ihis spectrum w a s obtained from the same data as the spectrum shown i n figure 11. Caparison of figures 11 and 14 shows that the wider band f i l t e r gives a peak value that is f a r too low and a spectrum band width that is far too w i d e .
The 30-cps band width used t o obtain the spectrum shown i n
6 A typical spectrum obtained by narrow-band-
There are cer ta in s t a t i s t i c a l problems encountered i n making a narrow-band analysis of the type shown i n figure 14. For a fixed length of record ( i n this case a 30-second loop of tape w a s analyzed), the con- fidence that can be placed i n the value obtained f o r any given point on the spectrum w i l l decrease as the f i l ter band width decreases. Roughly speaking, the problem is that as the filter band width is decreased, a point is reached eventually where the mean value i n the 30-second t i m e in te rva l f o r this t iny segment of the frequency range may d i f f e r consid- erably from the long-time mean value for this segment. The presence of such er rors i s indicated by sharp e r r a t i c dips and peaks i n the frequency spectrum, some of which a re evident i n f igu re 14.
The effect of these errors on the accuracy of a damping-coefficient determination must be considered. One method f o r determining the damping coefficient i s based on measurements of the peak response and the mean- square response (eq. (1)). Only the peak response i s affected by the e r ror under consideration. The other method requires the determination of the band width a t the half -power points (eq. (2) ) . cient, as determined by this method, is affected by errors a t the half- power points and the peak. In the f irst method, it was necessary t o modify the constant i n equation (1) t o account f o r the fact that the mean-square values were obtained by integrating only from 150 t o 210 cps ra ther than from 0 t o a, cps. T h i s modification was accomplished by multiplying 1/,1 by the r a t i o of the par t of equation (AlOb) i n brackets t o equation ( A l O a ) . These eqirstions are fo r y = 0. The assumption of y = 0 f o r the deter- mination of this r a t i o causes negligible error, because the damping f o r
The damping coeffi-
Both methods were used i n the present analysis. l / f i
CONFIDEfJTIAL .......... ....................... 0 . 0 . . . . . .... . 0 . 0 . . . . . . . . . . . . . . . . . . ...... 0 . 0 . 0 . . 0 . . ........ . . 0 . . 0 . . .........................
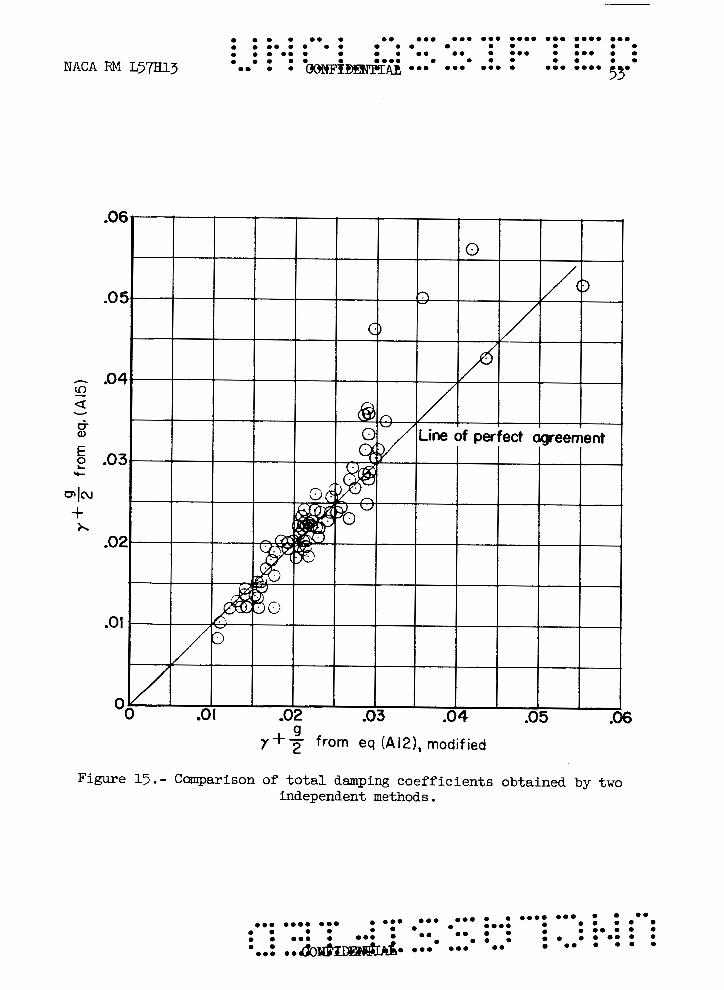
these t e s t s was mostly s t ructural , and i t great ly f a c i l i t a t e s the ca l - culation. was solved graphically. curves had t o be smoothed i n some instances i n order t o obtain a single- valued answer f o r the band width. The damping constants obtained by the f i r s t method have been plotted against those obtained by the second method i n f i g u r e 15. The sca t te r is small except a t the high damping values tha t were measured under nonbuffet ( low-l i f t ) test conditions. Thus, the s t a - t i s t i c a l errors t ha t are inherent i n figure 14 do not in te r fe re seriously with the determination of the system damping.
The modified equation tha t was obtained by t h i s manipulation I n the second method (eq. 2 ) , the response
Figure 15 also permits a test of the assmption regarding the single- degree-of-freedom behavior of the buffeting wing. (2) are equated, the r e su l t i s a relationship tha t connects the band w i d t h , the peak response, and the .man-square response. If the output of the buffeting wing does - not s a t i s fy this relationship, then the assumption tha t the buffeting wing behaves l i ke a l inear , single-degree-of-freedom system with constant-spectral-density input i s incorrect. The f a c t that the average of the data i n figure 15 f a l l s almost on the l ine of perfect agreement proves, however, that the experimental output does sa t i s fy t h i s relationship. The agreement i s necessary, but not suff ic ient , t o prove that the assumption is correct.
If equations (1) and
Effect of density.- In figure 16, damping coefficients are plot ted as a function of
values of tunnel density. are given i n the figure.
t o decrease s l igh t ly the t o t a l system damping. posed of two par t s - aerodynamic damping and s t ruc tura l damping. Aero- dynamic damping increases with increasing density; yet , i n t h i s experi- ment the t o t a l damping w a s found t o decrease. damping i n th i s experiment i s apparently much smaller than the s t ruc tura l damping.
CL f o r t e s t s of the same configuration a t two different
The corresponding values of dynamic pressure The e f f ec t of a 2--fold increase i n density i s
The t o t a l damping i s com-
1 2
Hence, the aerodynamic
Effect of l i f t . - Both se t s of data i n figure 16 show a large decrease Because the aerodynamic damping i s appar- i n damping with increasing CL.
ently small, the origin of the damping variation with i n the mechanical system of the model and supporting structure.
CL must be sought
I n t h i s connection, it w a s observed that the damping a t low values of CL
wing. search of a possible source of s l id ing f r i c t ion . appears t o be the dovetail jo in t by which the wing w a s attached t o the fuselage.
is considerably higher than would be expected fo r a so l id aluminum This observation led t o a careful examination of the model i n
The most l i ke ly source
The supposition i s that a t low l i f t the jo in t i s suf f ic ien t ly
CONFIDENTIAL ....................... .......... . . . . . . .... . ...... . . . . . . . . . . . . . . . . . ........ . 0 . . 0 . a . 0 . . 0 . . 0 . . ......................... a * . 0 . 0 .
......................... ..... 0 . . 0 . 0 . . 0 . 0 . ................. . . . . . . . . . . . . . 0 . . 0. . ................ 0 . 0 . 0 . ....... NACA FM L57a3 .... , . . b m m 15
loose so that a bending vibration of the w i n g causes a s l i g h t re la t ive movement between the wing and fuselage portions of the jo in t and that the damping i s increased by the energy dissipation due t o f r i c t i o n i n this jo in t . A t high l i f t , the steady forces are supposed t o result i n a tightening of t h i s j o in t w i t h a resultant decrease i n the re la t ive movement due t o vibration and, therefore, i n the damping. case, there should be a better correlation between the actual l i f t and the damping than between CL and the damping.
If this is the
I n order t o t e s t this supposition, two additional p lo ts were made. For the first p lo t , the damping coefficients f o r the basic configuration that were determined w i t h 0 < CL < 0.15 were averaged w i t h the use of data a t a l l Mach numbers. Similar averages w e r e formed f o r other i n t e r - vals of 0.15 i n CL. treated separately. The results a re shown plot ted against CL i n fig-
ure l7(a). resulted i n a decrease i n damping.
The data a t the two different tunnel pressures were
As w a s the case a t M = 0.80, the increase i n tunnel pressure
For the second plot , a similar averaging procedure w a s used, with l i f t in te rva ls of 100 pounds f o r the low-pressure data and 250 pounds f o r the high-pressure data. i n figure l7(b) . and the l i f t than between the damping and
i s i n accord w i t h the supposed action o f t h e wing-fuselage jo in t .
The results are shown p lo t ted against lift There is a much better correlation between the damping
This experimental result CL.
As a result of this investigation, it has become apparent that care should be exercised i n the design of buffet models to minimize the s t ruc- tural damping and t o eliminate any variation of the s t ruc tura l damping during wind-tunnel tests.
B u f f e t Input Force
Determination of input force. - The fac t that the damping varied considerably during the test means that the w i n g bending moment is not a d i rec t measure of the magnitude of the buffet forces that excite the w i n g vibration, because the bending moment i s a function of the damping as well as of the excit ing forces. of the modifications on the buffet forces, it is necessary first to elimi- nate the e f f ec t of variations i n damping. The equations that govern the response of a wing i n buffeting have been presented i n reference 7 f o r the case where the wing is t reated as a simple beam.
Thus, i n order t o determine the effect
I n appendix B, corresponding equations are derived fo r the more gen- eral case of a platel ike wing , the s t ructural character is t ics of which are described by flexibility-influence-coefficient and mass matrices.
CONFIDENTIAL .......... ....................... 0 . 0 . 0 . . . .... . 0 . 0 . . ................ . ...... 0 . 0 . 0 . . 0 . . ........ ......................... . 0. . 0 . .
Unfortunately, the present w i n g w a s no longer available a t tine time it became c lear t h a t the influence of damping variations would have t o be removed from the data, so the influence coefficients could not be deter- mined and it w a s necessary t o r e l y on the simple-beam analysis. the accuracy of r e su l t s derived by representing the wing of t h i s t e s t as a simple beam may be open t o question, the comparisons between the var i - ous configurations are not affected by e i t h e r the beam assumption o r the choice of mode shape.
Although
For wings that can be t reated as simple beams, a strain-gage i n s t a l - l a t ion on the wing can be calibrated i n terms of the bending moment carried by a cross section of the wing, and a relationship between input force, damping, and bending-moment output can be derived. The equation f o r the spec t ra l density of the generalized normal-force coef f ic ien t i s
This equation i s obtained by combining equations (B12) and ( B l 3 ) , which are derived i n appendix B. of the data from the present investigation. The f ac to r T[ w a s modified, as previously explained, t o account f o r the f a c t t h a t by integration from 150 t o 210 cps instead of 0 t o 00 cps. mode shape w a s the same as i n reference 6.
This equation has been used i n the reduction
uM2 i s obtained The assumed
The square root of the spec t ra l density of the generalized normal- i n f igure 18 a t Mach force coefficient i s plot ted as a function of
numbers from 0.80 t o 1.00. normal-force coefficient a t the first-mode na tura l frequency
CL The spec t rd . density of the gex ra l i zed
T,
WLCav @‘N , I( 7)
i s the quantity t h a t i s fundamental t o the generalized harmonic analysis . Under the assumptions made i n the present analysis, however, the root- mean-square bending moment i n the wing i s d i r ec t ly proportional t o the square root of t h i s spec t ra l density. fore, i n terms of the square root , which i s denoted by
The r e su l t s are presented, there-
CONFIDENTIAL
Basic configuration.- The resu l t s for the basic configuration ( f ig . 18) are given by the circular symbols. Flagged c i r c l e s indicate data obtained a t a tunnel stagnation pressure of 0.33 atmosphere. so l id l i nes plot ted i n figure 18 were obtained by f a i r ing s t ra ight - l ine segments through the data f o r the basic configuration. The sharp break (discontinuity i n slope) defines the buffet boundary, as determined from the wind-tunnel t e s t s . The value of CL a t the buf fe t boundary decreases from nearly 0.5 a t M = 0.80 t o about 0.15 a t M = 0.95. As the Mach num- b e r increases above M = 0.95, the valdk of CL a t the buffet boundary increases rapidly.
The
Effect of modifications.- The modifications w e r e tested only a t the higher stagnation pressure (0.80 atmosphere). For this tunnel pressure, the angle-of-attack range was limited by the in te rna l strain-gage balance so that data w e r e obtained beyond the buffet boundary of the basic config- uration only a t Mach numbers from 0.90 to 0.95, where the buffet boundary is lowest. The results f o r Mach numbers of 0.90, 0.925, and 0.95 show that the buffet forces a t the higher values of CL w e r e substant ia l ly reduced by the modifications. A t M = 0.925, f o r instance, the buffet forces were reduced by the addition of the cambered leading edge. the swept trailing-edge extension resulted i n a fur ther reduction i n the buffet intensi ty . speed, bu t the data f o r M = 0.95 show a reduction i n buffet in tens i ty due t o the bump. the strength and the progression of the main flow shock over the w i n g , this i s a reasonable r e su l t . I n general, it would s e e m that modifications that improve the flow over the wing would reduce the buffet intensi ty .
Adding
Adding the body bump had no appreciable effect a t this
Inasmuch as changes i n body shape are known t o affect both
The results are less conclusive with regard t o the e f fec ts of the The data fo r the f u l l y modified modifications on the buffet boundary.
configuration a t M = 0.93, f o r instance, seem open t o e i the r of two pos- s ib l e interpretations: (1) the buffet boundary i s essent ia l ly unchanged by the modifications, but the buffet forces have became par t icu lar ly mild, or ( 2 ) the buffet boundary has been moved out t o a beyond the range of the t e s t . I n e i the r event, the effect of the modification i s favorable.
CL
Effect of turbulence.- It is typical of figure 18 that a t a given Mach number the exciting force a t low values of CL is approximately con- s t an t independent of both CL and the modifications. This exci ta t ion i s
believed t o be due t o wind-tunnel turLulence. Experience has shown tha t i f the turbulence level i s too high, the location of the buffet boundary tends t o become obscured. Fromthe nature of the power spectrum ( f i g . 11) it i s obvious tha t the important factor i s not the overall turbulence leve l i n the tunnel, but ra ther the turbulence level a t frequencies i n the v ic in i ty of the wing natural frequency I n the present tests the f l .
CONFIDENTIAL
root-mean-square value of the l a t e r a l component of txrbulence i n the frequency in te rva l from 180 t o 190 cps i s estimated a t l e s s than 0.02O on the basis of turbulence surveys of the tunnel.
Comments Regarding Prediction of Flight
Buffet Loads From Wind-Tunnel Tests
are known, e i ther from experimental L a 7 1
I f CN,l(q+) and C
resul ts or theory, the root-mean-square amplitude of vibration can be calculated from the following equation which w a s obtained by subst i tut ing the appropriate values f o r a N ( ~ ) and 7 i n equation (Bg):
.In deriving the equation for the root-mean-square bending moment tha t i s presented i n reference 7, it was assumed tha t the s t ruc tura l damping i s so small that it can be neglected i n comparison with the aerodynamic damping. tude i s obtained by se t t ing
- The corresponding equation f o r the vibration ampli-
g = 0 i n equation (4)
Available f l ight data support the assumption that the r a t i o of s t ruc tura l t o aerodynamic damping is suf f ic ien t ly small so that the s t ruc tura l damping can be neglected i n buffet calculations (refs. 6 and 7) . the present investigation, however, show that this i s not necessarily t rue fo r wind-tunnel models. Damping Coefficients . ' I )
The results of
(See the section of this paper en t i t l ed "System
There is a general tendency f o r the aerodynamic damping r a t i o solid-metal model w i n g s t o be considerably lower than f o r airplane wings because of the higher density of the model wings. I f 7 as i n the present t e s t , the values of q and V approximate the f l i g h t values, the aero- dynamic damping w i l l be proportional t o the value of the constant
7 of
S2/Mlq
CONFIDENTIAL
. . . . . . . ......................... ........ . . . . . . . . . . . . . . . . . . . . . . . . . ..... e . .
0 . a 0 . 0 . ...... 0 . 0 . ........... .......... NACA RM L57~1-3 8- ;OWSEN- 19
f o r the model and fo r the airplane. s t an t has the value 0.00858 f o r the 1/16-scale model described i n ref - erence 12 and 0.0646 fo r the ful l -scale airplane. damping r a t i o f o r the model i s only about one-eighth of that f o r the airplane. r a t io s , the s t ruc tura l damping assumes a greater r e l a t ive importance f o r models than f o r airplanes. of models t o be used i n buffet tests t o t r y t o minimize the s t ruc tu ra l
For the Douglas D-558-11, this con-
Thus, the aerodynamic
Because of this tendency toward much lower aerodynamic damping
Thus, it would seem advisable i n the design
damping
With regard t o the results of the present investigation, any attempt t o predict f l i g h t vibration amplitudes or stresses m u s t be based on an estimate of C f o r the airplane. Unfortunately, there seem t o be
no experimental data f o r swept wings on which t o base this estimate. Experimental aerodynamic damping ra t ios f o r two unswept wings are pre- sented i n reference 11.
CONCLUDING REMARKS
The buffet character is t ics of a l/lO-scale model of an at tack air- plane have been investigated a t Mach numbers from 0.80 t o 1.00. had a modified de l ta plan form with an NACA 0008 (modified) a i r f o i l sec- t i on a t the root and an NACA 0005 (modified) a i r f o i l section a t the t i p , a leading-edge sweep of 41.11°, an aspect r a t i o of 2.91, and a taper r a t i o of 0.226. Modifications t o t h e basic configuration included a tapered wing-leading-edge extension w i t h camber, an addition t o the w i n g t r a i l i n g edge sweeping it forward loo, and an area addition t o the rear- ward fuselage section. the basic configuration was lowest, the buffet in tens i ty w a s reduced substant ia l ly when these modifications were added t o the model.
The wing
I n the speed range where the buffet boundary of
During buffet, the wing vibrated primarily i n the first symmetrical mode. The damping of the vibration w a s not primarily aerodynamic, as i s the case f o r airplanes i n f l i g h t a t these speeds, but instead w a s mostly s t ruc tura l , apparently because of f r ic t ion i n a dovetail jo in t . As a resu l t , any attempt t o predict f l i g h t buffet stresses from the results of this investigation m u s t be based on an estimate of the aerodynamic damping fo r the airplane.
For the mathematical model of the buffeting wing there i s a re la t ion-
The experimental r e su l t s show t h a t t h i s same relationship holds ship tha t connects the band width, the peak response, and the mean-square response. fo r the actual buffeting w i n g .
CONFIDENTIAL .......... ....................... . . 0 . 0 . a * . .... . .. 0 . . . . . . . . . . . . . . . . . . a ...... * a 0 . a . e . . ........ ......................... . . . . . . .
20
.................... * . 0 . * . . . . . . . . . . . . . e . 0 . . . . .......... ....... . .a* 0. . . . . . . . . . . ........ ...... .... . . . . . . . . . . . . ............ NACA RM L57a3 C'GEDENTIAL
In designing buffet models, it is desirable to keep the structural damping very low because the aerodynamic damping ratio is much lower for solid-metal model wings than for actual airplane wings.
Langley Aeronautical Laboratory, National Advisory Comittee for Aeronautics,
Langley Field, Va., July 31, 1957.
CONFIDENTIAL ....................... .......... ...... . . . . . . . . . . . . . . . . . . . . . . . . ......................... . .... 0 e . . 0 . 0 .
0 . 0 . 0 .
. 0 . 0 . . . . . . . . . . . . .
APPENDIX A
DERIVATION OF EQUATIONS RELATING DAMPING CONSTANT AND
POWER SPECTRUM OF SYSTEM RESPONSE
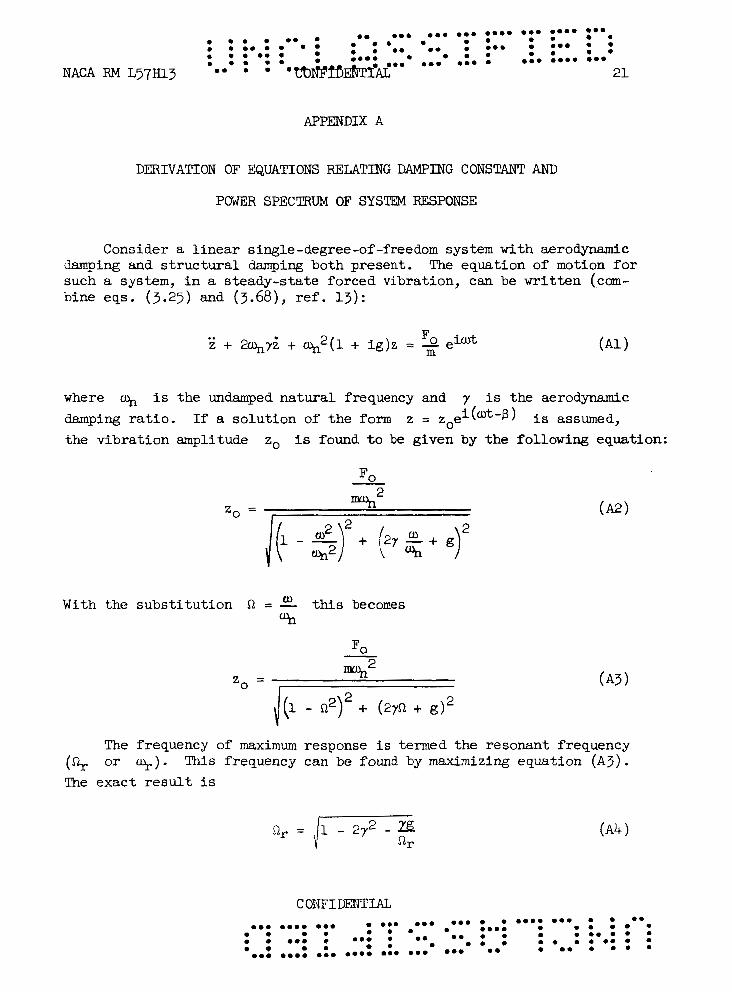
Consider a l inear single-degree-of-freedom system with aerodynamic damping and s t ruc tura l w i n g both present. such a system, i n a steady-state forced vibration, can be writ ten (com- bine eqs. (3 .25) and (3.68), re f . 13):
The equation of motion fo r
where i s the undamped natural frequency and 7 i s the aerodynamic damping ra t io . the vibration amplitude
If a solution of the form z = zoei(cDt-p) i s assumed,
zo is found t o be given by the following equation:
With the subst i tut ion R = this becomes Ufi
FO - 2- = MLfi2 0 I (A3 1 i(1 - n2)2 + (2yR + g)2
The frequency of m a x i m u m response i s termed the resonant frequency (fir or u+). This frequency can be found by maximizing equation ( A 3 ) . The exact result i s
......................... . 0 . . 0 . . 0 . 0 . 0 . a . . . . . . . . . . . . . . . . . . . . . . . . . . ......
0 . 0 . . 0 . 0 . . . . . . *.4 .e.. 0. . 0 0 . 0 0 . 0 0 . 0 0 . 0 . 0 0 0 0 0 . .... 0 .
NACA RM LYm3 c oNFIDENTIAL 22
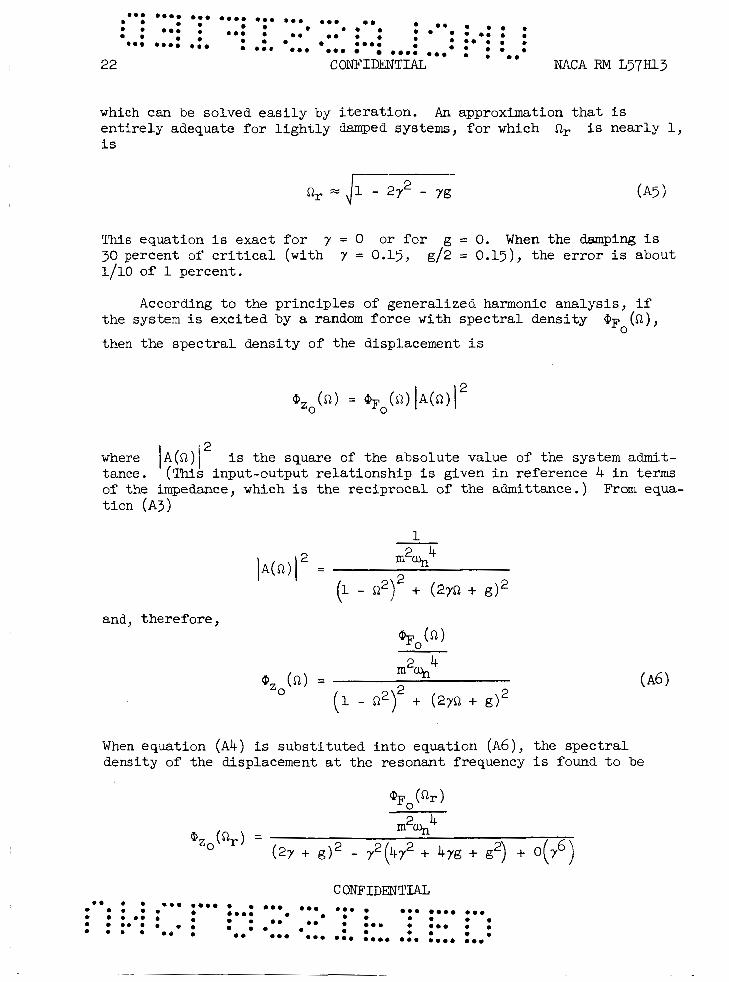
which can be solved eas i ly by i t e r a t ion . ent i re ly adequate fo r l i gh t ly damped systems, f o r which i s
An approximation t h a t i s Rr i s nearly 1,
This equation i s exact f o r 7 = 0 or f o r g = 0. When the damping i s 30 percent of c r i t i c a l (with 1/10 of 1 percent.
7 = 0.15, g/2 = O.l5), the e r ro r i s about
According t o the principles of generalized harmonic analysis, i f the system is excited by a random force with spectral density
then the spec t ra l density of the displacement i s OF 0 ( Q ) ,
where I A ( Q ) l 2 i s the square of the absolute value of the system admit- tance. (This input-output re la t ionship i s given i n reference 4 i n terms of the impedance, which i s the reciprocal of the admittance.) t i o n (A3)
From equa-
1 ln2w4
(1 - Q2)2 + (27Q + g)2
and, theref ore, @F (Q)
0
rn2%4 (n) =
zO (1 - Q2)2 + (27Q + g)2
When equation (Ah) is substi tuted i n t o equation ( A 6 ) , the spec t ra l density of the displacement a t the resonant frequency i s found t o be
CONFIDENTIAL

For l i gh t ly damped systems this i s approximately
The integrated mean-square response of the system is given by
or, for the special case where the spectral density of the excit ing force %o(0) is a constant independent of frequency
+ (2% + d2
If e i the r g or 7 i s zero, the integral uated i n closed form. For g = 0,
i n equation (A8) can be eval-
where
When the in tegra l of equation (Aga) is evaluted f o r the limits and RB = m
S ~ A = 0
and the r e su l t i s substituted in to equation (A8) , the
CONFIDENTIAL
......................... 0 . . . . . . . . . * . . . . . . . . . . . . . . . . . 0 . 0 . . ...... m . 0 . 0 . . . . . . . . .
0 . 0 . . .... ................. * m - , - & . a . . . . . NACA RM L57m3 24
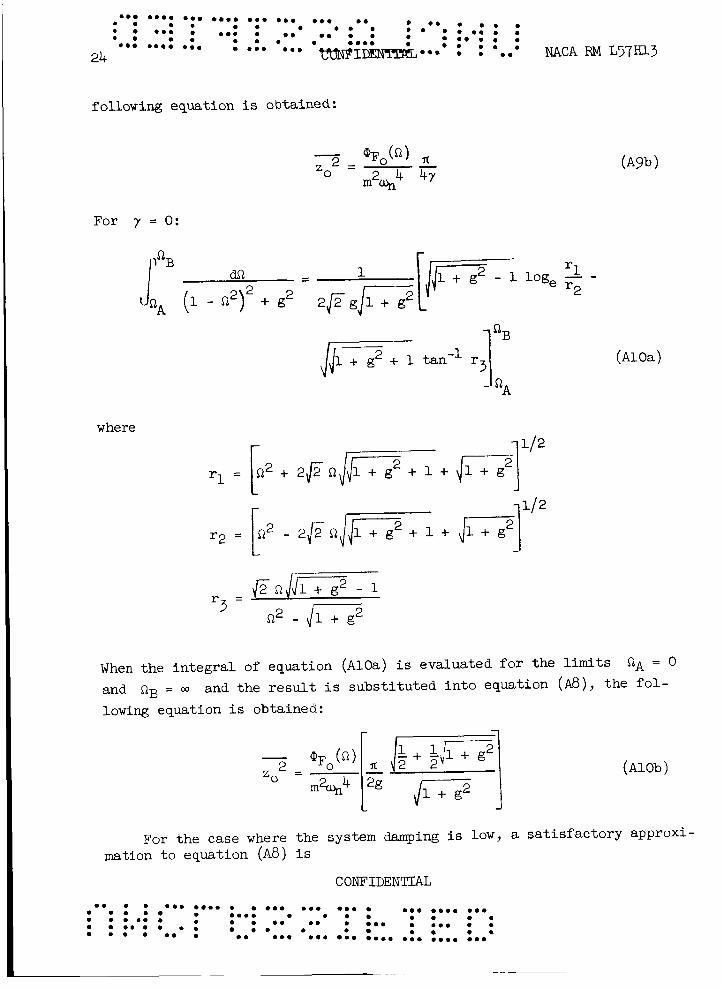
following equation is obtained:
For y = 0 :
where
( A l O a )
( A l O b )
When the in tegra l of equation ( A l O a ) i s evaluated fo r the l i m i t s and RB = m and the result i s subst i tuted in to equation ( A 8 ) , the f o l - lowing equation i s obtained:
RA = 0
- zo* =
For the case where the system damping i s l o w , a sa t i s fac tory approxi- mation t o equation (A8) i s
CONF1DE”JXAI.J
....................... .......... . .... . . . . 0 ..b.. 0 . 0 . . . . . . . . . . . . . . . . . ........ . . . . . . . . 0 . 0 . * . ......................... . 0 . 0 . . ..

......................... . ........ 0 . 0 . 0 .
NACA RM L'j7m3 .... : : *...&pDmm ................. . 0 . . 0 . . 0 . . . . . . . . . . . . . . . . . . . ..... 0 . . 0 . 0 . ...... 25
.02 0
This r e s u l t has been obtained f o r the special case %o(i2) = Constant.
The e r ror of the approximation i n equation (All) has been determined fo r three combinations of y and g/2, each with a t o t a l damping r a t i o of 0.04, with the following results:
.02 .11
.04 .024 . For the special case of a l i gh t ly damped system with constant den-
s i t y excitation, equations (A7) and ( A l l ) can be combined t o y ie ld a relationship between the damping, the mean-square response, and the peak response :
In case the mean square value is obtained from an integration over a limited range rather than from 0 t o 00, this equation can be modified as explained i n the discussion of figure 15 i n the section of the paper en t i t l ed "System Damping Coefficients ."
A second equation f o r the damping can be derived independently from the frequencies a t the half-power points on the response curve. frequencies can be determined by finding the m a x i m u m value of the inte- grand i n equation (A8) and then solving f o r the frequencies a t which the value of the integrand is exactly one-half of the maximum value. has been done f o r the two special cases g = 0 and y = 0. For g = 0:
These
This
The two solutions given by this equation yield the difference the upper and lower half-power points. The solution f o r 7 i n terms of
aR between
CONFIDENTIAL .......... ....................... 0 . 0 . 0 . 0 . . ........ . . 00. . . .. 0 . .
0 . 0 0 0 . 0. . 0 . . m e 0 0 . e . e.. a.0 8 0 . 0 . . .........................
......................... . . . . . . . . . . . . . . . . . . . . . . . . ...... 0 . . 0 . . 0 . 0 .
0 . 0 . m a . . . . . . . . . .... * . 0 . . .......... ....... *~~~JFPJ-D&&, * * * 0. NACA RM L57a3 26
Y g/2
0.04 0 .02 .02
0 .04
t h i s difference i s
Error in eq. ( f i 5 ) percent
1.965 .165 .080
For 7 = 0:
(A14a)
and
(A14b)
For combined viscous and s t ruc tura l damping, a sui table approximation fo r l igh t ly damped systems i s
The error i n equation ( A l 5 ) has been determined f o r three combinations of 7 results :
and, g / 2 , each with a t o t a l damping r a t i o of 0.04, w i t h the following
CONFIDENTIAL ....................... .......... ...... 0 . 0 . . . . . . . . . . . . . . . . . ........ . . . * . 0 . . . a 0 . 0 . ......................... . .... . . . . . 0 . 0 . . 0 .
APPENDIX B
DERIVATION OF EQUATIONS GOVERNING BUFFET
RESPONSE OF A WING
In deriving the buffet equations the procedure w i l l ,e t o determine the normal modes of the w i n g , t o set up the equation f o r a steady-state forced vibration by Lagrange's method, t o solve t h i s equation i n order t o determine the admittance of the vibrating system, and then t o apply the methods of generalized harmonic analysis t o determine the response of the system t o a random (buffet) input.
The normal modes of vibration can be determined from the s t ruc tura l character is t ics of the w i n g as described by cer ta in matrices ( ref . 13, 14, or 15). elements, each of which is associated with a par t icu lar point i n the plane of the w i n g . The e l a s t i c properties of the wing are contained i n a square matrix of flexibil i ty-influence coefficients, which can be determined by analysis of the s t ructure or by direct measurement. If {P) i s a set of s t a t i c loads and {z} i s a corresponding set of displacements, then
For analysis, the wing is divided in to a suitable group of
where [A] is the matrix of flexibil i ty-influence coeff ic ients . The i n e r t i a l properties of the wing are described by a diagonal matrix, each element of which i s the m a s s associatedwith an element of the wing. This matrix i s denoted by [MI. The matrix [U] = fA][M] is called the dynamic matrix.
The matrix equation
is solved t o obtain the frequencies and shapes of the normal modes of vibration (ref. 13, p. 169). wri t ten % and the column matrix containing the associated normalized set of deflections w i l l be wri t ten
The frequency of the nth mode w i l l be
CONFIDENTIAL
......................... . . . . . . . a m 0 . a . . . . . . . . . . . . .......... ....... ....... . . . . . . . . . . . . . . . . . .... . ...... . . 0 . 0 . .
c.;&eoD&m NACA RM L57m3 0 . 0 . 0 . .
28
The displacement of the mth element of the vibrating w i n g can be written i n terms of a se r ies u t i l i z ing the normal modes:
where the terms rn are functions of t i m e . The kinet ic energy of the vibrating system i s then ( r e f . 13, p. 45)
where
m \ /
and the terms % are the elements of the ine r t i a matrix b]. The
e l a s t i c s t r a i n energy V i s ( re fs . 13 and 14)
These expressions f o r the k ine t ic and potent ia l energies, when inserted i n Lagrange's equation, yielded the equation of motion f o r the nth mode:
where a c t on the element m.
Pm represents the forces, other than i n e r t i a l and e l a s t i c , that
The results of this test and others (refs. 5 and 7) have shown that, i n many instances of wing buffet, most of the energy i n the power spectrum of buffet bending moment is concentrated a t frequencies i n the v ic in i ty of the natural frequency of the first mode. separated from the higher modes, and as a r e su l t the response of the higher modes a t the f irst mode frequency i s very small.
Normally the first mode is w e l l
Attention can
CONFIDENTIAL ....................... .......... . 0 . 0 . e . . ...... . . . . . . . . . . . . . . . . . . . . . . . 0 . 0 . 0 .
. .... . . 0 . 0 . . . . . . . . . . . 0 . .........................
be confined, therefore, t o a study of the first mode. t ions (Bl) then reduces t o the single equation
The s e t of equa-
One of the forces that contribute t o Pm is the pressure fluctua-
t ion tha t causes the buffet; this pressure fluctuation is called the excit ing force. The force on element m is A h s m and the corresponding generalized force on the wing is
It i s convenient t o define w h a t might be termed a generalized normal-force coeff ic ient f o r the first mode:
where
Another force tha t contributes t o Pm For simple harmonic motion, this force f o r
is the aerodynamic force due t o the motion of the wing. an element m of the w i n g is of the form
w i t h the corresponding generalized force being
I n th i s simplified treatment of the buffet phenomena, the f irst and last terms of this generalized force are assumed t o be negligible i n comparison
CONFIDENTIAL
......................... 0 . 0 . 0 . . . . . . . . . .......... ....... . . . . a 0 . ........ 0 . . . . . . . . . . . . . . . . . 0 . . . . 0.. a . 0 . ...... 0 . .
NACA RM L57m3 30
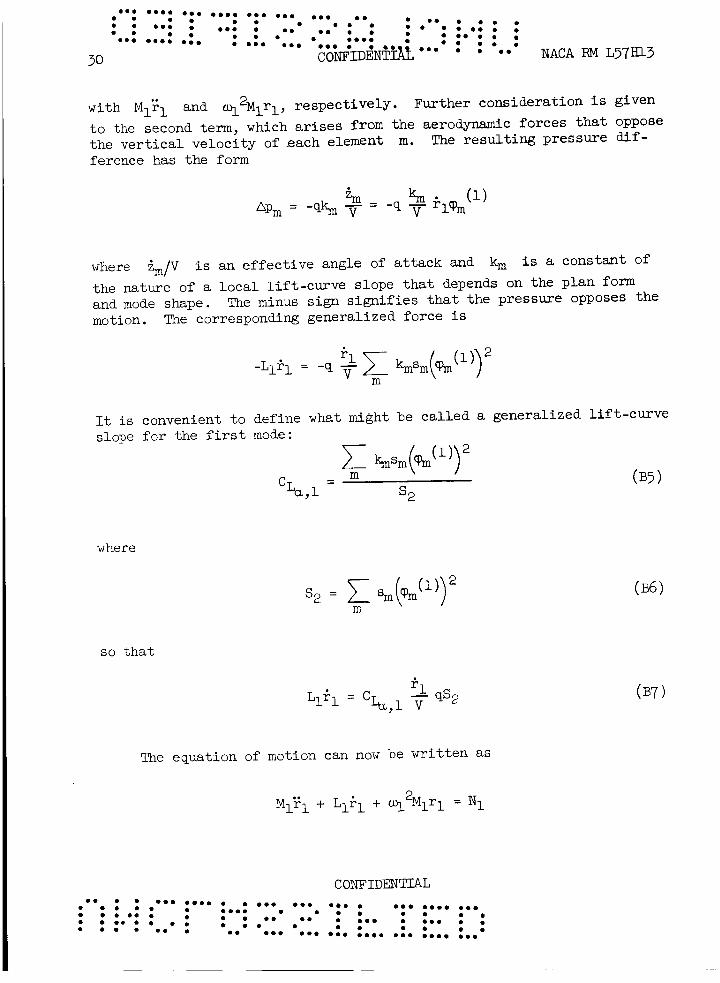
with M i ? l and q"M1rl , respectively. Further consideration i s given t o the second term, which a r i s e s from the aerodynamic forces t h a t oppose the ver t ica l velocity of each element ference has the form
m. The resu l t ing pressure dif-
where the nature of a loca l l i f t -curve slope t h a t depends on the plan form and mode shape. motion.
i m / V i s an effect ive angle of a t tack and km i s a constant of
The minus sign s igni f ies t h a t the pressure opposes the The corresponding generalized force i s
It is convenient t o define what might be cal led a generalized l i f t -curve
where
so tha t
The equation of motion can now be wri t ten as
2 Myel + L1el + cq Mlrl = Nl
CONFIDENTUL . . ....................... .......... ........ . . . . . . . . . . . . . . . . . . . . . . . . . . ......................... .... . . . . 0 . 0 . . 0 . 0 . ...... . 0 . 0 . 0 .
......................... ................ 0 . . 0 . 0 .
. ........ 0 . 0 . 0 .
NACA RM L57rn3 .... : . . ~ ~ f ~ ~ ~ . . ................. . 0 .
.I*.. 0
. 0 . . 0 . . . . . . . . . 0 .
31
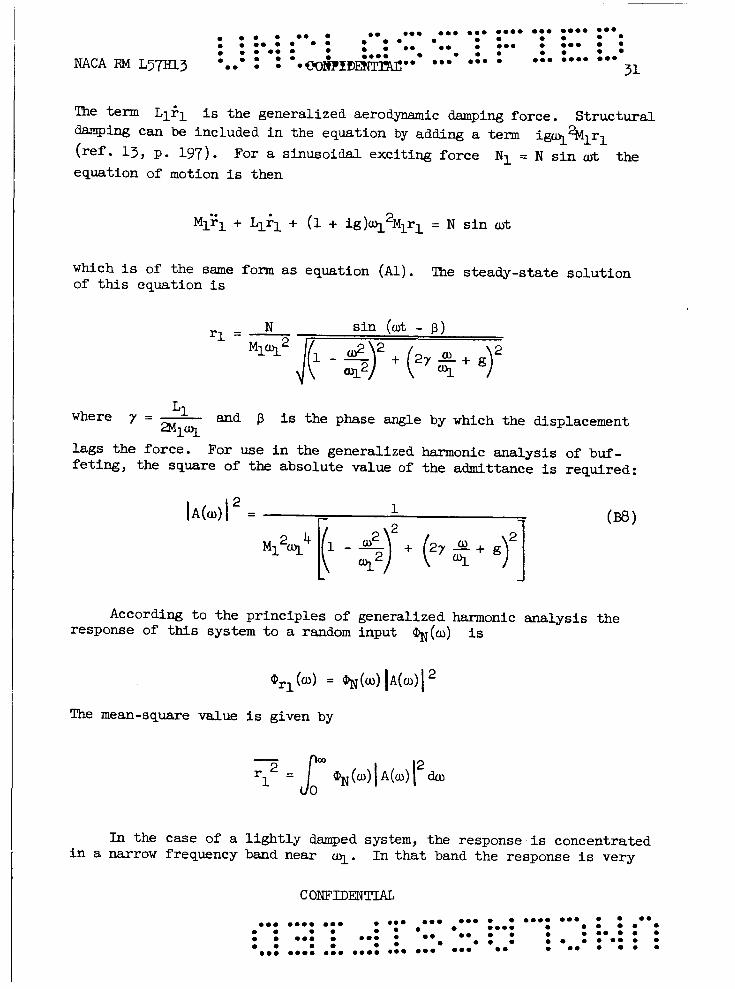
The term L151 is the generalized aerodynamic damping force. Structural damping can be included i n the equation by adding a term (ref. 13, p. 197). For a sinusoidal exciting force N 1 = N s i n ut the equation of motion is then
iw%lrl
M<G1 + L1G1 + (1 + ig)q2Mlrl = N s i n ut
which is of the same form as equation ( A l ) . of this equation i s
The steady-state solution
s i n (ut - p ) N r l = -
where y = - L1 and p is the phase angle by which the displacement a1 ol
lags the force. feting, the square of the absolute value of the admittance is required:
For use i n the generalized harmonic analysis of buf-
According t o the principles of generalized harmonic analysis the response of this system t o a random input %(a) is
I n the case of a l i gh t ly damped system, the response i s concentrated i n a narrow frequency band near q. In tha t band the response is very
CONFIDENTIAL ................................. 0 . 0 . 0 . . .... . 0 . 0 . . ................ ...... 0 . ......................... 0 . 0 .
. . . 0 . . ........ . 0 . . 0 . .
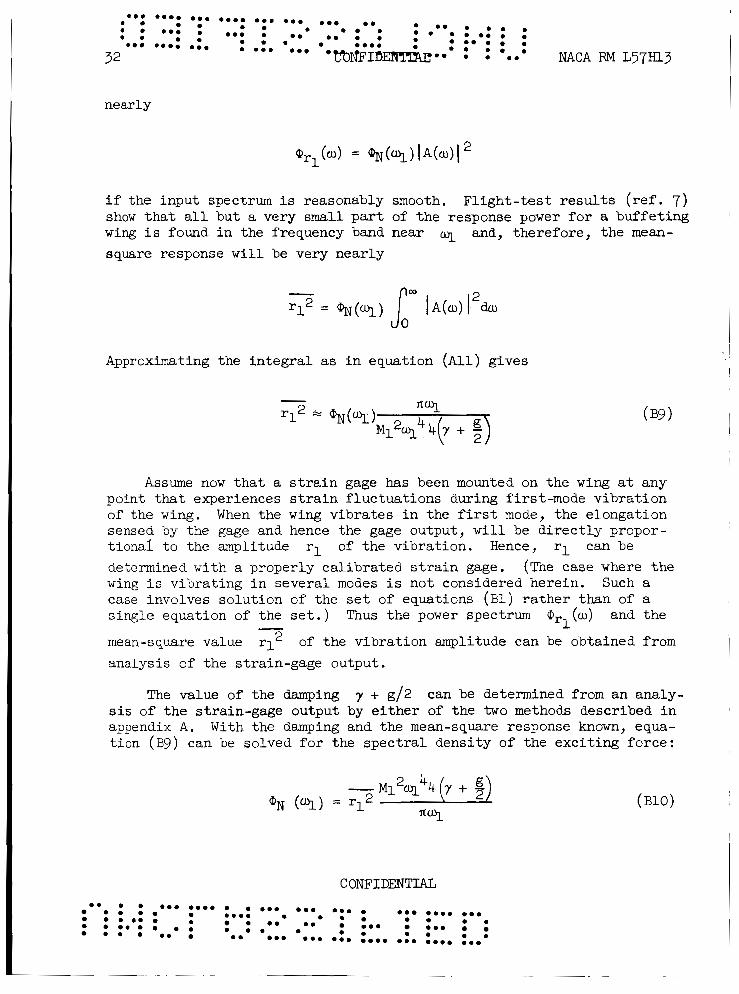
nearly
if the input spectrum i s reasonably smooth. F l igh t - tes t results (ref. 7 ) show t h a t a l l but a very small p a r t of the response power f o r a buffeting wing i s found i n the frequency band near square response w i l l be very nearly
~1 and, therefore, the mean-
Approximating the in t eg ra l as i n equation (All) gives
Assume now t h a t a s t r a i n gage has been mounted on the w i n g a t any point that experiences s t r a i n fluctuations during first-mode vibration of the wing. When the wing vibrates i n the f i r s t mode, the elongation sensed by the gage and hence the gage output, w i l l be d i r ec t ly propor- t iona l t o the amplitude r1 of the vibration. Hence, rl can be determined with a properly calibrated s t r a i n gage. wing i s vibrating i n several modes i s not considered herein. Such a case involves solution of the set of equations (Bl) ra ther than of a single equation of the se t . ) Thus the power spectrum Q, '1 (LU) and the
mean-square value analysis of the strain-gage output.
The value of the damping
(The case where the
- r12 of the vibration amplitude can be obtained from
7 + g/2 can be determined from an analy- sis of the strain-gage output by e i t h e r of the two methods described i n appendix A. With the damping and the mean-square response known, equa- t ion (Bg) can be solved f o r the spec t ra l density of the excit ing force:
CONFIDENTIAL
. . ....................... .......... a . 0 . 0 . .
0 . a. 0 . 0 . 0 .
.... . . 0 . 0 . 0 . . . m a . 0 0 . 0 . a.0 0.0 ........ . .........................
......................... . 0 . 0 . . 0 . . 0. . 0 . . 0 . ...... 0 . .... 0 . .
........ . ................ 0 .
NACA RM ~ 5 7 ~ 1 3 .... : : *..c6wIDENIIAt.~ ................. 33
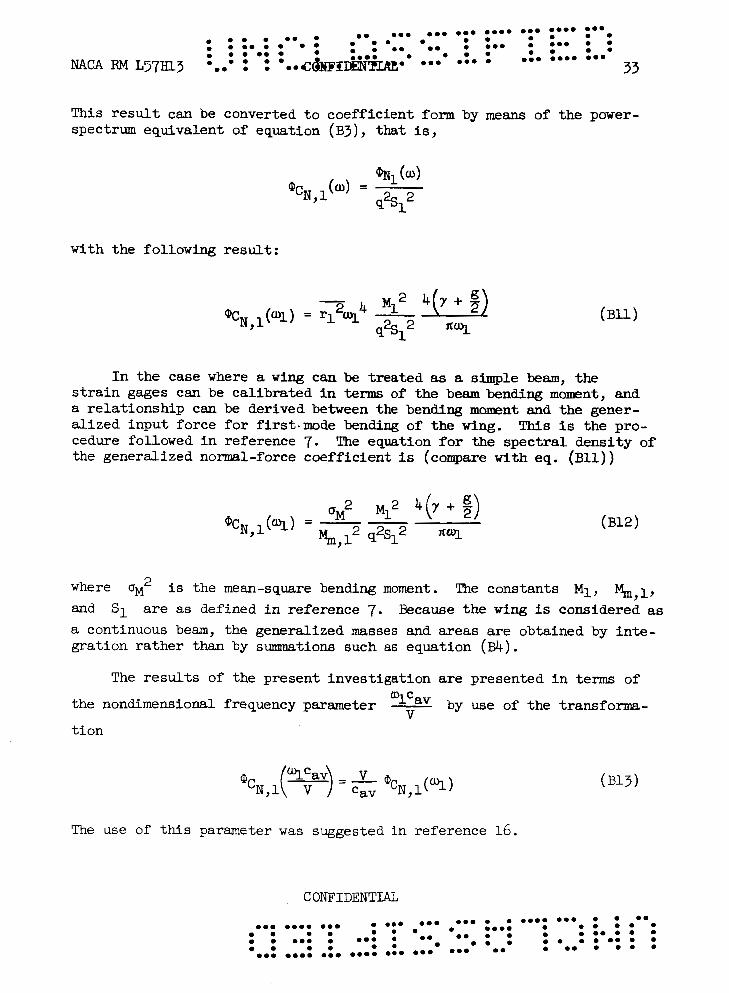
This result can be converted t o coefficient form by m e a n s of the power- spectrum equivalent of equation ( B 3 ) , that is,
with the following result:
I n the case where a wing can be treated as a simple beam, the s t r a i n gages can be calibrated i n t e r m s of the beam bending moment, and a re la t ionship can be derived between the bending moment and the gener- a l ized input force f o r first-mode bending of the wing. cedure followed i n reference 7. the generalized normal-force coefficient i s (compare with eq. (B11))
This is the pro- The equation f o r the spectral density of
where c r ~ ~ i s the mean-square bending moment. The constants MI, %,l, and S 1 are as defined i n reference 7. Because the wing is considered as a continucus beam, the generalized masses and areas are obtained by in te - gration rather than by summations such as equation (&).
The results of the present investigation are presented i n terms of
the nondimensional frequency parameter OICav - by use of the transforma-
t ion V
The use of t h i s parameter was suggested i n reference 16.
CONFIDENTIAL .......... ....................... 0 . 0 . m . . . . . . . . . . . . . . . . . . . ...... 0 . 0 . 0 . 0 . . ........ . .... . 0 . 0 . . . 0. . 0 . . . .........................
The equation fo r the root-mean-square bending moment as a function
The derivation of t h i s equation is essent ia l ly the same as tha t of equation (1) i n reference 6, except t ha t s t ruc tura l damping included i n t h i s case. reference 7 (same as eq. (1) , r e f . 6 ) by a factor of 2 that w a s inadvert- ently omitted i n the derivation of t ha t equation. Thus the values of the quantities symbolized by
g, has been Equation (B14) also d i f fe rs from equation (8) i n
and
as presented i n references 6 and 7 are exactly twice as large as the values t h a t would be obtained by the use of equation (B14). Because the references use the same equation consistently, the values of uM are not affected by the omission of this constant factor .
For the l imit ing case y = 0, the root-mean-square bending moment is , from equations (B12) and (Bl3), ~
Thus f o r 7 = 0 , % a q a p; while fo r g = 0 , % a a (eq. (B14)).
C ONFIRENTIAL
. . ....................... .......... . 0 . 0 . 0 . . 0 . 0 . . 0 . . 0 . . ......................... .... . ...... ........ . . . . . . . . . . . . . . . . . 0 . . 0 . 0 . 0 .
......................... 0 . . ........ 0 . 0 . . . . . . . . ................ . 0 . ..... . 0 . . 0. . . 0 . 0 .
0 . . 0 . 0 .
NACA RM L57a3 .... o.y~~-~. ................. 33
1. Gadeberg, Burnett L., and Ziff , Howard L.: Flight-Determined B u f f e t Boundaries of Ten Airplanes and Comparisons With Five Buffeting Criteria. NACA RM A50127, 1951.
2. Kantor, M.: Estimation of the Buffet-Onset Boundary f o r Straight and Swept-Wing Airplanes. Tech. Memo. 1-53, Aero. and Hydro. Branch, Bur . Aero., Mar. 20, 1953.
3. Martin, Andrew, and Reed, James F.: Correlation of Buffet Boundaries Predicted From Wind-Tunnel Tests With Those Measured During Fl ight T e s t s on the ~ 8 ~ - 1 and X-1 Airplanes - Transonic-Bump Method. NACA RM A52517, 1952.
4. Liepmann, H. W.: On the Application of S t a t i s t i c a l Concepts t o the Buffeting Problem. Jour. Aero. Sci., vol. 19, no. 12, Dec. 1952, pp. 793-800, 822.
5. Huston, Wilber B., and Skopinski, Ted H.: Probability and Frequency Characterist ics of Some Flight Buffet Loads. NACA TN 3733, 1956.
A Semiempirical Procedure 6. Skopinski, T. H., and Huston, Wilber B.: f o r Estimating Wing Buffet Loads i n the Transonic Region. NACA RM ~ 5 6 ~ 0 1 , 1956.
7. Huston, Wilber B., Rainey, A. Gerald, and Baker, Thomas F.: A Study of the Correlation Between Fl ight and Wind-Tunnel Buffeting Loads. NACA RM L55E16b, 1955.
8. Whitcomb, Richard T.: A Study of the Zero-Lift Drag-Rise Character- i s t i c s of Wing-Body Combinations Near the Speed of Sound. NACA Rep. 1273, 1956. (Supersedes NACA RM ~ 5 2 ~ 0 8 . )
9 . Holdaway, George H.: Comparison of Theoretical and Experimental Zero- L i f t Drag-Rise Characterist ics of Wing-Body-Tail Combinations Near the Speed of Sound. NACA RM A53Hl7, 1953.
10. Smith, Francis B.: Analog Equipment f o r Processing Randomly Fluctu- ating Data. Aero. Eng. Rev., vol . 14, no. 5, May 1955, pp. 113-119.
11. Rainey, A. Gerald.: Measurement of Aerodynamic Forces f o r Various Mean Angles of Attack on an Airfoil Oscil lating i n Pitch and on Two Finite-Span W i n g s Oscillating i n Bending With Ehphasis on Damping i n the S t a l l . NACA TN 3643, 1956.
CONFIDENTIAL .......... ....................... 0 . 0 . 0 . . .... . 0 . 0 . . . . . . . . . . . . . . . . . . . ...... ......................... . .
0 . . ........ . 0. . 0 . . 0 . 0 . 0 .
......................... 0 . . 0 . . . . . . . . . . . . . . . . . . .... . ...... 0 . 0 . . 0 . 0 . . .......... ........... . 0 . . 0 . 0 . 0 . . . . . . . . .
0 .
NACA €34 L57m3 . . . . 36
12 . Kemp, W i l l i a m B. , Jr., and King, Thomas, J., Jr.: Wind-Tunnel Meas- urements of Wing Buffeting on 1/16-Scale Model of Douglas D-558-11 Research Airplane. NACA RM L56G31, 1956.
13. Scanlan, Robert H., and Rosenbaum, Robert: Introduction t o the Study of Aircraft Vibration and Flu t te r . The Macmillan Co., 1951.
An Introduction t o the Theory of Aeroelasticity. 14. Fung, Y. C . : GALCIT Aeronautical Series. John Wiley & Sons, Inc., c.1955.
15. Bisplinghoff, Raymond L., Ashley, Holt, and Halfman, Robert L.: Addison-Wesley Pub. Co . , Inc . (Cambridge, Mass. ),
Aero- e l a s t i c i t y . c .1955.
16. Liepmann, H. W . : Parameters f o r Use i n Buffet Fl ight Tests. Rep. No. SM-14631, Douglas Aircraf t Co., Inc., Jan. 3, 1953.
CONFIDENTIAL ....................... .......... . 0 . 0 . 0 . 0 ...... . . . . . . . . . . . . . . . . . ........ . . 0 . . 0 . . . e 0 . 0 . ......................... . .... . 0 . 0 . . 0 .
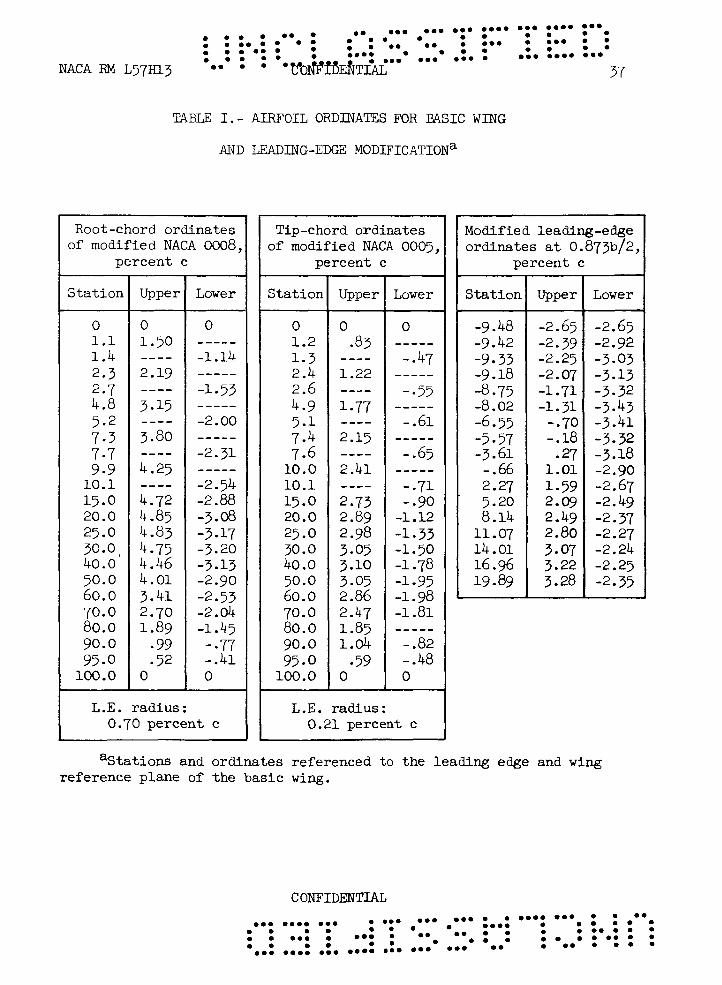
TABLE I. - A I R F O I L ORDINATES FOR BASIC WING
AND LEADING-EDGE MODIFICATION"
Root-chord ordinates of modified NACA 0008,
percent c
Station
0 1.1 1.4 2.3 2.7 4.8 5.2 7.3 7.7 9.9
10.1 15.0 20.0 25.0 30.0,
50.0 60.0 70.0 80.0 90.0 95.0 100.0
40.0
0 1.50 ---- 2.19
3.15
3.80
----
----
-_-- 4.25
4.72 4.85 4.83 4.75 4.46 4.01 3.41
----
2.70 1.89
-99 52
0
Lower
0 ----- -1.14
-1.53
-2.00
-----
-----
----- -2.31
-2.54 -2.88 -3.08 -3.17 -3.20 -3.13 -2.90 -2.53 -2.04 -1.45 - .77 - .41 0
-----
L.E. radius: 0.70 percent c
Tip-chord ordinates of modified NACA 0005,
percent c
Station
0 1.2 1 .3 2.4 2.6 4.9 5.1 7.4 7.6
15.0
25.0 30.0
50.0 60.0 70.0 80.0 90.0
10.0 10.1
20.0
40 .O
95.0 100.0
0 .83 ----
1.22
1.77
2.15 ----
---- 2.41
2 -73 2.89 2.98 3-05 3.10 3.05 2.86 2.47 1.85 1.04
-59 0
----
Lower
0 -_--- - .47
-a55
-.61
- .65
- .71 -.90
-1.12 -1.33 -1.50 -1.78 -1 9 95 -1.98 -1.81
- .82 - .48 0
----- -_---
-----
-----
-_---
L.E. radius: 0.21 percent c
Modified leading-edge ordinates a t 0.873b/2,
percent c
Station
-9.48 -9.42 -9 33 -9.18 -8.75 -8.02 -6.55 -5 9 57 -3.61 -.66 2.27 5.20
11.07
16.96 19.89
8.14
14.01
Upper
-2.65 -2.39 -2.25 -2.07
-1.31 -.70 -.la -27
1.01 1.59 2-09 2.49 2.80
3.22 3.28
-1.71
3-07
Lower
-2.65 -2.92 -3.03 -3.13 -3.32 -3.43 -3 -41 -3.32 -3.18 -2.90 -2.67 -2.49 -2.37 -2.27 -2.24 -2.25 -2 35
&Stations and ordinates referenced t o the leading edge and wing reference plane of the basic wing.
t Y 4
I 1 c
-
I
k A I I I I
L- 7
c 0
m rl
I
rl
....................... .......... . 0 . 0 . . .... . . . 0 . 0 . . 0 . . 0 . . ......... .:.c~~mE&croL. :..* . ...... . . . . . . . . . . . . . . . . . ........ . 0 .
I
Distance from slot origin, in
Figure 2.- Local Mach number distribution over the test section occupied by the model. Atmospheric stagnation pressure.
0.0 0.0. 0.0 e m 0 0 0 0 0 0 0 0 0 0 0 0 0 0 0 0 0 0 0 0 0 0.00 0 0 0 0 0 0 0 0 0 0 0 0 0 . 0 0 . 0
0 0 0 0 0 0 . 0 0 . 0 0.0 0.0 0 0 0 0 0 0 0 0 0
0 .
0 .
Leading-edge rnodificationJ
0.25-chord h e '\ I A
_ _ _ _
Section B-B
-I Leading-edge modification
Section A-A
Figure 4.- Dimensional details of wing leading-edge modification. A l l dimensions are in inches unless otherwise noted.
-21.5
~- -v- \ A \ \ - ---
Original t r a i l i n g edge
I Wailing-edge extension '
k 4 . 2 -
I / Section A-A (enlarged) \
"i'
/ Original t r a i l i n g edge
\ '\ Trailing-edge extension
/
Section B-B (enlarged)
Figure 3 . - Dimensional details of wing trailing-edge extension. A l l dimensions are in inches unless otherwise noted.
NACA RM L’37Hl3
> i
n
a 0 El
m d rl Ld -P a, FI I
v)
a,
43
......................... . . . . . . . . e 0 . 0 . . 0 . 0 ........ . . . . . . . . . . . . . . . . . ...... 0 . 0 . 0 . . .... 0 . . ........... corny&*$, : ... NACA RM L57H13 44" ***. .**
. . .......... . . . . . ....................... .... . . . 0 . 0 . ...... . . . . . . . . . . . . . . . . . 0 . 0 . 0 .
0 . 0 . . . . c o ~ & r f & .
. ..... ... ......... 0 :
••• . . • • •••••
i · • • • • ••• l.-1 • t::::; •• •
~ . ~ . ~.: .. • • ••••• • •
· • • • • • • • • • • · . . • • • • •
•••• • • • • .... • • • •••••
• • • • • • ••• ..... • • •••••
••• • .... • •
-- ------ -
(a) Three-quarter front view. L-89766
Figure 8.- Model installed in the Langley 8-foot transonic pressure tunnel. (Modifications to wing leading edge, wing trailing edge, and fuselage included.)
2:
-l f) »
~ ~
~ \>I
•••• • • •••• • •••• • • • ••••
i··: : ~ .... ~ t-It e • •
E; • • • • •••• • • • • • • •• • • • • · . . • •• • • ••••• • .....
•• •
• • ••••• • ••••• • • • • •• • •
+=; •••• V'. •
• • ...
••• •••• • • • ... •
46 ••••
.. • • ••• • • • • • · • •• • •• • • • • • • ••
••• • ••• ... • •• • •• •• • • • • • • • • • • • .. • ... • . . .. • .. · • · • . • •••• • • • • •• • • ••• ••• • •• • c e>NP.riJElfrJAL· •
\ \
.... • ... • • •• '.' . " . . ... • •• .... • • • • • • • • • . • •• .. • ••• • • . • • • ••• • • • • • • t'..aI'IF' 1 ~ ':]'1\1 : ••• • •• .' . ...
• • • · · • • • • NACA RM L57Hl3
r-l
C\J
8 o 0\
I H
~ Q) ·n > H ell Q) H
H Q)
+> ~ & I
Q) Q)
~ p
'd Q)
'g r-l C) r::: 0 u
co Q)
~ ·n Ii<
NACA RM L57Hl3
......................... . . . . . . . 0 . 0 . 0 . . m . . . . . . . . . . . . . . . . . . . . . . . . . ...... . e 0 . ........... : t & S B k m : : .... NACA RM L57H13 . . . 48. 0..
. ........... 0 . m . ...... . ...... e : . . . . . . . ~~~ 1
cu
50
Y
40 -
30
n
20 -
IO
OO
......................... . . . . . . . . . . . . . . . . . . . . . . . ........ . 0 . ...... . . 0 . 0 . 0 .
4; 0 . . . . 0 . . ......... am.. ... : . . ~ & b ~ ~ ~ ~ . . . .......
Second wing mode
,Third wing mode
300 400 500 Frequency, c ps
Figure 11.- Typical spectrum of the output of the bending-moment gage with a f i l t e r band width of 30 cycles per second. 0.33 atmosphere f o r M = 0.95 and a = 6 O .
Basic m o d e l a t
................................. . . 0 . 0 . 0 . . .... . . . . . . . 0 . 0 . . . . *Qq$*. ......... . . . . . . . ...... 0 . 0 . . ........
0.. 0..

......................... . . . . . . . 0 . 0 . 0 . . 0 . . . . . . . . . . . . . . . . . . . . . . . . . . . ......
NACA RM L57Hl.3 0 . . ....... 0 . ........... :'&@-qhxArf : ....
0 C
0 C W R
W
3 9
0
>r u) C W -0
.-
c Y- Y-
Y-
.I- .-
- z a
c 0 W
v)
W 3 0 a
L
t
c c E W
Eo E
5 CI, c E aJ t W .c bl-
3 n Y- O )r c ul E
-8 E - c 0 W Q ul
W L
a
Frequency, cps
(a) a = 0'.
Frequency, cps
(b) a = 4'.
Figure 12.- Low-frequency-range spectra of the output of t he bending- moment gage with a f i l t e r band width of 3 cycles per second. model a t 0.80 atnosphere f o r
Basic M = 0 . s a d two angles of attack.
....................... .... .......... . 0 . . : &gF&&w: i ...... . . 0 . 8 . . a * . * . 0 . . 0 . 0 . . . 0 . . . . . . . . .........................
NACA RM L57Hl3
4
3
2
I 0'
0
Lift coeffjcient, CL
Figure 13.- Effect of density on the buffet bending moment. Basic model a t M = 0.80.
......................... . 0 . . 0 . . 0 . 0 . e . . 0 . e . . . . . . . . . . . . . . . . . . . . . . . . . ......
0 . . . . .... 0 . . 52.. NACA RM L57H13 0 . ........... C()IfFI&€d : ...
20
Figure 14.- Typical spectrum i n v i c in i ty of wing f irst bending
frequency with a f i l t e r band width of approximately 11 cycles
per second. and u = 6'.
4 Basic model a t 0.33 atmosphere fo r M = 0.95
. . ....................... . . . .......... . . . . . . . ......... .:c-&p~~hI&. :..* ...... 0 . 0 . . 0 . 0 . ..e. . . . . . . . . . 0 . . . . . . . . . . . . . . 0 . 0 .
NACA RM L57Hl.3
-06 -
.O 5
.04
-03
.02
.o I
-I-- 9 from eq (A12), modified 7 2
Figure 15.- Comparison of total damping coefficients obtained by two independent methods.
................................. a . .... . a 0 . ........ 0. a 0 .
a . 0 . 0 . . . . . . . . . 0. 0.
0 . . . . 0.. ..ad-. .........
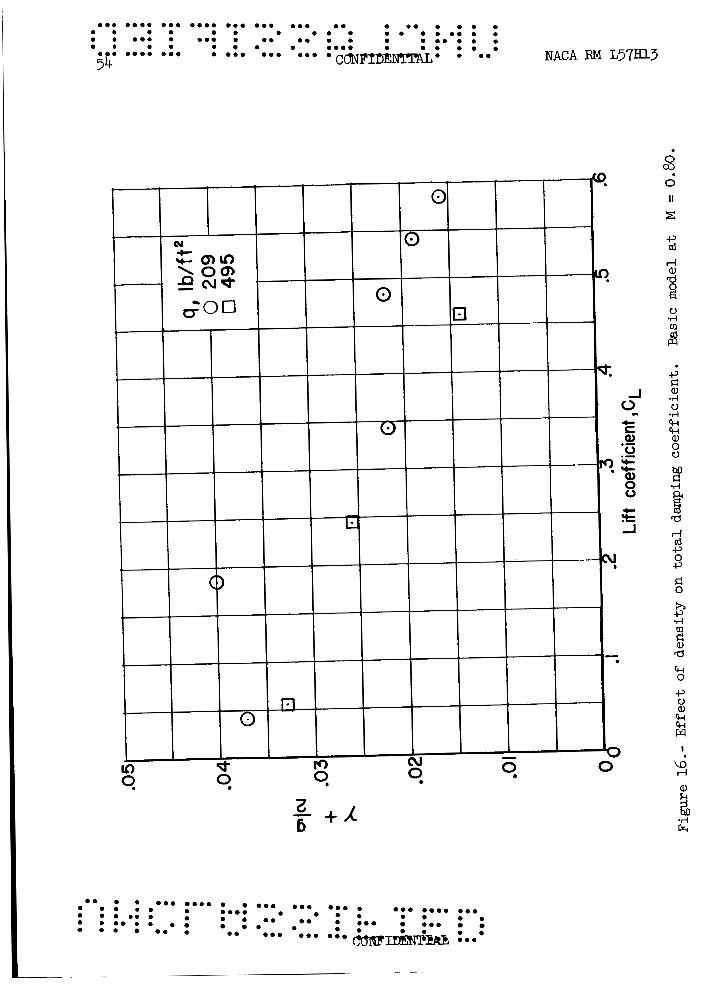
......................... . 0 . . 0 . . 0 . 0 . 0 . . 0 . . ........ . . . . . . . . . . . . . . . . . ...... 0 . 0 . a . . .... 0 . 0 . . .......... .... ... 54 . 0.. 0. . . c 6 J * & ~ . NACA RM L57m3
1 - + A 6
....................... .... . . . .......... ........ 0 .
0 . 0 . . ........... &qF&m . . .
0 . 0 .
. 0 . 0 . ...... .*. : *.* **. . . 0 . . 0 . ...
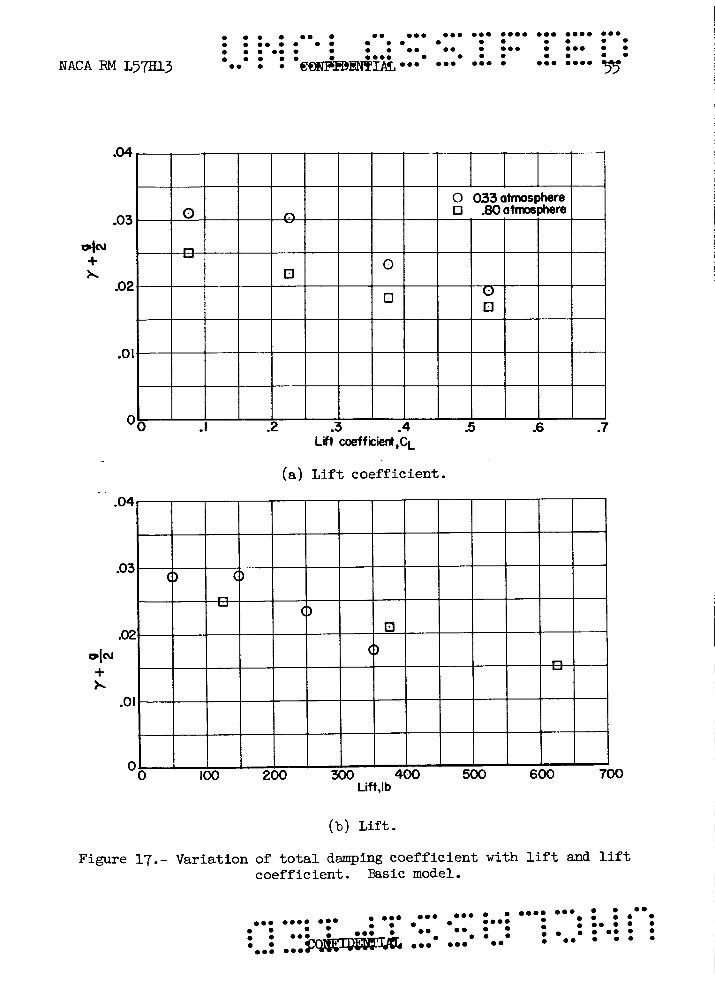
NACA RM L57Hl3
Lift coefficient,CL
(a) Lift coefficient.
(b) Lift.
Figure 17.- Variation of total damping coefficient with lift and lift coefficient. Basic model.
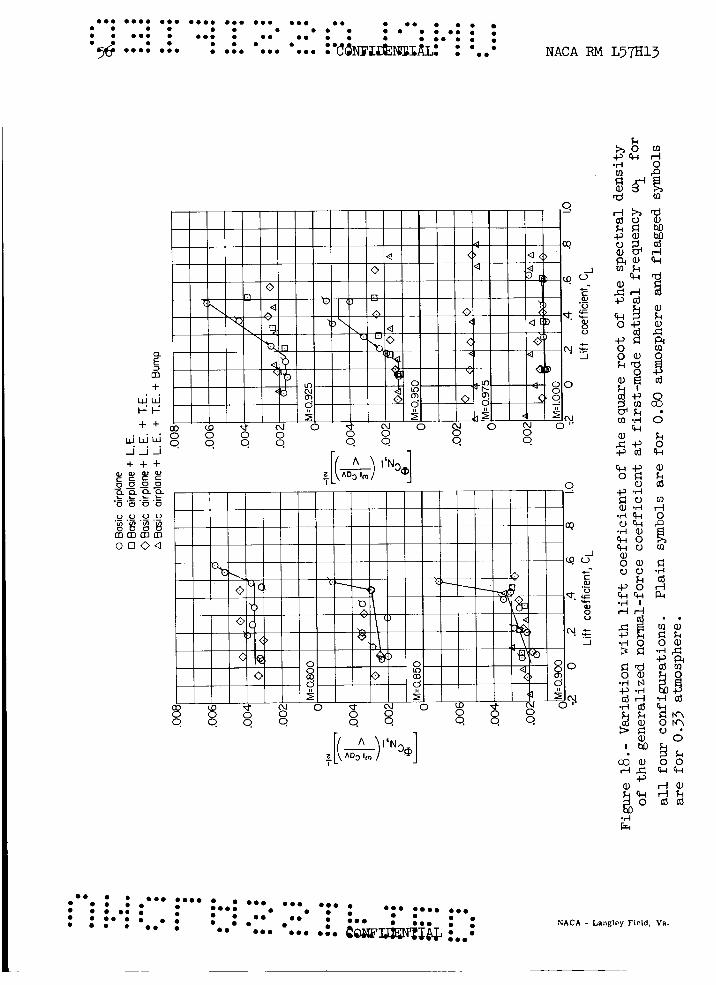
......................... . 0 . . 0 . 0 . 0 . 0 . . 0 . . ........ . . . . . . . . . . . . . . ...... . . . ....... 0 . ........... :*cdwz&mxh: : .... NACA RM L57H13
Q
5 m +
w w G G + +
q w d A i i + + +
o o o a
k Q ) k A 4 0 4 d k
NACA - Langley Field, Va.

· • • • • • • • ••
· • •• • • • • • •• • • • •
• •• • • • • • • •••
•• • • • • • ••• •• • •
•••• ••• • • ••• • • • •••• •••
•• ••• ••• • • • . , • •• •• •••• • • • • ••• •••
• ••• ••• • • • ••• • •• • • • •••• ••• •••
• • • • • •• ••• •••• ••• · · • • · · • • •• • ••• • • • • • • • •
• • • • ••• • ••• • ••
••• • • •••• ••• • • •• • •••• • • • • • • ... • • • • •• • • • • • • • • • • •• • • •• • •• • •• • • • •

••• • • • • • • •••
•• • • •• • • •••• • •••• • •• •
•••• • • •• • ••••
••• • • • •••
••••••• • • • • • •• •• •
•••• • ••• • •
• • •••• • • • • ••
••• • • • •••
0'
••• •• •
•
• ••
::: ·CetifJ DENTJ~ti: : ••• •••• • •••• ••• • • ••••
-,--, ' "
.n
... :' ~ .. "' . / .. 4 , ( ' . .. ' . . ,.
~ .--, .....
o·
• •••••••••••••••••••