luuk kapteijns, google · best paper towels best bbq supplies best doorbells +215% +173% +137%...
TRANSCRIPT

Luuk Kapteijns, Google
Consumer Search Insights


Got it, message sent
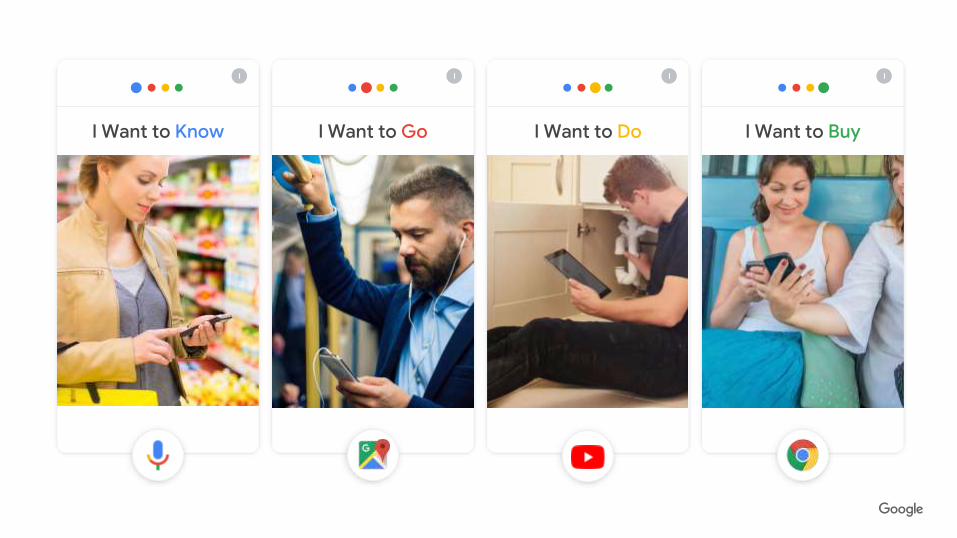
I Want to BuyI Want to DoI Want to GoI Want to Know


Curious/ˈkjʊərɪəs/
Demandingdɪˈmɑːndɪŋ/
Impatient/ɪmˈpeɪʃ(ə)nt/

Curious/ˈkjʊərɪəs/
Demandingdɪˈmɑːndɪŋ/
Impatient/ɪmˈpeɪʃ(ə)nt/
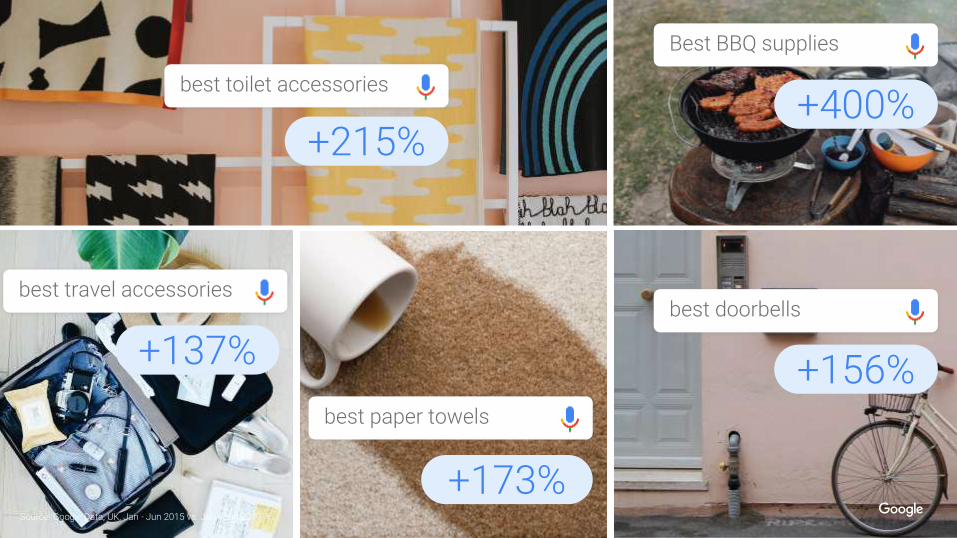
Source: Google Data, UK, Jan - Jun 2015 vs. Jan - Jun 2017.
best toilet accessories
best travel accessories
best paper towels
Best BBQ supplies
best doorbells
+215%
+173%
+137%
+400%
+156%

best umbrellas
best towels
best doorbells
best travel accessories


Curious/ˈkjʊərɪəs/
Demandingdɪˈmɑːndɪŋ/
Impatient/ɪmˈpeɪʃ(ə)nt/

Thai Food
Local searches without ‘near me’ have outgrown comparable searches thatinclude ‘near me’
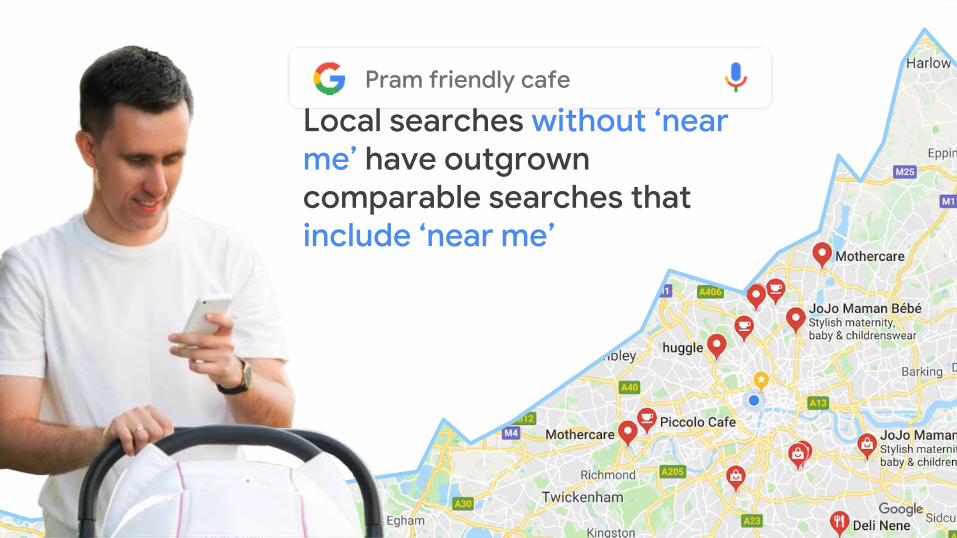
Pram friendly cafe
Local searches without ‘near me’ have outgrown comparable searches thatinclude ‘near me’

increase in mobile searches for
50%
Source: Google Data, US, Jan - June 2017 vs. Jan - June 2015.
Where to buy (product)
More than

Curious/ˈkjʊərɪəs/
Demandingdɪˈmɑːndɪŋ/
Impatient/ɪmˈpeɪʃ(ə)nt/

Increase in same day shipping searches
Increase in last minute travel searches
Increase in ‘open now’ searches
same day shipping last minute travel open now
2X185% 145%
Source: Google Data Jan - June 2017 vs. Jan - Jun 2015. US

Curious/ˈkjʊərɪəs/
Demandingdɪˈmɑːndɪŋ/
Impatient/ɪmˈpeɪʃ(ə)nt/

ASSIST
Show Up
Wise Up
Speed Up
assist /əˈsɪst/
help (someone), by doing a share of the work.

ASSIST
Show Up
Wise Up
Speed Up
assist /əˈsɪst/
help (someone), by doing a share of the work.


In store visits
10% increaseTested the impact that their online ads had on offline sales to help understand how their different channels were being used by customers

ASSIST
Show Up
Wise Up
Speed Up
assist /əˈsɪst/
help (someone), by doing a share of the work.


higher click-through rate
(CTR) than standard
users
37% higher conversion rate
than standard users
3.1X

Show Up
Wise Up
Speed Up
ASSIST
assist /əˈsɪst/
help (someone), by doing a share of the work.
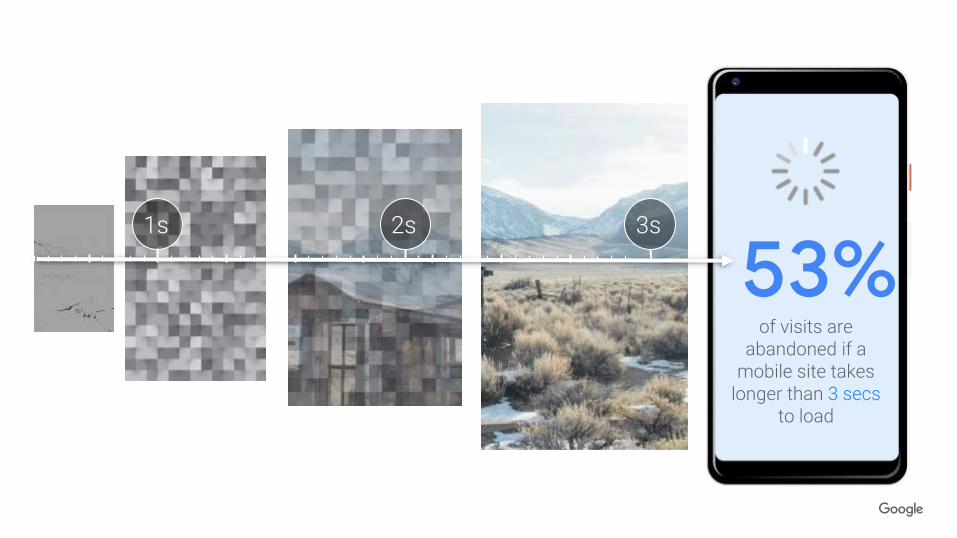
1s
of visits are abandoned if a
mobile site takes longer than 3 secs
to load
53%2s 3s


Improve site load time
(seconds)
11.7s to 3.5sDecrease in bounce rate
35%

ASSIST
Show Up
Wise Up
Speed Up
assist /əˈsɪst/
help (someone), by doing a share of the work.

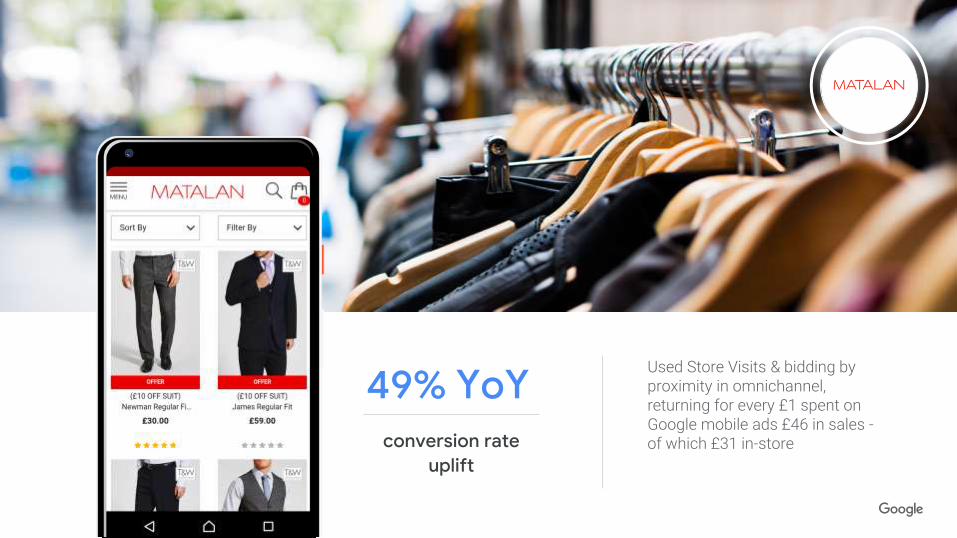
conversion rate uplift
49% YoYUsed Store Visits & bidding by proximity in omnichannel, returning for every £1 spent on Google mobile ads £46 in sales -of which £31 in-store
Proprietary + Confidential
The
Omnichannel customer is the new customer

Proprietary + ConfidentialProprietary + ConfidentialProprietary + Confidential
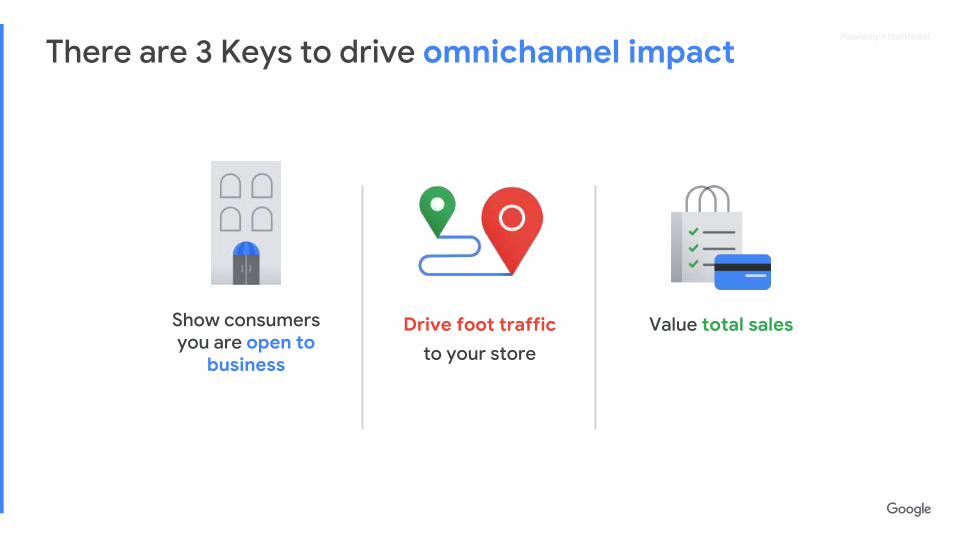
There are 3 keys to drive omnichannel impact
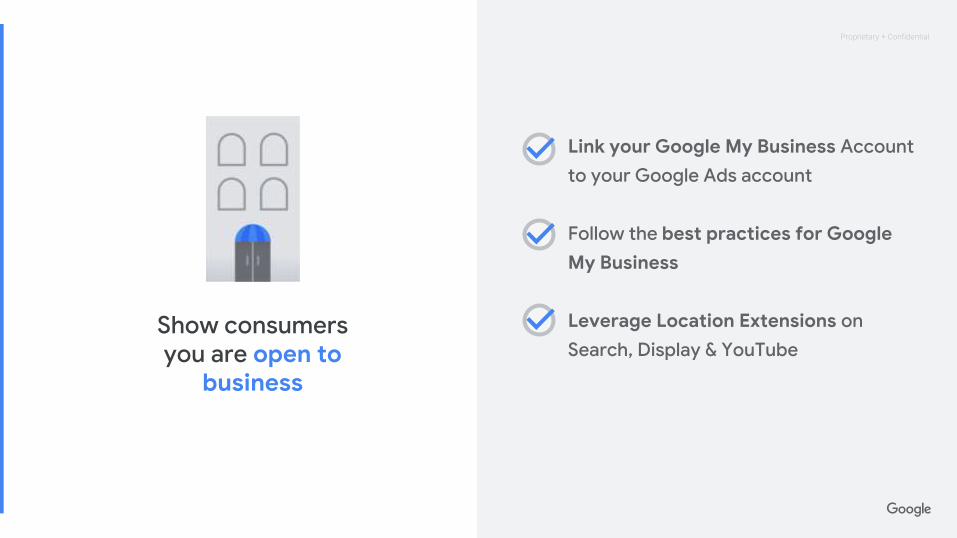
Show consumers you are open to
business
Drive foot trafficto your store
Value total sales
Proprietary + ConfidentialProprietary + Confidential
Link your Google My Business Account to your Google Ads account
Follow the best practices for Google
My Business
Leverage Location Extensions on Search, Display & YouTube
Show consumers you are open to
business

Proprietary + ConfidentialProprietary + Confidential
Show people you are open for business with Google My Business
Want to know more?Read GMB help centre
Proprietary + ConfidentialProprietary + Confidential
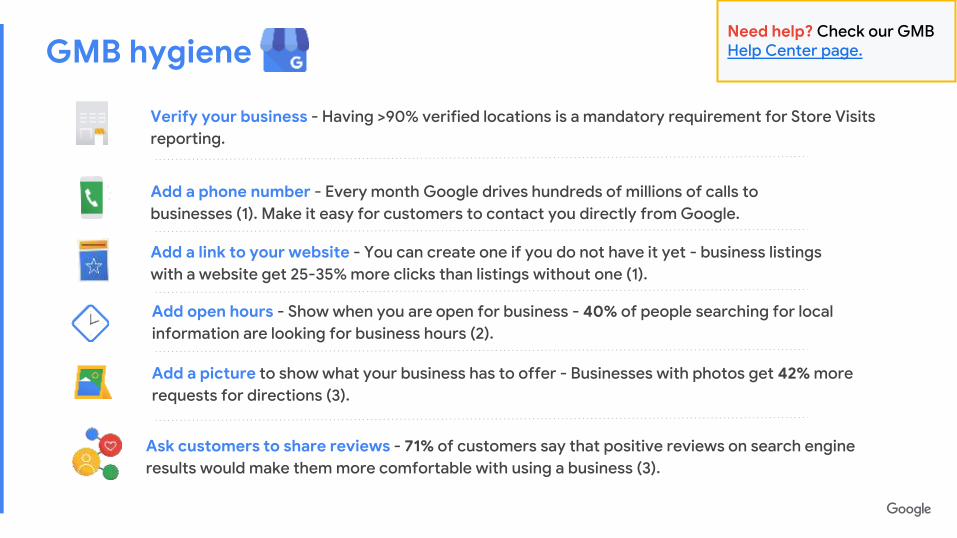
GMB hygieneNeed help? Check our GMB Help Center page.
Ask customers to share reviews - 71% of customers say that positive reviews on search engine results would make them more comfortable with using a business (3).
Verify your business - Having >90% verified locations is a mandatory requirement for Store Visits reporting.
Add a phone number - Every month Google drives hundreds of millions of calls to businesses (1). Make it easy for customers to contact you directly from Google.
Add a link to your website - You can create one if you do not have it yet - business listings with a website get 25-35% more clicks than listings without one (1).
Add open hours - Show when you are open for business - 40% of people searching for local information are looking for business hours (2).
Add a picture to show what your business has to offer - Businesses with photos get 42% more requests for directions (3).

Proprietary + ConfidentialProprietary + Confidential
Ads leveraging Location Extensions
see an average CTR uplift of ~10%
Direct consumers to your nearest stores with Location Extensions

Proprietary + ConfidentialProprietary + Confidential
Local Search Ads connect with consumers looking for local store information
Google.com Expanded Maps Results (Desktop)
Google Maps (Desktop)
Google Maps App (Android)

Proprietary + ConfidentialProprietary + Confidential
1. User clicks
address line
2. User presented
with Location Details
3. User scrolls for
further information
Location Extensions Unlock the Location Details Page

Proprietary + ConfidentialProprietary + Confidential
Capture nearby shoppers with YouTube Location ExtensionsShow local business info alongside a TrueView video ad & direct users to your business locations
Navigate to advertiser’s site
Get DirectionsCall the Business
Teaser
This section can include the following business data (through GMB)
● Business name
● Address (city, zip, country, etc)
● Phone number
● Business Hours (excl. holidays)
● (Store) Categories
● Review info

Proprietary + ConfidentialProprietary + Confidential
Target keywords & categories that drive the most in-store traffic
Leverage automation with Smart Bidding for Store Visits and Local Campaigns
If using manual bidding, adjust your bids around your store locations and on mobile
Drive foot trafficto your store

Proprietary + ConfidentialProprietary + Confidential
Using Store Visits to measure the Online to Offline impact of Search, Display & Video ads

Proprietary + ConfidentialProprietary + Confidential
Store Visits methodology
Visits store
Store
2
Ongoing data validation (surveys) with 5M+ user panel
Store Visits
Extrapolated to the populationaggregated and anonymized
3
Geometry, Wifi scanning
(200M+ locations)
GPS, Wifi triangulation,
Location history
Backend data
Clicks on an ad
Signed-in and opted into location history
User behavior
1

Proprietary + ConfidentialProprietary + Confidential
Budgeting, bidding & targeting decisions must incorporate the value of store visits that were influenced by your online advertising

Proprietary + ConfidentialProprietary + Confidential
I-Want-To-Do I-Want-To-Know I-Want-To-Buy
Identify and target search keywords which drive the most store traffic

Proprietary + ConfidentialProprietary + Confidential
Ever-growing signals makes it harder to tailor the right bid to each user’s context
Proprietary + ConfidentialProprietary + Confidential
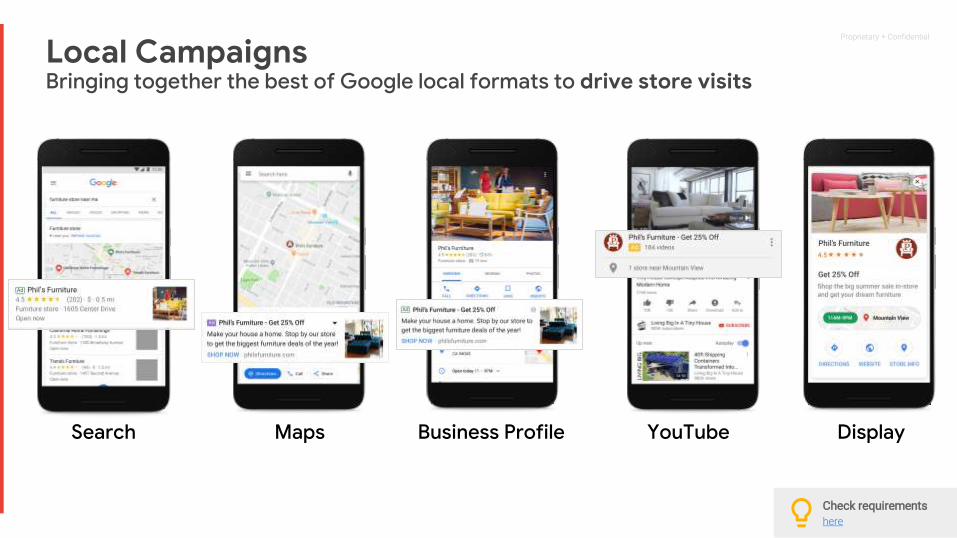
Local CampaignsBringing together the best of Google local formats to drive store visits
Search Maps Business Profile YouTube Display
Check requirements
here

Proprietary + ConfidentialProprietary + Confidential
Set your Store Visits value
Assess your omnichannel ROAS
Adjust budgets in campaigns with good omnichannel performance
Value total sales

Proprietary + ConfidentialProprietary + Confidential
Use Store Visits data to calculate your true ROAS
=$10m
online revenue
÷$2m
investment
50kconversions
200online AOV
X
5:1 ROAS
Online Sales
From Online
Tag
=$16m
offline revenue
÷$2m
investment
320kstore visits
25%in-store CVR
X$200
in-store AOVX
8:1 ROAS
Offline Sales
=$26m
Total revenue
÷$2m
investment
$10monline revenue
$16moffline revenue
+
13:1 ROAS
Total Sales
Your dataFrom SV
Reporting
Want to know more?Read help article here
Store Visits Value
Proprietary + ConfidentialProprietary + ConfidentialProprietary + Confidential
There are 3 Keys to drive omnichannel impact
Show consumers you are open to
business
Drive foot trafficto your store
Value total sales
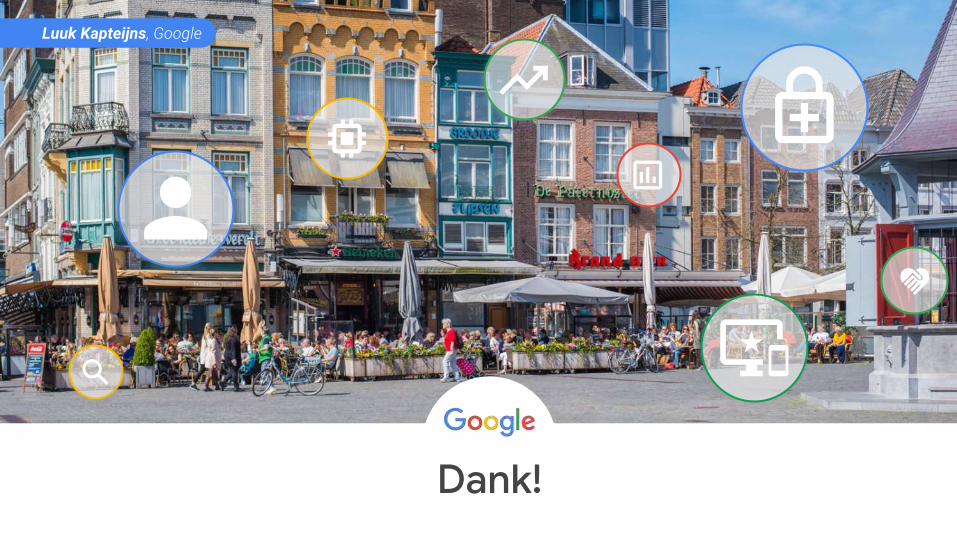
Luuk Kapteijns, Google
Dank!

Proprietary + ConfidentialProprietary + Confidential
Data points

Proprietary + Confidential
Storage Rental ServicesSearch query, ads and device trends in Netherlands
Quarterly update for: Q1 2019Created on: June 03, 2019

Proprietary + ConfidentialProprietary + Confidential
8% Overall search growth in Q1'19 compared to the previous year
44% Searches from mobile phones
50% Searches from computers
13% Change in CPC compared to the previous year
Focusing Facts
Storage Rental Services in Netherlands
Source: Google internal data for Storage Rental Services | Netherlands. Time period: Q1 2019
Proprietary + Confidential
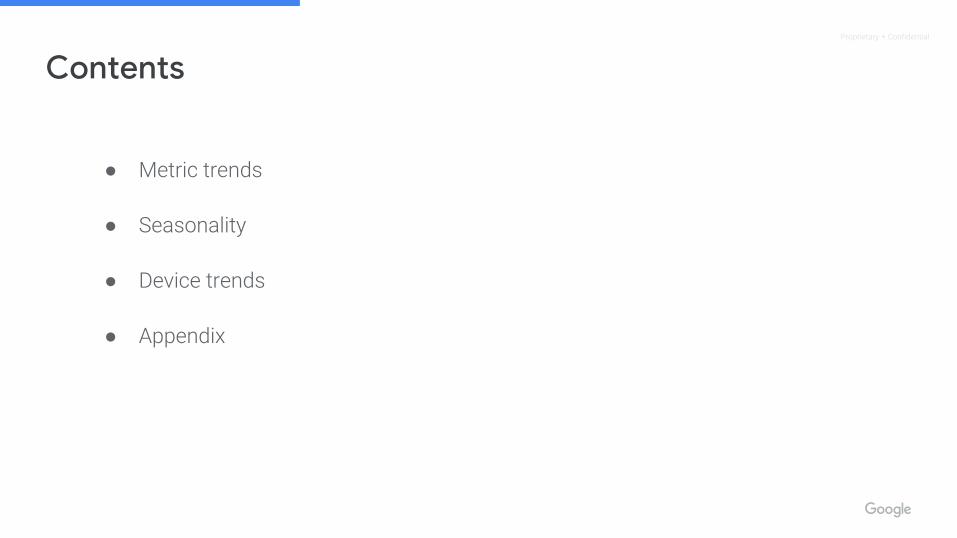
Contents
● Metric trends
● Seasonality
● Device trends
● Appendix

Proprietary + ConfidentialProprietary + Confidential
Metric trends

Proprietary + ConfidentialProprietary + Confidential
Storage Rental Services
Queries Imp Clicks Ad CTR CPC Ad Depth
YoY YoY YoY YoY Q1'19 YoY Q1'19 YoY Q1'19
Metrics snapshot - Q1 2019 and YoY growth - Q1'19 vs Q1'18
Mobile 24% ▲ 26% ▲ 18% ▲ -6% ▼ 8.3% 17% ▲ $2.19 3% ▲ 4.4
Tablet -8% ▼ -15% ▼ -15% ▼ -1% ▼ 8.2% 13% ▲ $2.27 -2% ▼ 4.8
Computer -1% ▼ 2% ▲ -8% ▼ -10% ▼ 5.5% 11% ▲ $2.52 7% ▲ 4.5
Overall 8% ▲ 10% ▲ 4% ▲ -6% ▼ 7.0% 13% ▲ $2.31 4% ▲ 4.5
Source: Google internal data for Storage Rental Services | Netherlands. Time period: Q1 2019

Proprietary + ConfidentialProprietary + Confidential
Queries
Queries grew 8% in Q1'19 with 44% of all searches on mobile.
Mobile 24% ▲ 4% ▲ 44%
Tablet -8% ▼ -2% ▼ 7%
Computer -1% ▼ 1% ▲ 50%
Overall 8% ▲ 2% ▲ 100%
Ind
exe
d q
ue
rie
s
Source: Google internal data for Storage Rental Services | Netherlands. Time period: Q1 2019
YoY growth (Q1'19-Q1'18)
QoQ growth
(Q1'19-Q4'18)
% of queries
(Q1'19)

Proprietary + ConfidentialProprietary + Confidential
Impressions
Impressions grew 10% in Q1'19 with 48% of all ad impressions on mobile.
Mobile 26% ▲ 6% ▲ 48%
Tablet -15% ▼ -2% ▼ 8%
Computer 2% ▲ 1% ▲ 44%
Overall 10% ▲ 3% ▲ 100%
Ind
exe
d im
pre
ss
ion
s
Source: Google internal data for Storage Rental Services | Netherlands. Time period: Q1 2019
% of imp (Q1'19)
YoY growth (Q1'19-Q1'18)
QoQ growth
(Q1'19-Q4'18)

Proprietary + ConfidentialProprietary + Confidential
Clicks
Clicks grew 4% in Q1'19 with 56% of all clicks on mobile.
Mobile 18% ▲ 7% ▲ 56%
Tablet -15% ▼ -2% ▼ 10%
Computer -8% ▼ 2% ▲ 34%
Overall 4% ▲ 4% ▲ 100%
Ind
exe
d c
licks
Source: Google internal data for Storage Rental Services | Netherlands. Time period: Q1 2019
% of clicks (Q1'19)
YoY growth (Q1'19-Q1'18)
QoQ growth
(Q1'19-Q4'18)

Proprietary + ConfidentialProprietary + Confidential
Ad CTR
CTR grew -6% YoY and was 7.0% in Q1'19.
Mobile -6% ▼ 1% ▲ 8.3%
Tablet -1% ▼ 0% 8.2%
Computer -10% ▼ 0% 5.5%
Overall -6% ▼ 1% ▲ 7.0%
Ad
CT
R
Source: Google internal data for Storage Rental Services | Netherlands. Time period: Q1 2019
Ad CTR (Q1'19)
YoY growth (Q1'19-Q1'18)
QoQ growth
(Q1'19-Q4'18)

Proprietary + ConfidentialProprietary + Confidential
CPC
CPC grew 13% YoY and was $2.31 in Q1'19.
Mobile 17% ▲ -4% ▼ $2.19
Tablet 13% ▲ -6% ▼ $2.27
Computer 11% ▲ -2% ▼ $2.52
Overall 13% ▲ -4% ▼ $2.31
CP
C
Source: Google internal data for Storage Rental Services | Netherlands. Time period: Q1 2019
CPC (Q1'19)
YoY growth (Q1'19-Q1'18)
QoQ growth
(Q1'19-Q4'18)

Proprietary + ConfidentialProprietary + Confidential
Ad Depth
Ad Depth grew 4% YoY and was 4.5 in Q1'19.
Mobile 3% ▲ -1% ▼ 4.4
Tablet -2% ▼ -2% ▼ 4.8
Computer 7% ▲ -0% ▼ 4.5
Overall 4% ▲ -1% ▼ 4.5
Ad
De
pth
Source: Google internal data for Storage Rental Services | Netherlands. Time period: Q1 2019
Ad Depth
(Q1'19)YoY growth
(Q1'19-Q1'18)
QoQ growth
(Q1'19-Q4'18)

Proprietary + ConfidentialProprietary + Confidential
Seasonality

Proprietary + ConfidentialProprietary + Confidential
Seasonality - Queries and Impressions
Queries Impressions
Ind
exe
d q
ue
rie
s
Ind
exe
d im
pre
ss
ion
sSource: Google internal data for Storage Rental Services | Netherlands. Time period: Q1 2019

Proprietary + ConfidentialProprietary + Confidential
Seasonality - Clicks and CPC
Clicks CPC
Ind
exe
d c
licks
CP
CSource: Google internal data for Storage Rental Services | Netherlands. Time period: Q1 2019

Proprietary + ConfidentialProprietary + Confidential
Seasonality - Ad CTR and Ad Depth
Ad CTR Ad Depth
Ad
CT
R
Ad
De
pth
Source: Google internal data for Storage Rental Services | Netherlands. Time period: Q1 2019

Proprietary + ConfidentialProprietary + Confidential
Jan Feb Mar Apr Sep Oct Nov DecMay Jun Jul Aug
Queries
CPC
62 77
$2.07 $2.23
Monthly seasonal patterns in queries and CPC
In the last 4 years, CPCs were in the range of $2.07-$2.23 and peaked in Jun.Category searches have consistently peaked in Oct.
⤓ ⤒
⤒ ⤓
Source: Google internal data for Storage Rental Services | Netherlands. Time period: Q1 2019
⤓
⤓
⤒
⤒

Proprietary + ConfidentialProprietary + Confidential
Queries CPC
2018-07-29
2018-06-25
2018-06-25
2018-07-14
Week Mon Tue Wed Thu Fri Sat Sun Week Mon Tue Wed Thu Fri Sat Sun
Note: This is not a forecast for the next 8 weeks. It’s a daily view of key metrics from
last year near today’s date.56 100 $2.13 $2.65
Highest
Lowest
Highest
Lowest
The next 8 weeks: search trends from last year
2018-06-04
2018-06-11
2018-06-18
2018-06-25
2018-07-02
2018-07-09
2018-07-16
2018-07-23
2018-06-04
2018-06-11
2018-06-18
2018-06-25
2018-07-02
2018-07-09
2018-07-16
2018-07-23
⤒
⤓
⤓
⤒
Source: Google internal data for Storage Rental Services | Netherlands. Time period: Q1 2019
⤓ ⤓ ⤒⤒

Proprietary + ConfidentialProprietary + Confidential
Device trends

Proprietary + ConfidentialProprietary + Confidential
Storage Rental Services
YoY query growth by device in Q1'19 vs Q1'18
24% ▲ -8% ▼ -1% ▼
Source: Google internal data for Storage Rental Services | Netherlands. Time period: Q1 2019

Proprietary + ConfidentialProprietary + Confidential
Query Mix across devices
43.9% of all Storage Rental Services related searches in Q1 2019 were on mobile devices
Source: Google internal data for Storage Rental Services | Netherlands. Time period: Q1 2019

Proprietary + ConfidentialProprietary + Confidential
Mobile dynamics
CP
C
Ad
CT
R
Source: Google internal data for Storage Rental Services | Netherlands. Time period: Q1 2019
Proprietary + ConfidentialProprietary + Confidential
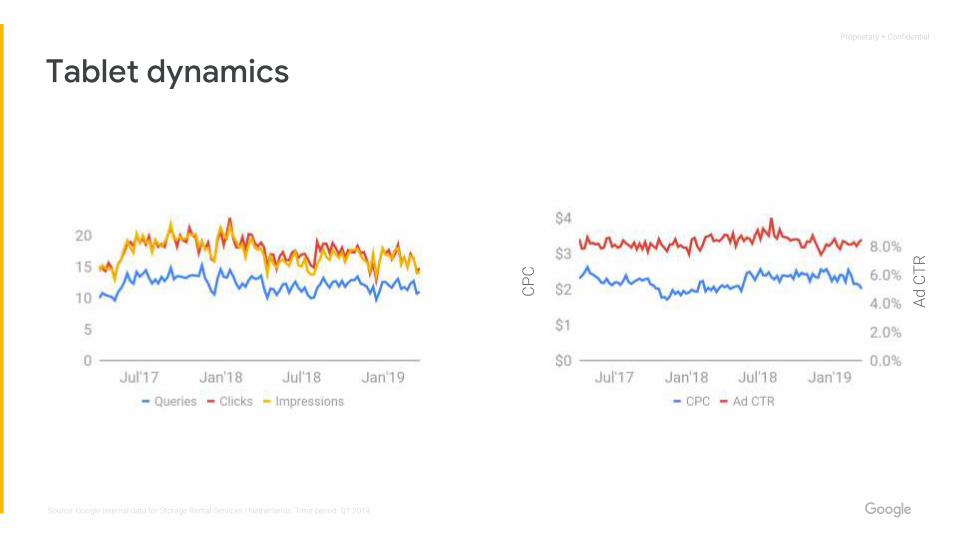
Tablet dynamics
CP
C
Ad
CT
R
Source: Google internal data for Storage Rental Services | Netherlands. Time period: Q1 2019

Proprietary + ConfidentialProprietary + Confidential
Computer dynamics
CP
C
Ad
CT
R
Source: Google internal data for Storage Rental Services | Netherlands. Time period: Q1 2019

Proprietary + ConfidentialProprietary + Confidential
‘All Devices’ dynamics
CP
C
Ad
CT
R
Source: Google internal data for Storage Rental Services | Netherlands. Time period: Q1 2019

Proprietary + ConfidentialProprietary + Confidential
Appendix

Proprietary + ConfidentialProprietary + Confidential
Metric definitions
● Impressions: Ads shown against search queries on Google Search (indexed to 100)
● Queries: Searches by users on Google Search (indexed to 100)
● Clicks: Clicks on ads shown against search queries on Google Search (indexed to 100)
● CPC: Cost per Click (Cost ÷ Clicks) in USD
● Ad CTR: Click-through Rate (Clicks ÷ Impressions) in percent
● Ad Depth: No. of ads shown whenever a search showed ads (Impressions ÷ Queries with ads)
Source: Google internal data for Storage Rental Services | Netherlands. Time period: Q1 2019

Proprietary + ConfidentialProprietary + Confidential
Metric calculations
● Last Quarter: Most recent quarter whose earnings have been announced. It’s currently Q1 2019.
● All growth metrics are calculated by comparing metrics between 2 full quarter time periods.
○ YoY compares Q1'19 to Q1'18 and QoQ Q1'19 to Q4'18.
○ For example, QoQ query growth = (No. of searches in entire Q1'19 - No. of searches in entire Q4'18) ÷ (No. of searches
in entire Q4'18).
● Query mix: This indicates relative spread of searches by device.
For Mobile, it’s (No. of searches on Mobile) ÷ (No. of searches on all devices).
Source: Google internal data for Storage Rental Services | Netherlands. Time period: Q1 2019

Proprietary + ConfidentialProprietary + Confidential
Heatmap slides
● Monthly Average - Monthly average from last 4 years
○ Shows a high level monthly view to quickly spot what months have consistently peaked and complements the
time series charts.
● Next 8 weeks heatmap of CPC and queries showing peak/low days from last year
○ This is NOT a forecast for the next 8 weeks. It’s a daily view of last year’s metrics to understand recency of trends.
Useful to understand how many days a seasonal high lasts.
○ It starts from the closest Monday from today's date last year. For example, if you ran the report on Jan 13, 2017,
the data is from Jan 18, 2016, which is the closest Monday in the future from Jan 13, 2016.
Source: Google internal data for Storage Rental Services | Netherlands. Time period: Q1 2019

Proprietary + Confidential
Storage Rental ServicesSearch query, ads and device trends in Belgium
Quarterly update for: Q1 2019Created on: June 03, 2019

Proprietary + ConfidentialProprietary + Confidential
21% Overall search growth in Q1'19 compared to the previous year
37% Searches from mobile phones
57% Searches from computers
9% Change in CPC compared to the previous year
Focusing Facts
Storage Rental Services in Belgium
Source: Google internal data for Storage Rental Services | Belgium. Time period: Q1 2019

Proprietary + Confidential
Contents
● Metric trends
● Seasonality
● Device trends
● Appendix

Proprietary + ConfidentialProprietary + Confidential
Metric trends

Proprietary + ConfidentialProprietary + Confidential
Storage Rental Services
Queries Imp Clicks Ad CTR CPC Ad Depth
YoY YoY YoY YoY Q1'19 YoY Q1'19 YoY Q1'19
Metrics snapshot - Q1 2019 and YoY growth - Q1'19 vs Q1'18
Mobile 37% ▲ 44% ▲ 32% ▲ -9% ▼ 9.9% 12% ▲ $2.18 7% ▲ 3.9
Tablet 0% 1% ▲ -8% ▼ -9% ▼ 8.3% -3% ▼ $1.83 5% ▲ 4.5
Computer 14% ▲ 14% ▲ -4% ▼ -16% ▼ 6.6% 5% ▲ $1.95 8% ▲ 3.8
Overall 21% ▲ 24% ▲ 12% ▲ -10% ▼ 8.2% 9% ▲ $2.06 7% ▲ 3.9
Source: Google internal data for Storage Rental Services | Belgium. Time period: Q1 2019
Proprietary + ConfidentialProprietary + Confidential
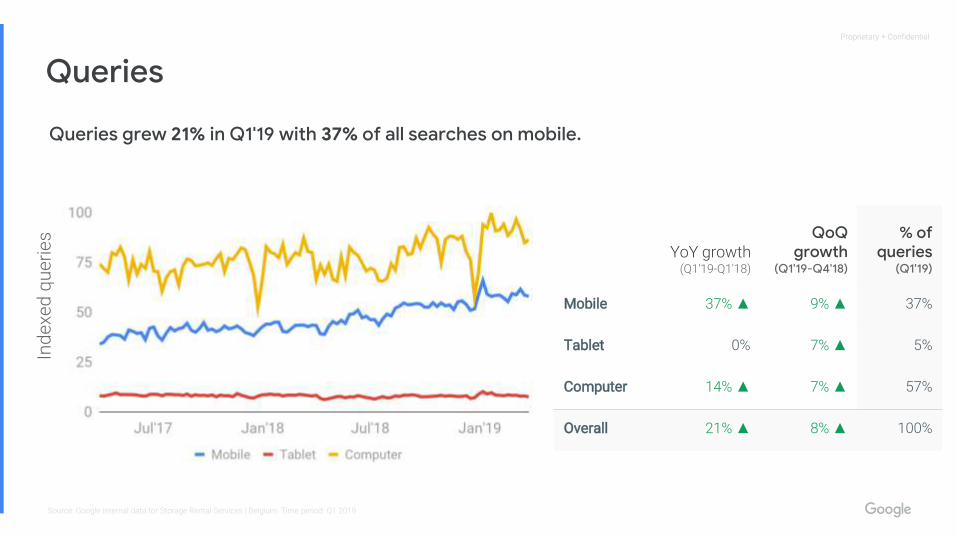
Queries
Queries grew 21% in Q1'19 with 37% of all searches on mobile.
Mobile 37% ▲ 9% ▲ 37%
Tablet 0% 7% ▲ 5%
Computer 14% ▲ 7% ▲ 57%
Overall 21% ▲ 8% ▲ 100%
Ind
exe
d q
ue
rie
s
Source: Google internal data for Storage Rental Services | Belgium. Time period: Q1 2019
YoY growth (Q1'19-Q1'18)
QoQ growth
(Q1'19-Q4'18)
% of queries
(Q1'19)
Proprietary + ConfidentialProprietary + Confidential
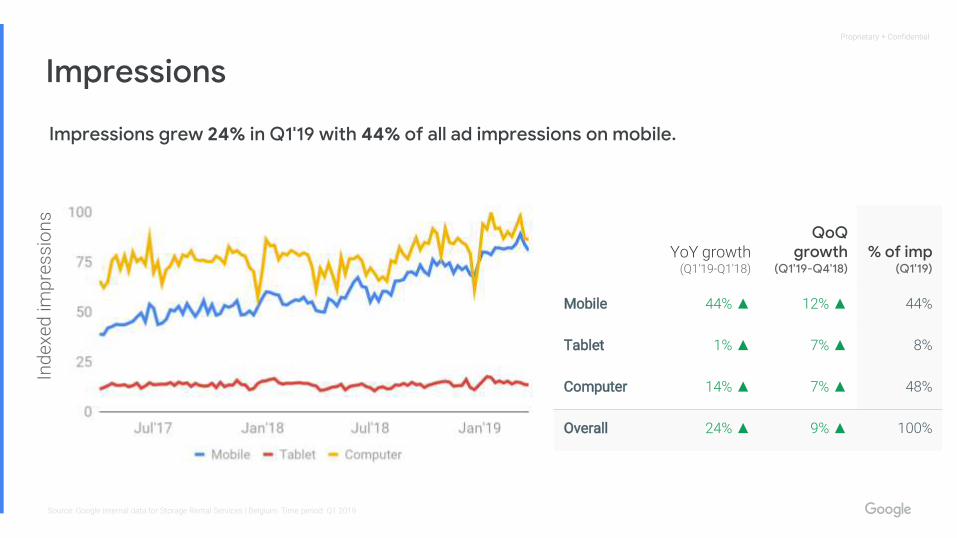
Impressions
Impressions grew 24% in Q1'19 with 44% of all ad impressions on mobile.
Mobile 44% ▲ 12% ▲ 44%
Tablet 1% ▲ 7% ▲ 8%
Computer 14% ▲ 7% ▲ 48%
Overall 24% ▲ 9% ▲ 100%
Ind
exe
d im
pre
ss
ion
s
Source: Google internal data for Storage Rental Services | Belgium. Time period: Q1 2019
% of imp (Q1'19)
YoY growth (Q1'19-Q1'18)
QoQ growth
(Q1'19-Q4'18)

Proprietary + ConfidentialProprietary + Confidential
Clicks
Clicks grew 12% in Q1'19 with 53% of all clicks on mobile.
Mobile 32% ▲ 13% ▲ 53%
Tablet -8% ▼ 9% ▲ 8%
Computer -4% ▼ 7% ▲ 39%
Overall 12% ▲ 10% ▲ 100%
Ind
exe
d c
licks
Source: Google internal data for Storage Rental Services | Belgium. Time period: Q1 2019
% of clicks (Q1'19)
YoY growth (Q1'19-Q1'18)
QoQ growth
(Q1'19-Q4'18)
Proprietary + ConfidentialProprietary + Confidential
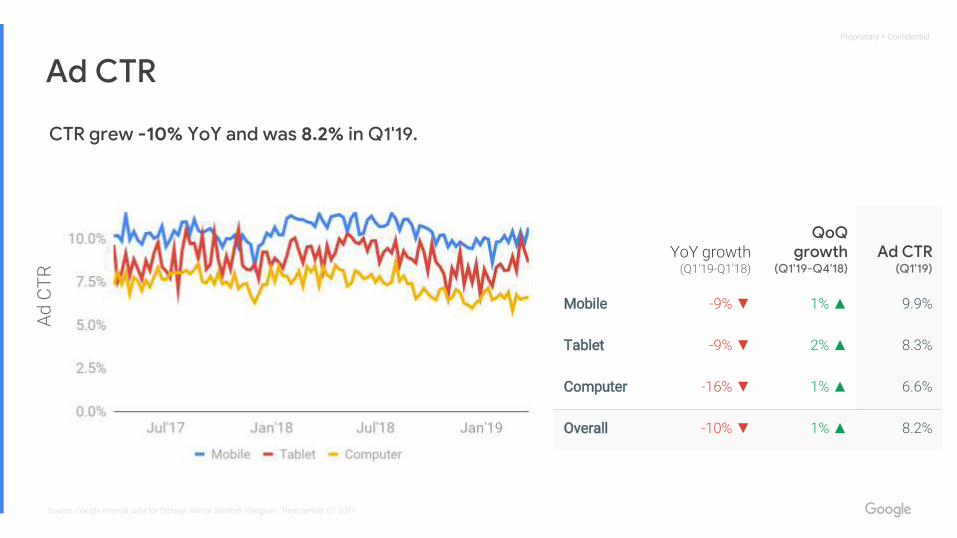
Ad CTR
CTR grew -10% YoY and was 8.2% in Q1'19.
Mobile -9% ▼ 1% ▲ 9.9%
Tablet -9% ▼ 2% ▲ 8.3%
Computer -16% ▼ 1% ▲ 6.6%
Overall -10% ▼ 1% ▲ 8.2%
Ad
CT
R
Source: Google internal data for Storage Rental Services | Belgium. Time period: Q1 2019
Ad CTR (Q1'19)
YoY growth (Q1'19-Q1'18)
QoQ growth
(Q1'19-Q4'18)

Proprietary + ConfidentialProprietary + Confidential
CPC
CPC grew 9% YoY and was $2.06 in Q1'19.
Mobile 12% ▲ -2% ▼ $2.18
Tablet -3% ▼ -7% ▼ $1.83
Computer 5% ▲ -1% ▼ $1.95
Overall 9% ▲ -2% ▼ $2.06
CP
C
Source: Google internal data for Storage Rental Services | Belgium. Time period: Q1 2019
CPC (Q1'19)
YoY growth (Q1'19-Q1'18)
QoQ growth
(Q1'19-Q4'18)

Proprietary + ConfidentialProprietary + Confidential
Ad Depth
Ad Depth grew 7% YoY and was 3.9 in Q1'19.
Mobile 7% ▲ 4% ▲ 3.9
Tablet 5% ▲ 1% ▲ 4.5
Computer 8% ▲ 2% ▲ 3.8
Overall 7% ▲ 3% ▲ 3.9
Ad
De
pth
Source: Google internal data for Storage Rental Services | Belgium. Time period: Q1 2019
Ad Depth
(Q1'19)YoY growth
(Q1'19-Q1'18)
QoQ growth
(Q1'19-Q4'18)

Proprietary + ConfidentialProprietary + Confidential
Seasonality

Proprietary + ConfidentialProprietary + Confidential
Seasonality - Queries and Impressions
Queries Impressions
Ind
exe
d q
ue
rie
s
Ind
exe
d im
pre
ss
ion
sSource: Google internal data for Storage Rental Services | Belgium. Time period: Q1 2019
Proprietary + ConfidentialProprietary + Confidential
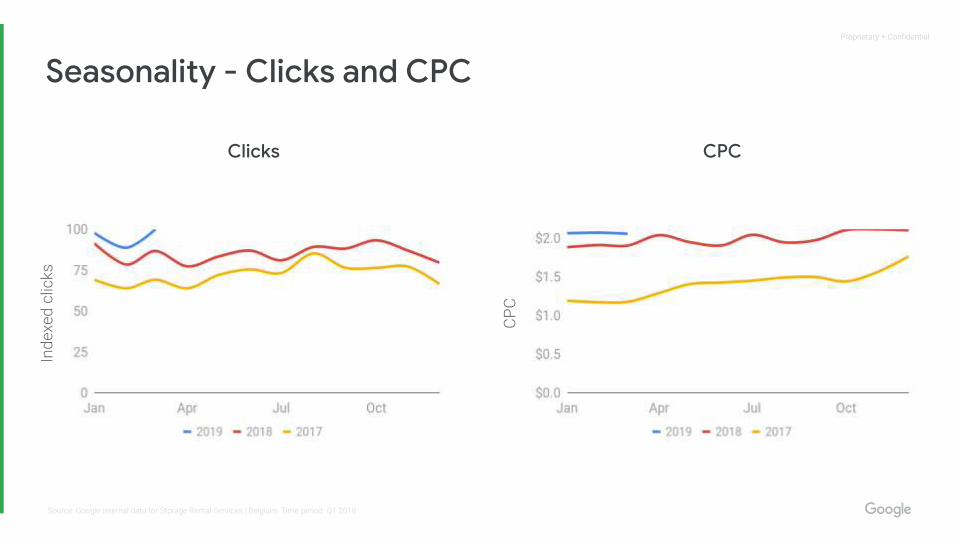
Seasonality - Clicks and CPC
Clicks CPC
Ind
exe
d c
licks
CP
CSource: Google internal data for Storage Rental Services | Belgium. Time period: Q1 2019
Proprietary + ConfidentialProprietary + Confidential
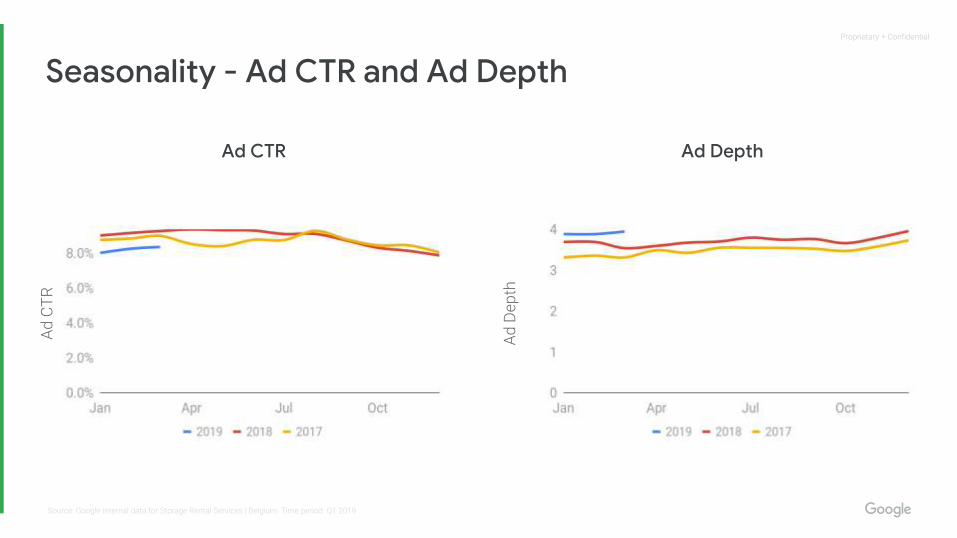
Seasonality - Ad CTR and Ad Depth
Ad CTR Ad Depth
Ad
CT
R
Ad
De
pth
Source: Google internal data for Storage Rental Services | Belgium. Time period: Q1 2019

Proprietary + ConfidentialProprietary + Confidential
Jan Feb Mar Apr Sep Oct Nov DecMay Jun Jul Aug
Queries
CPC
62 75
$1.46 $1.58
Monthly seasonal patterns in queries and CPC
In the last 4 years, CPCs were in the range of $1.46-$1.58 and peaked in Dec.Category searches have consistently peaked in Jan.
⤒ ⤓
⤓ ⤒
Source: Google internal data for Storage Rental Services | Belgium. Time period: Q1 2019
⤓
⤓
⤒
⤒

Proprietary + ConfidentialProprietary + Confidential
Queries CPC
2018-07-22
2018-06-14
2018-06-12
2018-07-14
Week Mon Tue Wed Thu Fri Sat Sun Week Mon Tue Wed Thu Fri Sat Sun
Note: This is not a forecast for the next 8 weeks. It’s a daily view of key metrics from
last year near today’s date.42 100 $1.50 $2.70
Highest
Lowest
Highest
Lowest
The next 8 weeks: search trends from last year
2018-06-04
2018-06-11
2018-06-18
2018-06-25
2018-07-02
2018-07-09
2018-07-16
2018-07-23
2018-06-04
2018-06-11
2018-06-18
2018-06-25
2018-07-02
2018-07-09
2018-07-16
2018-07-23
⤒
⤓
⤓
⤒
Source: Google internal data for Storage Rental Services | Belgium. Time period: Q1 2019
⤓ ⤓ ⤒⤒

Proprietary + ConfidentialProprietary + Confidential
Device trends

Proprietary + ConfidentialProprietary + Confidential
Storage Rental Services
YoY query growth by device in Q1'19 vs Q1'18
37% ▲ 0% ▲ 14% ▲
Source: Google internal data for Storage Rental Services | Belgium. Time period: Q1 2019

Proprietary + ConfidentialProprietary + Confidential
Query Mix across devices
37.4% of all Storage Rental Services related searches in Q1 2019 were on mobile devices
Source: Google internal data for Storage Rental Services | Belgium. Time period: Q1 2019

Proprietary + ConfidentialProprietary + Confidential
Mobile dynamics
CP
C
Ad
CT
R
Source: Google internal data for Storage Rental Services | Belgium. Time period: Q1 2019

Proprietary + ConfidentialProprietary + Confidential
Tablet dynamics
CP
C
Ad
CT
R
Source: Google internal data for Storage Rental Services | Belgium. Time period: Q1 2019

Proprietary + ConfidentialProprietary + Confidential
Computer dynamics
CP
C
Ad
CT
R
Source: Google internal data for Storage Rental Services | Belgium. Time period: Q1 2019

Proprietary + ConfidentialProprietary + Confidential
‘All Devices’ dynamics
CP
C
Ad
CT
R
Source: Google internal data for Storage Rental Services | Belgium. Time period: Q1 2019

Proprietary + ConfidentialProprietary + Confidential
Appendix

Proprietary + ConfidentialProprietary + Confidential
Metric definitions
● Impressions: Ads shown against search queries on Google Search (indexed to 100)
● Queries: Searches by users on Google Search (indexed to 100)
● Clicks: Clicks on ads shown against search queries on Google Search (indexed to 100)
● CPC: Cost per Click (Cost ÷ Clicks) in USD
● Ad CTR: Click-through Rate (Clicks ÷ Impressions) in percent
● Ad Depth: No. of ads shown whenever a search showed ads (Impressions ÷ Queries with ads)
Source: Google internal data for Storage Rental Services | Belgium. Time period: Q1 2019

Proprietary + ConfidentialProprietary + Confidential
Metric calculations
● Last Quarter: Most recent quarter whose earnings have been announced. It’s currently Q1 2019.
● All growth metrics are calculated by comparing metrics between 2 full quarter time periods.
○ YoY compares Q1'19 to Q1'18 and QoQ Q1'19 to Q4'18.
○ For example, QoQ query growth = (No. of searches in entire Q1'19 - No. of searches in entire Q4'18) ÷ (No. of searches
in entire Q4'18).
● Query mix: This indicates relative spread of searches by device.
For Mobile, it’s (No. of searches on Mobile) ÷ (No. of searches on all devices).
Source: Google internal data for Storage Rental Services | Belgium. Time period: Q1 2019

Proprietary + ConfidentialProprietary + Confidential
Heatmap slides
● Monthly Average - Monthly average from last 4 years
○ Shows a high level monthly view to quickly spot what months have consistently peaked and complements the
time series charts.
● Next 8 weeks heatmap of CPC and queries showing peak/low days from last year
○ This is NOT a forecast for the next 8 weeks. It’s a daily view of last year’s metrics to understand recency of trends.
Useful to understand how many days a seasonal high lasts.
○ It starts from the closest Monday from today's date last year. For example, if you ran the report on Jan 13, 2017,
the data is from Jan 18, 2016, which is the closest Monday in the future from Jan 13, 2016.
Source: Google internal data for Storage Rental Services | Belgium. Time period: Q1 2019