lumni takes the us stage
TRANSCRIPT
International Management
LUMNI TAKES THE US STAGE

Milton Friedman

David Bowie

Muhammad Ali

UNIVERSITY STUDENT
Financing Payment
for educationEducation and related services
Payment after graduationSocial and financial return
HOW IT WORKS
LUMNIINVESTORS

MARKET PROFILE
THE HARD FACTS WORTH THE EFFORT
THAT DEBT IS TROUBLE STUDENT LOANS
COMPETITION LEGAL ISSUES
IMCOME DISTRIBUTION

THE HARD FACTS
30%OF PEOPLE WILL
NEVER BE ABLE TO REPAY THE DEBT
$1 TRILLIONOF STUDENT LOANS
37 MILLIONBORROWERS
75%OF COLLEGE GRADUATES ARE WORKING AT JOBS
THAT REQUIRE A DEGREE
30%SAY DEBT HAD AN
IMPACT ON CAREER CHOICES
$33 000AVERAGE DEBT
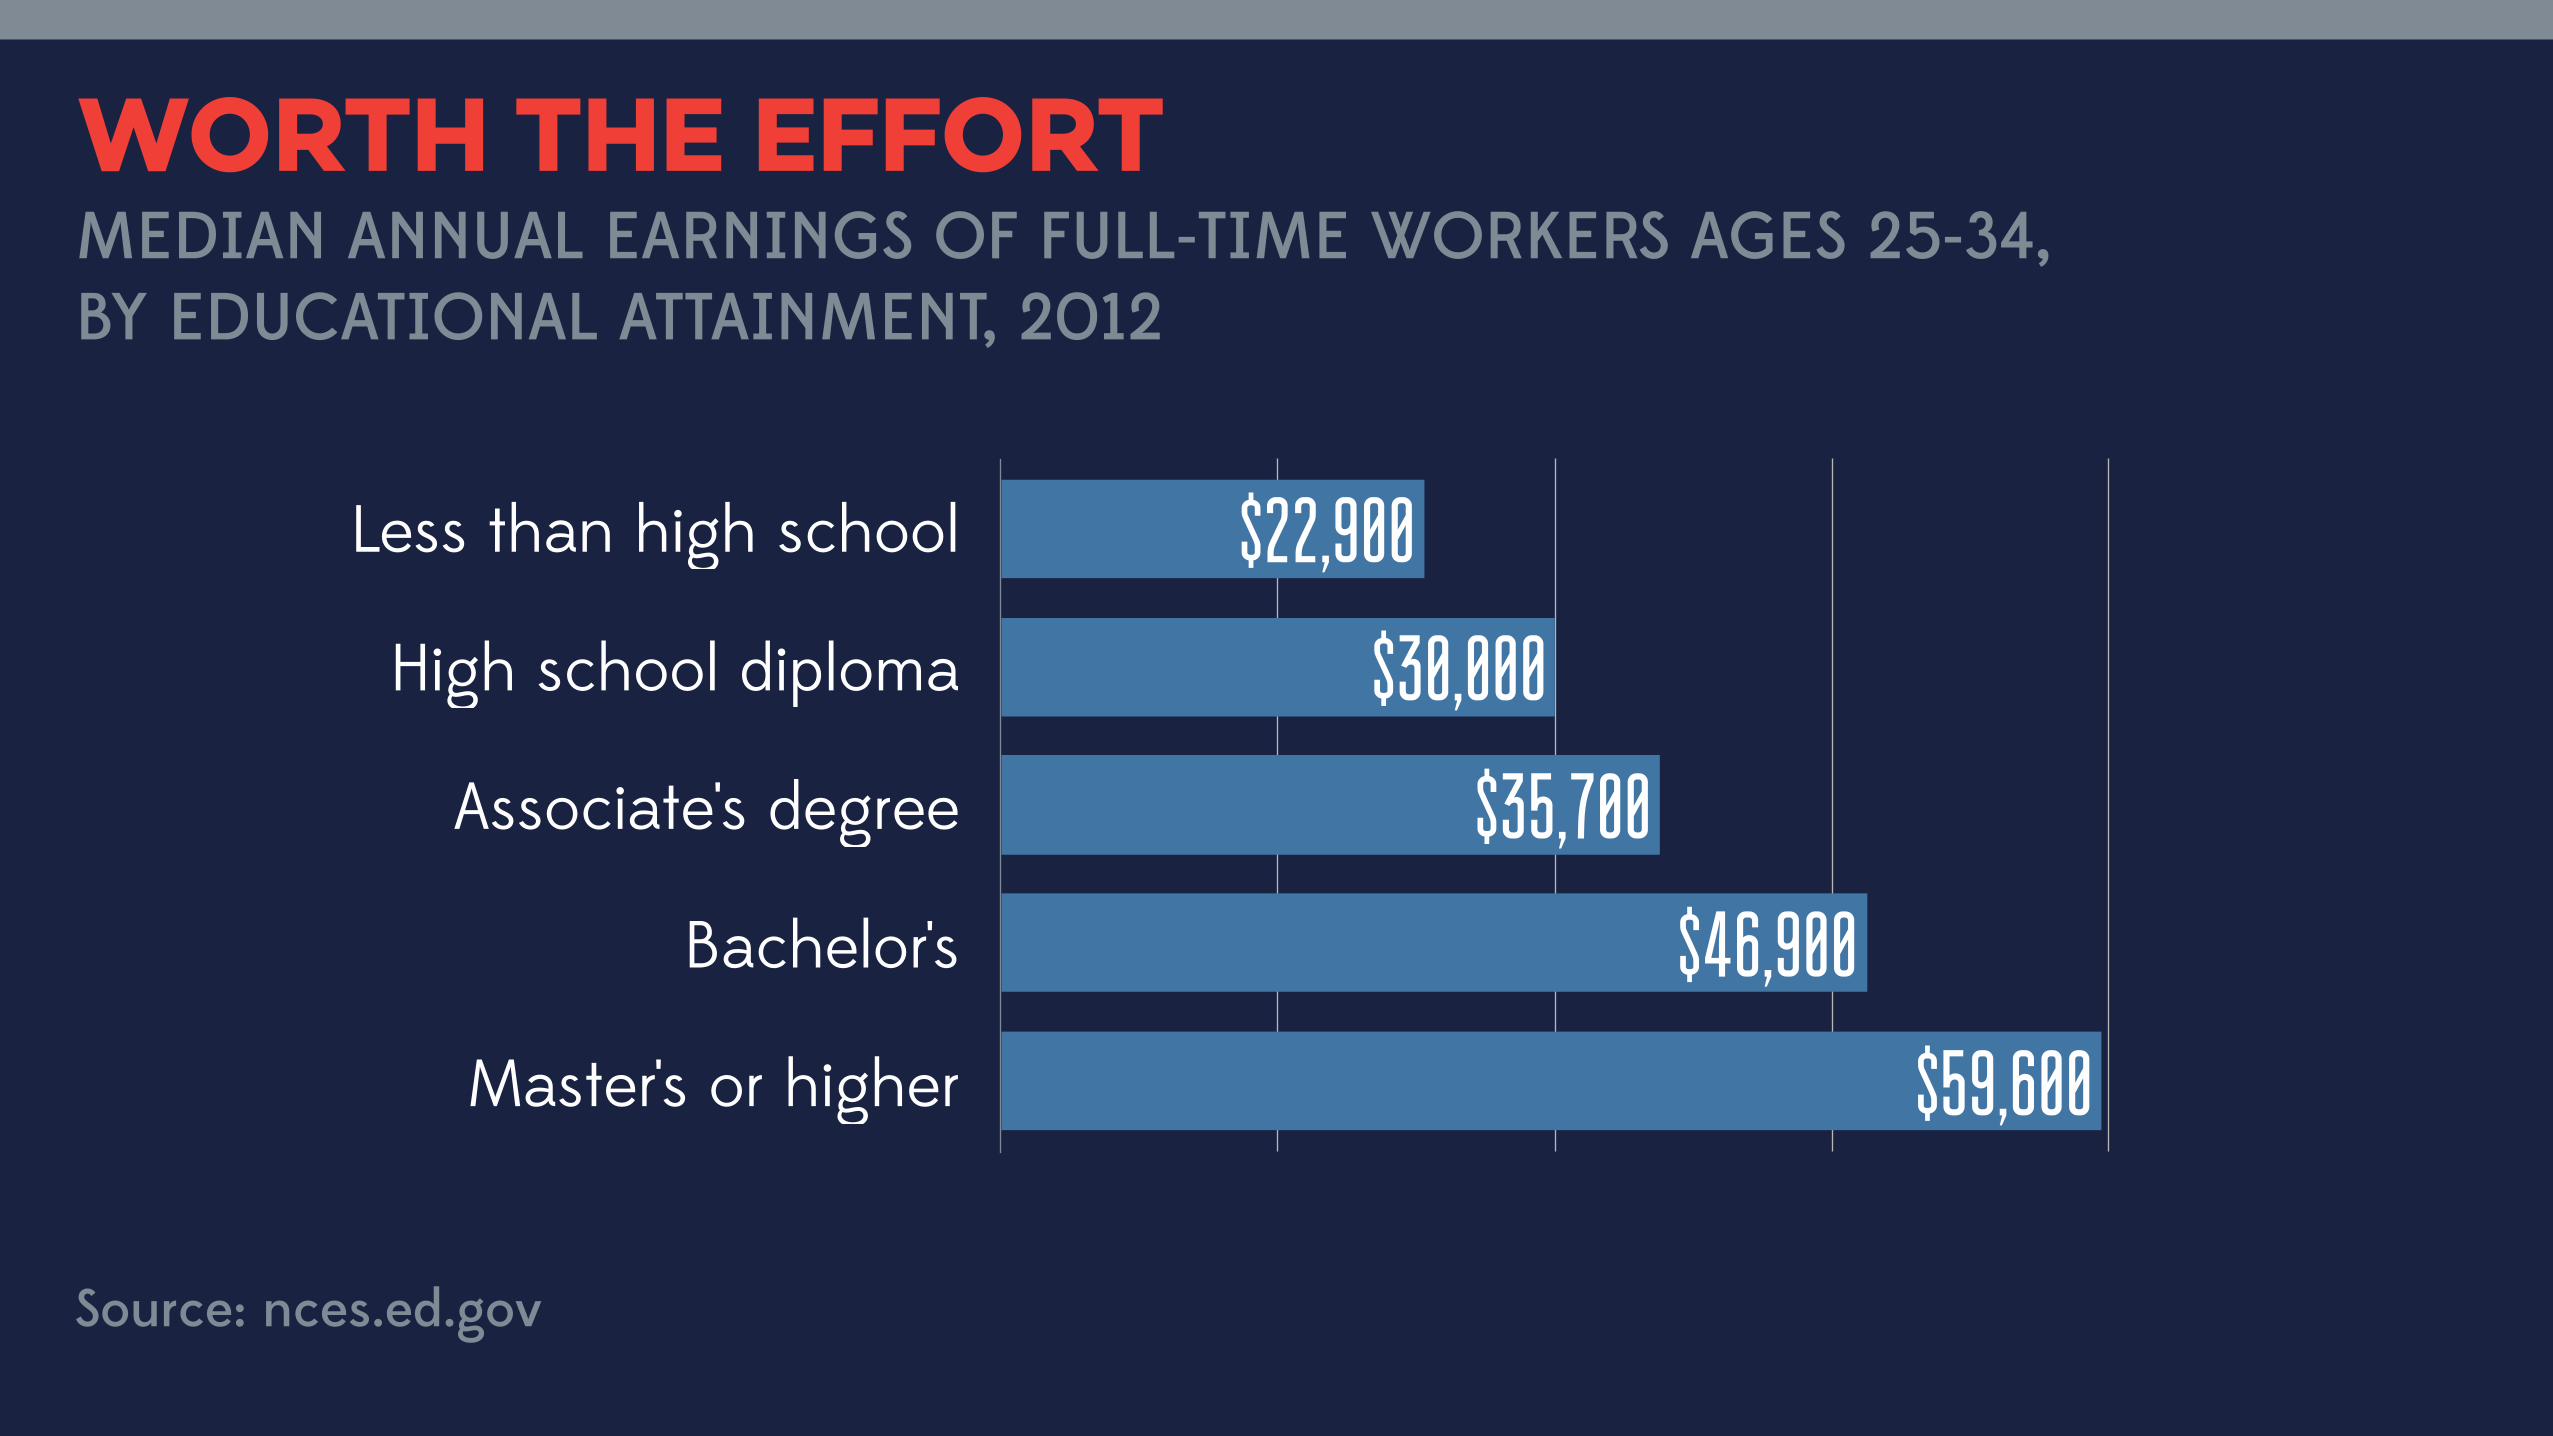
WORTH THE EFFORTMEDIAN ANNUAL EARNINGS OF FULL-TIME WORKERS AGES 25-34, BY EDUCATIONAL ATTAINMENT, 2012
Source: nces.ed.gov
Less than high school
High school diploma
Associate's degree
Bachelor's
Master's or higher
15 000 30 000 45 000 60 000
$22,900
$30,000
$35,700
$46,900
$59,600
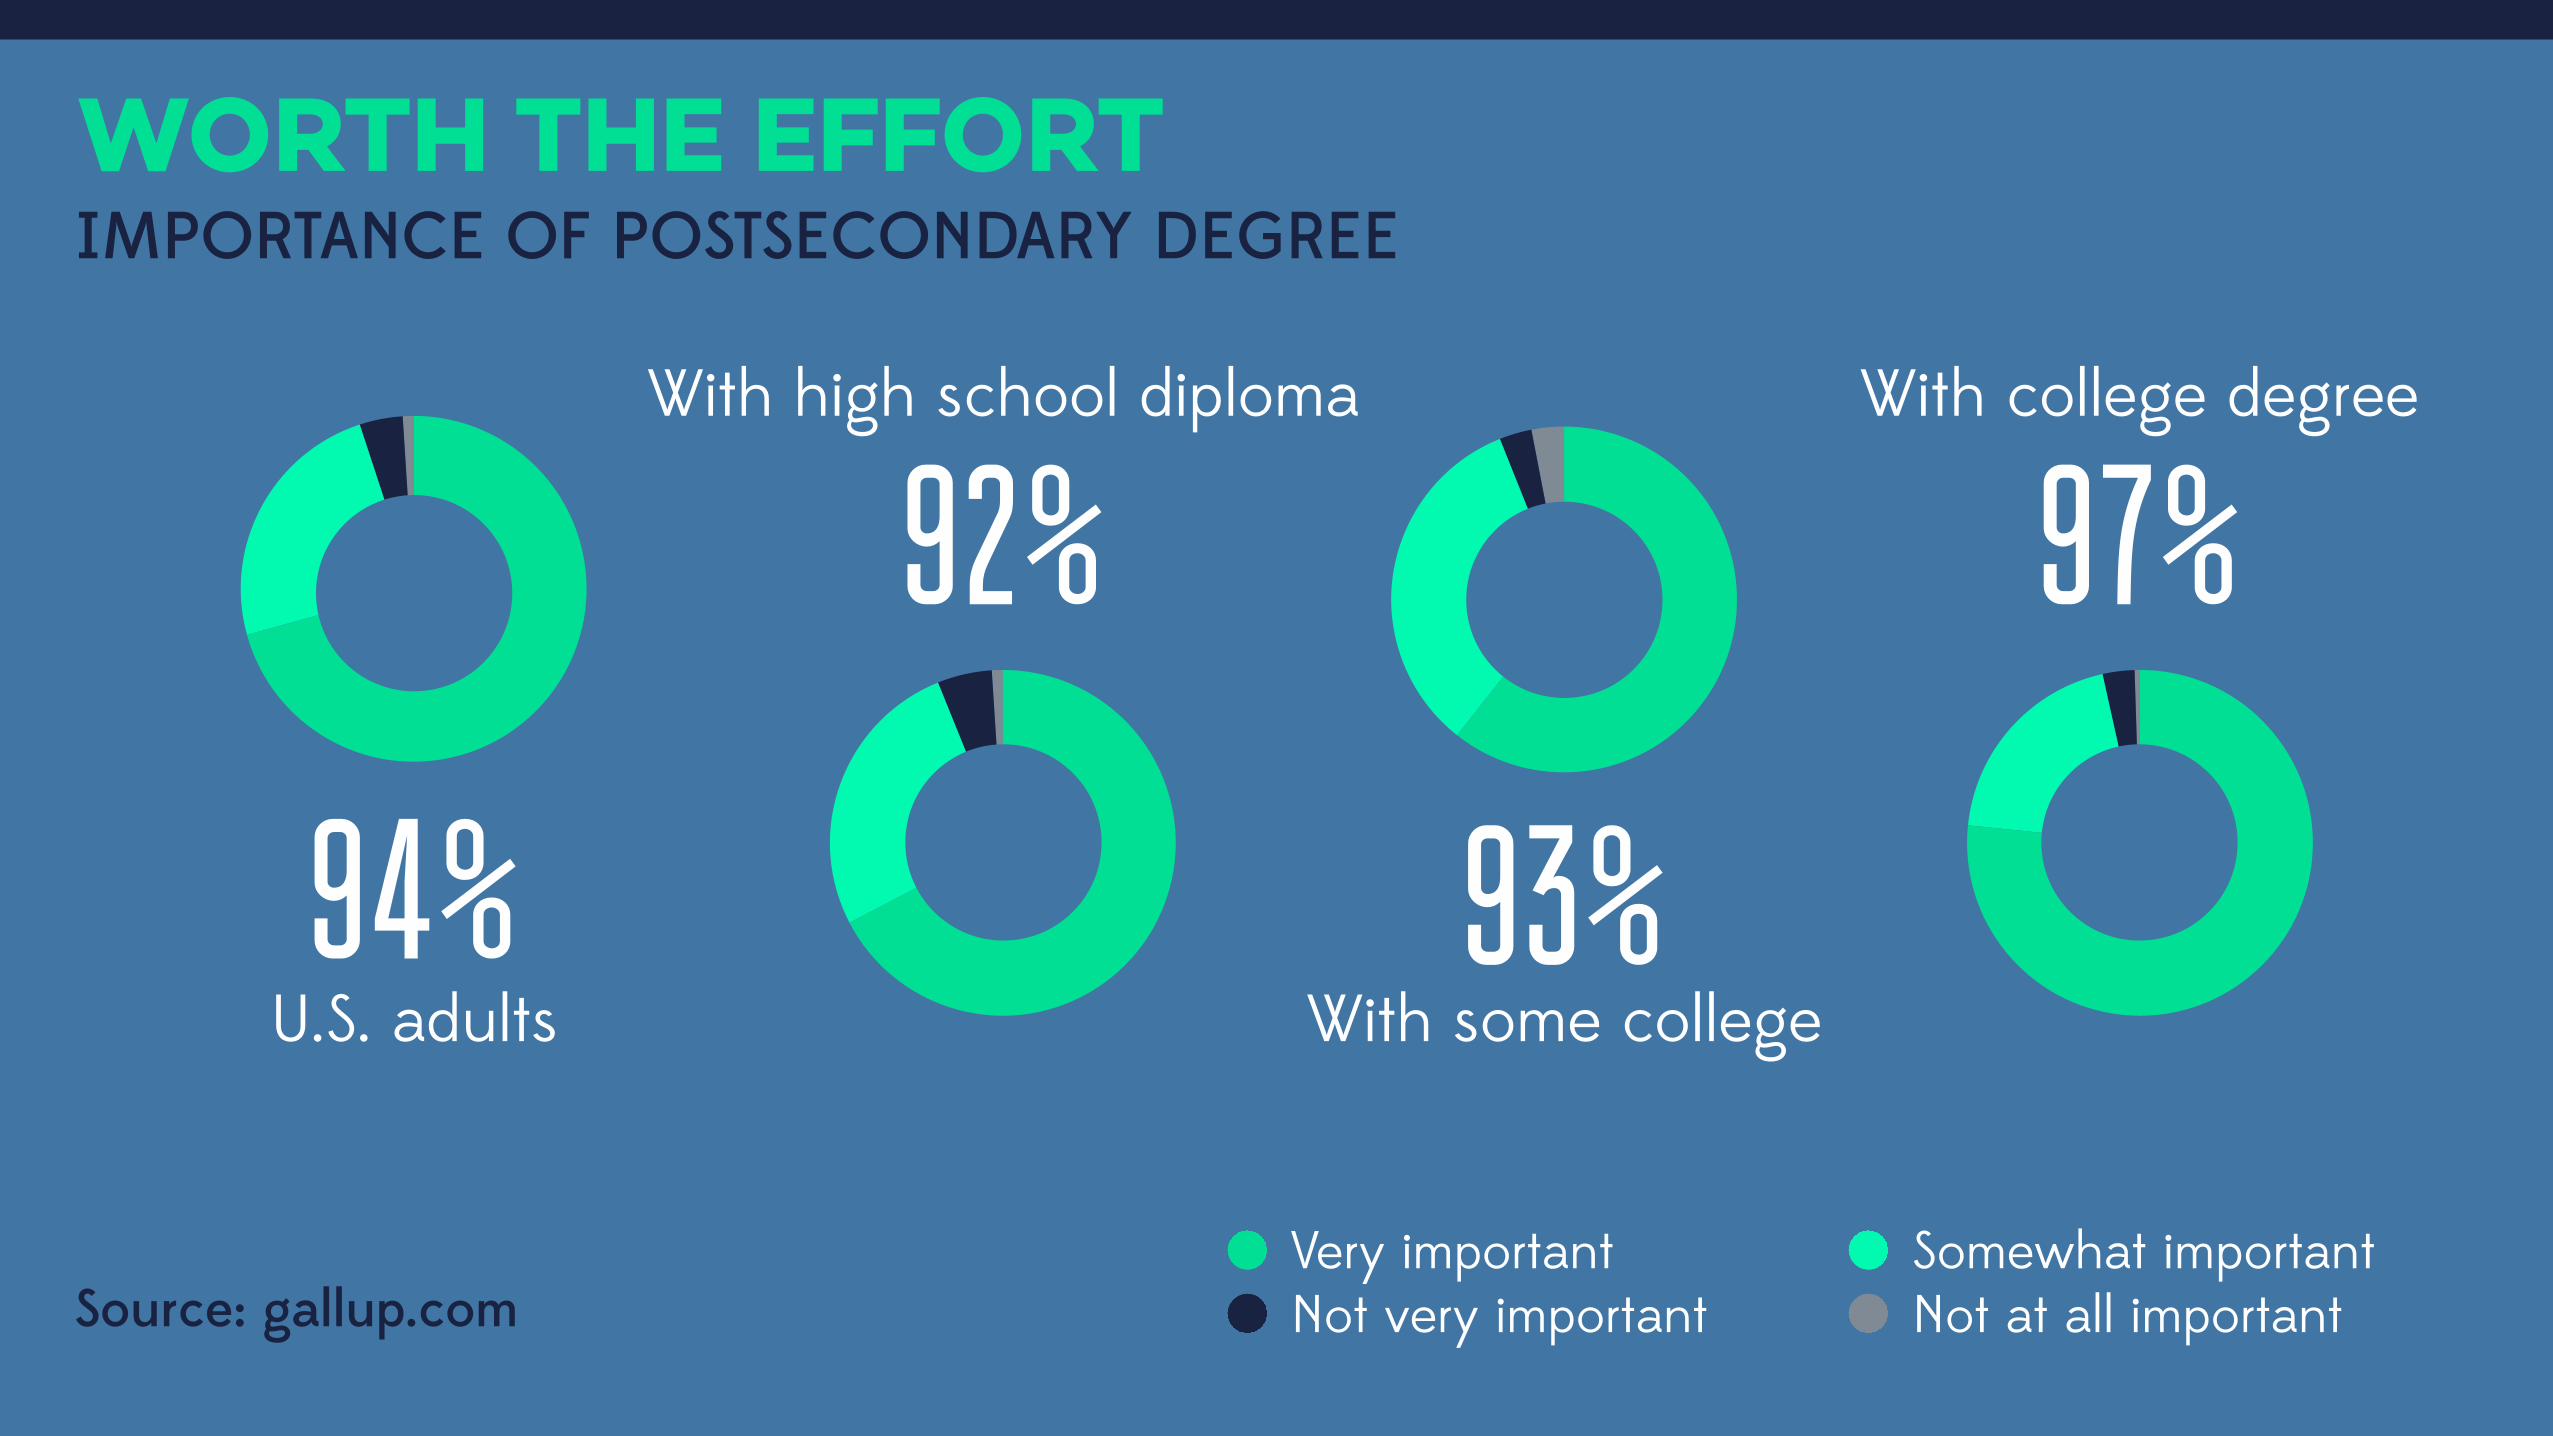
IMPORTANCE OF POSTSECONDARY DEGREE
Very important Somewhat importantNot very important Not at all important
94% 93%
97%92%
U.S. adults
With high school diploma
With some college
With college degree
WORTH THE EFFORT
Source: gallup.com

WORTH THE EFFORT
Source: gallup.com
IMPORTANCE OF POSTSECONDARY DEGREE
April
0 25 50 75 100
A degree beyond high school is essential for getting a good job
April
0 25 50 75 100
Postsecondary degree leads to a better quality of life
Strongly disagree Strongly agree
5 6 16% 29% 44%
3 6 17% 34% 40%
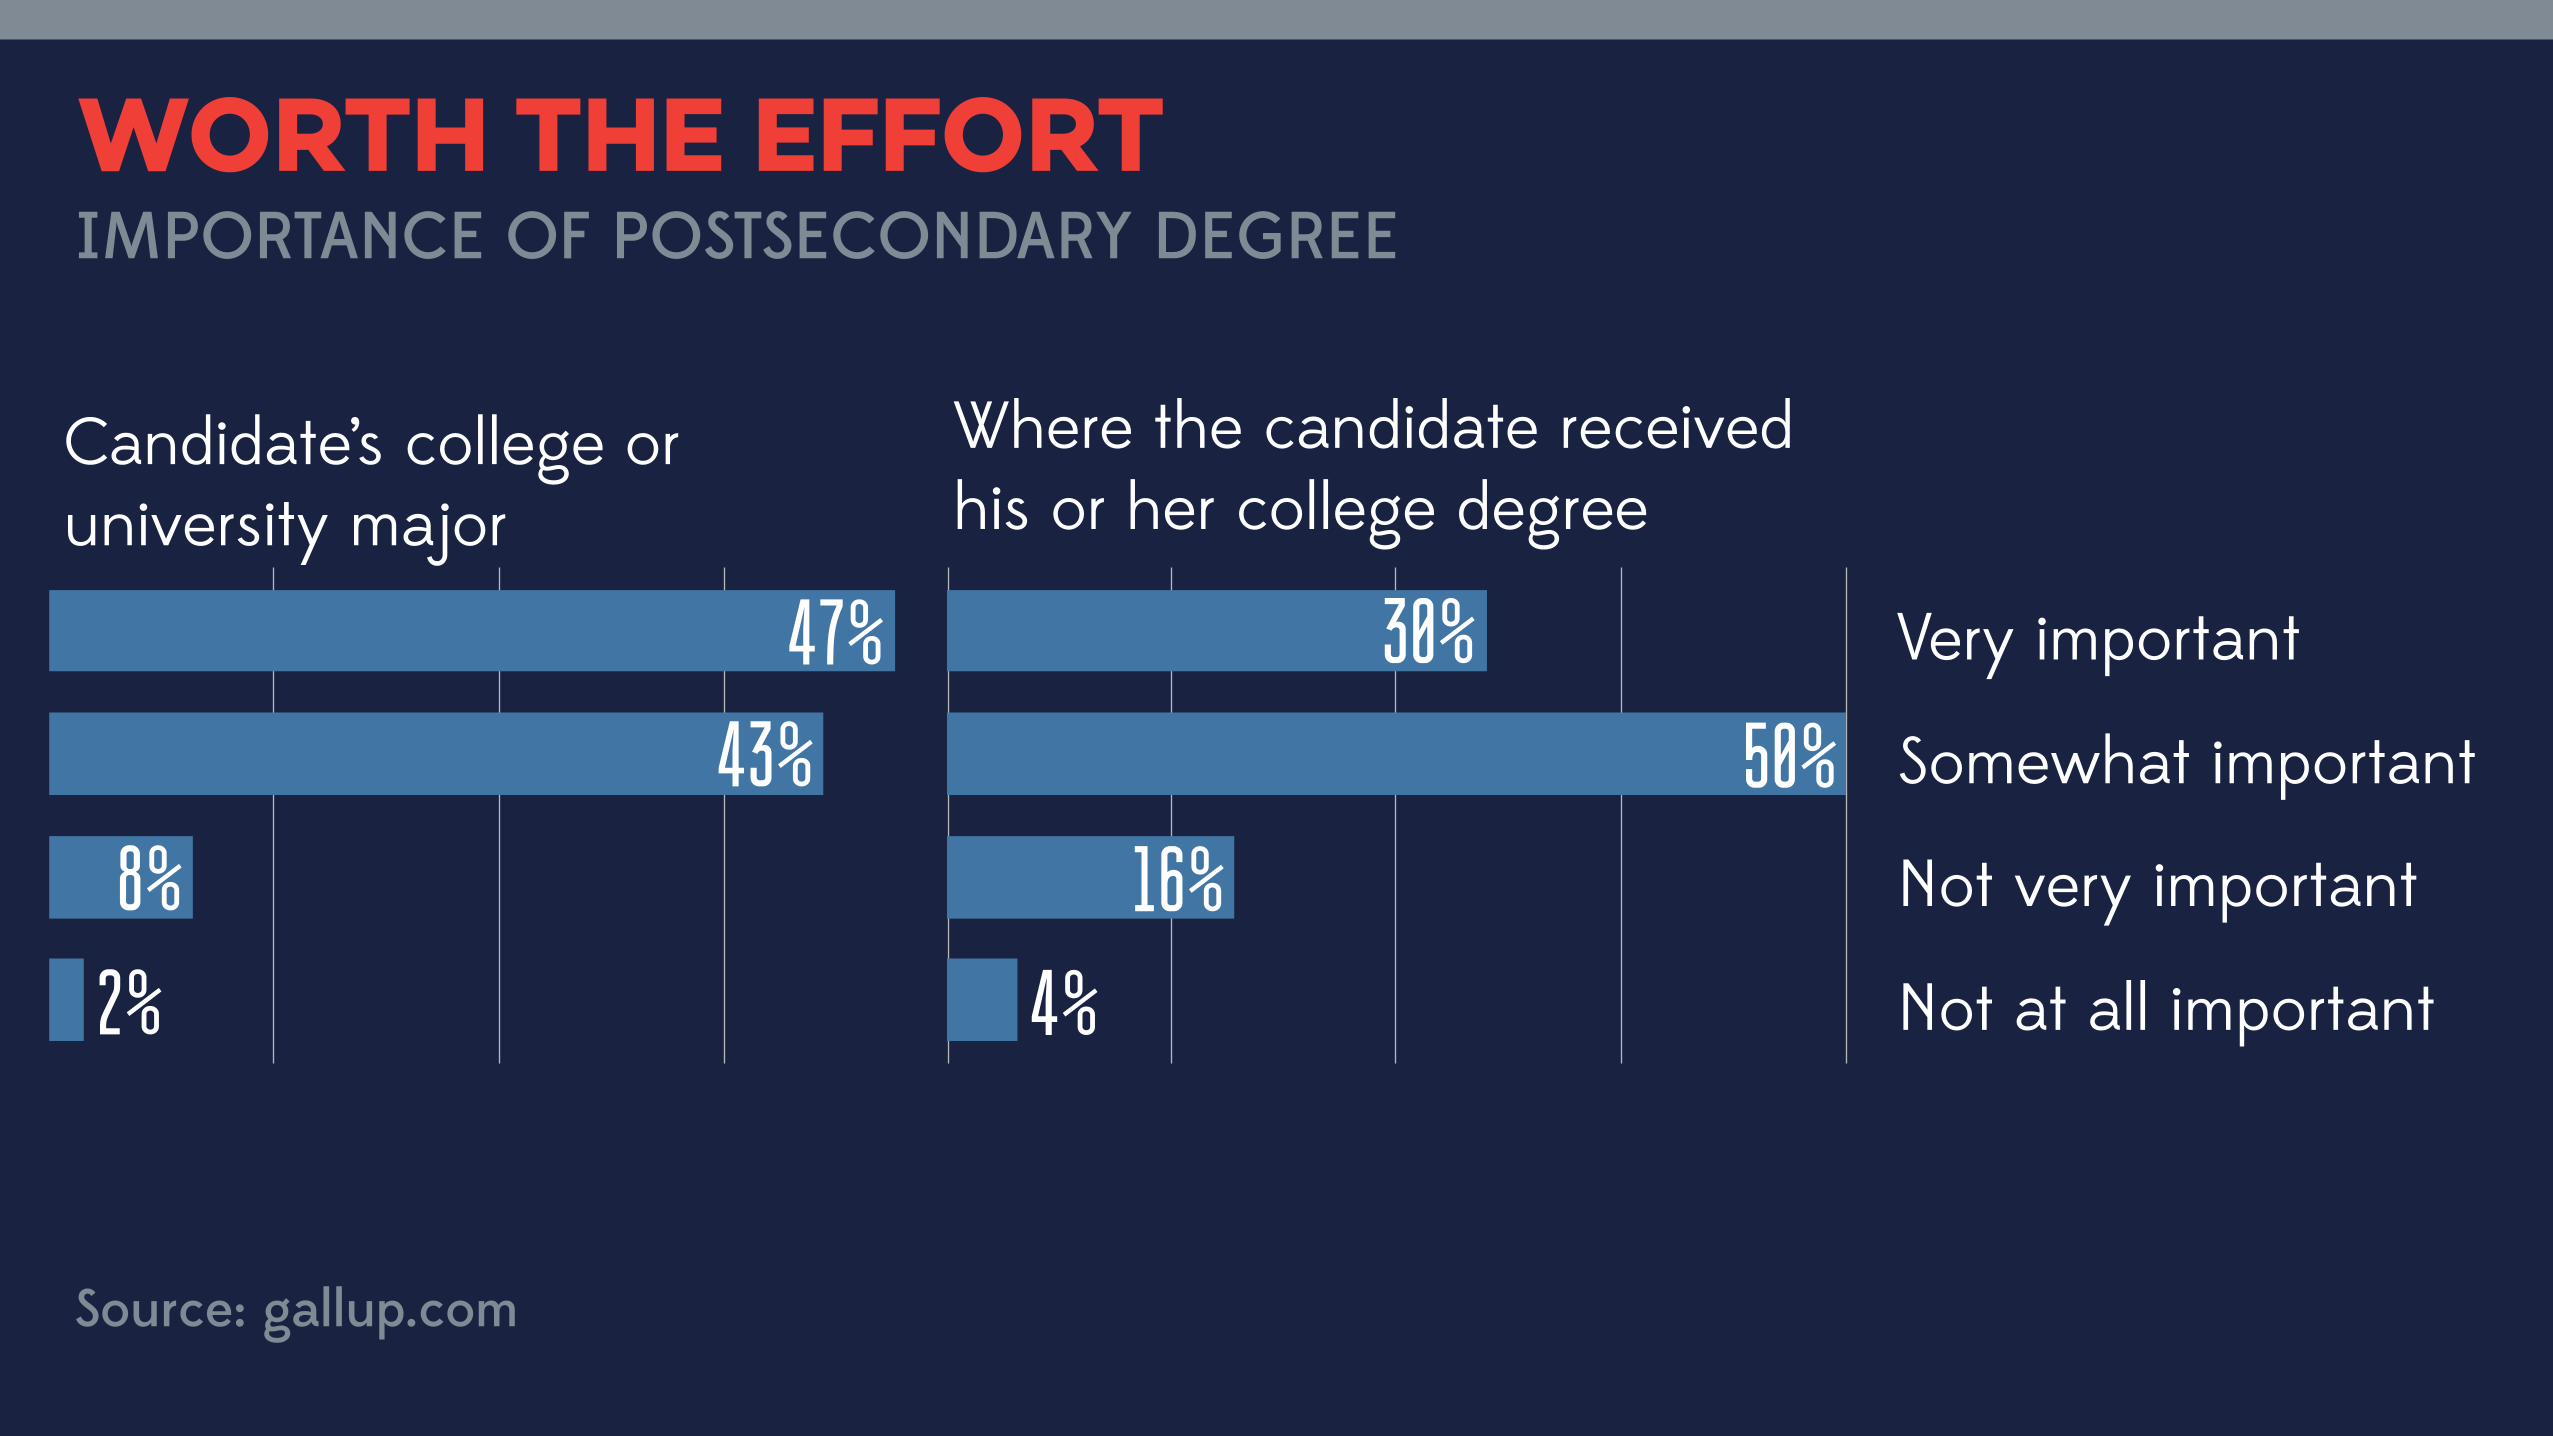
WORTH THE EFFORT
12,5 25 37,5 50
47%43%
8%2%
12,5 25 37,5 50
30%50%
16%4%
Somewhat important
Very important
Not very important
Not at all important
Candidate’s college or university major
Where the candidate received his or her college degree
IMPORTANCE OF POSTSECONDARY DEGREE
Source: gallup.com

AVERAGE DEBT PER BORROWERTHAT DEBT IS TROUBLE
Source: nces.ed.gov
5 000 $
10 000 $
15 000 $
20 000 $
25 000 $
30 000 $
35 000 $
2000 2002 2004 2006 2008 2010 2012 2014
Inflation-adjusted

THAT DEBT IS TROUBLETHE PERCENTAGE OF STUDENTS WITH LOANS
Source: nces.ed.gov
40
45
50
55
60
65
70
1993
1996
1999
2002
2005
2008
2011
2014
45%
50%
55%
60%
65%
70%
40%

THAT DEBT IS TROUBLETOP FINANCIAL PROBLEM FACING FAMILY
Source: gallup.com
April
0 25 50 75 100
College expenses/loansLack of money/low wagesHousingOther financial problemsHealthcare
18 to 29 years
April
0 25 50 75 100
30 to 49 years
21% 15% 14% 50%
14% 14% 13% 59%

THAT DEBT IS TROUBLETOP FINANCIAL PROBLEM FACING FAMILY
Source: gallup.com
0
5
10
15
20
2005
2008
2011
2014
% Healthcare costs% College expenses% Utility/Energy costs

THAT DEBT IS TROUBLEPERCENT CHANGE FROM 2005 IN MEDIAN ANNUAL EARNINGS OF PEOPLE 25-34 WITH BACHELOR’S AND AVERAGE STUDENT LOAN BALANCE FOR PEOPLE UNDER 30
Source: nces.ed.gov, ny.frb.org
-505
10152025303540
2005
2006
2007
2008
2009
2010
2011
2012
Student debtEarnings
-5%
0%
5%
10%
15%
20%
25%
30%
35%
40%

PERCENTAGE OF COLLEGE GRADUATES THRIVING IN 2 (OF 5) ELEMENTS OF WELL-BEING
THAT DEBT IS TROUBLE
Source: gallup.com
12,5 25 37,5 50
40%Less than $25 000No student debt
$25 001 - $50 000Over $50 000
Financial well-being Physical well-being
31%26%
25%
12,5 25 37,5 50
30%26%
24%
34%

QUESTIONS AND COMMENTS ARE WELCOME

BELENOVA
LEONT’EV

SOURCESapparat.cc lumni.net consumerfinance.gov nces.ed.gov projectonstudentdebt.org ny.frb.org gallup.com naceweb.org www.collegedata.com huffingtonpost.com businessweek.com forbes.com wsj.com nytimes.com businessinsider.com usatoday.com 2013 Gallup-Lumina Foundation Poll on Higher Education The 2014 Gallup-Purdue Index Report The Institute for College Access & Success. 2014. Should All Student Loan Payments Be Income-Driven? The Institute for College Access & Success. 2014. Student Debt and the Class of 2013 Edvisors. 2014. Student Aid Policy Analysis. Debt at Graduation Consumer Financial Protection Bureau. 2012. Private Student Loans Report Consumer Financial Protection Bureau. 2013. Student Loan Affordability National Center for Education Statistics. 2013. Digest of Education Statistics National Center for Education Statistics. 2014. Projections of Education Statistics to 2022 National Center for Education Statistics. 2014. The Condition of Education