lumm cwb climate forecast system opertional and ... · the operational subseasonal to seasonal...
TRANSCRIPT

1
The Operational Subseasonal to Seasonal Climate Forecast System and Development at CWB
Mong-Ming Lu*, Jhy-Wen Hwu, Yea-Chin Tung, Ching-Teng Lee
Central Weather Bureau, Taipei, Taiwan
*Email: [email protected]
ABSTRACT
Taiwan Central Weather Bureau (CWB) 2-tiered subseasonal-to-seasonal climate forecast system version 2 (TCWB2T2) developed at CWB’s Research and Development Center started to run an operational test mode in January 2016. The forecast system has 3 major components: global SST prediction, global atmosphere prediction, and a downscaling module. TCWB2T2 generate 9 months of global climate forecast information and 3 months of statistically downscaled Taiwan temperature and precipitation probabilistic forecast in tercile probabilities. A comprehensive forecast verification metrics is implemented to thoroughly evaluate the prediction capability of TCWB2T2. Skill evaluation is applied to all forecast product. The forecast fails skill evaluation is masked out by a skill mask. TCWB2T2 shows good prediction skill for 2-meter air temperature in autumn and winter seasons and moderate skill for precipitation in the tropics of the winter hemisphere. Although TCWB2T2 produces the forecast up to 9 months, the prediction skill drops rapidly with lead time. Nevertheless, the rich database of more than 30 years of retrospective and real-time forecast data provides a valuable opportunity for linking climate forecast to high-impact weather systems such as winter cold surges, Mei-yu rainfall and affecting Taiwan tropical cyclones.
1 Introduction
Taiwan is exposed to multiple types of natural disasters. The management of resources relies heavily on weather and climate forecasts. The Central Weather Bureau (CWB) of Taiwan is obligated to provide the most accurate and reliable forecast information to meet the expectation and protect the life and property of 23 million people living in Taiwan. For the forecasts within 5 days, CWB has the state-of-art regional weather forecast systems originated from the WRF family
2
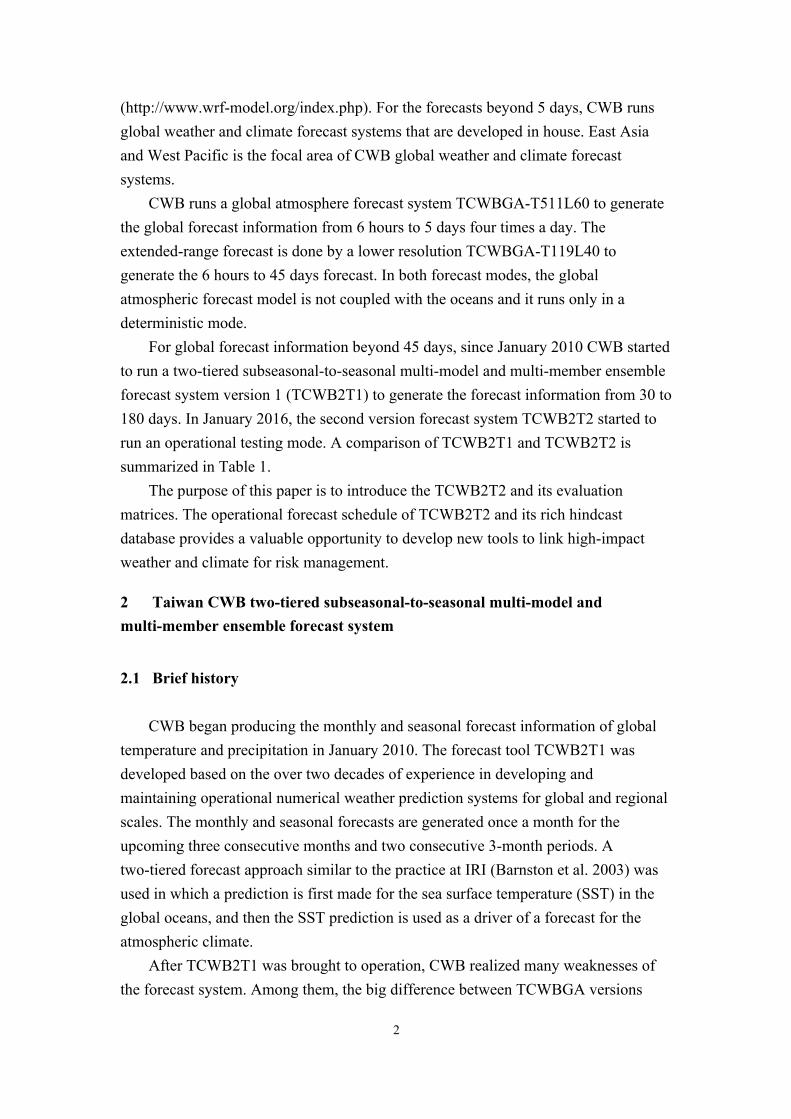
(http://www.wrf-model.org/index.php). For the forecasts beyond 5 days, CWB runs global weather and climate forecast systems that are developed in house. East Asia and West Pacific is the focal area of CWB global weather and climate forecast systems.
CWB runs a global atmosphere forecast system TCWBGA-T511L60 to generate the global forecast information from 6 hours to 5 days four times a day. The extended-range forecast is done by a lower resolution TCWBGA-T119L40 to generate the 6 hours to 45 days forecast. In both forecast modes, the global atmospheric forecast model is not coupled with the oceans and it runs only in a deterministic mode.
For global forecast information beyond 45 days, since January 2010 CWB started to run a two-tiered subseasonal-to-seasonal multi-model and multi-member ensemble forecast system version 1 (TCWB2T1) to generate the forecast information from 30 to 180 days. In January 2016, the second version forecast system TCWB2T2 started to run an operational testing mode. A comparison of TCWB2T1 and TCWB2T2 is summarized in Table 1.
The purpose of this paper is to introduce the TCWB2T2 and its evaluation matrices. The operational forecast schedule of TCWB2T2 and its rich hindcast database provides a valuable opportunity to develop new tools to link high-impact weather and climate for risk management.
2 Taiwan CWB two-tiered subseasonal-to-seasonal multi-model and multi-member ensemble forecast system
2.1 Brief history
CWB began producing the monthly and seasonal forecast information of global temperature and precipitation in January 2010. The forecast tool TCWB2T1 was developed based on the over two decades of experience in developing and maintaining operational numerical weather prediction systems for global and regional scales. The monthly and seasonal forecasts are generated once a month for the upcoming three consecutive months and two consecutive 3-month periods. A two-tiered forecast approach similar to the practice at IRI (Barnston et al. 2003) was used in which a prediction is first made for the sea surface temperature (SST) in the global oceans, and then the SST prediction is used as a driver of a forecast for the atmospheric climate.
After TCWB2T1 was brought to operation, CWB realized many weaknesses of the forecast system. Among them, the big difference between TCWBGA versions
3
used for weather and climate forecast and the inconsistency between the initial and boundary data used in the hindcast and forecast modes are the shortcomings that can vitally affect forecast reliability. The shortcomings are originated from the fact that it took many years for the development, in the meantime the improvement in forecast models is vigorously carried out at CWB and NCEP. The change from IBM P5-575 to Fujitsu PRIMEHPC FX10 during 2012-2014 also requires complete revision of the hindcast database.
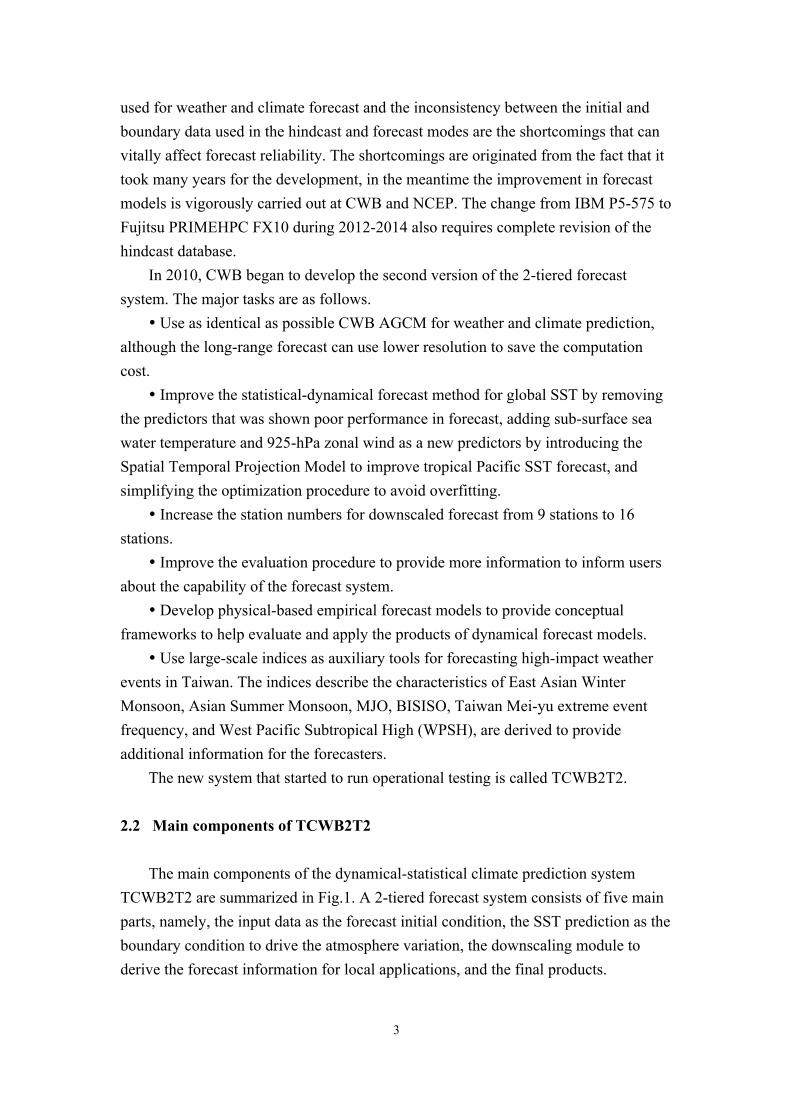
In 2010, CWB began to develop the second version of the 2-tiered forecast system. The major tasks are as follows.
� Use as identical as possible CWB AGCM for weather and climate prediction, although the long-range forecast can use lower resolution to save the computation cost.
� Improve the statistical-dynamical forecast method for global SST by removing the predictors that was shown poor performance in forecast, adding sub-surface sea water temperature and 925-hPa zonal wind as a new predictors by introducing the Spatial Temporal Projection Model to improve tropical Pacific SST forecast, and simplifying the optimization procedure to avoid overfitting.
� Increase the station numbers for downscaled forecast from 9 stations to 16 stations.
� Improve the evaluation procedure to provide more information to inform users about the capability of the forecast system.
� Develop physical-based empirical forecast models to provide conceptual frameworks to help evaluate and apply the products of dynamical forecast models.
� Use large-scale indices as auxiliary tools for forecasting high-impact weather events in Taiwan. The indices describe the characteristics of East Asian Winter Monsoon, Asian Summer Monsoon, MJO, BISISO, Taiwan Mei-yu extreme event frequency, and West Pacific Subtropical High (WPSH), are derived to provide additional information for the forecasters.
The new system that started to run operational testing is called TCWB2T2.
2.2 Main components of TCWB2T2
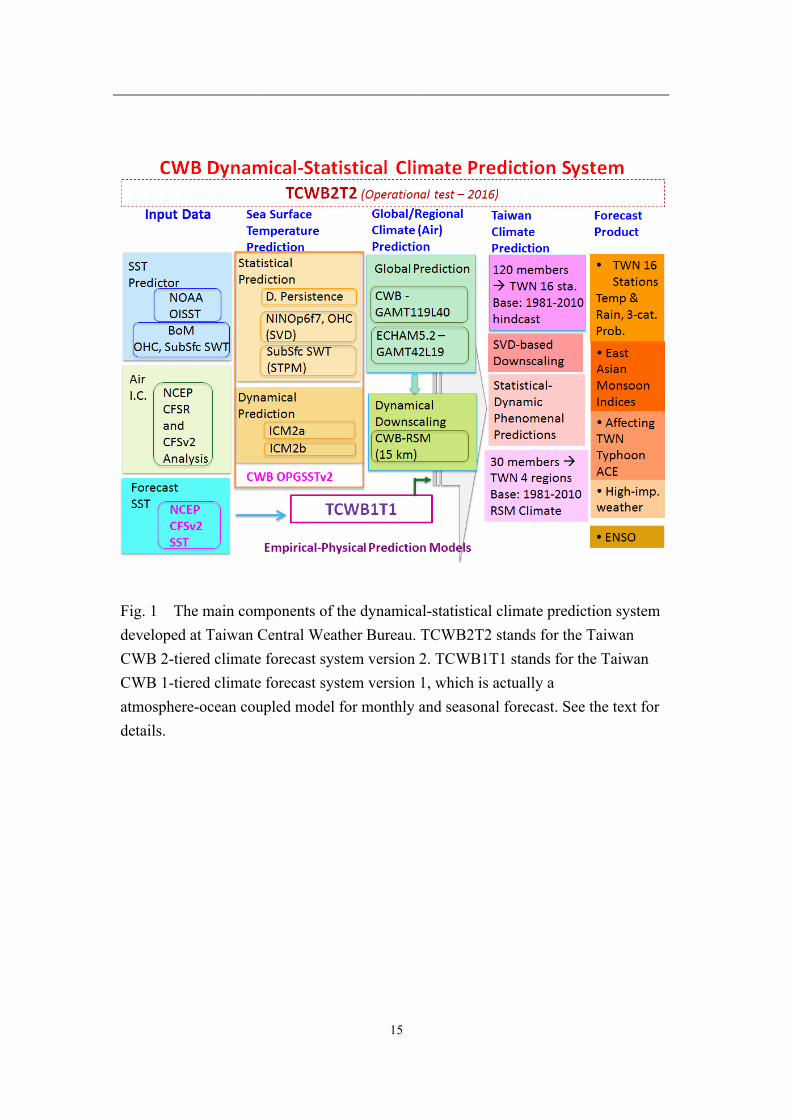
The main components of the dynamical-statistical climate prediction system TCWB2T2 are summarized in Fig.1. A 2-tiered forecast system consists of five main parts, namely, the input data as the forecast initial condition, the SST prediction as the boundary condition to drive the atmosphere variation, the downscaling module to derive the forecast information for local applications, and the final products.

4
2.2.1 Input data
The input atmosphere data is from the dataset of NCEP/CFSR (Saha et al. 2010). The input ocean data include the forecasted SST in NCEP/CFSRR ( http://cfs.ncep.noaa.gov/cfsr/docs/), NOAA Optimum interpolation Sea Surface Temperature (OISST) data (Reynolds et al. 2007), and Australian Bureau of Meteorology (BoM) Ocean Subsurface Temperatures also called Ocean Heat Content (OHC) (http://www.bom.gov.au/oceanography/oceantemp/sota.shtml).
2.2.2 Global sea surface temperature prediction
The SST forecast module (CWB-OPGSST2) uses a point-wise multiple regression method (MRG) (Krishnamurti et al. 2000; Yun et al. 2003) to optimally integrate the forecast produced by a mix of two dynamical and four statistical models.
The dynamical modes are two intermediate air-sea coupled dynamical models (ICM2a, ICM2b) used to predict sea surface temperature between 60°S and 60°N. Both are based on the model developed by Kang and Kug (2000), but with slightly difference in processing the initial data for forecast. The initial data used in ICM2a is only from the observation, while the initial data used in ICM2b is a combination of observation and forecast data. The initial data is assimilated from the SLP, 925-hPa wind obtained from NCEP CFSR, NOAA OISSTv2, and BoM sub-surface sea water temperature.
The statistical models are termed as Persistence, NINOp6f7, TPOHC, and Subsfc_SWT. Persistence is a damped persistence method applied to the global oceans with 4 months e-folding time. NINOp6f7 and TPOHC use SVD (Singular Value Decomposition) method to forecast the SSTs from 60°S-60°N with different predictors represented by NINOp6f7 and TPOHC. NINOp6f1 is for the SST over Nino3.4 region (5°N - 5°S , 170° - 120°W), Pslp3f1 for sea level pressure over the Philippine Sea (110°E-170°E, 0°-20°N ), and TPOHC for the ocean heal content over tropical Pacific (120°E-80°W, 10°S-10°N). The Subsfc_SWT method uses the STPM (Spatial Temporal Projection Model) method to improve the SST forecast over Nino3.4 regions. Therefore, we have four statistical models, two predict the SSTs over (60°S-60°N), one predicts the tropical Pacific SSTs over Nino3.4 box area and one predicts the global SSTs.
The prediction skill comparison between OPGSST1 and OPGSST2 is presented in Fig. 2. Both methods have clear Spring Predictability Barrier that the prediction skill is lowest during the summer months. However, the barrier of OPGSST2 is much
5
narrower compared with OPGSST1. The winter correlation of OPGSST2 is clearly larger than OPGSST1, particularly for the long lead forecast beyond 6 months.
In addition to OPGSST2, the SST in NCEP CFSRR dataset is also used in retrospective forecast. In real-time forecasts the SST generated by NCEP CFSv2 is used as the boundary condition.
2.2.3 Global atmospheric prediction
Two AGCMs, TCWBGA-T119L40 and ECHAM5-T42L19 are used to predict the atmosphere part. Although the model resolution of TCWBGA-T119L40 is much higher than ECHAM5-T42L19, the physics packages of these two models are very different. After evaluating the model climate runs and hindcast results, we found that the models performed equally well, while different models shows different strength and weakness in different regions and variables. The multi-model ensemble forecast always shows the best performance.
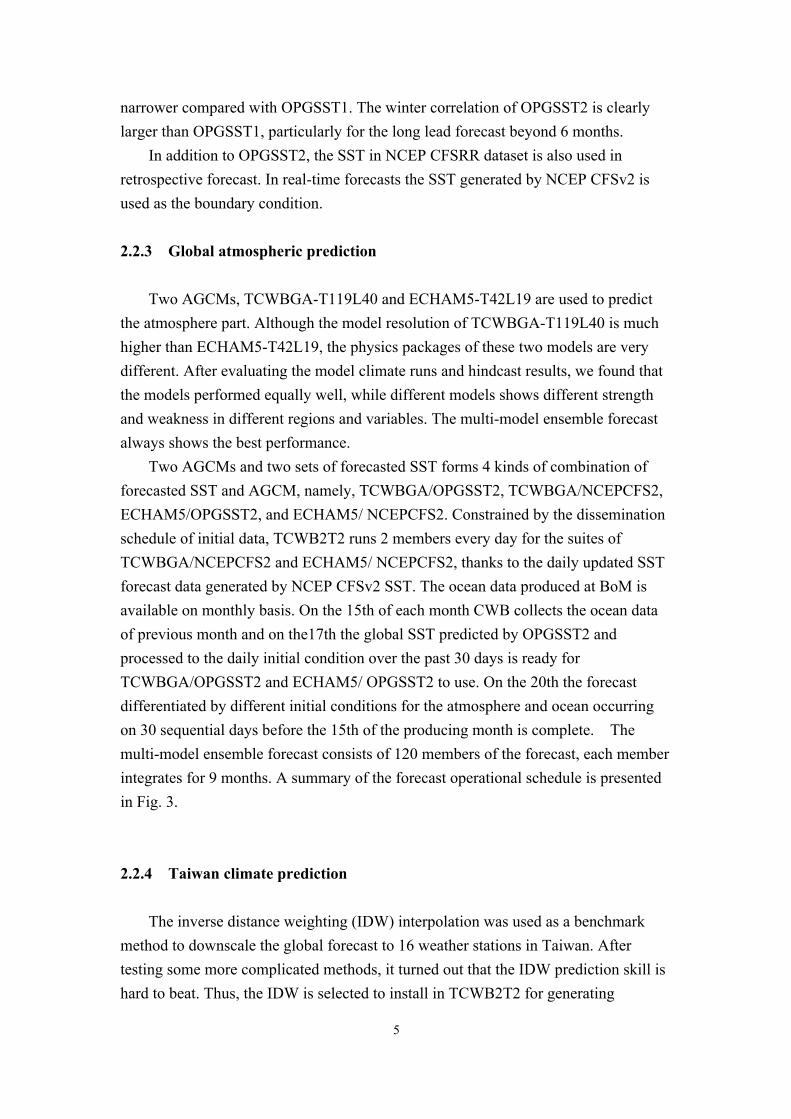
Two AGCMs and two sets of forecasted SST forms 4 kinds of combination of forecasted SST and AGCM, namely, TCWBGA/OPGSST2, TCWBGA/NCEPCFS2, ECHAM5/OPGSST2, and ECHAM5/ NCEPCFS2. Constrained by the dissemination schedule of initial data, TCWB2T2 runs 2 members every day for the suites of TCWBGA/NCEPCFS2 and ECHAM5/ NCEPCFS2, thanks to the daily updated SST forecast data generated by NCEP CFSv2 SST. The ocean data produced at BoM is available on monthly basis. On the 15th of each month CWB collects the ocean data of previous month and on the17th the global SST predicted by OPGSST2 and processed to the daily initial condition over the past 30 days is ready for TCWBGA/OPGSST2 and ECHAM5/ OPGSST2 to use. On the 20th the forecast differentiated by different initial conditions for the atmosphere and ocean occurring on 30 sequential days before the 15th of the producing month is complete. The multi-model ensemble forecast consists of 120 members of the forecast, each member integrates for 9 months. A summary of the forecast operational schedule is presented in Fig. 3.
2.2.4 Taiwan climate prediction
The inverse distance weighting (IDW) interpolation was used as a benchmark method to downscale the global forecast to 16 weather stations in Taiwan. After testing some more complicated methods, it turned out that the IDW prediction skill is hard to beat. Thus, the IDW is selected to install in TCWB2T2 for generating
6
statistical downscaled forecast at 16 Taiwan stations.
2.2.5 East Asia and western North Pacific (EAWNP) monsoon indices prediction
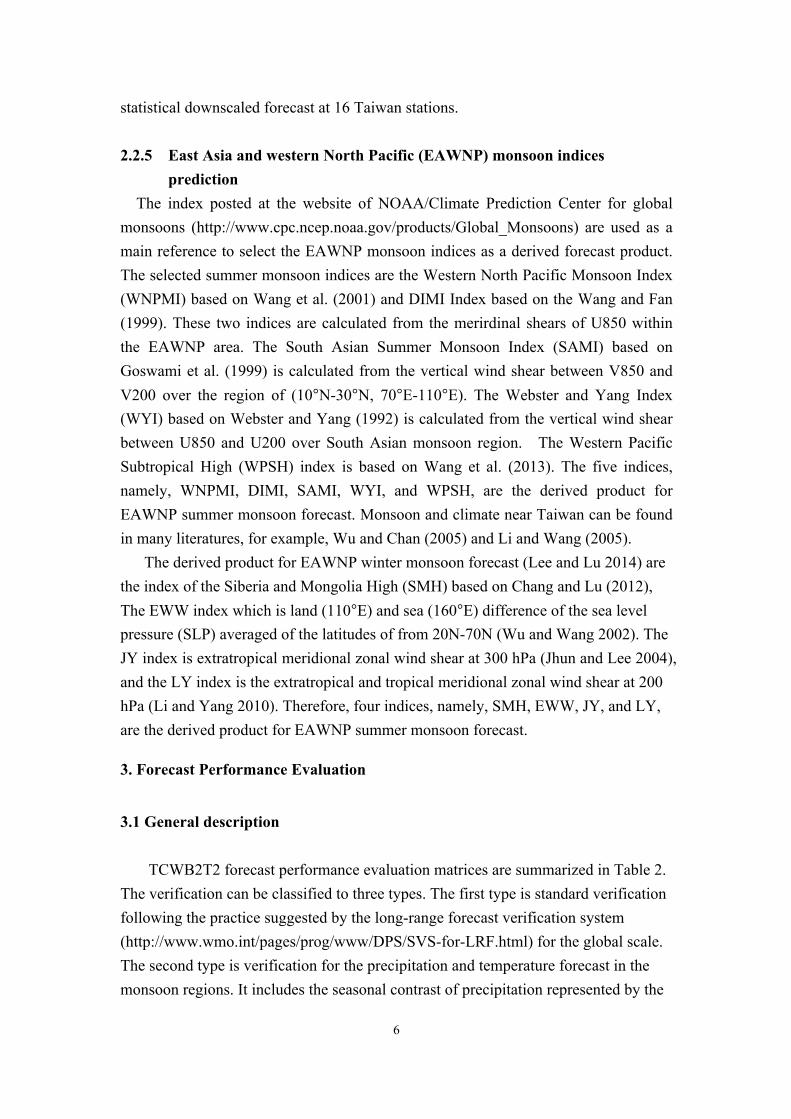
The index posted at the website of NOAA/Climate Prediction Center for global monsoons (http://www.cpc.ncep.noaa.gov/products/Global_Monsoons) are used as a main reference to select the EAWNP monsoon indices as a derived forecast product. The selected summer monsoon indices are the Western North Pacific Monsoon Index (WNPMI) based on Wang et al. (2001) and DIMI Index based on the Wang and Fan (1999). These two indices are calculated from the merirdinal shears of U850 within the EAWNP area. The South Asian Summer Monsoon Index (SAMI) based on Goswami et al. (1999) is calculated from the vertical wind shear between V850 and V200 over the region of (10°N-30°N, 70°E-110°E). The Webster and Yang Index (WYI) based on Webster and Yang (1992) is calculated from the vertical wind shear between U850 and U200 over South Asian monsoon region. The Western Pacific Subtropical High (WPSH) index is based on Wang et al. (2013). The five indices, namely, WNPMI, DIMI, SAMI, WYI, and WPSH, are the derived product for EAWNP summer monsoon forecast. Monsoon and climate near Taiwan can be found in many literatures, for example, Wu and Chan (2005) and Li and Wang (2005).
The derived product for EAWNP winter monsoon forecast (Lee and Lu 2014) are the index of the Siberia and Mongolia High (SMH) based on Chang and Lu (2012), The EWW index which is land (110°E) and sea (160°E) difference of the sea level pressure (SLP) averaged of the latitudes of from 20N-70N (Wu and Wang 2002). The JY index is extratropical meridional zonal wind shear at 300 hPa (Jhun and Lee 2004), and the LY index is the extratropical and tropical meridional zonal wind shear at 200 hPa (Li and Yang 2010). Therefore, four indices, namely, SMH, EWW, JY, and LY, are the derived product for EAWNP summer monsoon forecast.
3. Forecast Performance Evaluation
3.1 General description
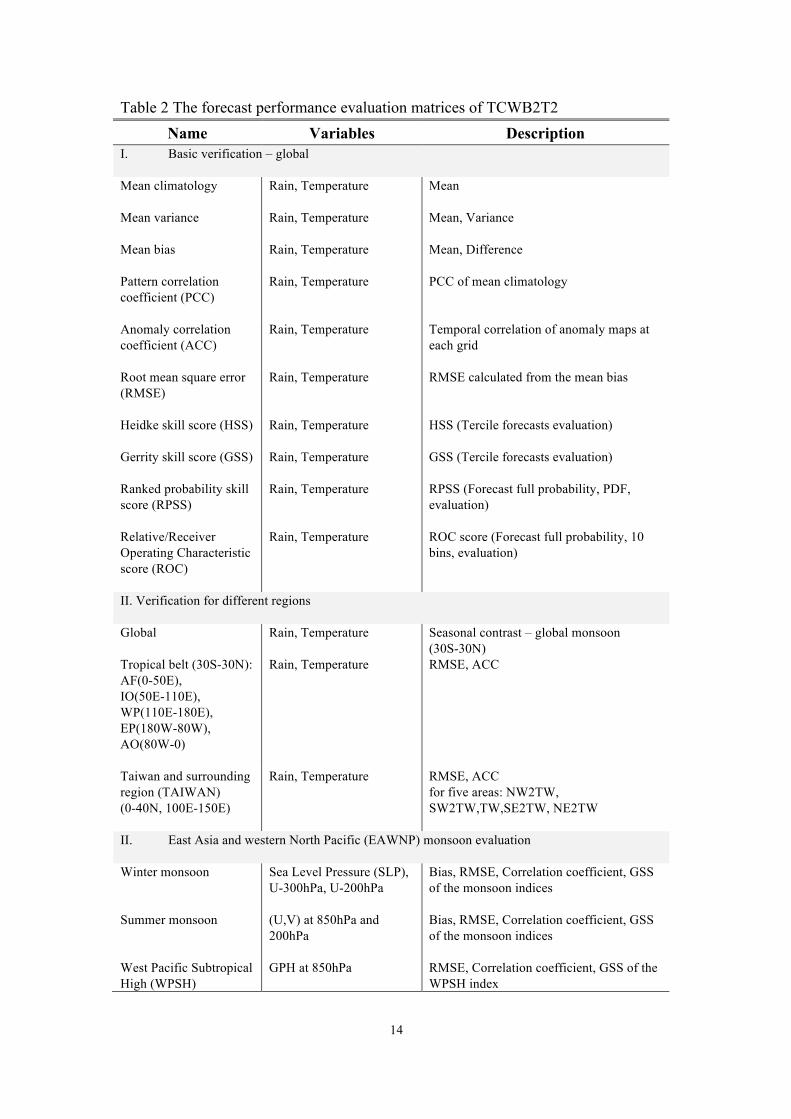
TCWB2T2 forecast performance evaluation matrices are summarized in Table 2. The verification can be classified to three types. The first type is standard verification following the practice suggested by the long-range forecast verification system (http://www.wmo.int/pages/prog/www/DPS/SVS-for-LRF.html) for the global scale. The second type is verification for the precipitation and temperature forecast in the monsoon regions. It includes the seasonal contrast of precipitation represented by the
7
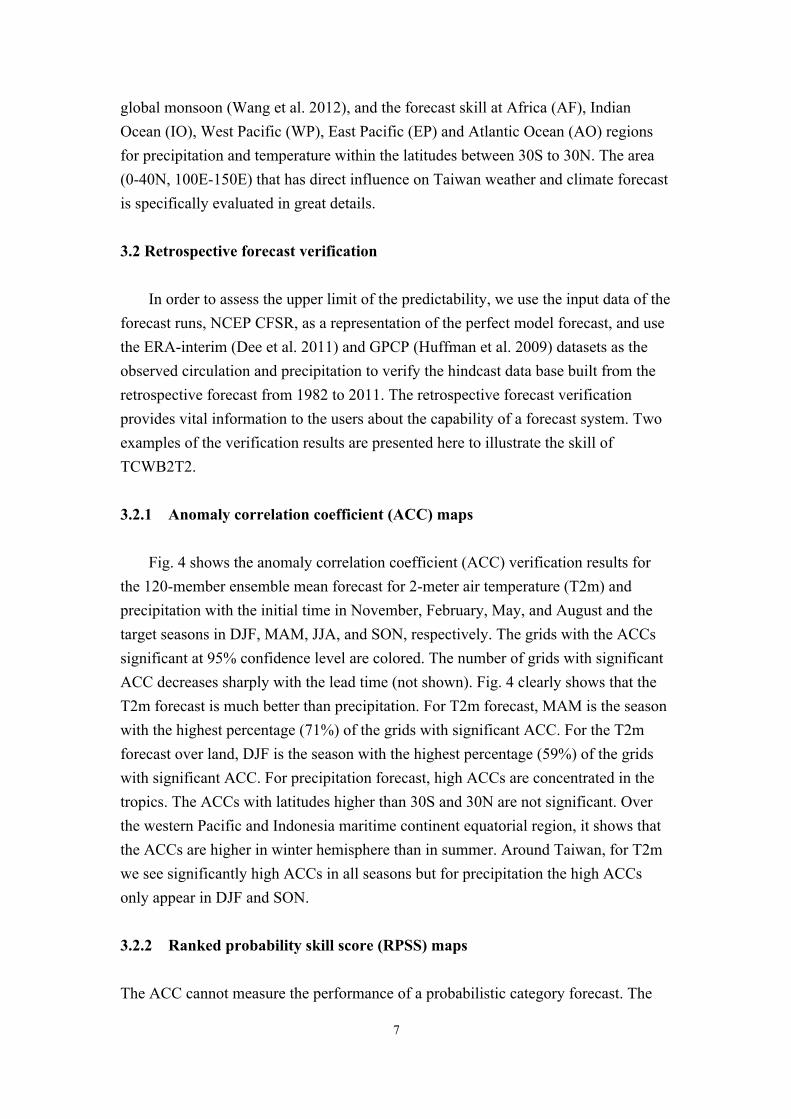
global monsoon (Wang et al. 2012), and the forecast skill at Africa (AF), Indian Ocean (IO), West Pacific (WP), East Pacific (EP) and Atlantic Ocean (AO) regions for precipitation and temperature within the latitudes between 30S to 30N. The area (0-40N, 100E-150E) that has direct influence on Taiwan weather and climate forecast is specifically evaluated in great details.
3.2 Retrospective forecast verification
In order to assess the upper limit of the predictability, we use the input data of the forecast runs, NCEP CFSR, as a representation of the perfect model forecast, and use the ERA-interim (Dee et al. 2011) and GPCP (Huffman et al. 2009) datasets as the observed circulation and precipitation to verify the hindcast data base built from the retrospective forecast from 1982 to 2011. The retrospective forecast verification provides vital information to the users about the capability of a forecast system. Two examples of the verification results are presented here to illustrate the skill of TCWB2T2.
3.2.1 Anomaly correlation coefficient (ACC) maps
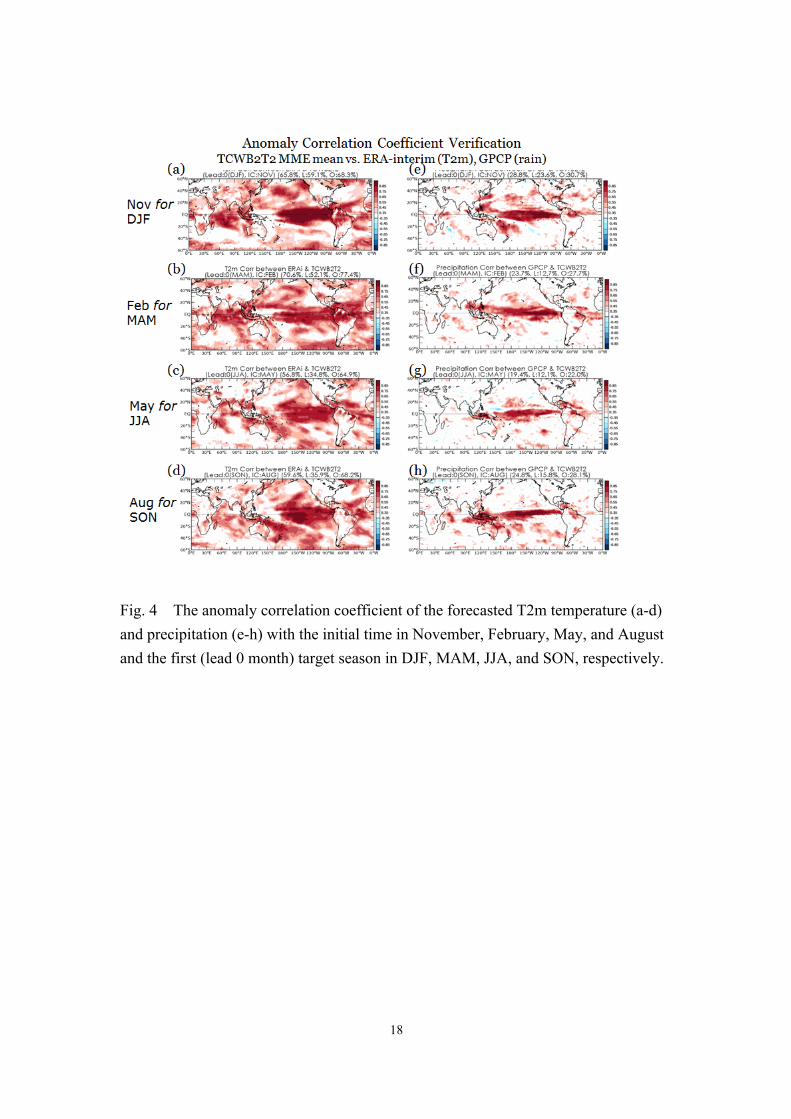
Fig. 4 shows the anomaly correlation coefficient (ACC) verification results for the 120-member ensemble mean forecast for 2-meter air temperature (T2m) and precipitation with the initial time in November, February, May, and August and the target seasons in DJF, MAM, JJA, and SON, respectively. The grids with the ACCs significant at 95% confidence level are colored. The number of grids with significant ACC decreases sharply with the lead time (not shown). Fig. 4 clearly shows that the T2m forecast is much better than precipitation. For T2m forecast, MAM is the season with the highest percentage (71%) of the grids with significant ACC. For the T2m forecast over land, DJF is the season with the highest percentage (59%) of the grids with significant ACC. For precipitation forecast, high ACCs are concentrated in the tropics. The ACCs with latitudes higher than 30S and 30N are not significant. Over the western Pacific and Indonesia maritime continent equatorial region, it shows that the ACCs are higher in winter hemisphere than in summer. Around Taiwan, for T2m we see significantly high ACCs in all seasons but for precipitation the high ACCs only appear in DJF and SON.
3.2.2 Ranked probability skill score (RPSS) maps
The ACC cannot measure the performance of a probabilistic category forecast. The

8
ranked probability skill score (RPSS) is an ideal verification tool to represent the performance of probabilistic forecast. The RPSS is an extension of the Brier skill score to more than two categories (Barnston et al. 2010). RPSS measures the accumulated difference between the categorical forecast probability and the corresponding observed ‘‘probability’’ (100% probability assigned to the observed category, 0% otherwise) with respect to a reference forecast. Here the reference forecast is the climatology forecast of one-third probability for each category. RPSS is positive when the cumulative squared probability error is less than that of the reference forecast.
Fig. 5 shows the RPSS of TCWB2T2 based on the 30 years of retrospective forecast for T2m and precipitation in tercile-based categorical probability. It clearly shows higher forecast skill for T2m over the tropical oceans. For precipitation the higher skill appears over the tropics. The forecast around Taiwan shows the highest skill in MAM for T2m and in DJF for T2m.
4 TCWB2T2 real-time forecast examples
Few example products of TCWB2T2 with the last forecast initial time on 15 May 2016 are presented here.
Fig. 6 shows the SST probabilistic forecast for the season of JJA masked by the positive values of the Gilbert Skill Score (GSS). It shows that along the equator to the west of 150W the SST shows some possibility of below normal, although most subtropical area over the east Pacific shows high possibility of above normal. Over the west half of the Pacific Ocean, the probability of below normal SST is high in most areas. The above normal probability is rather high over the Indian Ocean and the marginal seas around the Australia-Asia land bridge region. The above normal SST is less pronounced over the Atlantic Ocean.
Fig. 7 shows the probabilistic forecast for precipitation rate for the season of JJA masked by the positive GSS. Over the North Pacific subtropics from the Philippine Sea to the Hawaii islands along the latitudes of from 10N to 20N are marked by higher probability of below normal rain. The highest below normal probability is seen near equator to 5S, from Sulawesi, Indonesia to eastern Pacific.
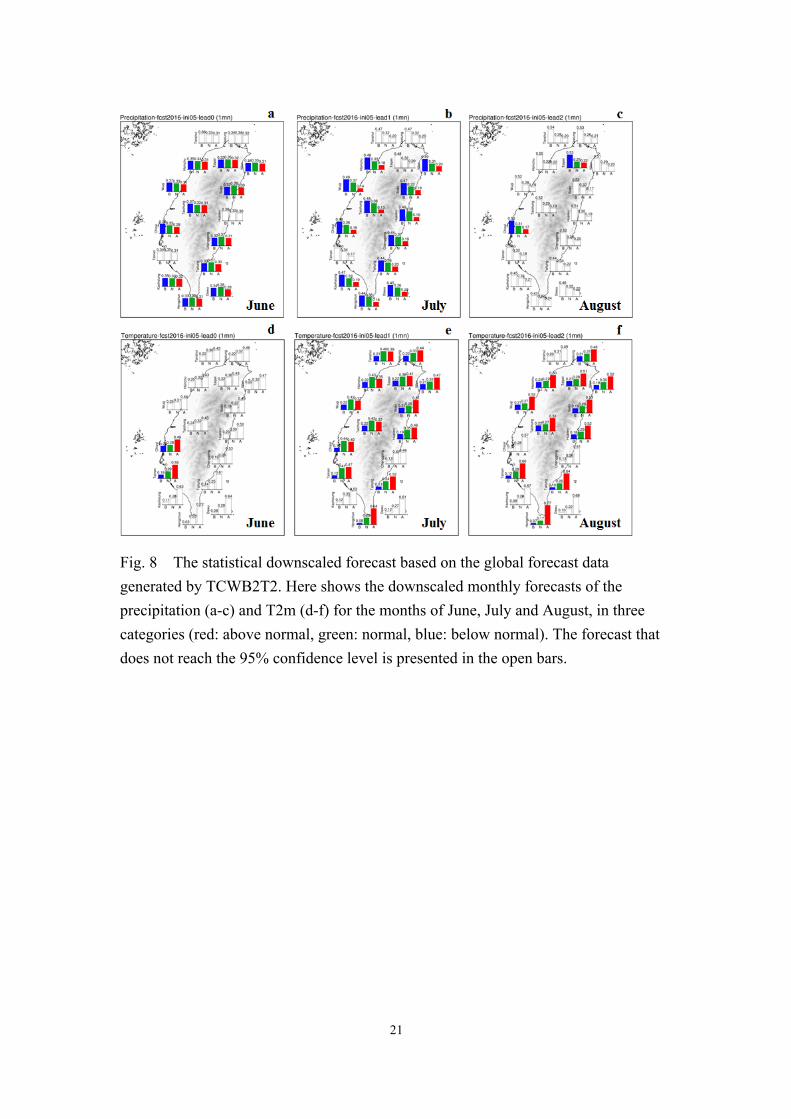
The precipitation and temperature forecast generated by TCWB2T2 is statistically downscaled to 16 Taiwan weather stations. Fig. 8 shows the downscaled forecast results. The forecast that did not pass the 95% confidence test is presented in the open bars. In general, the forecast shows high possibility of below normal rain in July and high possibility of warmer than normal temperature in August. The forecast signal is very weak for precipitation in August and temperature in June.
9
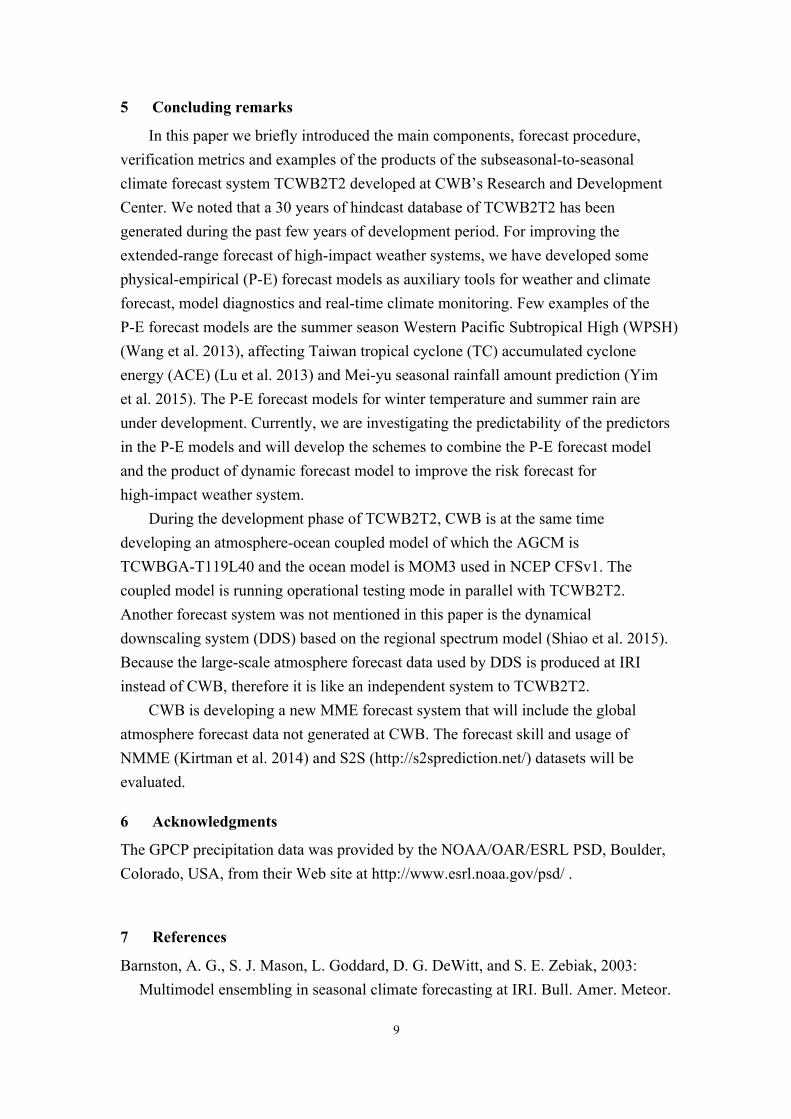
5 Concluding remarks
In this paper we briefly introduced the main components, forecast procedure, verification metrics and examples of the products of the subseasonal-to-seasonal climate forecast system TCWB2T2 developed at CWB’s Research and Development Center. We noted that a 30 years of hindcast database of TCWB2T2 has been generated during the past few years of development period. For improving the extended-range forecast of high-impact weather systems, we have developed some physical-empirical (P-E) forecast models as auxiliary tools for weather and climate forecast, model diagnostics and real-time climate monitoring. Few examples of the P-E forecast models are the summer season Western Pacific Subtropical High (WPSH) (Wang et al. 2013), affecting Taiwan tropical cyclone (TC) accumulated cyclone energy (ACE) (Lu et al. 2013) and Mei-yu seasonal rainfall amount prediction (Yim et al. 2015). The P-E forecast models for winter temperature and summer rain are under development. Currently, we are investigating the predictability of the predictors in the P-E models and will develop the schemes to combine the P-E forecast model and the product of dynamic forecast model to improve the risk forecast for high-impact weather system.
During the development phase of TCWB2T2, CWB is at the same time developing an atmosphere-ocean coupled model of which the AGCM is TCWBGA-T119L40 and the ocean model is MOM3 used in NCEP CFSv1. The coupled model is running operational testing mode in parallel with TCWB2T2. Another forecast system was not mentioned in this paper is the dynamical downscaling system (DDS) based on the regional spectrum model (Shiao et al. 2015). Because the large-scale atmosphere forecast data used by DDS is produced at IRI instead of CWB, therefore it is like an independent system to TCWB2T2.
CWB is developing a new MME forecast system that will include the global atmosphere forecast data not generated at CWB. The forecast skill and usage of NMME (Kirtman et al. 2014) and S2S (http://s2sprediction.net/) datasets will be evaluated.
6 Acknowledgments
The GPCP precipitation data was provided by the NOAA/OAR/ESRL PSD, Boulder, Colorado, USA, from their Web site at http://www.esrl.noaa.gov/psd/ .
7 References
Barnston, A. G., S. J. Mason, L. Goddard, D. G. DeWitt, and S. E. Zebiak, 2003: Multimodel ensembling in seasonal climate forecasting at IRI. Bull. Amer. Meteor.

10
Soc., 84, 1783–1796. Barnston, A. G., S. Li, S. J. Mason, D. G. DeWitt, L. Goddard, and X. Gong, 2010:
Verification of the first 11 years of IRI’s seasonal climate forecasts. J. Appl. Meteor. Climatol., 49, 493–520.
Chang, C.-P. and M.-M. Lu, 2012: Intraseasonal Predictability of Siberian High and East Asian Winter Monsoon in Recent Decades, J. Climate, 25, 1773-1778。
Goswami, B. N., B. Krishnamurthy, and H. Annamalai, 1999: A broad-scale circulation index for interannual variability of the Indian summer monsoon. Quart. J. Roy. Meteor. Soc., 125, 611-633.
Jhun, J.G. and E. J Lee, 2004 : A new East Asian winter monsoon index and associated characteristics of the winter monsoon, J. Climate, 17, 711-726.
Kirtman, B. P., and Coauthors, 2014: The North American Multimodel Ensemble: Phase-1 seasonal-to-interannual prediction; Phase-2 toward developing intraseasonal prediction. Bull. Amer. Meteor. Soc., 95, 585–601, doi:10.1175/BAMS-D-12-00050.1.
Kug, Jong-Seong and In-Sik Kang,2000:The impacts of the model assimilated wind stress data in the initialization of an intermediate ocean and the ENSO predictability. Geophysical Research Letters, 28,3713-3716.
Krishnamurti, T. N., Kishtawal, C. M., Shin, D. W. and Williford, C. E., 2000: Multi-model superensemble forecasts for weather and seasonal climate. J. Climate, 13, 4196–4216.
Lee, S.-Y. and M.-M. Lu, 2014: East Asian winter monsoon and Taiwan climate real-time monitoring and analysis: Applied to 2010-2013 winters. Atmos. Sci., 42, 87-112. (in Chinese)
Li Y., and S. Yang, 2010 : A dynamical index for the East Asian winter monsoon. J. Climate, 23, 4255-4262.
Li, T. and B. Wang, 2005: A review on the western North Pacific monsoon: Synoptic-to-Interannual variabilities. Terr. Atmos. Ocean., 16, 285-314.
Lu, M.-M., C.-T. Lee, and B. Wang, 2013: Seasonal prediction of accumulated tropical cyclone kinetic energy around Taiwan and the sources of the predictability. Int. J. Climatol.,33, 2846-2854
Reynolds, R. W., T. M. Smith, C. Liu, D. B. Chelton, K. S. Casey, and M. G. Schlax, 2007: Daily high-resolution blended analyses for sea surface temperature. J. Climate, 20, 5473-5496.
Saha, S., and Coauthors, 2010: The NCEP Climate Forecast System Reanalysis. Bull. Amer. Meteor. Soc., 91, 1015–1057, doi:10.1175/2010BAMS3001.1.
Wang, B., and Z. Fan, 1999: Choice of South Asian Summer Monsoon Indices. Bull. Amer. Meteor. Sci., 80, 629-638.

11
Wang, B., F. Huang, Z. W. Wu, J. Yang, X. H. Fu, and K. Kikuchi, 2009: Multi-scale climate variability of the South China Sea monsoon: A review. Dyn. Atmos.Oceans, 47, 15–37, doi: 10.1016/j.dynatmoce.2008.09.004.
Wang, B, J. Liu, H. J. Kim, P. J. Webster, S. Y. Yim, 2012: Recent changes of the global monsoon precipitation (1979–2008). Clim Dyn 39(5):1123–1135, 10.1007/s00382- 011-1266-z.
Wang, B., R. Wu, and K. M. Lau, 2001: Interannual variability of Asian summer monsoon: Contrast between the Indian and western North Pacific-East Asian monsoons. J. Climate, 14, 4073-4090.
Webster, P., and S. Yang, 1992: Monsoon and ENSO: Selectively interaction system. Quart. J. Meteor. Soc., 66, 398-412.
Wu, M.C., and J.C.L. Chan, 2005: Observational relationships between summer and winter monsoons over East Asia. Part I: Basic framework. Int. J. Climatol. 25, 437-451.
Wu, B-Y and J. Wang, 2002 : Winter Arctic Oscillation, Siberian high and East Asian winter monsoon. Geophy. Res. Lett., 29, 3-1~3-4.
Yim, S.-Y., B. Wang, W. Xing, and M.-M. Lu, 2015: Prediction of Meiyu rainfall in Taiwan by multi-lead physical-empirical models. Clim. Dyn. 44,11-12, pp 3033-3042. DOI :10.1007/s00382-014-2340-0.
Yun, W. T., L. Stefanova, and T. N. Krishnamurti., 2003: Improvement of the superensemble technique for seasonal forecasts. J. Climate, 16, 3834–3840.
Zhang Q, Chen L, Tao S, Qiao Y. 2000. Definition and prediction of the East Asian monsoon, and the Asian atmospheric circulation. In On the Research of Short-Range Climate Prediction System in China, Part 4: Formulation of Short-Range Climate Monitoring; Prediction; Operational Services System. Meteorological Press: 169–184 (in Chinese).

12
Table 1 Comparison of the first and second versions of Taiwan CWB two-tiered subseasonal-to-seasonal multi-model and multi-member ensemble forecast systems, TCWB2T1 and TCWB2T2. Please read the text for detailed explanation.
CWB-2T-CFSv1
CWB-2T-CFSv2
AGCM / SSTs
1. TCWBGA-T42L18 / NCEPCFS_SST
2. TCWBGA-T42L18/ CWBOPGSST1
3. ECHAM5.2_T42L19/ NCEPCFS_SST
4. ECHAM5.2_T42L19/ CWBOPGSST1
1. TCWBGA-T119L40 / NCEPCFS_SST
2. TCWBGA-T42L18/ CWBOPGSST1
3. ECHAM5.2/ NCEPCFS_SST
4. ECHAM5.2/ CWBOPGSST1
CWB OPGSST predictors
Persistence, NINOp6f7, Pslp3f1, TPOHC, ICM2a, ICM2b
Persistence, NINOp6f7, OHC(SVD), SWTssfc(STPM), ICM2a, ICM2b
TCWBGA physics
� Radiaton- Harshvardhan et al. (1987) � Cumulus convection - Relax Arakawa-Schubert (Moothi and Suarez (1992) � Grid-scale precipitation – Diagnostic method (RH value) � Shallow cumulus convection – Li and Young (1993) � Boundary-layer – TKE-ɛ (Detering and Etling 1985) � Land model – Bucket (Manebe 1969) � Surface-layer – Similarity (Businger 1971) � Gravity wave drag – Palmer et al. (1986)
� Radiaton- Fu and Liou (1992, 1993), Fu et al. (1997) � Cumulus convection - Simplified Arakawa-Schubert (Pan and Wu 1995) � Grid-scale precipitation – Predict cloud water scheme (Zhao and Frederick 1997) � Shallow cumulus convection – Li (1994) � Boundary-layer – First-order nonlocal (Troen and Mahrt 1986) � Land model – NOAH (Ek et al. 2003) � Surface-layer – Similarity (Businger 1971) � Gravity wave drag – Palmer et al. (1986)
Forecast initial data
� Retrospective forecast (1981-2005): Air – NCEP/DOE Reanalysis (R2); SST – NCEP/CFSv1 � Real-time forecast (2010-present): Air – NCEP/GDAS; SST – NCEP/CFSv2
� Retrospective forecast (1982-2011): Air – NCEP/CFSR; SST – NCEP/CFSRR � Real-time forecast (2016-present): Air – NCEP/CFSR; SST – NCEP/CFSRR
Forecast schedule
� Initial condition: last 10 days of each month from NCEP/GDAS. � 4 members run in all IC+2 days (TCWBGA/OPGSST1,
� Initial condition: everyday 12Z from NCEP/CDAS; OPGSST– 15th of each month from NOAA & BoM. � 2 members run daily in all

13
TCWBGA/NCEPCFS2, ECHAM/OPGSST1, ECHAM/NCEPCFS2) with 7 months forecasting. � 40 members of the monthly forecast are collected on the 3rd of each month. � Each member need about 40 minutes for model running and another 30 minutes for post process.
IC+2 days (TCWBGA/NCEPCFS2, ECHAM/NCEPCFS2) with 9 months forecasting. � On the 17th of every month make 30 members run to complete the members from 1st to 15th, and 2 members daily IC+2 run from 18th to the 2nd of next month. (TCWBGA/OPGSST2, ECHAM/OPGSST2) with 9 months forecasting. � 120 members of the monthly forecast are collected on the 20th of each month. � Each member need about 486 minutes for model running and another 852 minutes for post process.
14
Table 2 The forecast performance evaluation matrices of TCWB2T2 Name Variables Description
I. Basic verification – global Mean climatology
Rain, Temperature Mean
Mean variance
Rain, Temperature Mean, Variance
Mean bias
Rain, Temperature Mean, Difference
Pattern correlation coefficient (PCC)
Rain, Temperature PCC of mean climatology
Anomaly correlation coefficient (ACC)
Rain, Temperature Temporal correlation of anomaly maps at each grid
Root mean square error (RMSE)
Rain, Temperature RMSE calculated from the mean bias
Heidke skill score (HSS)
Rain, Temperature HSS (Tercile forecasts evaluation)
Gerrity skill score (GSS)
Rain, Temperature GSS (Tercile forecasts evaluation)
Ranked probability skill score (RPSS)
Rain, Temperature RPSS (Forecast full probability, PDF, evaluation)
Relative/Receiver Operating Characteristic score (ROC)
Rain, Temperature ROC score (Forecast full probability, 10 bins, evaluation)
II. Verification for different regions Global Rain, Temperature Seasonal contrast – global monsoon
(30S-30N) Tropical belt (30S-30N): AF(0-50E), IO(50E-110E), WP(110E-180E), EP(180W-80W), AO(80W-0)
Rain, Temperature RMSE, ACC
Taiwan and surrounding region (TAIWAN) (0-40N, 100E-150E)
Rain, Temperature RMSE, ACC for five areas: NW2TW, SW2TW,TW,SE2TW, NE2TW
II. East Asia and western North Pacific (EAWNP) monsoon evaluation
Winter monsoon
Sea Level Pressure (SLP), U-300hPa, U-200hPa
Bias, RMSE, Correlation coefficient, GSS of the monsoon indices
Summer monsoon
(U,V) at 850hPa and 200hPa
Bias, RMSE, Correlation coefficient, GSS of the monsoon indices
West Pacific Subtropical High (WPSH)
GPH at 850hPa RMSE, Correlation coefficient, GSS of the WPSH index
15
Fig. 1 The main components of the dynamical-statistical climate prediction system developed at Taiwan Central Weather Bureau. TCWB2T2 stands for the Taiwan CWB 2-tiered climate forecast system version 2. TCWB1T1 stands for the Taiwan CWB 1-tiered climate forecast system version 1, which is actually a atmosphere-ocean coupled model for monthly and seasonal forecast. See the text for details.

16
Fig. 2 The temporal correlation between the forecasted SST over the Nino3.4 area and observation. The x-axis is the forecast target month, the y-axis is the lead time in months. The left panel is the first version of OPGSST, the right panel is the second version of OPGSS.

17
Fig. 3 The operational forecast schedule of TCWB2T2. See the text for details.
18
Fig. 4 The anomaly correlation coefficient of the forecasted T2m temperature (a-d) and precipitation (e-h) with the initial time in November, February, May, and August and the first (lead 0 month) target season in DJF, MAM, JJA, and SON, respectively.

19
Fig. 5 The same as Fig. 4 but for RPSS.

20
Fig. 6 The SST probabilistic forecast masked by the positive values of the Gilbert Skill Score (GSS). GSS > 0 means the forecast is better than random guess. Red color marks above normal, green normal and blue below normal category. Darker color represents higher probability.
Fig. 7 The precipitation rate probabilistic forecast masked by the positive GSS. Red color marks above normal, green normal and blue below normal category. The northern hemisphere subtropics from the South China Sea to the western North Pacific along the latitudes of from 10N to 20N are marked by less than normal rain. The colors around Taiwan show the condition of weak above normal.
21
Fig. 8 The statistical downscaled forecast based on the global forecast data generated by TCWB2T2. Here shows the downscaled monthly forecasts of the precipitation (a-c) and T2m (d-f) for the months of June, July and August, in three categories (red: above normal, green: normal, blue: below normal). The forecast that does not reach the 95% confidence level is presented in the open bars.