lowering the bar: options for the automotive industry to ... · 2.3 strategic and tactical...
TRANSCRIPT

Options to achieve 80g/km CO2 by 2020
Centre for Automotive Industry Research & ESRC BRASS Centre, Cardiff University, Cardiff, Wales, UK Page 1
Lowering the bar: options for the automotive industry to
achieve 80g/km CO2 by 2020 in Europe
May 2010 CAIR/BRASS, Cardiff University, Cardiff, Wales, UK Authors:
Peter Wells Paul Nieuwenhuis Hazel Nash Lori Frater

Options to achieve 80g/km CO2 by 2020
Centre for Automotive Industry Research & ESRC BRASS Centre, Cardiff University, Cardiff, Wales, UK Page 2
This study has been commissioned by Greenpeace International. The views and opinions expressed herein are those of the authors alone, and do not constitute a policy position or opinion by Greenpeace International.

Options to achieve 80g/km CO2 by 2020
Centre for Automotive Industry Research & ESRC BRASS Centre, Cardiff University, Cardiff, Wales, UK Page 3
TABLE OF CONTENTS
EXECUTIVE SUMMARY ........................................................................................................ 6
ABBREVIATIONS ................................................................................................................ 12
1. INTRODUCTION ............................................................................................................. 14
1.1 The background story ........................................................................................................................................ 14
1.2 Why has progress been so slow? ....................................................................................................................... 15
1.3 A Brief Overview of the Existing Regulatory Framework ................................................................................... 17
1.4 The Scenarios ..................................................................................................................................................... 19
Chapter 2 – Scenario I (un) conventional technologies ....................................... 21
2.1 Internal Combustion .......................................................................................................................................... 21
2.3 Strategic and tactical approaches to reduce CO2 emissions by the vehicle manufacturers .............................. 28
2.4. Incremental (tactical) optimisation: existing designs ....................................................................................... 29
2.5 Incremental (tactical) optimisation: new designs .............................................................................................. 34
2.6 Radical (strategic) optimisation: new designs ................................................................................................... 35
2.7 Technology packages for low-carbon cars ......................................................................................................... 35
2.8 Modelling the Market Mix for Low Carbon ....................................................................................................... 37
2.9 Legislative and policy framework for Scenario 1 ............................................................................................... 38
2.10 Summary .......................................................................................................................................................... 40
Chapter 3 – Scenario 2: Electric Vehicles. ................................................................. 42
3.1 Introduction ....................................................................................................................................................... 42
3.2 Hybrids ............................................................................................................................................................... 47
3.3 Batteries ............................................................................................................................................................. 47
3.4 Costs .................................................................................................................................................................. 51
3.5 Measuring CO2 from EVs .................................................................................................................................... 54
3.5.1 The Kendall Method ................................................................................................................................... 54

Options to achieve 80g/km CO2 by 2020
Centre for Automotive Industry Research & ESRC BRASS Centre, Cardiff University, Cardiff, Wales, UK Page 4
3.6 EVs and Alternative Business Models ................................................................................................................ 56
3.6.1 Car Clubs – part of the solution? ................................................................................................................ 56
3.6.2 Better Place................................................................................................................................................. 58
3.7 Legislative and policy framework for Scenario 2 ............................................................................................... 59
3.7.1 Supporting Measures .................................................................................................................................. 61
3.8 Summary ............................................................................................................................................................ 62
Chapter 4 – Scenario 3: Vehicle Performance Reduction .................................... 65
4.1 Context .............................................................................................................................................................. 65
4.2 Vehicle performance parameters: the bigger picture ....................................................................................... 65
4.3 Power and weight: technological solutions ....................................................................................................... 69
4.4 De-powering and weight reductions to achieve 80 g/km.................................................................................. 74
4.5 Top speed restrictions ....................................................................................................................................... 75
4.6 Acceleration restrictions .................................................................................................................................... 76
4.7 Legislative and policy framework for Scenario 3 ............................................................................................... 78
4.8 Summary ............................................................................................................................................................ 79
Chapter 5 – Scenario 4: Market/Segment Shift ....................................................... 81
5.1 Shifts within segments ....................................................................................................................................... 81
5.2 Segmentation..................................................................................................................................................... 82
5.3 New segments ................................................................................................................................................... 85
5.3.1 What is a Car? ............................................................................................................................................. 86
5.3.2 Voiturettes .................................................................................................................................................. 86
5.3.3 The Car – Motorcycle Interface .................................................................................................................. 87
5.4 Fun v Green ........................................................................................................................................................ 90
5.5 Barriers to introduction ..................................................................................................................................... 90
5.6 Legislative and policy framework for Scenario 4 ............................................................................................... 91
Chapter 6 – Conclusion: How to get to 80 g/km ..................................................... 95

Options to achieve 80g/km CO2 by 2020
Centre for Automotive Industry Research & ESRC BRASS Centre, Cardiff University, Cardiff, Wales, UK Page 5
6.1 Combining the Scenarios ................................................................................................................................... 95
6.2 Costs and the achievement of 80 g/km ........................................................................................................... 101
6.3 Role of the Customer ....................................................................................................................................... 102
6.4 The limits of CO2 regulation ............................................................................................................................. 103
References ......................................................................................................................... 105

Options to achieve 80g/km CO2 by 2020
Centre for Automotive Industry Research & ESRC BRASS Centre, Cardiff University, Cardiff, Wales, UK Page 6
EXECUTIVE SUMMARY In April 2009, the EU adopted Regulation 443/2009 which establishes a CO2 emission target of 130 gramme per kilometre (g/km) for the average of new cars sold by 2015, with an over-arching target of 120 g/km for the entire average new car fleet to be reached by 2015. By 2020, there is a target of to limit CO2 emissions from new cars to 95 g/km. The purpose of this report is to explore to what extent it is feasible for the automotive industry to meet a target of 80 g/km of CO2 by 2020.
Until recently, the automotive industry had been slow to embrace the challenge of CO2 emission reductions. The industry has repeatedly emphasised that its product is characterised by long lead times, and that it is therefore impossible to respond quickly to new regulatory demands or indeed market demands. However, in recent years, there has been an unprecedented rate of increase in the rate of average fleet CO2 emissions reductions.
Previous research in this area has determined that, in Europe, average emissions from new cars sold can be reduced to 95 g/km by 2020 at most. However, much of this research has focused on technology improvements as a solitary means of achieving the reduction. The findings of this report are based on an assessment of four different future scenarios, which cumulatively can achieve a lower target of 80 g/km of CO2. The final chapter of the report combines the various scenario possibilities into one larger analysis that charts the potential solution to achieve 80 g/km CO2 emissions by 2020. In so doing, aspects of all the scenarios are brought together into a hypothetical but plausible mix of vehicle technologies, design strategies, and segment mixes to arrive at the 80 g/km figure.
The four scenarios are based upon: the role of conventional vehicles; electric vehicles; vehicle performance and market shifts.
Scenario 1: Conventional vehicles - with a focus on the existing internal combustion engine car, but with the target of greatest possible CO2 emissions reductions through improvements in conventional powertrain including hybrids alongside improvements in non-powertrain items including weight reduction through materials substitution, improved aerodynamics, greater efficiency in secondary systems, and related measures such as driver information systems on fuel consumption.
Scenario 2: Electric vehicles, particularly a higher proportion of such vehicles - exploring to what extent this is feasible and what the implications would be if this was promoted.
Scenario 3: Vehicle performance - performance reduction as a means to achieve lower CO2 emissions. The initial challenge is to come up with a satisfactory definition of what constitutes vehicle performance. We propose an approach and also highlight a number of initiatives in this area and what CO2 emission improvements these promise for the future.

Options to achieve 80g/km CO2 by 2020
Centre for Automotive Industry Research & ESRC BRASS Centre, Cardiff University, Cardiff, Wales, UK Page 7
Scenario 4 Market shift – to what extent can shifting within and between segments lead to reduced CO2 emissions and also, is there room below existing segments to allow existing smaller cars to move into in order to help reach an average level of 80 g/km of CO2.
Each scenario takes into account developments in vehicle technology as well as vehicle performance and fleet mix. For each scenario, the study outlines what policy measures are needed to achieve the relevant changes, both at EU and national level.
The scenarios are based on a common methodology and output and compared on the basis of the following four criteria:
• Average cost per vehicle to the manufacturer;
• Lock-in effects impacting further efficiency improvements until 2050;
• Co-benefits e.g. in the areas of safety, air pollution, noise; and
• Analysis of the potential implications for vehicle manufacturers, consumers, regulators and of course the environmental impact.
The findings of the report illustrate that a target of 80 g/km of CO2 is possible and that there are a number of different pathways that can enable this aim to be achieved. The analysis which combines the findings per scenario is conducted at the aggregate level to apply to the entire industry rather than an individual vehicle manufacturer, although it is clearly the case that each vehicle manufacturer will have to arrive at some form of portfolio mix that allows such a target to be attained.
Key Findings
The report provides two sets of key findings; the first is a possible break down for the mix of technologies that could obtain 80 g/km where relevant in the appropriate scenario. The second is the findings arising out of the comparison for each scenario using the four criteria. This analysis is provided in Table 1.
The possible percentage break down for the mix of technologies that could obtain 80g/km per scenario are: Scenario 1:
o Standard vehicles @ 153 g/km 0 per cent market share o Battery electric vehicles @ 36 g/km 3 per cent market share o Eco-variants plus stop start @ 95 g/km 20 per cent market share o Petrol hybrid @ 80 g/km 40 per cent market share o Diesel hybrid @ 75 g/km 35 per cent market share o Plug in hybrid @ 50 g/km 2 per cent market share
Scenario 2:
o Standard vehicles @ 153 g/km 10 per cent market share o Battery electric vehicles @ 36 g/km 10 per cent market share o Eco-variants plus stop start @ 95 g/km 20 per cent market share o Petrol hybrid @ 80 g/km 25 per cent market share

Options to achieve 80g/km CO2 by 2020
Centre for Automotive Industry Research & ESRC BRASS Centre, Cardiff University, Cardiff, Wales, UK Page 8
o Diesel hybrid @ 75 g/km 20 per cent market share o Plug in hybrid @ 50 g/km 15 per cent market share
Scenario 3: It is difficult to model this scenario in a meaningful way, as many small and medium cars currently available already meet the criteria of limited top speed, relatively modest weight and unspectacular acceleration. A move towards such vehicles would therefore meet the requirements here.
Scenario 4: A fleet average of 79 g/km of CO2 was obtained as a result of the following percentage of market share in 2020:
o Mini 0.99% o Super-mini 32.11% o Lower medium 29.66% o Upper medium 16.80% o Executive 4.28% o Luxury saloon 0.56% o Specialist sports 2.27% o Dual purpose 7.50% o Multi-purpose vehicle 5.32%.
Aggregate of Scenarios: Table 6.4 of the report illustrates a possible mix based on what might be plausible and affordable for vehicle manufacturers and suppliers, for consumers and for regulators. The chapter illustrates that there are a great many potential outcomes that would yield 80 g/km or better. The chapter also provides a forecast of a technology mix for power-trains by 2020, recognising that electric powertrain will still be in a minority, albeit a growing one. The mix is:
o Standard vehicles 15 per cent market share o Battery electric vehicles 10 per cent market share o Eco-variants plus stop start 50 per cent market share o Petrol hybrid 15 per cent market share o Diesel hybrid 5 per cent market share o Plug-in hybrid 5 per cent market share
The report also highlights the need for a change in the regulatory regime to reflect energy use rather than CO2 emissions per kilometre. The old basis of CO2 is effectively like using twentieth century metrics grounded in the technologies of the past when what is required is a twenty first century metric that no longer defines the technological solutions. Such a metric could be the use of kWh/km as a basic measure of efficiency and as a starting point for regulatory intervention.

Options to achieve 80g/km CO2 by 2020
Centre for Automotive Industry Research & ESRC BRASS Centre, Cardiff University, Cardiff, Wales, UK Page 9
Table 1: Assessment of criteria per scenario
Criteria Scenario 1 Scenario 2 Scenario 3 Scenario 4
Average cost per vehicle to the manufacturer
Within acceptable limits as existing product development programmes would be biased towards carbon reduction, rather than comfort features.
These would be high.
High if opting for the Loremo model, low if opting for the de-powering model, although this would lead to loss of margins on these more basic models. Efforts would have to be made to start selling technology rather than gadgets and rebuilding margins that way.
Low, although this could lead to loss of margins on these more basic models. Efforts would have to be made to start selling the technology used to achieve these low emissions (e.g. BMW ‘Efficient Dynamics’, VW ‘Blue Motion’, etc.) rather than gadgets and rebuilding margins that way – the challenge would be in marketing as much as engineering.
Lock in effects These may be limited as by 2020, or certainly 2030, the limits of what is possible with IC technology may well be reached, or at least the law of diminishing returns will limit any gains.
Very high, as this would put the EU on a clear potential zero-emissions trajectory, something the other scenarios cannot match.
Medium, there would still be emissions, but these would be reduced significantly , although de-powering and weight reduction could work as a prerequisite for EV penetration in that over-engineering will not be possible for those as lightweight structures are needed to compensate for battery weight and to extend
Relatively low, as we would be dealing with existing mainstream technologies, by and large.

Options to achieve 80g/km CO2 by 2020
Centre for Automotive Industry Research & ESRC BRASS Centre, Cardiff University, Cardiff, Wales, UK Page 10
range.
Co-benefits In the areas of safety, air pollution, noise: air pollution will also be reduced; neutral in terms of safety, although some EV safety issues may need to be addressed.
In the areas of safety, air pollution, noise: air pollution would be much reduced, some would be displaced from urban areas to the generating facilities, while vehicle-generated noise would be dramatically reduced. Some EV safety issues may need to be addressed.
In the areas of safety, air pollution, noise: to the extent that current small cars are safe, excluding heavier vehicles would enhance their safety, while speed reduction would also have great safety benefits; toxic pollutants would be reduced, although noise levels would not improve, as most noise-reduction involves adding weight (Lotus-type electronic noise cancelling systems have not seen widespread implementation, but could be boosted under this scenario).
In the areas of safety, air pollution, noise: to the extent that current cars are safe, there would be no change in that area; toxic pollutants would also be reduced, although noise levels would not improve.
Potential implications: vehicle manufacturer
Increased product development need, but unlikely to increase cost beyond existing trends; acting on CO2 increasingly part of ‘licence to operate’ and also increasingly a factor in competition.
High cost, steep learning curve in the adoption of new powertrain technologies; increased dependence on specialist suppliers
Loss of profitability and the cost of transforming from selling gadgets to selling CO2 reduction and fuel efficiency technologies; possible need to introduce new powertrain types, lightweight materials, etc.
Loss of profitability and the cost of transforming from selling gadgets to selling CO2 reduction and fuel efficiency technologies; possible need to introduce new powertrain types, lightweight materials,

Options to achieve 80g/km CO2 by 2020
Centre for Automotive Industry Research & ESRC BRASS Centre, Cardiff University, Cardiff, Wales, UK Page 11
etc.
Potential implications: consumers
Benefit in lower fuel cost, or at least (partial) compensation for the inevitable rise in fuel costs.
Increased cost of vehicle batteries (could be reduced through leasing, car sharing, etc.); somewhat offset by lower ‘fuel’ costs and lower maintenance costs
Would benefit through better fuel consumption, which would compensate for inevitably higher fuel prices; also through lower running costs in other respects as a result of simpler, more robust technologies.
Would benefit through better fuel consumption, which would compensate for inevitably higher fuel prices.
Potential implications: regulators
Will benefit from continuing tax revenue stream at little cost; strong regulatory support and some incentives may be needed.
Consumers: Regulators: would have a considerable responsibility in incentivising for EVs, adapting regulatory regimes to accommodate EVs, incentivise power generators toward carbon-neutral or zero-carbon generating solutions.
Would find it a challenge to convince the existing car industry to redirect its efforts; however, creative new entrants could create new jobs and new IP with wider social and economic benefits.
Relatively low effort, as the technologies are coming in any case; incentives would have to be provided to make consumers choose these options, or make manufacturers restrict choice to these options.

Options to achieve 80g/km CO2 by 2020
Centre for Automotive Industry Research & ESRC BRASS Centre, Cardiff University, Cardiff, Wales, UK Page 12
ABBREVIATIONS ACEA Association des Constructeurs Europeens d’Automobiles
(European Automobile Manufacturers Association) ADAC Allgemeiner Deutscher Automobil-Club AEA Atomic Energy Agency (Leading UK energy and climate
change consultancy) BEV Battery Electric Vehicle BHP Brake Horse Power BYD Build Your Dreams – Chinese car company CAFE Standards Corporate Average Fuel Economy Standards CARB California Air Resources Board CCC UK Commission on Climate Change CTL Coal to liquid CVT Continually Variable Transmission EC European Commission EOV Environmentally Optimised Vehicle ETSC European Transport Safety Council EV Electric Vehicle EU European Union FCEV Fuel Cell Electric Vehicle GMD Gordon Murray Design GPS Global Positioning System GSI Gear Shift Indicator GTL Gas to liquid HEV Hybrid Electric Vehicle IC Internal Combustion ICEV Internal Combustion Engine Vehicle IEA International Energy Agency IPR Intellectual Property Rights IVT Infinitely Variable Transmission LCV Light Commercial Vehicle Low CVP UK Low Carbon Vehicle Programme NEDC New European Drive Cycle NVH Noise, Vibration and Harshness PBP Project Better Place PHEV Plug-in Hybrid Electric Vehicle R&D Research and Development SMMT The UK Society of Motor Manufacturers and Traders Limited SUV Sports Utility Vehicle T&E Transport and the Environment – an NGO UNECE United Nations Economic Commission for Europe VSP Voiture sans permis WBCSD World Business Council for Sustainable Development

Options to achieve 80g/km CO2 by 2020
Centre for Automotive Industry Research & ESRC BRASS Centre, Cardiff University, Cardiff, Wales, UK Page 13
WWII World War II ZEV Zero Emissions Vehicle

Options to achieve 80g/km CO2 by 2020
Centre for Automotive Industry Research & ESRC BRASS Centre, Cardiff University, Cardiff, Wales, UK Page 14
1. INTRODUCTION The purpose of this report is to explore to what extent it is feasible for the automotive industry to meet a target of 80 g/km of CO2 for new cars sold in Europe by 2020. We show that this is indeed possible and that there are a number of different ways this could be achieved; we have captured this in a number of scenarios, the details of which are outlined at the end of this chapter. Subsequent chapters then discuss each of these scenarios, with the final chapter providing a synthesis of those outlined in previous chapters.
1.1 THE BACKGROUND STORY
In April 2009, the EU adopted Regulation 443/2009 which establishes a CO2 emission target of 130 g/km for the average of new cars sold by 2015. Using a number of different future scenarios, this report seeks to demonstrate that more a stringent CO2 emission reduction target of 80 g/km is technically and practicably feasible.
An important consideration to any proposal seeking to establish more stringent CO2 emission reductions for M1 vehicles (passenger cars) than established under Regulation (EC) 443/2009 is the impact on the existing regulatory framework and the role that legislation and policy play in supporting the practical achievement of these targets. It is therefore necessary to address, in broad terms, the existing regulatory framework under which car manufacturers as well as a multitude of other stakeholders operate (see also Appendix 1). This will provide the basis from which to identify measures which need to be introduced to secure the 80g CO2/km target by 2020.
The automotive industry is heavily implicated in carbon emissions. Although it has made some efforts to improve performance in recent years, it has failed to grasp the magnitude and urgency of the task facing it. The EU industry association ACEA claims that:
‘During the last ten years of relative economic stability, manufacturers delivered fifty new CO2
reduction technologies to market. Improved engine design, the use of lightweight new
materials, development of alternatively-fuelled vehicles and in-vehicle driver aids, these
examples have helped slash average new car CO2 by almost 20% in just thirteen years.’ (ACEA 2009 p10)

Options to achieve 80g/km CO2 by 2020
Centre for Automotive Industry Research & ESRC BRASS Centre, Cardiff University, Cardiff, Wales, UK Page 15
Yet, progress thus far is insufficient; the improvements quoted above have done little to mitigate the climate impacts from cars. The ‘Reference Scenario’ for the IEA forecast to 2030 (IEA 2009) is typical of the mainstream of scientific opinion with respect to future trends on energy consumption. In the view of the IEA, world primary energy demand will grow by an average of 1.6 per cent per annum, or 45 per cent between 2006 and 2030. Fossil fuels of all types will continue to retain an approximate 80 per cent share of primary energy demand, though within this the share of coal is expected to increase significantly. Under this scenario the expectation is that by the end of the 21st century there will be an approximate doubling of CO2 concentration levels in the atmosphere to about 1000 parts per million, which in turn may be expected to result in global temperature increases of around 6°C. These are indeed alarming figures. Obviously not all of the increase in CO2 emissions can be laid at the door of the automotive industry, but equally the implication is that huge changes are needed in all aspects of land transport and the impact it is feared it has on climate change (Ryan and Turton 2007; Sperling and Cannon 2007; Staley 2008).
1.2 WHY HAS PROGRESS BEEN SO SLOW?
According to the UK industry body, SMMT, cars produce typically 85 per cent of life cycle CO2 emissions during their use phase, with about 10 per cent in manufacturing and 5 per cent in disposal (SMMT 2007), so clearly the use of cars is critical to the outcome. On the whole, though the industry has chosen to focus on other priorities. It is able to find the resources to develop relatively marginal ‘improvements’ in other aspects of the vehicles they produce, such as headlights that integrate with GPS and mapping systems to allow the light beam to be redirected as the car is driven around a corner or turn in the road. It is very much a matter of choice as to where resources are invested, and to date the industry in aggregate simply has chosen not to prioritise fuel economy. Legislators are now doing this for them (see Section 1.3 below). Engineers are relishing the challenges this brings as EU firms develop new technologies and new intellectual property (IPR).
The industry has failed to embrace the challenge ahead. The automotive industry has repeatedly emphasised that its product is characterised by long lead times, and that it is therefore impossible to respond quickly to new regulatory demands or indeed market demands. While it is evidently the case that the industry struggles to design and manufacture a completely new vehicle in anything less than 48 months, it is also the case that carbon reduction has been on the agenda at least since the Rio conference in 1992. The lack of strategic foresight by the vehicle manufacturers’ senior management in terms of introducing low-carbon technologies on a more rapid basis, and indeed in terms of the continued market deployment of high-carbon vehicles, cannot be reasonably accepted
‘Transport is the worst performing sector under Kyoto and seriously jeopardises the
achievement of the targets. Transport CO2 emissions in the EU grew by 36% between 1990
and 2007. Other sectors reduced their emissions by 9% on average over the same period. The
share of transport in CO2 emissions was 21% in 1990, but by 2007 this had grown to 28%. The
European Environment Agency estimates that cars are responsible for 14% of the EU’s total
CO2 emissions.’ (Dings 2009a p7)

Options to achieve 80g/km CO2 by 2020
Centre for Automotive Industry Research & ESRC BRASS Centre, Cardiff University, Cardiff, Wales, UK Page 16
as an excuse for the inability to act now. Such a lack of management strategic insight has also led to the severe difficulties some car companies find themselves in at present. It must be remembered that the European Commission first sought to bring in binding targets on CO2 emissions in 1995 based on earlier suggestions by the German government, with the intention that a figure of 120 g/km should be reached by 2005 (Dings 2009a). Although the automotive industry succeeded in getting these proposals abandoned, it was followed by the voluntary agreements and this continuing pressure from legislators was surely pertinent as a feature on the strategic landscape and well within the scope of two or three model generations. It is also the case that these deferments of policy have in effect given the industry the additional time it has claimed to need. Thus, the long lead times that are often used as a reason for inaction by the industry cannot be said to apply any further in this case – the industry has been given that lead time.
The industry has manoeuvred itself into the crisis. The recourse to the effects of the global crisis as a reason not to invest further in low-carbon technologies is also not supportable. The actual sales reduction in the recession has not been as profound as the industry has presented. In addition, it should be recognised that the automotive industry was itself instrumental in the ‘bubble economy’ of low-interest rates and freely available credit that encouraged consumption beyond supportable means, and this resulted in an over-inflated new car market – in many cases of cars that were high-carbon emission vehicles. It could thus be argued that the environmental and economic are linked in that in both cases society has been over-borrowing; the result being an oversupply of environmentally compromised vehicles. This pattern of events thus was one reason why the vehicle manufacturers failed to meet the voluntary agreement of target CO2 emissions of 140 g/km by 2008 (by 2006 average emissions were of the order of 160 g/km). It has also, of course, generated negative legacy effects in terms of fleet CO2 emissions that will be present in the vehicle parc for many years to come. As the industry is in receipt of all manner of government support (i.e. public money) there is an even stronger case for alignment with social and environmental objectives. In addition, the effects of the recession indicate a consumer shift towards lower carbon vehicles, either as a primary choice, or as an indirect result of the various scrappage schemes which have enticed consumers who would normally favour used cars into buying lower priced new cars, which tend to be smaller and more fuel efficient (Nagley 2009). A final point therefore is that a shift towards lower carbon vehicles, which are also more energy efficient vehicles, is both environmentally and economically sensible and is an approach already being adopted by many car buyers.
Options to achieve 80g/km CO2 by 2020
Centre for Automotive Industry Research & ESRC BRASS Centre, Cardiff University, Cardiff, Wales, UK Page 17
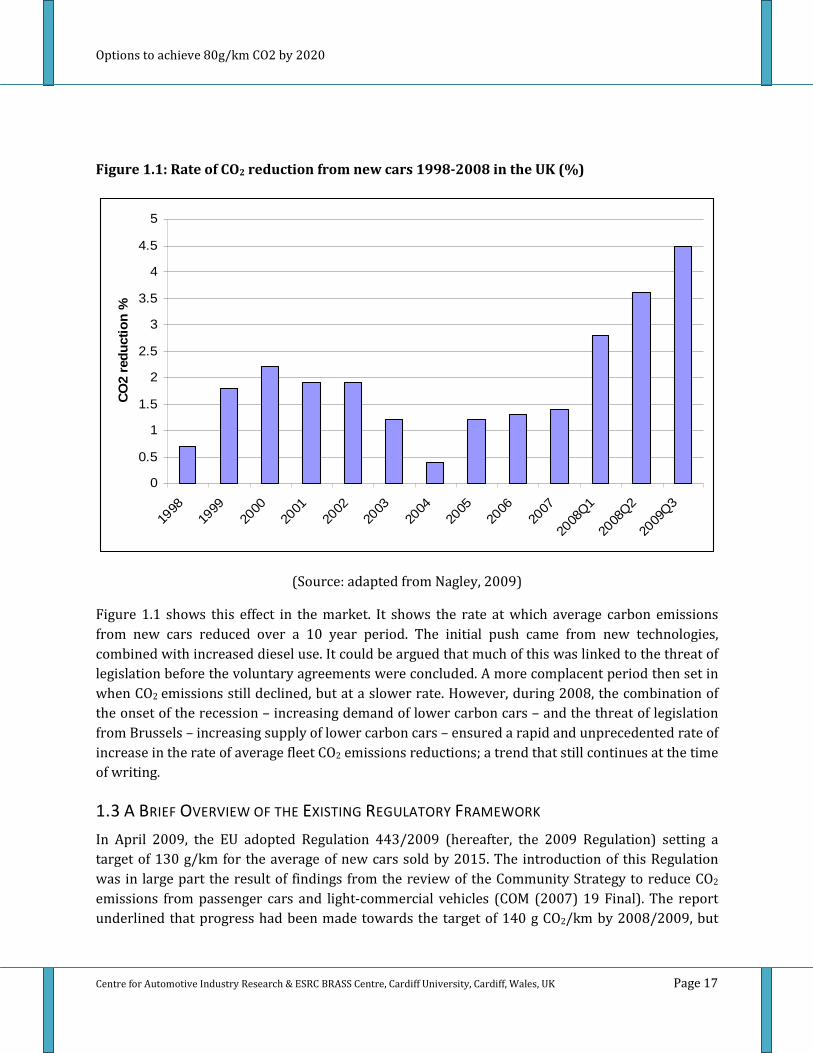
Figure 1.1: Rate of CO2 reduction from new cars 1998-2008 in the UK (%)
0
0.5
1
1.5
2
2.5
3
3.5
4
4.5
5
1998
1999
2000
2001
2002
2003
2004
2005
2006
2007
2008
Q1
2008
Q2
2009
Q3
CO
2 re
du
ctio
n %
(Source: adapted from Nagley, 2009)
Figure 1.1 shows this effect in the market. It shows the rate at which average carbon emissions from new cars reduced over a 10 year period. The initial push came from new technologies, combined with increased diesel use. It could be argued that much of this was linked to the threat of legislation before the voluntary agreements were concluded. A more complacent period then set in when CO2 emissions still declined, but at a slower rate. However, during 2008, the combination of the onset of the recession – increasing demand of lower carbon cars – and the threat of legislation from Brussels – increasing supply of lower carbon cars – ensured a rapid and unprecedented rate of increase in the rate of average fleet CO2 emissions reductions; a trend that still continues at the time of writing.
1.3 A BRIEF OVERVIEW OF THE EXISTING REGULATORY FRAMEWORK
In April 2009, the EU adopted Regulation 443/2009 (hereafter, the 2009 Regulation) setting a target of 130 g/km for the average of new cars sold by 2015. The introduction of this Regulation was in large part the result of findings from the review of the Community Strategy to reduce CO2 emissions from passenger cars and light-commercial vehicles (COM (2007) 19 Final). The report underlined that progress had been made towards the target of 140 g CO2/km by 2008/2009, but

Options to achieve 80g/km CO2 by 2020
Centre for Automotive Industry Research & ESRC BRASS Centre, Cardiff University, Cardiff, Wales, UK Page 18
that the Community objective of 120 g CO2/km would not be met by 2012 in the absence of additional measures.
The 2009 Regulation establishes mandatory CO2 emissions reduction targets for passenger cars with a target of 130 g/km for the entire average new car fleet to be reached by 2015. This target is set up to be reached gradually by manufacturers over the next five years with the longer term target of 95 g/km as average emissions for a new car fleet from 2020 (Article 13(5)). These lead in times for the regulatory instrument are based upon the understanding that industry requires predictability and time in order to adapt to changes. However, it may also be argued that such a lead in to the targets set under the 2009 Regulation was established, albeit on a voluntary basis, through the Commission’s Communication to reduce CO2 emissions from passenger cars and improve fuel economy (COM (1995) 689).
The linear curve model adopted in the Regulation enables heavier vehicles to have greater emissions levels and these are intended to be off-set by lighter more fuel efficient models. Manufacturers are given a target based upon the sales-weighted average mass of their vehicles. The Regulation provides for flexibility in the way in which manufacturers choose to meet their targets – they can either meet them as an individual manufacturer on a fleet-wide basis or alternatively decide under Article 7 to form a pool which comprises of a number of manufacturers for the purpose of meeting their CO2 emissions obligation. This has the benefit of spreading the burden to meet the targets, although it also has the potential to foster manufacturing complacency and the delay in technological advancement depending upon the composition of the pool.
Where the manufacturer or pool fails to meet their specific emissions target an “excess emissions premium” will be applied on the basis of the number of new passenger cars manufactured (Article 9). However the levels of such fines appear to be a rather weak fiscal signal to manufacturers. Effective incentives to reduce vehicular CO2 emissions depend upon strong economic incentives which have the effect of influencing market preferences which, in turn, stimulates technological innovation (Kågeson 2005 at 14). Under the excess emissions premium (Article 9) in Regulation 443/2009, for every g/km over the target a vehicle manufacturer has to pay €95 per vehicle sold, in principle. In reality there are again several dilutions of this concept. In addition, €95 is a modest fee relative to the price of a new car. Recall that in the UK for example the combined scrappage incentive was £2,000 or €2,268 and that a mid-range Ford Focus has a retail list price of around £15,000 or €16,265, so 5 g/km over the target for example would bring a penalty of €475 or 2.9 per cent. Alternatively, it is worth considering that for the vehicle manufacturers the penalty regime means that it makes economic sense to spend up to €95 per g/km per vehicle sold on carbon reduction by whatever means. The European Commission have also carried out studies to explore the technical feasibility of other targets than 95 grammes by 2020. Indeed, the AEA, in its (2008) report found that a target of 80g/km could be met.

Options to achieve 80g/km CO2 by 2020
Centre for Automotive Industry Research & ESRC BRASS Centre, Cardiff University, Cardiff, Wales, UK Page 19
It is widely acknowledged that the automotive industry is one of the six most regulated industries in Europe. The regulatory framework for the automotive industry is based upon the type-approval of vehicles as laid down in the Framework Directive 2007/46/EC. The aim of this Directive is to ensure that through prior control and approval all new vehicles, components and separate technical units out on the market provide a high level of safety and environmental protection (Article 1 and Recital 14). To this end, the Framework Directive provides that specific technical requirements concerning the construction and functioning of vehicles be laid down in supplementary Regulations. These supplementary Regulations include a number of specific European Community instruments (Directives and Regulations) addressing particular aspects of type approval and technical specifications as well as 126 Regulations adopted by the United Nations Economic Commission for Europe (UNECE) to which the EU is a contracting party1. As part of the European Commission’s commitment to reduce legislative burdens through consolidation and better regulation (COM (2005) 535 Final), UNECE Regulations no longer require parallel European measures to be introduced and instead are considered directly applicable. It was under this programme of simplification that Regulation (EC) 661/2009 repealed 50 pieces of EC law in line with Article 34(1) of the Framework Directive.
The volume of legislation to which the automotive industry is subject makes an exhaustive legislative and policy analysis well beyond the scope and remit of both practicality and the project. However, in presenting the four scenarios, in which we argue it is possible and legitimate to reconsider a lower fleet CO2 emission target of 80 g/km for 2020, this study is supported by an identification of the policy measures necessary to achieve this ambition. In this context we would also like to refer, briefly, to an alternative regulatory approach we first proposed in the early 1990s and a version of which has since been implemented as the Japanese ‘Front Runner’ model. Our Environmentally Optimised Vehicle (EOV) regulatory model was centred on a set of criteria for optimising the environmental performance of a vehicle. Taking a sustainability approach we included emissions, energy efficiency, but also such aspects as durability (Nieuwenhuis 1995; Nieuwenhuis and Wells 1997, Chapter 7).
1.4 THE SCENARIOS
Scenario 1: Conventional vehicles. In this scenario the focus is on the existing internal combustion engine car, but with the target of least possible CO2 emissions through improvements in conventional powertrain including hybrids alongside improvements in non-powertrain items including weight reduction through materials substitution, improved aerodynamics, greater efficiency in secondary systems, and related measures such as driver information systems on fuel consumption. In this scenario the approach will be to aggregate potential efficiency improvements in all aspects of the vehicle to arrive at a potential ‘best practice’ CO2 emissions reduction allocated to vehicle technologies. The prevailing segment mix is assumed to be unchanged, and no alternative
1 Included in the body of UNECE Regulations model standards and limits on: Reg. No. 13H Braking of
passenger cars, Reg. No. 24 Emission of visible pollutants of C.I. engines, Reg. No.39 Speedometer equipment and its installation, Reg. No. 83 Rev 3 Emission of pollutants according to engine fuel requirements and Reg.
No.84 Fuel consumption measurement.

Options to achieve 80g/km CO2 by 2020
Centre for Automotive Industry Research & ESRC BRASS Centre, Cardiff University, Cardiff, Wales, UK Page 20
powertrain systems are assumed to be introduced apart from a very small share of BEVs and 2 PHEVs. Alongside this, the scenario is informed by a regulatory stance that replaces the 130 g/km expectation with an 80g/km expectation fleet adjusted average.
Scenario 2 explores a much greater proportion of electric vehicles. We will explore to what extent this is feasible and what the implications would be if this was promoted.
Scenario 3 then looks at vehicle performance reduction as a means to achieve lower CO2 emissions. The initial challenge is to come up with a satisfactory definition of what constitutes vehicle performance. We propose an approach and also highlight a number of initiatives in this area and what CO2 emission improvements these promise for the future.
Scenario 4 deals with the issue of market shift – to what extent can shifting within and between segments lead to reduced CO2 emissions and also, is there room below existing segments to allow existing smaller cars to move into in order to help reach an average level of 80 g/km of CO2.
In each scenario there is a requirement to analyse the consequences of changes to technology, vehicle performance attributes and market mix. The focus is of course on CO2 emissions, but other co-benefits or outcomes will also be considered.
The scenarios, having a common methodology and output, are then compared on the basis of the following criteria:
• average cost per vehicle to the manufacturer;
• lock-in effects impacting further efficiency improvements until 2050;
• co-benefits e.g. in the areas of safety, air pollution, noise.
• along with an analysis of the potential implications for vehicle manufacturers, consumers, regulators and of course the environmental impact.
Options to achieve 80g/km CO2 by 2020
Centre for Automotive Industry Research & ESRC BRASS Centre, Cardiff University, Cardiff, Wales, UK Page 21
CHAPTER 2 – SCENARIO I (UN) CONVENTIONAL TECHNOLOGIES
2.1 INTERNAL COMBUSTION
It is clear that for the next ten years, conventional petrol and diesel fuels and conventional petrol and diesel powertrain will continue to dominate the new car market. This is due to current product cycles, model replacements planned for the next few years and the fact that the most popular alterative powertrain – the hybrid – still uses an Internal Combustion (IC) engine. At the same time, oil-derived fuels are likely to increase in cost, albeit as part of a trajectory of considerable price volatility which will see downs as well as ups. Supply of oil is now estimated by some observers to peak around 2010-15, while demand – from newly motorising nations such as China, India, Indonesia and Russia – will continue to increase (Heinberg 2007; Hirsch et al. 2007; Kendall 2008). However, the diesel/petrol mix can be as important to oil prices as the supply of crude oil itself. The move towards cleaner fuel by the shipping sector, for example, will significantly increase worldwide demand for diesel. This will increase the demand for alternative powertrain technologies. Alternatively, the car industry will – in a bid to preserve the tried and trusted IC engine – go for enhanced conventional IC powertrain technologies such as petrol- or diesel-hybrid solutions instead. These hybrids still use petrol or diesel fuel, after all, unlike electric powertrain, such as battery-electrics, or fuel cells, which have the potential to make IC obsolete and as a result render worthless much of the car makers’ investments in conventional IC technology. IC fuels can also be derived from natural gas (GTL), coal (CTL) or biomass even when oil itself becomes too costly (Kendall 2008; Sperling and Gordon 2009). This perpetuation of internal combustion could well be used to postpone the inevitable moment when internal combustion will no longer be viable.
AEA and others have over the years provided cost estimates for various carbon reduction technologies. Such data are useful if their estimated cost of each technology sub-option (say the dual clutch gearbox) is compared with the typical cost of options and extras on contemporary cars. This point has not been addressed by any of the analyses, but new car buyers can easily spend the equivalent amount needed for a dual clutch gearbox on a set of alloy wheels for purely aesthetic reasons (approximately €1000). This puts the various cost estimates in perspective, we feel. The
‘…the struggle to reduce and, where possible, eliminate emissions of the greenhouse gases
may ultimately have greater repercussions on the motor industry than any efforts made to
cut down the amount of toxic gases in the atmosphere.’ (Nieuwenhuis, et al. 1992, p37)

Options to achieve 80g/km CO2 by 2020
Centre for Automotive Industry Research & ESRC BRASS Centre, Cardiff University, Cardiff, Wales, UK Page 22
key is in marketing low carbon technologies as desirable enough to spend money on, something a number of car makers appear able to achieve, such as BMW with its Efficient Dynamics, VW with its Bluemotion, etc.
Lord Nicholas Stern argued only a few years ago in his very influential report that at the macro level any delay in responding to the carbon reduction agenda would only lead to an increase in costs, so the secret to keeping costs down is for society as a whole to act sooner, rather than later (Stern 2006). In fact, his most recent thinking is for an early move to electric powertrain, as we will discuss in Scenario 2 (CCC 2009). However, there is only so much economics can contribute to the environmental debate and this is something that needs to be understood. Despite valiant efforts, economics has struggled to accommodate sustainability concerns (cf. De Steiguer, 2006 for a useful summary).
Weight and Safety
It has been argued by the industry that despite their best efforts to reduce CO2 emissions, both
customers and legislators have demanded more comfort and more safety and that this has
inevitably led to more weight and size and hence higher CO2 emissions. This argument has some
merit, but not as much as has been suggested. For a start, many such technologies have not been
demanded by the market, but have been offered to the market in an effort to boost profitability in
an industry that struggles to make money on basic cars (Maxton and Wormald 2004;
Nieuwenhuis and Wells 1997 2003). Airbags, though a great safety improvement, are still not
compulsory in the EU, for example, although they help EuroNCap scores – a measure that helps
sell cars and is therefore market driven and thus costs can be recovered.
Also, although many such features do add equipment and thus weight in the first instance, over
time the weight of such systems is pared down by the supply industry. Bosch, for example has
been able to reduce the weight of its ABS system over time from around five kilograms when first
introduced in the 1980s to only 1.4 kg on the more recent generation 8.1 system (Bosch executive,
pers. comm.). ZF vice president of corporate research Naunheimer has stated that the technology
exists to take 30-40 percent of the weight out of chassis without sacrificing strength or safety
(Barkholz 2009).
Options to achieve 80g/km CO2 by 2020
Centre for Automotive Industry Research & ESRC BRASS Centre, Cardiff University, Cardiff, Wales, UK Page 23
The fundamental problem, as highlighted by economist Herman Daly, (1996) is that there are two irreconcilable mindsets out there; on the one hand there are those who regard the environment as a subset of the economy and on the other, those who regard the economy as a subset of the environment. Clearly the latter is the correct world view, but most of our industrial and political leaders appear to subscribe to the former. In time, a new fusion discipline may well emerge, in the meantime we have to deal with these two irreconcilable mindsets whereby key decision makers will seek a type of endorsement that is inappropriate for the problems to be tackled. Also, moving beyond CO2, for example in the context of peak oil, we need to be much more radical whatever the cost because the alternative is actually more costly. In this context we could argue that moving to an average of 80 g/km is a minimal response. Discussions about cost to the industry may be irrelevant; much of the industry may well disappear if they do not implement radical change. In reality a serious response to this agenda is a way of future-proofing a company; perhaps if auto industry executives were younger with more of a stake in the future, this agenda would be embraced more readily.
The Problem of Large & Heavy Vehicles
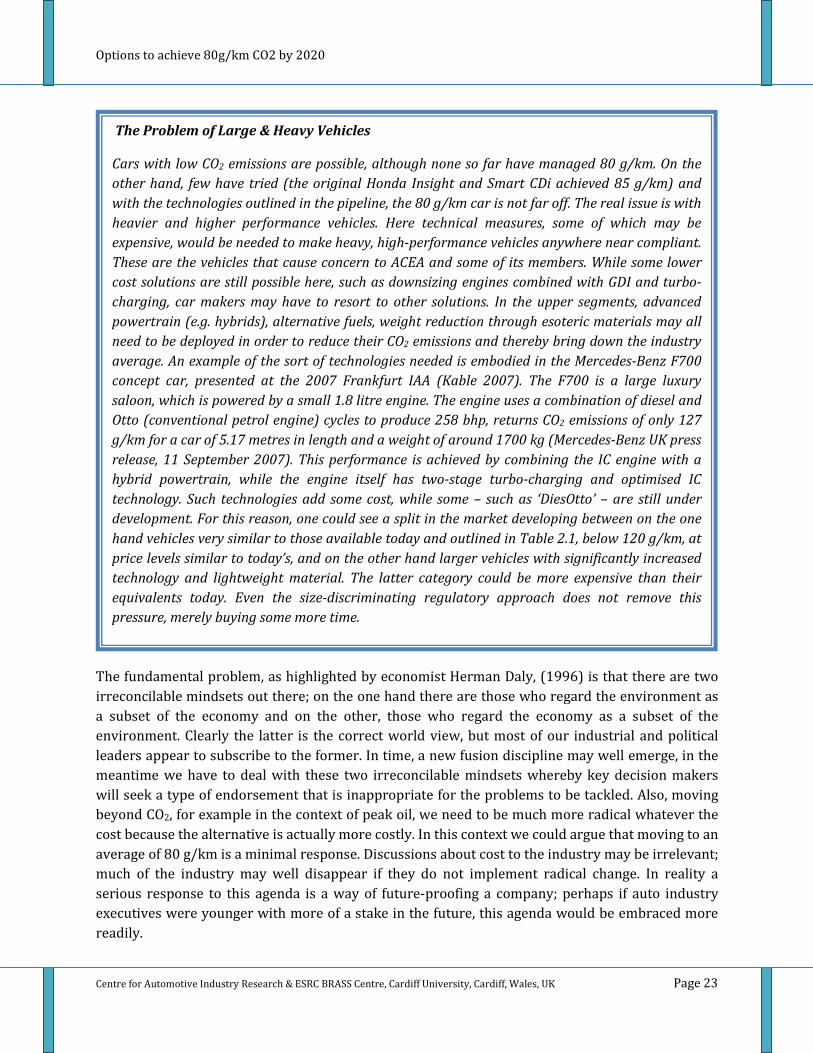
Cars with low CO2 emissions are possible, although none so far have managed 80 g/km. On the
other hand, few have tried (the original Honda Insight and Smart CDi achieved 85 g/km) and
with the technologies outlined in the pipeline, the 80 g/km car is not far off. The real issue is with
heavier and higher performance vehicles. Here technical measures, some of which may be
expensive, would be needed to make heavy, high-performance vehicles anywhere near compliant.
These are the vehicles that cause concern to ACEA and some of its members. While some lower
cost solutions are still possible here, such as downsizing engines combined with GDI and turbo-
charging, car makers may have to resort to other solutions. In the upper segments, advanced
powertrain (e.g. hybrids), alternative fuels, weight reduction through esoteric materials may all
need to be deployed in order to reduce their CO2 emissions and thereby bring down the industry
average. An example of the sort of technologies needed is embodied in the Mercedes-Benz F700
concept car, presented at the 2007 Frankfurt IAA (Kable 2007). The F700 is a large luxury
saloon, which is powered by a small 1.8 litre engine. The engine uses a combination of diesel and
Otto (conventional petrol engine) cycles to produce 258 bhp, returns CO2 emissions of only 127
g/km for a car of 5.17 metres in length and a weight of around 1700 kg (Mercedes-Benz UK press
release, 11 September 2007). This performance is achieved by combining the IC engine with a
hybrid powertrain, while the engine itself has two-stage turbo-charging and optimised IC
technology. Such technologies add some cost, while some – such as ‘DiesOtto’ – are still under
development. For this reason, one could see a split in the market developing between on the one
hand vehicles very similar to those available today and outlined in Table 2.1, below 120 g/km, at
price levels similar to today’s, and on the other hand larger vehicles with significantly increased
technology and lightweight material. The latter category could be more expensive than their
equivalents today. Even the size-discriminating regulatory approach does not remove this
pressure, merely buying some more time.

Options to achieve 80g/km CO2 by 2020
Centre for Automotive Industry Research & ESRC BRASS Centre, Cardiff University, Cardiff, Wales, UK Page 24
The largest types of vehicles that currently meet the 120 g/km limit are: BMW 320d ES/SE Efficient Dynamics; Peugeot 308 1.6 HDi and Renault Megane 1.5 dCi. However, by the due dates, these are to be the average cars, so for each Jaguar, Mercedes S Class or BMW 7-Series, there needs to be a vehicle registered that falls well below this limit, unless those larger vehicles come down to those limits. Mercedes Benz has shown what is technically possible with its F700 concept car which brings S-Class specifications in terms of comfort and performance down to the 130 g/km level. Whether such vehicles will be available by 2020 is not clear, although it is easier to absorb the additional cost on such vehicles than on more mainstream vehicles (Nieuwenhuis 2007).
Downsizing luxury cars?
We could see a downsizing of specialist cars, luxury cars, SUVs and MPVs. Conventional knowledge
dictates that the market is not prepared to pay premium prices for small cars, although the BMW
MINI and Fiat 500 have shown this not necessarily to be the case. Similarly, Audi has been able to
sell its compact A3 (though admittedly the more innovative A2 was less successful in its day –
perhaps worth trying again?), Mercedes has been able to sell its A-class and more recently B-class
compact MPVs, BMW does well with its 1-Series, while Volvo is doing well with its compact C30,
which in its 1.6 D DRIVE variant only emits 99 g/km. One could in future imagine compact Jaguar
cars and lightweight Land Rovers (e.g. based on their Land-e concept) as well. The skill is in
carrying traditional brand values into more compact cars is in the marketing, not just in the
engineering of such cars. There would also be clear advantages to such developments. Reduced
running costs due to greater fuel efficiency are an obvious benefit, but there are others. Large
luxury cars tend to lose value quickly compared with small hatchbacks, for example. The reason is
that used car buyers tend to be less affluent thus less able to afford the high running costs,
particularly the fuel costs, of these heavy cars. If luxury cars were smaller and lighter, their appeal
to the used market would rise, thus boosting residual values. This would impact on the overall
lifecycle costs of luxury cars, making them generally more competitive in economic lifecycle terms.
This would benefit customers, but also manufacturers as higher residual values would boost
brand image. Under the Sustainable Consumption and Production (SCP) initiative, endorsed by
the UNEP and many national governments, we need to change our consumption patterns from a
primary focus on quantity to a primary focus on quality. These developments towards smaller
premium cars fit well with this trend. This is an area deserving of further analysis.

Options to achieve 80g/km CO2 by 2020
Centre for Automotive Industry Research & ESRC BRASS Centre, Cardiff University, Cardiff, Wales, UK Page 25
The SUV Problem
The four wheel drive concept has become firmly established as a system compulsory for off-road
vehicles built according to a light truck format as established by the military Jeep. This
traditional light truck format is also the main handicap for the SUV. The concept of the SUV has
atrophied in the minds of car manufacturers and consumers alike in this heavy cumbersome
format which may make the resulting vehicles capable off-road but makes it challenging to
develop SUVs that are competent both on and off road. The light truck format has become so
deeply ingrained that it is not even questioned whether it is best suited for the role of an off-road
vehicle. The modern SUV brings to mind a quote by American architect, environmentalist and
author William McDonough. He, the man responsible, for among others, the refurbished Ford
River Rouge plant has caricatured the primary design principle of what he terms ‘the first
industrial revolution’ as follows: “If brute force is not working, you are not using enough of it”
(McDonough and Braungart 2002: 30).
So does an off-road vehicle really have to be heavier than an on-road vehicle? SUVs have
traditionally been made heavy to withstand the rigours of off-road use. Structures have been
stiffened to prevent them from breaking under the strain. However, this can be a vicious circle, as
stiff and heavy structures also put more strain on the system as a whole, while stiff constructions
are more likely to break than flexible ones. The Chinese Taoist philosopher Lao Tzu pointed out
that after a severe storm, the strong, stiff, heavy trees will have fallen over, while the flexible, soft,
light grass bends and stands upright again. Could this principle apply equally to off road vehicles?
In the 1980s a British company tried to test this. The Africar was developed as ‘a car for Africa’
and based on the owners’ long experience of African driving conditions. The vehicle was not
developed beyond the prototype stage, but featured a lightweight, resin-impregnated plywood
construction with air-cooled Citroën engines (Howarth 1987). In various tests and a few
competitive events, it proved competitive with existing off-road vehicles and more capable under
certain conditions – such as heavy mud or very loose sand – where the lack of weight meant it
could skim over the surface, rather than get bogged down like a conventional SUV. More recently,
Jean-Louis Schlesser has shown with his innovative Schlesser buggies that competitive off-road
vehicles – he has used them to win the Dakar desert race – need neither be heavy (his current V8-
powered vehicles weigh in at 1200 – 1400 kg, less that the Land Rover Freelander compact SUV)
nor even need four wheel drive, as he has consistently used rear wheel drive. Even Land Rover has
begun to explore more sustainable ideas with its LAND_e concept. Much of the adverse
environmental impact of modern SUVs is weight-related. There is no need for off-road vehicles to
be heavy, nor to follow truck-like design concepts. The industry has started to adopt more car-like
constructions, but still favours overweight, truck-mimicking solutions in an attempt to add an off-
road image to its products. It is possible to design vehicles that have both off-road capability, but
which are not overweight and which therefore tread lightly on the earth in more ways than one.

Options to achieve 80g/km CO2 by 2020
Centre for Automotive Industry Research & ESRC BRASS Centre, Cardiff University, Cardiff, Wales, UK Page 26
2.2 Emerging IC carbon reduction technologies and their state of play
The EU new car fleet today emits significantly lower levels of CO2 than ten years ago. Much of this reduction in overall fleet CO2 output has been achieved by a greater reliance on diesel engines. The overall greater thermal efficiency (ability to turn energy into power) of the diesel engine more than offsets the slightly higher carbon content of diesel fuel as compared with petrol2. Despite the fact that there are a number of health risks associated with diesel emissions, which have been well documented, there is little doubt that any further reduction in CO2 emissions will be achieved at least initially through a further increase in diesel penetration. For this reason, a further rise in sales of diesel cars is to be expected. It is also for this reason that one of the ACEA stipulations at the time of the voluntary agreement on CO2 emission reduction was that no further measures would be introduced to reduce the use of diesel. The rise in diesel cars is due not only to government incentives at Member State level, such as fiscal measures (e.g. excise duty on fuel and differential road tax), but also to the increasing sophistication of diesel cars, which has made them increasingly competitive with petrol powered equivalents.
Table 2.1: Low carbon vehicles available in September 2009 (< 120 g/km CO2 on NEDC)
Make Model Variants CO2 g/km
Powertrain
Alfa Romeo MiTo 1.3JTDm 119 Diesel Audi A3 1.9 TDIe 119 Diesel BMW 1-Series 116d 118 Diesel 118d ES 119 Diesel 118d SE 119 Diesel 118d M Sport 119 Diesel 3-Series 320d EfficientDynamics 109 Diesel Citroën C1 1.0i 106 Petrol 1.4 Hdi 109 Diesel C2 1.4 Hdi 113 Diesel C3 1.4 Hdi 115 Diesel C4 3dr 1.6 Hdi 117 Diesel C4 5dr 1.6 HDi 92 VTR/VTR+ 115 Diesel 1.6 HDi 92 Airdream+ 117 Diesel Nemo Multispace 1.4 HDi 119 Diesel Daihatsu Sirion 1.0S/SE 118 Petrol
2 According to Moles, et al. (2006), a litre of petrol produces 2310g CO2 when burnt, while a litre of diesel
produces 2680g of CO2. Other observers have used different figures, although within the same range.

Options to achieve 80g/km CO2 by 2020
Centre for Automotive Industry Research & ESRC BRASS Centre, Cardiff University, Cardiff, Wales, UK Page 27
Fiat 500 1.2 119 Petrol 1.2 Stop&Start 113 Petrol 1.3 Multijet 110 Diesel Panda 1.1 Active ECO 119 Petrol 1.2 Dynamic ECO 119 Petrol Grande Punto 1.3 Multijet 119 Diesel Bravo 1.6 Multijet 105 Eco 119 Diesel Ford Ka 1.2 119 Petrol 1.3 TDCi 112 Diesel Fiesta 1.4 TDCi 110 Diesel 1.6 TDCi Econetic 98 Diesel 1.6 TDCi 110 Diesel Fusion 1.6 TDCi 119 Diesel Focus 1.6 TDCi 90 ECOnetic 114 Diesel 1.6 TDCi 110 DPF 119 Diesel 1.6 TDCi 110 DPF ECO 115 Diesel Honda Insight 1.3 S/SE 101 Hybrid 1.3 ES/ES-T 105 Hybrid Hyundai i-10 1.1/1.2 119 Petrol i-20 1.4D 116 Diesel i-30 1.6 CRDi 119 Diesel Kia Picanto 1.01/1.12 114 Petrol Cee’d 1.6 CRDi 89 119 Diesel Mazda 2 1.4d 107 Diesel 1.6d 112 Diesel 3 1.6d 119 Diesel Mercedes-Benz A-Class A160 CDI 116 Diesel MINI Cooper 1.6D 104 Diesel Cooper Clubman 1.6D 109 Diesel Mitsubishi I 660 114 Petrol Colt 1.3 CZ2 Cleartec 119 Petrol Nissan Pixo 1.0 103 Petrol Note 1.5 dCi 119 Diesel Peugeot 107 1.0 106 Petrol 207 1.4 HDi/1.6 HDi 90 117 Diesel 207 SW 1.6 HDi 90 S AC/Sport 119 Diesel Renault Clio 1.5 dCi 86 117 Diesel Mégane 1.5dCi 86 118 Diesel SEAT Ibiza 1.4 TDI Ecomotive 98 Diesel 1.6 TDI CR Sport 109 Diesel Leon 1.9 TDI 105 Ecomotive 119 Diesel Škoda Fabia 1.4 TDI PD 80 Greenline 109 Diesel Smart ForTwo 1.0 mhd Pure/Pulse 103 Petrol

Options to achieve 80g/km CO2 by 2020
Centre for Automotive Industry Research & ESRC BRASS Centre, Cardiff University, Cardiff, Wales, UK Page 28
1.0 70 ltd Two/83 Passion
116 Petrol
0.8 cdi 88 Diesel ForTwo Open 1.0 71mhd 105 Petrol 1.0 71 ltd/84 Passion 116 Petrol 0.8 cdi Passion 88 Diesel Suzuki Alto 1.0 103 Petrol Swift 1.3 DdiS 119 Diesel Tesla Roadster R’str/Signature Edition 0 Battery
Electric Toyota IQ 1.0 99 Petrol Aygo 1.0 106 Petrol Yaris 1.0 118 Petrol Prius 1.8 VVT-i T3 89 Hybrid 1.8 VVT-i T4/T Spirit 92 Hybrid Vauxhall/Opel Corsa 1.3 CDTi 75 eco 119 Diesel Astra 1.7 CDTi 110 119 Diesel Volkswagen Polo 1.4 TDI 70/80 SE 119 Diesel 1.4 TDI 80 Bluemotion 99 Diesel Golf 1.6 TDI 90 118 Diesel 1.6 TDI 105 119 Diesel 1.6 TDI 105 Bluemotion 99 Diesel Volvo C30 1.6 D DRIVe 99 Diesel S40 1.6 D DRIVe 118 Diesel
(Source: adapted from Autocar 9/9/2009:88-101) It is clear that the lowest carbon dioxide emitters in Table 2.1 belong to three categories:
1) Very small petrol-engine cars 2) Small and medium-sized diesel engine cars 3) Medium-sized petrol-electric hybrid cars
2.3 STRATEGIC AND TACTICAL APPROACHES TO REDUCE CO2 EMISSIONS BY THE VEHICLE
MANUFACTURERS
Approaches to reduce CO2 emissions from vehicles can be grouped into two broad categories: strategic and tactical. Under strategic changes the CO2 reductions are achieved by radical changes to the design / technology / material combination but with the consequence that significant changes are required in terms of the design system, manufacturing process and / or the assembly techniques required. Under tactical changes the emphasis is on incremental improvements or optimisation of existing design / technology / material combinations. This does not mean that the vehicles are denuded of content, but that low-CO2 optimisation is carried out throughout the vehicle. Strategic changes are likely to impact upon the entire vehicle or at least many component systems in the vehicle, and may well include other measures such as new suppliers being brought

Options to achieve 80g/km CO2 by 2020
Centre for Automotive Industry Research & ESRC BRASS Centre, Cardiff University, Cardiff, Wales, UK Page 29
in, and new training requirements for staff in franchised dealerships. Tactical changes are easier to manage, and of lower risk to the vehicle manufacturers. The vehicle manufacturers have a range of potential approaches therefore in terms of reducing carbon emissions from vehicles, approaches which can include shifting the segment mix of vehicles sold (i.e. downsizing) or reducing engine power. These latter two may impact upon the brand position for the vehicle manufacturer, but do not necessarily challenge any of the fundamentals of the business. Radical strategic changes on the other hand are likely to be of a fundamental nature. It is notable that in introducing the Prius, Toyota combined radicalism in terms of the drivetrain with a highly conservative (albeit distinctive) style for the vehicle and conservative body design architecture. Similarly, BMW is reportedly considering radical technology and new segment positioning for their Project-i but are also wary of bringing radical styling to the vehicle lest it alienate potential customers.
In either case, the scope for success is strongly informed by the extent to which a clean-sheet design is attempted. That is, endeavouring to take weight out of existing systems or adopting other strategies to reduce CO2 emissions is likely to have more potential with a new design than with an existing design. On the other hand, the rate of new model introductions has accelerated over the years (notwithstanding the difference between this and new platforms) and this has increased the scope for the introduction of new technologies or design solutions.
Thus there are three possible combinations of circumstance for changes in the vehicles to achieve lower CO2 emissions:
• Incremental optimisation: existing designs
• Incremental optimisation: new designs
• Radical optimisation: new designs
The decision as to whether a new technology constitutes a radical or incremental change is not absolutely straightforward, as much depends upon what the core competences of the vehicle manufacturers are considered to be. Hence, in manufacturing terms the vehicle manufacturers retain core competence in the construction of steel bodies (stamping, welding, painting) and in engine manufacture (casting, machining, assembly). Hence in these terms departures away from all-steel bodies and / or internal combustion engines can be said to be radical. Alternatively, if the vehicle manufacturers are seen as having core competences in terms of design integration and marketing, then the introduction of new technology alone does not constitute a radical strategic departure – this would entail, for example, innovative business models and new ways of creating added value.
2.4. INCREMENTAL (TACTICAL) OPTIMISATION: EXISTING DESIGNS
At present, this is the prevailing solution, and one that shows considerable potential in its own right. Tactical solutions can be applied to any system, sub-system or component in the vehicle to achieve better performance. The vehicle manufacturers have long applied tools such as value engineering to the analysis of cost reduction in their vehicles, and it is not fanciful to suggest that similar approaches could yield substantial improvements in fuel economy and reduced CO2
Options to achieve 80g/km CO2 by 2020
Centre for Automotive Industry Research & ESRC BRASS Centre, Cardiff University, Cardiff, Wales, UK Page 30
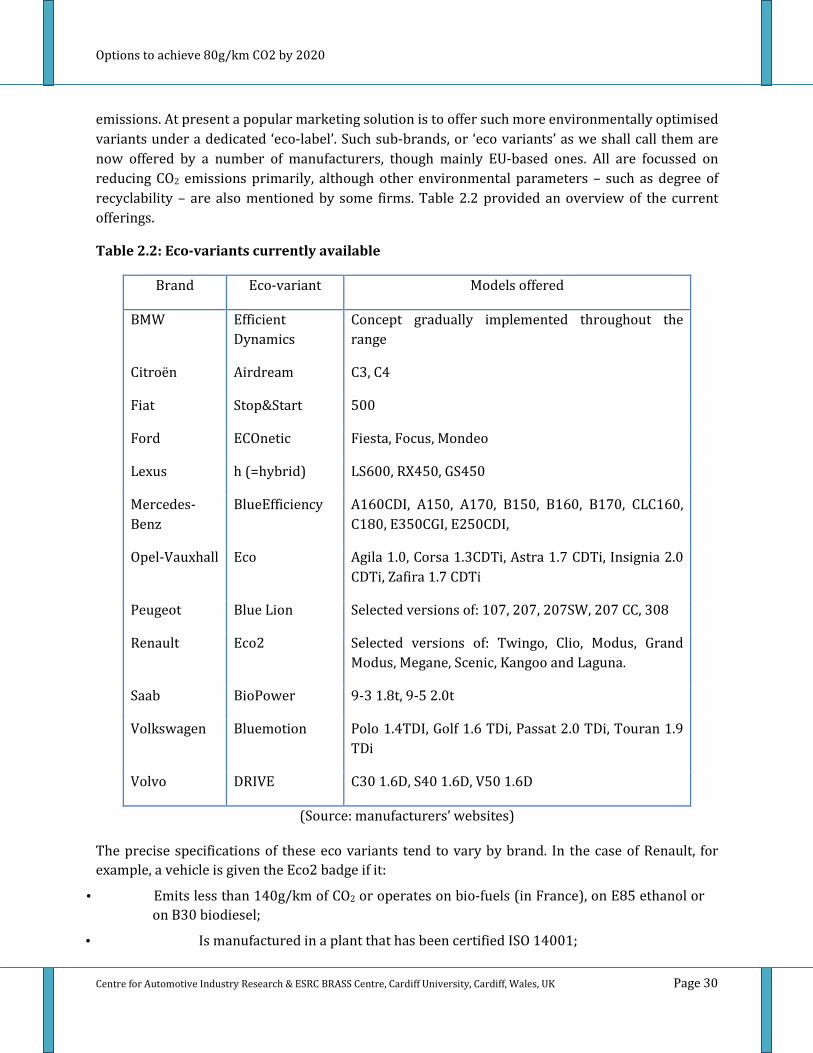
emissions. At present a popular marketing solution is to offer such more environmentally optimised variants under a dedicated ‘eco-label’. Such sub-brands, or ‘eco variants’ as we shall call them are now offered by a number of manufacturers, though mainly EU-based ones. All are focussed on reducing CO2 emissions primarily, although other environmental parameters – such as degree of recyclability – are also mentioned by some firms. Table 2.2 provided an overview of the current offerings.
Table 2.2: Eco-variants currently available
Brand Eco-variant Models offered
BMW Efficient Dynamics
Concept gradually implemented throughout the range
Citroën Airdream C3, C4
Fiat Stop&Start 500
Ford ECOnetic Fiesta, Focus, Mondeo
Lexus h (=hybrid) LS600, RX450, GS450
Mercedes-Benz
BlueEfficiency A160CDI, A150, A170, B150, B160, B170, CLC160, C180, E350CGI, E250CDI,
Opel-Vauxhall Eco Agila 1.0, Corsa 1.3CDTi, Astra 1.7 CDTi, Insignia 2.0 CDTi, Zafira 1.7 CDTi
Peugeot Blue Lion Selected versions of: 107, 207, 207SW, 207 CC, 308
Renault Eco2 Selected versions of: Twingo, Clio, Modus, Grand Modus, Megane, Scenic, Kangoo and Laguna.
Saab BioPower 9-3 1.8t, 9-5 2.0t
Volkswagen Bluemotion Polo 1.4TDI, Golf 1.6 TDi, Passat 2.0 TDi, Touran 1.9 TDi
Volvo DRIVE C30 1.6D, S40 1.6D, V50 1.6D
(Source: manufacturers’ websites)
The precise specifications of these eco variants tend to vary by brand. In the case of Renault, for example, a vehicle is given the Eco2 badge if it:
• Emits less than 140g/km of CO2 or operates on bio-fuels (in France), on E85 ethanol or on B30 biodiesel;
• Is manufactured in a plant that has been certified ISO 14001;

Options to achieve 80g/km CO2 by 2020
Centre for Automotive Industry Research & ESRC BRASS Centre, Cardiff University, Cardiff, Wales, UK Page 31
• Can be 95 per cent recoverable at the end of its lifecycle (recyclable for other use or as a source of energy) and it includes at least 5 per cent recycled plastics in its plastic mass.
For Peugeot Blue Lion and Citroën Airdream, the requirements are very similar, with small variations such as the fact that Airdream variants have to emit less than 120 g/km of CO2. In the case of other manufacturers the emphasis is firmly on CO2; Table 2.3 illustrates how the Ford ECOnetic Fiesta 3-door fits into the Fiesta product line-up on the basis of its exceptionally low CO2 emissions.
Table 2.3: The Ford ECOnetic Fiesta 3-door in the UK, 2009
Variant Fuel List price (£) CO2 emissions g/km
1.6 TDCi ECOnetic Diesel 12 445 98 1.25i 60 Studio Petrol 9 195 128 1.6 TDCi Titanium Diesel 13 695 110 1.4 TDCi Studio Diesel 9 981 110 1.6 Ti-VCT Zetec S Petrol 13 095 139
(Source: Derived from Autocar, 25th March 2009)
Note that at the time Table 2.3 was compiled, Ford did not have an ECOnetic variant for the Ka, the Fusion, the Focus four door, the Mondeo four door, the C-Max, the S-Max, or the Galaxy models. As Table 2.3 illustrates in the case of the Fiesta three-door model, to buy the low-CO2 emissions version would cost about £3000 or 30 per cent more than the entry-level model, or nearly as much as the high-performance, high-CO2 emissions variants. The ECOnetic variant offers 23 per cent lower CO2 emissions in g/km compared with the cheapest model, and 29 per cent lower than the highest CO2 emissions variant. The gains in CO2 emissions are much less dramatic compared with the other diesel engines in the range, and as shown in Table 2.3 the cheapest diesel is about £2500 (or 20 per cent) less than the ECOnetic while the CO2 emissions are only about 11 per cent higher. In September 2009 Ford announced the Focus ECOnetic with additional stop-start technology and able to achieve 114 g/km CO2 emissions.
Table 2.4: Carbon reduction methods for IC-engine cars
Drivetrain Cylinder de-activation Aluminium chassis components (Electric) supercharging and turbo-charging Magnesium engine components Aluminium cylinder block and head Low viscosity lubricants Taller gearing for top ratios Low rolling resistance tyres Mild hybrid (stop-start) Full hybrid (petrol)

Options to achieve 80g/km CO2 by 2020
Centre for Automotive Industry Research & ESRC BRASS Centre, Cardiff University, Cardiff, Wales, UK Page 32
Full hybrid (diesel) Plug-in hybrid (petrol) Plug-in hybrid (diesel Energy recovery (regenerative braking)
Vehicle body Thin wall window glass Aluminium/thermoplastic panels High strength steel panels Improved aerodynamics Under-body tray for improved under-body
aerodynamics Reduced ride height
Other components Reduced sound-deadening material Magnesium/carbon fibre instrument panel beams Re-designed wiring harness for lower weight Improved air conditioning Redesigned ancillary systems, including belt drives Other measures (driver
behaviour)
Driver aids including real time fuel consumption information
Change-up gear lights On-board navigation systems to reduce congestion Top speed limiter
Table 2.4 shows non-powertrain strategies car makers can use to reduce CO2 emissions from conventional IC vehicles, although the scale of the impact is highly variable. There are therefore a number of technologies coming onto the market which will have the effect of keeping conventional IC engines more environmentally competitive. Within the next few years we will see a development whereby petrol engines will become smaller, turbocharged and fitted with technologies specifically introduced for greater efficiency, while other innovations will be in transmissions (see Table 2.5). This could make petrol engines competitive in fuel consumption (and CO2 emissions) terms with diesel, improving fuel consumption by up to 18 per cent but with the advantage of cheaper emissions control than future generations of diesel engine (Barkholz, 2009). Diesel technology is becoming increasingly expensive as more esoteric technologies are needed for it to meet tightening emissions standards. Yet diesel is a key element of the car makers’ strategy for meeting lower CO2 limits. The focus is now on improved, lean-burn petrol engines, which mimic to some extent the advantages and characteristics of diesel engines (Mercedes-Benz calls this ‘Dies-Otto’). On the other hand, improvements in the diesel combustion process are being developed in order to avoid expensive and complex after-treatment technologies. Both these approaches involve the technologies outlined in Table 2.5 below.

Options to achieve 80g/km CO2 by 2020
Centre for Automotive Industry Research & ESRC BRASS Centre, Cardiff University, Cardiff, Wales, UK Page 33
Table 2.5: Impacts of future powertrain developments
Technology Likely EU introduction
Likely CO2 savings (source)
Variable valve actuation Available now
Electronic valve actuation (no camshaft)
2010 15-20% (Valeo)
Direct injection petrol engines (GDI)
Available now 15% (Bosch)
Cylinder switch off (available in US)
2010 10-15% (Chrysler)
Stop-start Available now 10-15% in urban driving (Citroen); 5% overall (Lotus, ZF); 20-25% in urban driving (Fiat)
Starter-generator Available now
Variable compression ? 15-20% (Saab)
Turbo-charging and supercharging combined with downsizing
Available now
Improved transmissions (CVT, DSG, AMT, etc.)
Available now
Low rolling resistance tyres Available now 2-5% (Michelin)
Petrol-electric hybrid Available now 18% (Honda); 22% (Lotus); 25% (Connaught)
Diesel-electric hybrid 2010-2012 35% (PSA)
Plug-in hybrid 2011-2013 Dependent on generating mix of electricity used to charge in plug-in mode
8-speed transmission 2010 6% compared with 6-speed (ZF)
Electric power steering 2010 2-3% (ZF)
Electric active roll stabiliser 2010 1-2% (ZF)
(Source: company press releases)

Options to achieve 80g/km CO2 by 2020
Centre for Automotive Industry Research & ESRC BRASS Centre, Cardiff University, Cardiff, Wales, UK Page 34
Transmissions are also subject to rapid development as a whole powertrain approach is now increasingly employed; this can often avoid spending on more complex engine technologies. The Volkswagen Group’s DSG (Direkt Schaltgetriebe) is a good example of such a technology, allowing even a heavy vehicle such as the VW Touran, real world extra-urban fuel consumption figures of less than 5 l/100 km. With such systems, more and more control is being taken away from the driver, who is increasingly regarded as interfering with optimum (emissions) performance. Even automated manual transmissions will therefore become more automated even though at their core there is a conventional gearbox. Automatic transmissions have already enjoyed improvements such as lock-up torque converters which significantly reduce frictional losses, while other novel technologies such as continuously variable transmission (CVT) see a new lease of life as a result of improved electronic control systems. CVT is a well established technology in Japan and will increasingly be seen in Europe, especially on small cars, although Audi/SEAT has been driving its use on larger cars. It is also fitted to the Toyota Prius. The UK IVT technology, as developed by Torotrak, may also finally come to market within the next few years. It is likely that the manual transmission as we know it today will have disappeared certainly by 2030, but possibly as early as 2020 in the interest of emissions control, although a few, marginal specialist vehicles may retain conventional gearboxes. However, even competition cars are these days rarely fitted with manual transmissions, such that the link between manual gear changing and sportiness is already being eroded.
A relatively simple measure is the fitment of low rolling resistance tyres. The Peugeot 308 was one of the first cars to be fitted as standard with Michelin Energy Saver tyres, which according to the tyre manufacturer reduce CO2 emissions by almost 4 grammes per kilometre (Michelin 2009).
2.5 INCREMENTAL (TACTICAL) OPTIMISATION: NEW DESIGNS
This approach can be highly successful if a totalising new philosophy is adopted. The evidence for this comes from the Tata Nano which showed quite clearly what could be achieved if a totalising low-cost philosophy is adopted. These two philosophies are not synonymous it is true, but still the Nano is a profound illustration of what minimalism can achieve – and incidentally achieves respectable fuel economy with what is comparatively dated technologies. The approach taken by
Many of these technologies offer
significant CO2 and fuel efficiency
savings. A number of these can also be
delivered at relatively low cost, if they
can be rolled out on a sufficiently
large scale. With each additional
measure the incremental effect is
proportionately less, and it is not
envisaged that all would be adopted
in a single vehicle. However, allowing
for this, and taking a selection of the
most cost-effective technologies, CO2
reductions of up to 30 per cent are
potentially achievable. These are all
evolutionary changes and technically
it should be possible to deliver this
level of benefit in new models, in a 5-
10 year timescale.
Options to achieve 80g/km CO2 by 2020
Centre for Automotive Industry Research & ESRC BRASS Centre, Cardiff University, Cardiff, Wales, UK Page 35
the manufacturers of quadricycles3 is similar in many respects. It is arguable that to date the vehicle manufacturers have not yet sought to achieve this sort of optimisation. Of course, any new vehicle design is a compromise that seeks to resolve multiple and often conflicting criteria.
The Toyota Prius can be seen in this respect as a new design seeking incremental optimisation in that the hybrid element is an additional feature combined with a traditional IC engine and all-steel body, albeit with CVT. Interestingly, it might be that this model and others like it are eventually seen as stepping stones in the transition from incremental optimisation to strategic optimisation.
2.6 RADICAL (STRATEGIC) OPTIMISATION: NEW DESIGNS
Vehicle manufacturers have intermittently sought to introduce radical strategic changes to their designs, but not necessarily with low-carbon at the forefront of their considerations. A textbook example is the Audi A8, but many other luxury / sports car models fall into this category in the contemporary era. The underlying thinking is that alternative, low-weight, designs often involve materials and processes that are viable at volumes an order of magnitude lower than those of a traditional pressed and welded all-steel vehicle – and that these products are better able to sustain premium pricing to recover the extra costs of these products (Nieuwenhuis and Wells 1997).
Their viability at lower volumes means that this is an area where new entrants are most likely to appear. Concept’s such as the Loremo, Gordon Murray Design’s T25 and RiverSimple’s small fuel cell car are examples of this. These concepts involve the use of novel light-weight materials, as well as reduction in mass. While the RiverSimple uses a fuel cell stack, the GMD T25 and Loremo are designed for a conventional IC powertrain, although the latter is also due to have a BEV option.
2.7 TECHNOLOGY PACKAGES FOR LOW-CARBON CARS
Toyota has made a considerable impact with its Prius petrol-electric hybrid, particularly in California and in the London Congestion Charge Zone. In typical urban stop-start driving, such a powertrain does generally give a CO2 emissions advantage that is not necessarily evident from the EU test cycle. Several other manufacturers are also introducing or preparing hybrid vehicles. Honda was another pioneer with its ultra lightweight Insight two-seater, a vehicle which achieved around 85 g/km of CO2, but which is no longer offered. Honda now offers a larger, more practical version of the Insight, while its hybrid technology package (IMA – integrated motor assist) is being introduced on other Hondas as well.
European manufacturers are following two development trajectories in response to this Japanese initiative. The first involves stop-start systems. These switch off the engine when the car is stationary and start it immediately when the car needs to move off. The system can be introduced on many cars currently in production and evidence from suppliers of these systems suggests they
3 These are also known as ‘voiturettes’, ‘voitures sans permis (VSP)’, etc. They enjoy a more lenient regulatory
regime than cars, although they are limited to a weight of up to 400kg, depending on sub-category, which leads to novel engineering solutions, particularly in weight reduction; they also return very good fuel consumption/CO2 figures. They are also discussed in chapter 5.
Options to achieve 80g/km CO2 by 2020
Centre for Automotive Industry Research & ESRC BRASS Centre, Cardiff University, Cardiff, Wales, UK Page 36
will be seen in considerable numbers on EU roads in the very near future. These ‘mild hybrid’ systems give many of the advantages of a hybrid – particularly in urban driving – at considerably lower cost both to the manufacturer and the consumer. It is also possible to retrofit some of these systems to existing cars and vans. They are said to give a CO2 saving on the test cycle of 10-15 per cent.
Another development is the diesel hybrid. This is thought to provide significant savings in fuel consumption as well as CO2 emissions compared even with a petrol-electric hybrid, although its integration in a car with acceptable NVH (noise, vibration and harshness…a measure of comfort within the vehicle) performance is challenging and costly. Diesel-electric hybrid technology is currently used on some light and medium trucks, vans and buses. It is therefore a proven technology, but the problem is its integration in a car, where expectations of low noise and vibration levels are higher than in commercial vehicles. Various prototypes have been shown, such as that developed by Valeo and Ricardo. PSA Peugeot Citroen has announced it will have a diesel-electric hybrid car available from 2010, although 2012 seems more likely.
More promising, perhaps is the plug-in hybrid. This uses existing hybrid technology but with more battery storage capacity which can be charged from the mains. It thus combines hybrid and battery-electric vehicle technologies. If run as a pure series hybrid, the IC engine can be much reduced to the role of a ‘range extender’ which begins to generate electricity when battery charge falls below a critical level, but which does not drive the car directly. Series diesel-electric hybrid technology is currently used on trains and heavy earth-moving equipment and is a very energy efficient technology and was shown by GM as the Volt concept, which is due to enter production in limited numbers by 2010 at the earliest, but more likely 2011-2012. Other manufacturers have announced similar vehicles and this seems a very promising technology for dramatic improvements in CO2 emissions, with near-market technologies.
We can distinguish therefore a range of different technology packages or ideal types with respect to differing levels of CO2 reduction. These range from the modest efforts at incremental optimisation of existing designs to much deeper and more strategic developments. The main packages identified for the purposes of subsequent analysis in Scenario 1 are:
• Standard vehicles. These models have CO2 emissions significantly above the target requirement and show no particular evidence of being designed or altered to meet the target;
• Eco-variants. These are the ‘efficiency’ versions of existing and new model ranges where most of the models (at least currently) have not been adapted to achieve low carbon emissions. As of mid-2009, most of the mainstream vehicle manufacturers have some form of green sub-brand to identify the eco-variants within their ranges, and the extent of such eco-variants is slowly increasing to cover more models in the range. Typical adaptations include changing the gear ratios and engine mapping, using tyres with low rolling resistance, using under-body trays to reduce drag, and using low-viscosity transmission oil.

Options to achieve 80g/km CO2 by 2020
Centre for Automotive Industry Research & ESRC BRASS Centre, Cardiff University, Cardiff, Wales, UK Page 37
• Eco-variants with stop-start. These are a step further than the eco-variant thinking in that they require some engineering changes such as the addition of a more powerful battery and starter mechanism.
• Petrol hybrids. As illustrated with the Toyota Prius of course, the petrol hybrid combines an internal combustion engine with an electric motor and battery, the two power sources working together or in isolation depending upon the circumstances and the power delivery strategy adopted. The electric motor generally contributes relatively short bursts of extra power at times of peak demand (acceleration from rest, overtaking) thereby enabling the internal combustion engine to be smaller and less powerful. The battery can be recharged through regenerative breaking, thus helping with energy recovery.
• Diesel hybrids. The diesel hybrid is similar in concept to the petrol hybrid, though it has proven somewhat more challenging to achieve. In both cases the hybridisation process tends to add components and materials to the car, hence adding weight, complexity and cost.
• Plug-in hybrids. The key difference with the plug-in hybrid concept is that it is the electric motor that provides the motive power to the wheels, using electricity from the on-board battery which is able to be re-charged from an external power source. There is an on-board motor, but it is simply there as a generator to supply electricity to the battery should it be necessary, and hence can be optimised to run at a single speed. As a result, the on-board engine is generally small, and relatively efficient.
• Battery electric vehicles. These are fully-electric vehicles with an on-board battery providing the sole source of power, and have zero carbon emissions from the vehicle. The actual value of carbon emissions will depend upon the generating mix required to supply the electricity to the battery.
2.8 MODELLING THE MARKET MIX FOR LOW CARBON
Using the technology packages outlined above, it is possible to attribute approximate emissions performances to each package type. Hence it can be seen that the different packages offer decreasing emissions of CO2 but at approximate increasing cost, complexity or level of technological development. The ‘easiest’ package is thus the eco-variant, an example of which is the Fiesta Econetic with a CO2 performance on the NEDC of 98 g/km. We will use this as our starting point and assume a nominal 100 g/km CO2 emissions performance.
Now, the nominal emissions performance figures used are those to be obtained with current technology development and design approaches on current vehicles, albeit some of them prototypes. Hence, the eco-variants technologies when applied to a full range of cars would not yield, at current levels of development, 100 g/km. The figure is likely to be rather higher, as product ranges are made up of vehicles of different size. Implicit in the mix of technologies adopted therefore is a dynamic of underlying technology development for each technology package. This line of reasoning also applies to ‘standard’ cars, for which the prevailing EU average CO2 figure for

Options to achieve 80g/km CO2 by 2020
Centre for Automotive Industry Research & ESRC BRASS Centre, Cardiff University, Cardiff, Wales, UK Page 38
2008 is used. Clearly, many vehicles fall above this figure at present, but the average is pulled down by the prevalence of more efficient models. The approach is to keep reducing the share given to the higher emitting classes, and increasing the share to the lower emitting classes, until the 80 g/km figure is reached. In addition, there is a rough hierarchy of likelihood in that the eco-variants are the most likely (easy to achieve, cheap) while the diesel hybrids are the least likely, at least for cars (expensive, NVH issues to resolve). This approach does not allow for other strategies as explored in the remaining scenarios. Hence, it is assumed for Scenario 1 that the vehicle manufacturers do not seek to adopt new segment mixes, or de-powering of vehicles even though all of these may be plausible. Rather, the intention is to show what would be necessary to achieve the 80 g/km target by altering the technology mix alone. In this regard, it is not necessary to consider the implications of the technology packages for the different size categories as used by the European Commission (i.e. small, medium, large) because it is assumed that the current mix remains unchanged. Clearly, other strategies are possible and in fact are considered elsewhere in this report under the subsequent scenarios. Indeed, beyond the measures adopted by the vehicle manufacturers with respect to carbon emission reductions there are wider issues with respect to sustainability in general and measures that might be adopted at a social level (e.g. road pricing; car labelling) as explained by Avery et al. (2009).
2.9 LEGISLATIVE AND POLICY FRAMEWORK FOR SCENARIO 1
Regulation (EC) 443/2009 (hereafter, the Regulation) sets a mandatory CO2 emissions reduction target of 130 g CO2/km for the average new car fleet. According to Article 4 of the Regulation, this target is to be met by 100 per cent of the new car fleet from 2015 onwards through improvements in vehicle motor technology. The way the system works is that each individual manufacturer, or pool of manufacturers of M1 classification vehicles (passenger cars) established under Annex II of Directive 2005/43/EC, will be responsible for ensuring that their average emissions of CO2 do not exceed their specific emissions target.
The longer term objective provided in the Regulation is the reduction of average CO2 emissions to 95 g CO2/km for passenger cars from 2020 onwards. Under Article 13(5) of the Regulation, the European Commission must review the CO2 emissions targets laid down in Annex I, along with the derogations for certain niche manufacturers contained in Article 114.
In order to achieve the CO2 emission reduction target of 80 g CO2/km based on Scenario 1 vehicle composition and technological advances, the main regulatory measure required is amendment to Regulation (EC) 443/2009. This would establish the more stringent target of 80 g CO2/km to be achieved by 2020.
4 This includes: manufacturers responsible for fewer than 10,000 new passenger cars registered per calendar year
in the Community and who are not part of a group of manufacturers.

Options to achieve 80g/km CO2 by 2020
Centre for Automotive Industry Research & ESRC BRASS Centre, Cardiff University, Cardiff, Wales, UK Page 39
2.9.1. SPORTS UTILITY VEHICLES
The scope of the current Regulation covers only M1 category motor vehicles (passenger cars). M1 vehicles are “vehicles for the carriage of passengers and comprising not more than eight seats in addition to the driver’s seat.
In October 2009, the European Commission also published a proposal setting emission performance standards for new light commercial vehicles and as part of the Community’s integrated approach to reduce CO2 emissions from light duty vehicles (COM (2009) 593 Final). In the same vein as Regulation (EC) 443/2009, this proposal seeks to establish CO2 emission reduction targets at 175 g CO2/km by means of improvements in vehicle technology for N1 vehicles. The long term target is currently proposed at 135 g CO2/km from 2020 onwards. Critics consider that before adoption these targets need to be set more stringently to: 175 g/km by 2012; 160 g/km by 2015 and 125 g/km by 2020.
SUVs occupy a difficult position in the regulatory framework. With greater CO2 emission allowances for category N1 as proposed, vehicle manufacturers may escape the 130 g/km target by classifying their vehicles as N1 and meeting instead the higher CO2 emission reduction targets.
At present, the absence of measures which place CO2 emission targets on N1 category vehicles entitles manufacturers wishing to bring to market these sorts of vehicles the ability to omit these vehicles from the CO2 emission reduction requirements and may also encourage manufacturers to design heavier rather than lighter SUVs. This sort of negative effect has been experienced in the US through the introduction of the much criticised US Corporate Average Fuel Economy Regulations (CAFE standards). The US CAFE Regulations set fuel consumption standards for vehicles and light trucks up to 3,855 kg gross vehicle weight and apply to the overall fleet sold in a given year by a manufacturer. Since light trucks, including some SUVs were predominantly used for farming when the US CAFE Regulations were introduced Congress left the levels of fuel economy of light trucks to be set by the National Highway Traffic Safety Administration. These targets were much less stringent than those established for passenger cars and the industry responded by adding weight to vehicles and turning once passenger cars into light trucks for the purposes of avoiding the tighter fuel economy standards for lighter vehicles.
It is telling, not only in the limited effectiveness of the US CAFE Regulations to date, but also by the extension of scope to include larger vehicles in these Regulations (due to come into force in 2011) that capturing vehicles which traverse the boundary between passenger and commercial vehicles, either by definition or by weight, can have a significant and detrimental impact on the achievement of reduced CO2 emissions. Ultimately, it can delay action within the automotive industry to adapt technology to take into account the need to minimise adverse impacts on the environment through the production, utility and ultimate disposal of vehicles.

Options to achieve 80g/km CO2 by 2020
Centre for Automotive Industry Research & ESRC BRASS Centre, Cardiff University, Cardiff, Wales, UK Page 40
Table 2.6: Current policy problems and solutions for Scenario 1
Weakness Solution Method
CO2 emission reduction targets are set too low
Establish tighter CO2 emission reduction targets of 80 g CO2/km
Amend CO2 emission reduction targets in Regulation (EC) 443/2009 e.g. reduction of CO2 emission to 80 g CO2/km.
Type-approval of SUVs as N1 rather than M1
Close possible loophole by tightening type-approval rules, regulate for N1 vehicles
Amend Annex II Directive 2007/46/EC. Tighten CO2 reduction targets for N1 vehicles proposed under COM (2009) 593 Final
Eco-innovation provision lacks effective measurement
Restrict to CO2 levels established in official testing procedure
Amend Regulation (EC) 443/2009 and delete Article 12. Delete the proposed Article 11 from COM (2009) 593 Final.
Vehicle performance and emissions are dependent on real world driving
Improved vehicle test procedures and test cycles to measure emissions
Review of test procedures by 2014 pursuant to Art 15(3) to better reflect real world driving.
2.10 SUMMARY
The following gives a possible break down for the mix of technologies that could obtain 80 g/km. There are in fact several intermediary steps that could plausibly be accounted for as the transition process unfolds over the period from 2010 to 2020. That is, the share of the higher emitting classes is reduced as those of the lower emitting classes are increased. In effect this also subsumes the story of technological improvement in that the expansion of the share of, say, diesel hybrids is a reflection of the growing maturity and cost-effectiveness of the technology which allows it to be applied to a wider range of models and variants.
What this illustrates therefore is that the achievement of 80 g/km by 2020 with prevailing segment mixes unchanged would require a substantial penetration of petrol or diesel hybrids, as well as some electric vehicles and plug-in hybrids. Note that here and in Scenario 2 a ‘standard’ car is given an approximate prevailing EU average of 153 g/km CO2 emissions. In the later discussion on

Options to achieve 80g/km CO2 by 2020
Centre for Automotive Industry Research & ESRC BRASS Centre, Cardiff University, Cardiff, Wales, UK Page 41
combined scenarios the remaining ICEVs are allocated 130 g/km on the assumption that vehicle manufacturers will seek to meet regulatory limits.
Table 2.7: Possible market mix to achieve 80g/km by 2020 under Scenario 1
Segment Share (%) by 2020
CO2 (g/km)
KWh/km
Standard 0 153 0.64
BEV 3 36 0.13
Eco Variant + stop-start 20 95 0.40
Petrol-electric Hybrid Vehicle 40 80 0.30
Diesel-electric Hybrid Vehicle 35 75 0.31
Plug-in Hybrid Electric Vehicle 2 50 0.21
Adjusted fleet average 100 80
So, in terms of our summary points for this scenario, we can conclude the following:
• Average cost per vehicle to the manufacturer – within acceptable limits as existing product development programmes would be biased towards carbon reduction, rather than comfort features.
• Lock-in effects impacting further efficiency improvements until 2050: these may be limited as by 2020, or certainly 2030, the limits of what is possible with IC technology may well be reached, or at least the law of diminishing returns will limit any gains.
• Co-benefits e.g. in the areas of safety, air pollution, noise: air pollution will also be reduced; neutral in terms of safety, although some EV safety issues may need to be addressed.
• Potential implications for: o Vehicle manufacturers: increased product development need, but unlikely to
increase cost beyond existing trends; acting on CO2 increasingly part of ‘licence to operate’ and also increasingly a factor in competition.
o Consumers: benefit in lower fuel cost, or at least (partial) compensation for the inevitable rise in fuel costs.
o Regulators: will benefit from continuing tax revenue stream at little cost; strong regulatory support and some incentives may be needed.

Options to achieve 80g/km CO2 by 2020
Centre for Automotive Industry Research & ESRC BRASS Centre, Cardiff University, Cardiff, Wales, UK Page 42
CHAPTER 3 – SCENARIO 2: ELECTRIC VEHICLES.
3.1 INTRODUCTION
The battery electric vehicle is one of the oldest powered vehicle types in the world and electric commercial vehicles of various types have been around since the nineteenth century. Despite the dominance of internal combustion (IC) technology for the past century, there are good reasons to believe that electric vehicles (EVs) may escape from the margins of the market, where they have been languishing for the past hundred years, and become more mainstream within the next ten years or so. In fact, McKinsey researchers argue that: “The underlying propulsion technologies for passenger vehicles will almost certainly undergo a major transition over the next few decades, as various configurations of vehicle electrification penetrate the market” (McKinsey 2009: 22). We can summarise the broader drivers for this renewed consumer and regulatory acceptance of EVs as actions prompted by:
• Concern about urban air quality
• Concern about global warming
• Concern about energy security
• Improved EV technologies
• Regulation at EU and Member State level to encourage low-carbon cars
• Regulation at city / urban level to establish zero emissions zones
• Incentives / subsidies offered by government and potentially others such as companies
IC vehicles produce tailpipe pollutants of various types, many of which are harmful to humans. In this context, the EV has long been seen as a possible solution in that it produces zero emissions at point of use. For this reason, EVs enjoyed a brief revival from the late 1960s onwards with several ups and downs since then. Despite tighter emissions regulation, the growing number of IC vehicles in many urban areas has compensated for the lower emissions of each individual vehicle; the appeal of EVs in the urban environment has therefore not changed, it has in fact increased. This prompted the ZEV Mandate of the California Air Resources Board (CARB) in the 1990s. CARB initially favoured battery-electric vehicles (BEVs), although it later shifted its preference to fuel cell electric vehicles (FCEVs). There are other potential zero emission technologies available, notably those using compressed air, flywheels or other energy storage concepts. However, though in some
‘We recognize that pursuing
electrification as one of our
technology paths presents unique
challenges for commercialization of
the vehicles. It requires us to
collaborate with new partners,
define new business models, connect
to a new infrastructure for the
vehicles and meet new customer
expectations around the globe.’
(Sue Cischke, Ford Group Vice President of Sustainability,
Environment and Safety Engineering, as quoted in
Automotive News October 9, 2009)

Options to achieve 80g/km CO2 by 2020
Centre for Automotive Industry Research & ESRC BRASS Centre, Cardiff University, Cardiff, Wales, UK Page 43
cases cheaper, these technologies are considered to be comparatively marginal and are not included in this report.
Despite first being mooted as a possible issue in the 1890s, global climate change has only really come to the attention of policy makers and the wider public since the 1980s. Here too, EVs often perform better, although the picture is less obviously favourable. The exact performance is dependent on the generating mix used to generate the electricity stored in the vehicle’s batteries. In terms of CO2, within the EU, Germany and the UK are somewhere in the middle in this respect (natural gas, coal), with countries such as Sweden and France at the low carbon end (nuclear and hydro) while a country like Greece is at the high carbon end (coal).
Fig. 3.1 shows the CO2 intensity for motive energy supplied at the wheels of ICEVs and BEVs in a number of different operating environments, reflecting different generating mixes for BEVs. It is clear that the IC gasoline option has the highest CO2 emissions on a plant-to-wheels basis, while running a BEV in Greece is on a par with diesel due to the coal-intensive generating mix in Greece. Beyond that, a BEV comes out better in all environments featured in the graph due to energy conversion efficiencies, although the US, with its coal-intensive average generating mix comes out as significantly worse than the EU average, while Austria – and California (not included in our version) – offer a clear and significant advantage to BEVs as a result of their generating mix. Figure 3.1: CO2 Intensity of motive energy
0
200
400
600
800
1000
1200
1400
1600
1800
BEV EU BEV Greece BEV Austria BEV USA ICE Diesel ICE Petrol
gC
O2/
kWh
(Source: adapted from: Kendall 2008: 89)
It could be argued that it is not so much the overall generating mix, but the marginal element within this that might be accessed specifically for charging EVs. In many cases this may consist of high carbon fuels (Dings 2009b: 32; CE Delft 2010).

Options to achieve 80g/km CO2 by 2020
Centre for Automotive Industry Research & ESRC BRASS Centre, Cardiff University, Cardiff, Wales, UK Page 44
The improved EV technologies are the result of a combination of factors. First there is the development of improved EVs, partly in response to drivers such as the ZEV Mandate in California, which yielded the landmark GM EV-1 and which, combined with the PNGV lead to new battery developments (Nieuwenhuis and Wells, 1997, ch3). Parallel developments in Japan in the hybrid field have also contributed. These were initially aimed at Toyota’s Prius and Honda’s Insight. These vehicles were also largely developed in response to the ZEV mandate, as well as Japanese carbon reduction policies under the Kyoto Protocol (Sperling et al. 2000). These developments added further to EV powertrain improvements, while developments in the field of portable electronic devices (e.g. laptops) and support systems for fuel cell vehicles have been at least as important. The former is typified by the battery technology for Tesla, also now introduced by Th!nk. The past decade has seen more resources dedicated to EV-related technologies than the previous hundred years and this is beginning to pay off. In 2007, the alternative fuel vehicles (AFV) increased their share of even the conservative UK market by 76.3 per cent from a low 0.4 per cent to 0.7 per cent. Even so, 0.7 per cent of the UK market is not trivial and shows a considerable level of interest in (mainly) hybrid electric vehicles. This proportion was maintained in the first half of 2008.
At present we can identify four different types of electric vehicle, although one could argue for more variants:
• IC-electric hybrid (including both petrol and diesel types)
• Plug-in hybrid types with a larger storage capacity which can be recharged from the mains as well as the engine
• Battery electric vehicles – without IC engine
• Fuel cell electric vehicles – a hybrid type whereby a fuel cell generates electricity to charge a storage device
One of the key long term trends in automotive technology has been the gradual electrification of the car (Fig. 3.2). The past hundred years have seen a gradual replacement of mechanical solutions with electric and electronic ones. The obvious areas are in fuelling and ignition, leading to modern powertrain management systems which allow optimisation of engine, transmission, and increasingly other components, such as ABS and ESC. Some cars also use electric steering assistance, replacing hydraulic systems, while electric braking was pioneered on the GM EV-1 (Shnayerson 1996). This trend is likely to continue, which means that even IC cars will become more like EVs over time.
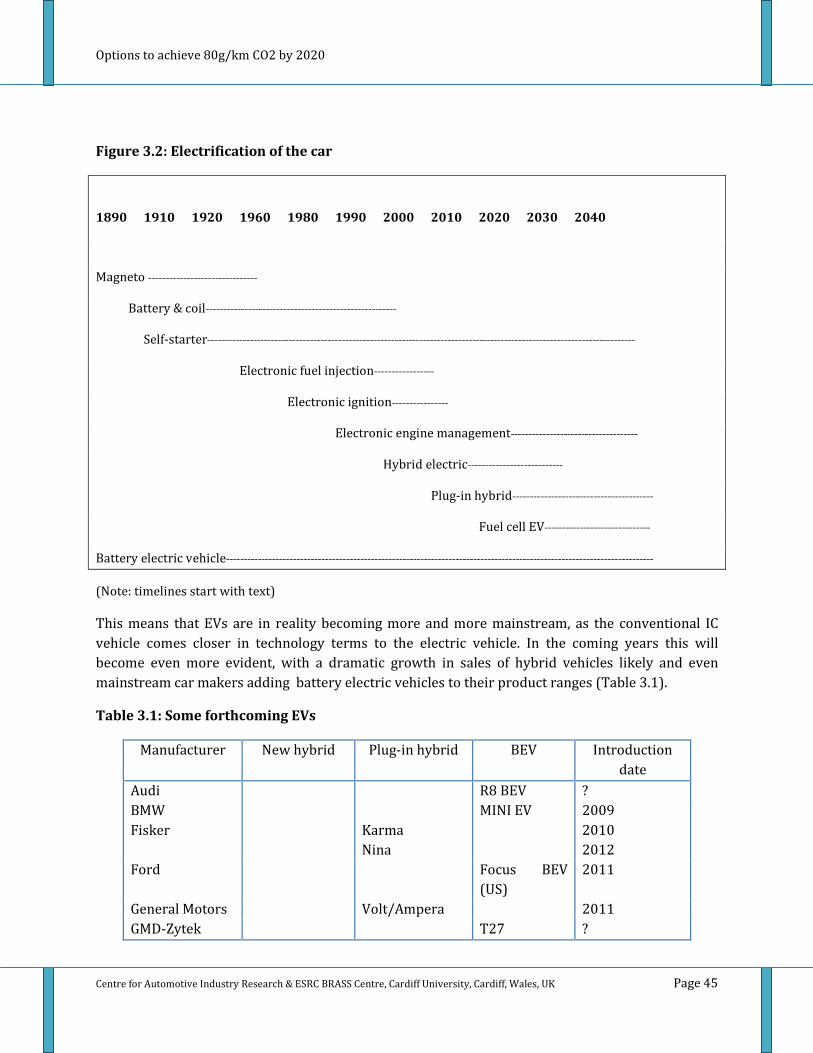
Options to achieve 80g/km CO2 by 2020
Centre for Automotive Industry Research & ESRC BRASS Centre, Cardiff University, Cardiff, Wales, UK Page 45
Figure 3.2: Electrification of the car
1890 1910 1920 1960 1980 1990 2000 2010 2020 2030 2040
Magneto -------------------------------
Battery & coil------------------------------------------------------
Self-starter-------------------------------------------------------------------------------------------------------------------------
Electronic fuel injection-----------------
Electronic ignition----------------
Electronic engine management------------------------------------
Hybrid electric---------------------------
Plug-in hybrid----------------------------------------
Fuel cell EV------------------------------
Battery electric vehicle-------------------------------------------------------------------------------------------------------------------------
(Note: timelines start with text)
This means that EVs are in reality becoming more and more mainstream, as the conventional IC vehicle comes closer in technology terms to the electric vehicle. In the coming years this will become even more evident, with a dramatic growth in sales of hybrid vehicles likely and even mainstream car makers adding battery electric vehicles to their product ranges (Table 3.1).
Table 3.1: Some forthcoming EVs
Manufacturer New hybrid Plug-in hybrid BEV Introduction date
Audi R8 BEV ? BMW MINI EV 2009 Fisker Karma
Nina 2010
2012 Ford Focus BEV
(US) 2011
General Motors Volt/Ampera 2011 GMD-Zytek T27 ?

Options to achieve 80g/km CO2 by 2020
Centre for Automotive Industry Research & ESRC BRASS Centre, Cardiff University, Cardiff, Wales, UK Page 46
Honda CR-Z IMA sports car
2010
Infinity M35 Hybrid
BEV
2011 2015?
Mitsubishi i-MiEV 2010 Mercedes-Benz S400
BlueHybrid 2009
Nissan Leaf 2010 Porsche 911 BEV ? Renault-Nissan 4 new BEVs 2011-2012 REVA NXR 2011 Rolls-Royce Phantom 1.5
hybrid 2015?
Th!nk City 2010 Toyota Auris HSD 2010 Volvo DRIVe V2 PIH
V70 C30 BEV 2012
(Source: Way 2009; Automotive News 2009b; GMD 2009; manufacturers’ press releases and websites).
The seriousness with which mainstream manufacturers are addressing the EV agenda is clear from this, in particular the announcements by sports and luxury car makers such as Porsche and Rolls-Royce that they are working on EVs is significant. Apparently the Rolls-Royce hybrid replaces the usual 6.8 litre V12 engine with a 1.5 litre engine (Way, 2009). Yet in some respects, the battery-electric vehicle is more established in commercial applications than for private cars. The advantage in this context is often predictable operating range and depot-based vehicles.
Daihatsu is not mentioned in Table 3.1, but has long been one of the largest EV manufacturers, although its market is mainly Japan. The role of policy measures such as the London Congestion Charge and favourable treatment in other urban restrictions zones such as those in Italy and Norway is important in promoting EV use (Nieuwenhuis 2009a). Norway has wholeheartedly embraced the electric vehicle. It does have the history of Th!nk, of course, but it also has considerable hydroelectric resources, thus it is able to claim that much, if not most of the electricity used to run its electric cars comes from renewable sources. Electric vehicles also enjoy several incentives in terms of no purchase tax, no VAT, access to cities without charge, free parking, recharging facilities, no road tax, use of bus lanes, etc.
In the context of battery-electric vehicles, the issue of a recharging infrastructure is often raised. This need not present undue challenges. Electric infrastructures are ubiquitous in the developed world, especially in urban areas, to which BEVs are best suited. In Spain it was suggested recently that the – increasingly obsolete – network of public telephone boxes could provide an ideal basis for a network of public charging points (Tremlett 2009).

Options to achieve 80g/km CO2 by 2020
Centre for Automotive Industry Research & ESRC BRASS Centre, Cardiff University, Cardiff, Wales, UK Page 47
3.2 HYBRIDS
Hybrids are nearly as old as BEVs, but have a more chequered history in road vehicles, although the technology is well established in diesel-electric trains and heavy earth moving equipment (Wakefield, 1998). In Scenario 1 we highlighted the way in which hybridization is more likely to be used by manufacturers of heavier, larger vehicles than those of small vehicles in order to meet the legal requirements for a reduction in CO2 emissions. A good example of this line of thinking is the Mercedes-Benz Vision S-500 plug-in hybrid, shown at the 2009 Frankfurt show.
Hybrids are discussed under scenario 1 as well, as they can be seen as enhanced IC vehicles, however, they have also established themselves in a commercial vehicle context with diesel-electric hybrids well established, unlike in the car market. US firm Azure Dynamics makes hybrid electric vans and trucks as well as battery electric ones. Several of its hybrid vans are currently on trial with the US Postal Service. More mainstream manufacturers such as Mercedes-Benz are also developing hybrid electric light commercial vehicles. Also of interest are conversion firms such as Connaught in Wales, UK which converts a range of panel vans and claims fuel consumption and CO2 reductions of 15-20 per cent over a realistic drive cycle (Connaught 2009). Connaught first came to the attention of the media with its hybrid luxury coupe. More recently it has developed this powertrain technology as an aftermarket retrofit mild hybrid system for light commercial vehicles. The system is designated ‘Hybrid+’ and features super-capacitors as a storage system.
In the longer term, we envisage the current type of petrol-electric hybrid to be displaced by the plug-in hybrid. These, as typified by the GM Volt/Ampera, use a relatively small engine as a range extender for what is primarily a mains-chargeable battery electric powertrain in a series-hybrid configuration. They therefore offer the advantages of both an IC vehicle and a BEV. The plug-in hybrid could well become the greatest threat to the BEV, as it is a BEV with greater range, albeit at the expense of greater complexity, and higher maintenance costs, as well as higher emissions at point of use. These features may work against the plug-in hybrid in the long term, particularly in a commercial environment. However we should point out that all these electric powertrain developments also help the BEV in that they deliver better batteries and cheaper electric drivetrain components once economies of scale are achieved. These will reduce the cost differential between electric and IC vehicles over time.
3.3 BATTERIES
Crucial to the further development of battery-electric vehicles is the battery. Much of the work in this area is currently carried out by Japanese firms and a Japanese consultancy declared recently that:
“Companies that successfully control rechargeable batteries also control the new generation
automobile market.” (TechnoAssociates 2009).

Options to achieve 80g/km CO2 by 2020
Centre for Automotive Industry Research & ESRC BRASS Centre, Cardiff University, Cardiff, Wales, UK Page 48
Other key technologies are motors and inverters, although batteries represent by far the highest cost and the most severe limitations to the mass take up of EVs. A number of strategic alliances are being formed between battery producers and car manufacturers, which will determine the future technological competitive environment in the car industry (Table 3.2).
Table 3.2: Car manufacturer – battery manufacturer alliances
Car manufacturer(s)
Products Battery manufacturer
(origin)
Nature of relationship
Investment Annual Capacity
Toyota Prius, PHEV 200
Panasonic (J) PEVE - 60% Toyota; 40% Panasonic
$300M 900k by 2010
Nissan/Renault, Fuji Heavy Industries (Subaru)
Nissan EV, Subaru Stella PI
NEC, NEC Tokin (J)
AESC – 51% Nissan, 42% NEC, 7% NEC Tokin
$300M 13k – 65k, from 2009
Mitsubishi Motors i-MiEV GS Yuasa (J) Lithium Energy Japan – 34% MMC, 51% Yuasa, 15% Mitsubishi Corp.
$300M 200k from 2009
Honda GS Yuasa (J) Blue Energy – 49% Honda, 51% Yuasa
$250M 200-300k from 2010
Volkswagen Sanyo Electric (J)
+Panasonic (J)
Joint development of Ni-MH and Li-ion batteries
$800M 1 million by 2015, 2.4-3.4 million by 2020
Volkswagen Toshiba (J) Joint development of EV batteries
$300M From 2010

Options to achieve 80g/km CO2 by 2020
Centre for Automotive Industry Research & ESRC BRASS Centre, Cardiff University, Cardiff, Wales, UK Page 49
Volkswagen BYD (PRC) Joint development of EV/HEV batteries
Daimler Evonik Industries (US)
Li-Tec – 49.9% Daimler, 50.1% Evonik
Daimler, General Motors
Continental AG (D)
Joint development
Daimler, PSA Johnson Controls (US), SAFT (F)
Johnson Controls-SAFT Advanced Power Solutions
General Motors Hitachi (J), Shin-Kobe Electric Machinery (J), Hitachi Maxell (J)
Hitachi Vehicle Energy – 64.9% Hitachi, 25.1% Kobe, 10% Hitachi-Maxell
$200M-$300M
700k by 2015
General Motors LG Chem (ROK)
Supply
Chrysler A123 Systems (US)
Partnership
Ford Johnson Controls (US), SAFT (F)
Johnson Controls-SAFT Advanced Power Solutions
Bosch (D), Samsung SDI (ROK)
SB LiMotive $700M 2014

Options to achieve 80g/km CO2 by 2020
Centre for Automotive Industry Research & ESRC BRASS Centre, Cardiff University, Cardiff, Wales, UK Page 50
Continental AG (D), Murata Mfr (J), Daiken Chemical (J)
ENAX
(Source: adapted from TechnoAssociates 2009)
The success or failure of EVs, in whatever form, is heavily dependent on battery technology and for the first time serious investments in this technology are evident. As in other examples, such investments are likely to lead to results. In terms of state of the art technology, the battery of the Mitsubishi i-MiEV is probably the best example at present and its range is around 160km at a battery pack cost of around $46,000 (TechnoAssociates 2009).
Different requirements exist for BEV and HEV applications. The HEV is best served with power-density maximised batteries. For these, TechnoAssociates expect a performance level of 2,000W/kg at a price of $300/kWh by 2015. This represents an increase in power density (power output/kg) of 10 per cent over 2008 and a cost reduction of 85 per cent. For 2020 they forecast a 40 per cent improvement in power density compared with 2008, with a cost reduction of 90 per cent. Ambitious as these figures may seem, this is what is needed for the technology to be cost competitive with IC at current levels.
For BEVs, energy density maximised batteries are best suited. For these TechnoAssociates expect an increase by 1.5 times for 2015 and 2.5 times by 2020. This translates into energy densities of 150 Wh/kg for 2015 and 250 Wh/kg for 2020 at a cost of $300/kWh for 2015 and $200/kWh for 2020. This represents a cost reduction of 85 per cent over 2008. This means a battery pack would cost around $4000 by 2020, compared with four times that cost in 2008. By that time the expected range of a BEV using this technology would be around 200km. By comparison, a study by management consultancy McKinsey assumes cost reductions for batteries of 5-8 per cent a year until 2030. Based on this, incremental vehicle costs would decline from €36,000 ($48,500) today to €5,800 ($7,800) by 2030 for a range of 160km (McKinsey 2009).
The Japanese figures are based on those proposed by the Japanese government’s R&D agency, the New Energy and Industrial Technology Development Organization (NEDO), which was published in June 2009 and which was informed by experts from Japanese industry and government agencies (TechnoAssociates 2009). The roadmap also treats each of the key technology areas separately and this separation in the needs of BEVs and HEVs is also reflected in the emerging industry structure, as outlined in Table 3.2. In the case of GS Yuasa, for example, Blue Energy specialises in battery development for HEVs, while Lithium Energy Japan focuses on BEV batteries.
It is clear that with the Japanese dominance of the sector, American and EU firms are potentially on the fringes. However, the Japanese battery makers need the volumes provided by the US and EU to justify their investments, as reflected in the role of EU and US car makers in the various partnerships. Similarly, Korean firms have a strong presence, and the role of BYD (Build Your

Options to achieve 80g/km CO2 by 2020
Centre for Automotive Industry Research & ESRC BRASS Centre, Cardiff University, Cardiff, Wales, UK Page 51
Dreams), a car company from China is also significant. There is thus a global trend towards electric cars, as outlined in Fig. 3.1, although the social and political desire for automotive electrification has thus far been stronger in Asia and North America than in Europe. However, this hides the fact that VW and Daimler are taking a serious interest in the sector, while other firms, including PSA, Renault, Fiat and Volvo have built up credible expertise in BEVs over the past 20 years or so. They can build on this. It is also important to understand that car manufacturers want to avoid being totally dependent on the expertise of suppliers in such key technologies and will therefore ‘shadow’ their development of new battery technologies. This will create both a degree of in-house expertise and an ability to judge the expertise of potential suppliers in contract negotiations. Within the EU context the strong EV commitments of VAG and Renault-Nissan could be landscape changing.
3.4 COSTS
Higher cost compared with IC vehicles is often mentioned as a barrier to the spread of EVs. It is true that EVs tend to cost more to buy; these costs tend to be offset by lower operating costs. In the case of hybrids, the double powertrain naturally adds cost, while energy storage devices such as batteries and super-capacitors are also expensive items. Andy Palmer of Nissan stated recently that “Normal car development cost is about $300 to $500 million, and EVs are above the upper range of that” (Automotive News 2009). Battery costs are considerable and in the case of Th!nk, for example, the cost of the battery is similar to the cost of the vehicle itself at around NKR160,000-170,000 (Th!nk executive, pers. Comm.).
Although there is a perception that costs are higher for EVs, informal feedback from some battery-electric LCV operators suggest that over a typical operational lifecycle of five years, with the current level of diesel prices, EVs are very close to being competitive (see also McKinsey figures below). Despite the fact that the purchase price, including batteries, is significantly higher, maintenance costs tend to be lower, ‘fuel’ costs per mile are significantly lower5, residual values are expected to be higher in view of the higher component and material value contained within the EV powertrain and the longer operating life. Exemptions from various operational costs, such as road tax in many member states, London Congestion Charge, Norwegian city tolls, etc. also add up over time, particularly for larger fleet operators.
However, we have to assume that as EVs become more common, and IC vehicles decline in number, such lenient taxation regimes will disappear and that EVs will be taxed.
Electric vehicles have traditionally enjoyed very long and low maintenance lifecycles (e.g. UK milk-floats) and this is a feature that could be used in marketing, although it may need a culture change in some fleets. We note that UPS has already taken an interest in the MODEC battery-electric van. Another way of looking at these costs is to sell the car and lease the battery, or for end users not to buy the car at all, but to access it through a car club or car sharing scheme, as outlined below.
5 Fuel cost can be compared as follows for the UK context: diesel: £4.40/gal, at 18mpg = £0.24/mile; electric charge
equivalent = £0.06/mile; diesel is relatively expensive in the UK, so figures may vary for other member states.

Options to achieve 80g/km CO2 by 2020
Centre for Automotive Industry Research & ESRC BRASS Centre, Cardiff University, Cardiff, Wales, UK Page 52
Although the competitive environment for BEVs will change over the next ten years or so, the nature of the competition will not be fundamentally different. Electric powertrain has a number of inherent environmental advantages over any of the proposed alternatives. These will become an increasingly important factor over the next few years. Table 3.3 provides a comparison of primary energy efficiencies for the liquid fuel option and the electric powertrain option based on calculations by Gary Kendall, a former oil industry engineer, now environmental expert and author. At the 2008 International Transport Forum in Leipzig, Kendall pointed out that over time liquid fuels will become higher in carbon content due to increasing use of CTL, tar sands, etc.; while electricity will become lower in carbon as a result of the growth in renewable power. Kendall argues that we should reduce our dependence on liquid fuels (Kendall 2008). Table 3.3: Relative energy efficiency liquid versus electron pathways
Primary energy efficiencies
Liquid pathway (ICEV)
Electron Pathway
(BEV)
Plant-to-tank
Plant efficiency
Transmission & distribution
83%
35-42%
92%
Tank-to-wheels 18-23% 65%
Plant-to-wheels (life-cycle)
15-19% 21-25%
(Source: Kendall 2008: 86)
These simple facts will increasingly serve to support the EV option in favour of IC, as the need to reduce carbon from our economies becomes a more pressing policy priority. However, the challenge is how to introduce EVs to the public and also how fast. A key consideration here is that of replacement rates. In a market that has say 20 million cars in circulation, and new car sales of two million, the theoretical replacement time to renew the entire fleet is ten years assuming no net growth in the stock of cars in circulation. In fact, in the mature markets of the EU there has been (up to the mid-2008 crisis) some net growth in the overall stock of cars, such that even more years are required to transform the entire stock. In the current economic climate, and without scrapping incentives, the real rate of demand is likely to be substantially lower than recent historical performance – meaning that all other things being equal it will require many more years to transform the stock of cars in circulation.
A 2009 report by McKinsey, though assessing a range of carbon reduction options for the world fleet, also ultimately favours the EV scenario (McKinsey 2009). The McKinsey researchers argue that although carbon emissions from IC can be significantly reduced, ultimately the scope here is limited. Only EVs give the option – provided a zero carbon generating mix is developed – of ultimately carbon-free transport. In their ‘hybrid-and-electric’ scenario, they achieve a 49 per cent

Options to achieve 80g/km CO2 by 2020
Centre for Automotive Industry Research & ESRC BRASS Centre, Cardiff University, Cardiff, Wales, UK Page 53
reduction in CO2 emissions, compared to their baseline scenario and a 22 per cent reduction compared with 2006 global emission levels. This scenario assumes a mix of powertrain involving for 2020: 75 per cent IC, 18 per cent HEV, 6 per cent PHEV and 2 per cent BEV. By 2030 the relative proportions could change, for example to 40 per cent IC, 28 per cent HEV, 24 per cent PHEV and 8 per cent BEV. This reflects a global market mix and is based on the McKinsey forecast amounts to new vehicle sales in 2030 of 36 million IC vehicles, 25 million hybrid vehicles, 22 million plug-in hybrids, and 7 million BEVs (McKinsey 2009: 7). They further argue that given the right push into low or zero carbon power generation, electrification of the whole vehicle parc might make sense as early as 2017, from a well-to-wheel perspective. Moving the whole of the global vehicle fleet to electric would amount to an 81 per cent reduction in well-to-wheel carbon emissions, compared to their baseline scenario by 2030.
In terms of cost, the McKinsey study calculates that hybrid technology, combined with additional vehicle optimisation measures, such as weight reduction, could improve fuel efficiency by around 44 per cent compared with today’s global average IC engine vehicle, at an incremental cost of almost €4,000. On an EU average vehicle, this figure is likely to be lower, as the vehicle is already lighter to start with. By contrast, a plug-in hybrid would cost an additional €16,126 based on current costs. But note the Japanese figures for cost reductions in batteries over the period outlined above. Also, these vehicles would bring fuel efficiency improvements of 65 per cent to 80 per cent depending on generating mix. Similarly, for BEVs, McKinsey’s study calculates a potential fuel efficiency improvement based on global averages, of 70-85 per cent. They assume cost reductions for batteries of 5-8 per cent a year until 2030. Based on this, incremental vehicle costs would decline from €36,000 today to €5,800 by 2030 for a range of 160km; these figures are slightly higher for less range than the Japanese figures.
All these figures should be seen in the context of typical cost changes in the automotive industry. An earlier McKinsey study (McKinsey: 2003) found that the car industry typically reduces costs per vehicle by around €3000 every 13 years (roughly two model generations). At the same time, they typically add around €4000 of content to vehicles. This leads to a gradual increase in vehicle costs. However, in their cost benefit picture for Europe, the overall picture for all three electric technology options turns out better than for the other regions, because of high fuel costs. Thus both HEV and PHEV provide the owner with a net benefit over the first five years of ownership compared to IC while, for the same reason, the additional cost of a BEV is lower in Europe than in North America, Japan, or China (McKinsey 2009: 20). In addition, some of the increase in content could be provided by electric powertrain as it offers a range of user benefits, including home charging, lower NVH levels, improved acceleration, lower maintenance, etc. This could partially compensate for the higher cost of the technology.

Options to achieve 80g/km CO2 by 2020
Centre for Automotive Industry Research & ESRC BRASS Centre, Cardiff University, Cardiff, Wales, UK Page 54
3.5 MEASURING CO2 FROM EVS
There are a number of different ways of measuring CO2 emissions from electric vehicles. The main problem is that using the conventional, ‘tank-to-wheel’ method used for IC vehicles, a BEV will always return zero emissions, while with a hybrid or plug-in hybrid it depends on how much one draws on stored electricity derived from the grid and how much one relies on petrol or diesel-derived electricity. One useful example is the methodology used by the EABEV (2009), although it could be considered biased. Although not very different, we favour instead the methodology suggested by Gary Kendall of SustainAbility. The key element is the introduction of kWh as a universal measure. This allows a direct comparison to be made between vehicles powered by different means, i.e. both liquid fuel and electricity. This must form the basis for the regulatory framework in future if we are to integrate EVs in a realistic way into our regulatory framework. Clearly in the context of this report we cannot elaborate too much on this aspect, save to express our support for incorporating this approach into regulation at the earliest opportunity. Suffice to provide a brief outline of how the system could be used.
3.5.1 THE KENDALL METHOD6
In order to estimate the amount of energy and the amount of carbon in a unit of fuel (mass or volume) a few key figures are needed, as follows:
1) physical density of the fuel (to convert litres into kilogrammes)
2) energy content of the fuel (normally expressed in something like Btu= British thermal units per litre or per kg)
3) energy conversion factors: how many kWh are there in a Btu (note that this has nothing to do with the fuel type)
4) carbon content of the fuel (how many grammes of carbon in 1kg of fuel)
5) to get from carbon to CO2, you multiply by the factor 44/12 (using the atomic weights of carbon and oxygen)
An initial rough calculation then provides us with the following figures:
1 kg of gasoline typically contains 13.0 kWh
6 We are indebted to Gary Kendall for his help in putting together this section.

Options to achieve 80g/km CO2 by 2020
Centre for Automotive Industry Research & ESRC BRASS Centre, Cardiff University, Cardiff, Wales, UK Page 55
1 kg of diesel typically contains 12.7 kWh
1 kg of gasoline contains roughly 868 g carbon = 3,149 gCO2
1 kg of diesel contains roughly 871 g carbon = 3,160 gCO2
These figures assume perfect combustion, i.e. every carbon atom ends up in a CO2 molecule. Nevertheless, for the sake of simplicity, this is a good enough approximation). This in turn means that:
1 kWh gasoline = 242 gCO2
1 kWh diesel = 248 gCO2
In other words, there is not a great deal of difference between petrol and diesel; a difference of 3%. For this reason, we could take the average between the two. This avoids the unnecessary complexity of having slightly different efficiency standards for diesel and gasoline. We can therefore say that:
Liquid hydrocarbon fuel (diesel or gasoline) = 245 gCO2/kWh
The point here is that we should separate the fuel, or power source from the vehicle. If instead of the blanket measure of grammes of CO2 per kilometre we therefore express energy in terms of gCO2/kWh, and express vehicle efficiency in terms of kWh/km we have a basis for comparing different power types. By combining the two measures, we get gCO2/km. But crucially, we add transparency:
(1) it allows us to compare the efficiency of PHEVs vs BEVs vs FCEVs vs ICEVs over an agreed test cycle, and
(2) it allows us to see the carbon intensity of the energy used to power the vehicle, whether it's in the form of liquid or gaseous fuel or electricity.
Kendall (2010, pers. Comm.) provides the following example: If a battery electric Ford Focus has an efficiency of ~0.15 kWh/km, and if we charge it in the UK on grid-average electricity, ~500 gCO2/kWh (at the plug, taking into account grid losses). Then the BEV Ford Focus delivers 0.15 x 500 = 75 gCO2/km. If we compare this with a "typical" gasoline Ford Focus, with an efficiency of ~0.6 kWh/km, and gasoline has a carbon content of ~245 gCO2/kWh, then the gasoline ICEV Ford Focus delivers 0.6 x 245 = 147 gCO2/km. This does not take other factors (e.g. refining losses) into account.
As for tank-to-wheel (TTW) emissions, i.e. the standard used for ICEVs, in kWh terms, the 80g/km standard would be the equivalent of 0.33 kWh/km, so the theoretical BEV Focus is well below that. Current energy consumption estimates for BEVs vary from 0.11 to 0.20 kWh/km (EEA, 2009), although CENEX (2008) assume a figure for BEVs of 0.16 kWh/km in 2010, declining to 0.13 in 2020.

Options to achieve 80g/km CO2 by 2020
Centre for Automotive Industry Research & ESRC BRASS Centre, Cardiff University, Cardiff, Wales, UK Page 56
For well-to-wheel (WTW) emissions , using the figure of 0.13 kWh/km for 2020, and on the basis that the average CO2 emissions from EU generators will be 274 g/kWh (Greenpeace 2008), we can calculate that by 2020 BEVs would have average emissions of 36 g/km of CO2. This is the figure we will use. The GM EV1 electric sports car rated at 0.23 kWh/km energy consumption, by way of comparison. It is notable that contemporary cars are not regulated to include the petroleum extraction, refining or transport stages (well-to-tank) so the efficiency measure employed by measuring the vehicle only confers an advantage to the vehicles with on-board fuel supplies.
We should note that California authorities currently use a mixture of TTW and WTW emissions, whereby the emissions for EVs are calculated to include WTW impacts. On this basis BEVs are assumed to emit an average 130 g/mile, i.e. around 80 g/km. A hydrogen ICEV is rated at 290 g/mile (179 g/km), while hydrogen EVs, such as fuel cell cars, are rated at 210 g/mile (129.6 g/km). A separate measure for EVs is also an option, but the ability to compare different vehicles in the market on a like for like basis is important for consumers, regulators, and indeed car manufacturers themselves, despite the onerous nature of changing the basis for regulation.
3.6 EVS AND ALTERNATIVE BUSINESS MODELS
3.6.1 CAR CLUBS – PART OF THE SOLUTION?
The phenomenon of car sharing schemes, or car clubs seems to have fallen below the horizon for many in the car industry, yet it has been growing steadily. The idea started in Switzerland in the 1980s, thereafter spreading to Germany, The Netherlands, Scandinavia and the UK. In the 1990s the Scottish capital, Edinburgh, caused a stir by introducing a centrally located housing scheme for non-car owners only. As part of the package, however, new residents received membership of a newly-formed local car club.
However, the world’s biggest provider of this type of service is now Massachusetts-based Zipcar. In 2007 it merged with Flexcar of Seattle. Zipcar now has around 180,000 members and some 5000 cars and also operates in Europe. In North America, it is particularly successful in the more densely populated East and West Coast cities, such as New York, Boston, Philadelphia, Washington DC, San Francisco, Portland, Seattle and Vancouver.
Zipcar has long included hybrids in its fleet of vehicles, introducing the first hybrid in its Seattle fleet in 2003. More recently it announced a pilot programme for plug-in hybrids in San Francisco in conjunction with the local authority. Apparently, moves to introduce cleaner vehicles are supported by 80 per cent of the membership, according to a Zipcar survey. San Francisco’s mayor, Gavin Newsom, has already been responsible for adding plug-in hybrids to the city’s vehicle fleet and regards the partnership with Zipcar as a means of allowing members of the public direct hands-on experience of the new technology. The company has also expanded into the commercial leasing sector, and started to run car fleets on behalf of government agencies and private sector companies with the same principles.
This highlights one of the least discussed aspects of such schemes, the ability of reducing the risk of new technology introduction. When confronted with a choice between tried and tested technology

Options to achieve 80g/km CO2 by 2020
Centre for Automotive Industry Research & ESRC BRASS Centre, Cardiff University, Cardiff, Wales, UK Page 57
and any novel technology, ordinary car buyers will usually opt for the lower risk choice of tried and tested technology. Fears about reliability, and particularly residual values on re-sale are the motivating factors. One of the reasons GM’s radical EV-1 electric sports car of the 1990s was only available on a lease basis is that with so many new technologies the risk to customers, and also to GM, would have been too high. By not selling the cars that risk is taken away. Fears of reliability and residual values are the responsibility of the vehicle owner, not its user. Car sharing schemes are therefore a perfect vehicle for the introduction of such radical new technologies, as the risk is collectivised to the car club, rather than burdening individual users. Zipcar’s move in plug-in hybrids is a perfect example and perhaps a more deliberate use of car clubs in this way should be considered by government, vehicle manufacturers and suppliers of alternative technology vehicles.
One of the first car sharing schemes was run in the Dutch capital of Amsterdam in the 1970s. This scheme, dubbed ‘Witkar’, used unique and rather novel battery electric vehicles (Nieuwenhuis et al. 1992). Although the motivation was their zero emissions nature, it also introduced members to EV technology. In the 1990s, Peugeot-Citroen proposed the TULIP (transport urbain, libre, individual et publique) concept along similar lines. More recent is the ‘Move About’ concept in Norway (www.moveabout.no). This is a car sharing scheme, or car club, linked with Th!nk and designed to use Th!nk battery-electric vehicles to deliver an urban mobility package. The principle of the scheme is that it has to be clean in terms of energy supply. In conjunction with public and private sector partners Move About will provide charging points at key locations and aims to be ‘affordable and available’ to the largest number of users with a minimum of hassle. The charge will be NKR100 (around €10) per hour of use. The smart card used for the system can also be used to access public bicycles that are part of the bike share system.
The current recessionary climate is all about risk reduction and risk avoidance both for businesses and for private individuals. Yet at the same time, the car industry is expected to introduce potentially risky radical new low carbon technologies. This should provide a golden opportunity for the car club movement, but also for car firms seeking to introduce radically new technologies. A partnership between car companies and organisations such as Zipcar thus makes perfect sense in the current risk-averse economic climate.
However, the main point is that car sharing schemes, or car clubs could be used as a reduced-risk means to introduce new, low carbon vehicle technologies, in a manner once described by Dutch academics as ‘Strategic Niche Management’ (Hoogma et al. 2002). Partnerships involving car clubs, the car industry, local authorities and electricity utilities are the best way to deliver this. To show the way more conventional firms can benefit from this line of thinking, daily rental firm Europcar recently teamed up with Renault to commit to offering Renault-Nissan’s soon to be launched range of four BEVs for daily rental from its fleet. A variation on this is Gogo, recently launched in London as a daily rental scheme purely for EVs. This caters to people from the London suburbs who are occasional travellers into the city and who want to avoid the Congestion Charge. They can hire an Aixam-Mega e-City electric quadricycle to drive into London avoiding the Charge (Mega 2009). As the car club movement grows, established players in the daily rental sector will increasingly take an interest and car companies keen to enter the EV field could well see this model as an attractive alternative to outright sales to private customers. In fact, Europcar reported recently (Europcar

Options to achieve 80g/km CO2 by 2020
Centre for Automotive Industry Research & ESRC BRASS Centre, Cardiff University, Cardiff, Wales, UK Page 58
2009) that in response to the recession a significant number of drivers in the UK have shifted at least some of their motoring to daily rental cars. The survey indicated that 85 per cent of responded had changed their driving behaviour to save money, while 73 per cent reported they had considered hiring a car to save wear and tear and maintenance costs on their own car. In addition, 42 per cent already use hire cars for weekend breaks to save their own car. Having unpredictable costs such as roadside assistance, repair and maintenance covered was part of the motivation. This type of risk-averse behaviour bodes well for the car sharing model.
3.6.2 BETTER PLACE
Project Better Place (PBP – though now known simply as Better Place) was established in 2007 by Shai Agassi, in California, after he left the business software company SAP (http://www.betterplace.com/). Remarkably, by 2008 PBP managed to raise US$200 million in venture funding (Williams 2008) by putting together a concept that combined Electric Recharge Grids (ERGs) made up of cars, batteries, charging points, battery exchange stations and renewable energy points. In setting up PBP a new intermediary was created that, by pushing forward on the infrastructure, would be able to choreograph the multiple entities involved in creating an electric vehicle future. Better Place essentially operates at the level of government, national or sub-national, because the political commitment to the scheme is vital to achieve the co-ordinated deployment of the infrastructure. Along with some key intellectual property rights, the important part of PBP is the innovation in business model terms, and especially the idea that consumers would not have to purchase the expensive battery but could pay on a per-mile basis including battery swaps as and when required (Becker 2009). In this regard, PBP could also be a variation on the car-sharing approach to mobility (Orsato 2009) associated with companies like Zipcar (Keegan 2009). Importantly, according to Shai Agassi this also means that if the lifetime cost of ownership is considered, then the purchase plus running costs of the electric vehicles will actually be lower than those of a traditional vehicle because of the high fuel costs for internal combustion engines.
Over the period 2008 and 2009 PBP announced a series of projects around the world including Israel (Lampinen 2008a; 2008b), Denmark, California (Proctor 2008a), Hawaii (Proctor 2008b), Japan (Proctor 2008c), Australia (Proctor 2008d), and Canada (Proctor 2009). In general terms the approach has been to raise funding, define a partner for energy supply with bulk purchasing to drive down costs, define a suitable area for the infrastructure, partner with a vehicle manufacturer (Renault-Nissan) but keep the design approach embedded in open standards for recharging points and battery swaps, and then develop a pricing structure for consumers. According to Williams (2008, quoting from an unreferenced Deutsche Bank report) customers will not be asked to pay US$10 000 for a battery that at best will last 100 000 miles. Rather, they will be offered long lease contracts at say 18 000 miles a year at a cost of US$550 (£225) per month – very similar to prevailing leasing rates but with much lower per mile costs with electric compared with petrol.
Who owns the customer is an interesting question in the PBP model, as it appears to have the potential to relegate the status of the vehicle manufacturers. Indeed, PBP have stated that given a sufficiently long contract (say six years) with a customer they can afford to provide the vehicle for nothing. Moreover PBP exhibits a blurring of the boundaries between the public and private sectors in the realm of personal mobility as it requires the co-ordinated efforts of both to achieve the
Options to achieve 80g/km CO2 by 2020
Centre for Automotive Industry Research & ESRC BRASS Centre, Cardiff University, Cardiff, Wales, UK Page 59
transition to electric vehicles. All-in-all PBP is a remarkable demonstration of the power of an innovative business model to change the terms of competition and make possible and practical technologies that were thought to be unviable. Of course, many of the initial deployment locations are, in one way or another, conducive to electric vehicles, but the rapid transition to high volume is the key to cost reduction that makes the entire concept viable – including of course the possibility of selling electricity back to the grid (so-called Vehicle to Grid systems).
3.7 LEGISLATIVE AND POLICY FRAMEWORK FOR SCENARIO 2
Currently, there is no legal measure which provides for the standardisation of specific technical requirements of hybrid and EVs. These vehicles are regulated concurrently with traditional IC engine vehicles under Directive 2007/46/EC. This Directive provides the framework for the administrative provisions and technical requirements for approval of all new vehicles and the systems, components and separate technical units intended for those vehicles, with a view to facilitating their registration, sale and entry into service within the EU. It is under this Directive that more specific technical requirements concerning the construction and functioning of vehicles are established through regulatory acts including not only those adopted directly by the EC but also the UNECE Regulations to which the EC has acceded.
At present, the European body of legislation which regulates the automotive industry is going through a period of consolidation and change which takes into account both the importance of clear, consistent and up-to-date requirements as well as the objective of reducing greenhouse gas emissions by at least 20 per cent by 20207. As a result, it is a convenient time to address weaknesses in the regulatory framework and bolster measures to support a more ambitious reduction in CO2 emissions from passenger vehicles.
Up-take of electric and hybrid cars in Europe has been comparatively slow for a number of reasons (see above). What is clear, is that existing patterns of consumer purchasing of cars, including commercial and corporate leasing must be encouraged to change in order to encourage lower CO2 emission cars. Whilst it is vital that the single market is protected and regulatory measures do not unduly lead to a competitive advantage for some manufacturers over others, this does not prevent the European Commission, through legislative and policy instruments from seeking to shape the future sustainability and environmental performance of the automotive industry through measures which steer consumer vehicle choice rather than being led by consumer demand.
In order to drive changes in vehicle choices and incentivise consumers to opt for hybrid type or BEVs - and consequently alter the current market segmentation of passenger vehicles in particular, it is necessary to consider the existing deficiencies in the regulatory system and possible solutions.
7 Council Decision 94/69/EC OJ L 33, 7.2.1994, p. 11.
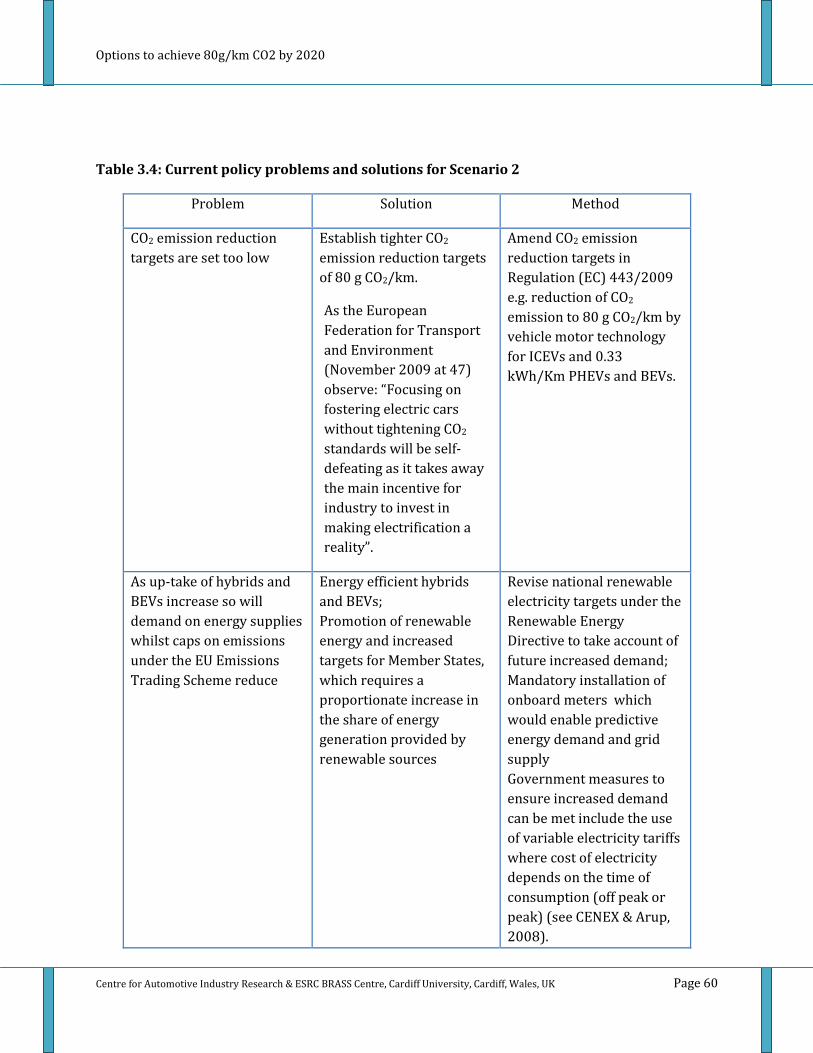
Options to achieve 80g/km CO2 by 2020
Centre for Automotive Industry Research & ESRC BRASS Centre, Cardiff University, Cardiff, Wales, UK Page 60
Table 3.4: Current policy problems and solutions for Scenario 2
Problem Solution Method
CO2 emission reduction targets are set too low
Establish tighter CO2 emission reduction targets of 80 g CO2/km.
As the European Federation for Transport and Environment (November 2009 at 47) observe: “Focusing on fostering electric cars without tightening CO2 standards will be self-defeating as it takes away the main incentive for industry to invest in making electrification a reality”.
Amend CO2 emission reduction targets in Regulation (EC) 443/2009 e.g. reduction of CO2 emission to 80 g CO2/km by vehicle motor technology for ICEVs and 0.33 kWh/Km PHEVs and BEVs.
As up-take of hybrids and BEVs increase so will demand on energy supplies whilst caps on emissions under the EU Emissions Trading Scheme reduce
Energy efficient hybrids and BEVs; Promotion of renewable energy and increased targets for Member States, which requires a proportionate increase in the share of energy generation provided by renewable sources
Revise national renewable electricity targets under the Renewable Energy Directive to take account of future increased demand; Mandatory installation of onboard meters which would enable predictive energy demand and grid supply Government measures to ensure increased demand can be met include the use of variable electricity tariffs where cost of electricity depends on the time of consumption (off peak or peak) (see CENEX & Arup, 2008).

Options to achieve 80g/km CO2 by 2020
Centre for Automotive Industry Research & ESRC BRASS Centre, Cardiff University, Cardiff, Wales, UK Page 61
Limited charging facilities available in Member States
Member States must ensure that a good network of charging facilities is put in place across their geographic area.
EU requirements should be introduced for Member States to inspect and ensure that a reasonable network if charging facilities is established.
Supercredits (under Reg 443/2009) discourage manufacturers from investing in lower CO2 technology ICEVs.
Supercredits for cars with emissions of less than 50g CO2/km should be abolished.
Remove Article 5 from Regulation 443/2009
3.7.1 SUPPORTING MEASURES
Diagram 3.7 illustrates the supporting measures that can encourage greater adoption of electric cars.
Diagram 3.7: Supporting Measures
Underlying instruments which need to be strengthened to support sustained and greater penetration of hybrid type and electric vehicles in the European market include:
Proposed new Directive. Member States must:
- Identify areas of
congestion, heavy volumes of traffic & characteristics
of area. - Ensure that a management
plan is adopted to alleviate high volumes of traffic through the creation of zero
emission zones. - Encourage the
establishment of car clubs
and take the measures they consider necessary to
achieve this.
Options to achieve 80g/km CO2 by 2020
Centre for Automotive Industry Research & ESRC BRASS Centre, Cardiff University, Cardiff, Wales, UK Page 62
• Increased support for R&D into technical innovations and the development of new battery
types with less environmental impact during production, use and at disposal
Support for Research and Development in the areas of technical innovation and the development of new batteries must be provided by the EU (Dings 2009b: 40). With any financial support provided to car manufacturers there must be a set of stringent conditions and monitoring put in place which ensures that these funds are being used to achieve advances in technologies which reduce CO2 emission.
• Vehicle labelling(for discussion see Chapter 4)
• Vehicle advertising as a means of consumer education (for discussion see Chapter 4)
3.8 SUMMARY
It has been suggested that a complete and radical switch to BEVs would be possible (Helweg-Larsen and Bull, 2007). In their Zero Carbon Britain, Helweg-Larsen and Bull paint a scenario for the UK (which has close to an EU average generating mix) whereby there would be a complete switch to renewable electricity generation. This would be combined on the transport side with a complete switch to BEV technology. It is clear that such a scenario is possible, at least from a technology point of view. Their scenario aims for a 30% BEV penetration by 2017 – i.e. after 10 years – with 100% by 2025 (ibid, 61). In addition they assumed a significant modal shift away from cars to – increasingly electric – public transport, and human power (walking and cycling). They also argued that much would be gained from the greater efficiency of EVs compared with IC vehicles. This scenario is not now as unattainable as it seemed when published in 2007. As we have outlined, a large number of existing vehicle manufacturers are developing EVs of various types for launch within the next two or three years, others are already available today. The EV appears to have greater momentum behind it than it has had for 100 years. Our EV-rich scenario 2 is set out below.
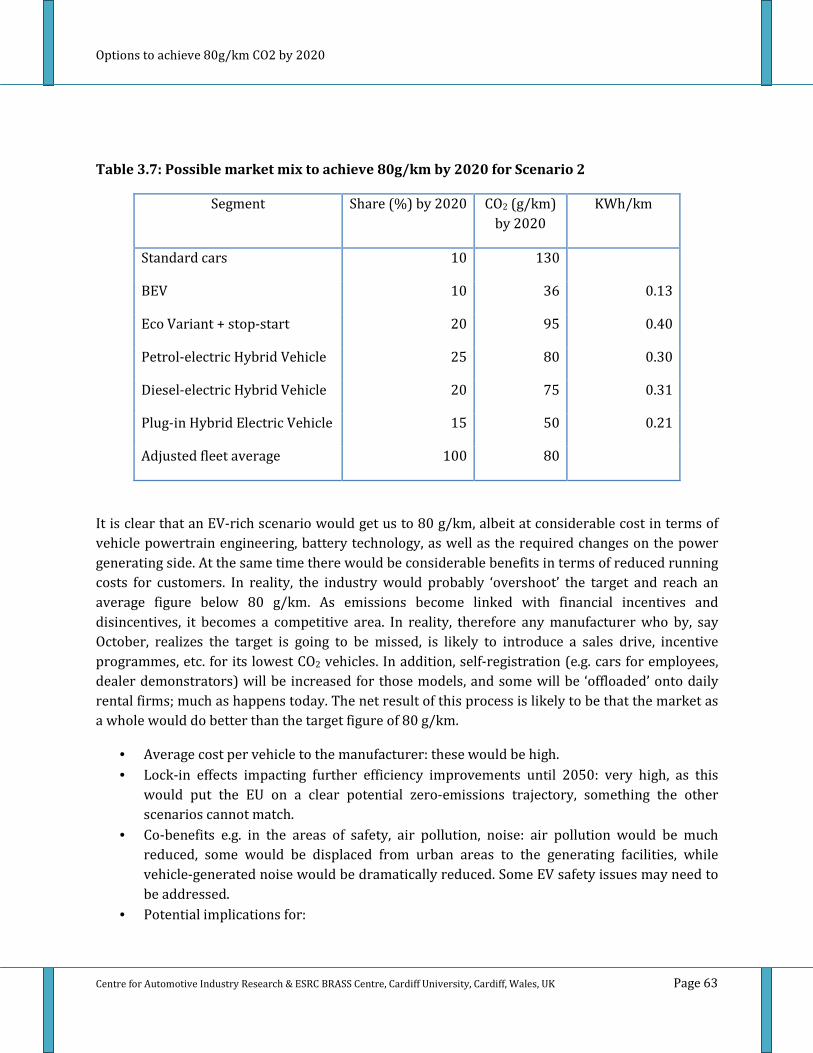
Options to achieve 80g/km CO2 by 2020
Centre for Automotive Industry Research & ESRC BRASS Centre, Cardiff University, Cardiff, Wales, UK Page 63
Table 3.7: Possible market mix to achieve 80g/km by 2020 for Scenario 2
Segment Share (%) by 2020 CO2 (g/km) by 2020
KWh/km
Standard cars 10 130
BEV 10 36 0.13
Eco Variant + stop-start 20 95 0.40
Petrol-electric Hybrid Vehicle 25 80 0.30
Diesel-electric Hybrid Vehicle 20 75 0.31
Plug-in Hybrid Electric Vehicle 15 50 0.21
Adjusted fleet average 100 80
It is clear that an EV-rich scenario would get us to 80 g/km, albeit at considerable cost in terms of vehicle powertrain engineering, battery technology, as well as the required changes on the power generating side. At the same time there would be considerable benefits in terms of reduced running costs for customers. In reality, the industry would probably ‘overshoot’ the target and reach an average figure below 80 g/km. As emissions become linked with financial incentives and disincentives, it becomes a competitive area. In reality, therefore any manufacturer who by, say October, realizes the target is going to be missed, is likely to introduce a sales drive, incentive programmes, etc. for its lowest CO2 vehicles. In addition, self-registration (e.g. cars for employees, dealer demonstrators) will be increased for those models, and some will be ‘offloaded’ onto daily rental firms; much as happens today. The net result of this process is likely to be that the market as a whole would do better than the target figure of 80 g/km.
• Average cost per vehicle to the manufacturer: these would be high.
• Lock-in effects impacting further efficiency improvements until 2050: very high, as this would put the EU on a clear potential zero-emissions trajectory, something the other scenarios cannot match.
• Co-benefits e.g. in the areas of safety, air pollution, noise: air pollution would be much reduced, some would be displaced from urban areas to the generating facilities, while vehicle-generated noise would be dramatically reduced. Some EV safety issues may need to be addressed.
• Potential implications for:

Options to achieve 80g/km CO2 by 2020
Centre for Automotive Industry Research & ESRC BRASS Centre, Cardiff University, Cardiff, Wales, UK Page 64
o vehicle manufacturers: high cost, steep learning curve in the adoption of new powertrain technologies; increased dependence on specialist suppliers
o consumers: increased cost of vehicle batteries (could be reduced through leasing, car sharing, etc.); somewhat offset by lower ‘fuel’ costs and lower maintenance costs
o Regulators: would have a considerable responsibility in incentivising for EVs, adapting regulatory regimes to accommodate EVs, incentivise power generators toward renewable generating solutions.

Options to achieve 80g/km CO2 by 2020
Centre for Automotive Industry Research & ESRC BRASS Centre, Cardiff University, Cardiff, Wales, UK Page 65
CHAPTER 4 – SCENARIO 3: VEHICLE PERFORMANCE REDUCTION
4.1 CONTEXT
This Scenario considers the question of vehicle performance, and reductions thereof in order to achieve reduced CO2 emissions to the point of 80 g/km. The analysis is framed for internal combustion engines only, although the principles can be carried over to other forms of motive power. Hence this Scenario, as with the others, takes a ceteris paribus approach that assumes all other issues are held unchanged, and then defines a pathway to achieve 80 g/km. This means, for example, the assumption that the contemporary segment mix is retained (and by implication that the segments are defined by vehicle dimensions and perhaps body style rather than any weight categorisation). Changes to contemporary segmentation are considered in Scenario 4.
4.2 VEHICLE PERFORMANCE PARAMETERS: THE BIGGER PICTURE
Vehicle performance can be defined in a number of different ways. However, for the purposes of this chapter we will limit it to a number of key parameters, as follows: power output, acceleration from 0-100 km/h, weight, number of seats – as a simple measure of functionality and finally, CO2 emissions. For a sample of current cars, these figures are presented in Table 4.1 below.

Options to achieve 80g/km CO2 by 2020
Centre for Automotive Industry Research & ESRC BRASS Centre, Cardiff University, Cardiff, Wales, UK Page 66
Table 4.1: Performance figures for selected car models
Make Model Power (kW)
0-100 (secs.)
Top speed (km/h)
Weight (kg)
Seats CO2 g/km
Th!nk City 35 0-80: 16
100 1113 2 ‘0’
Smart ForTwo 1.0 Pulse
52 13.3 145 750 2 103
Lotus 1.8 S 100 6.1 205 860 2 199
BMW 318d SE 105 9.1 210 1435 4/5 123
VW Polo 1.2 40 17.5 152 989 4/5 138
VW Golf 2.0 TDI 103 9.9 195 1227 4/5 129
Porsche 911 3.6 Carrera
239 5.0 285 1470 2+2 225
Land Rover
Range Rover Sport TDV8
200 9.2 205 2575 5 294
(Source: Th!nk; Stolwijk 2007; Autocar 2009)
Only two dimensions of performance are explicitly covered: acceleration and top speed. These dimensions are discussed in relation to the vehicle attributes of (engine) power and weight. Clearly there are multiple other performance characteristics that could be considered as part of the overall package that defines a vehicle, including items such as braking distance relative to speed, road-holding, noise generation, NVH, stability and others. Some, if not all, of these other characteristics may change under changes introduced to achieve a de-powered vehicle. For example, there has been research on ‘aero-stable’ light-weight vehicles because such low-mass vehicles may be vulnerable to side winds that can blow them off track, particularly when designed to achieve a low coefficient of drag (Mills 2002). Moreover, while the focus here is simply on reduced carbon emissions, it is clear that de-powering of vehicles allied with weight reduction can have major secondary benefits in a great many other respects, not least in terms of reduced deaths and injuries arising from crashed vehicles or indeed deaths arising from conventional atmospheric pollution in urban areas (Schewel 2008).
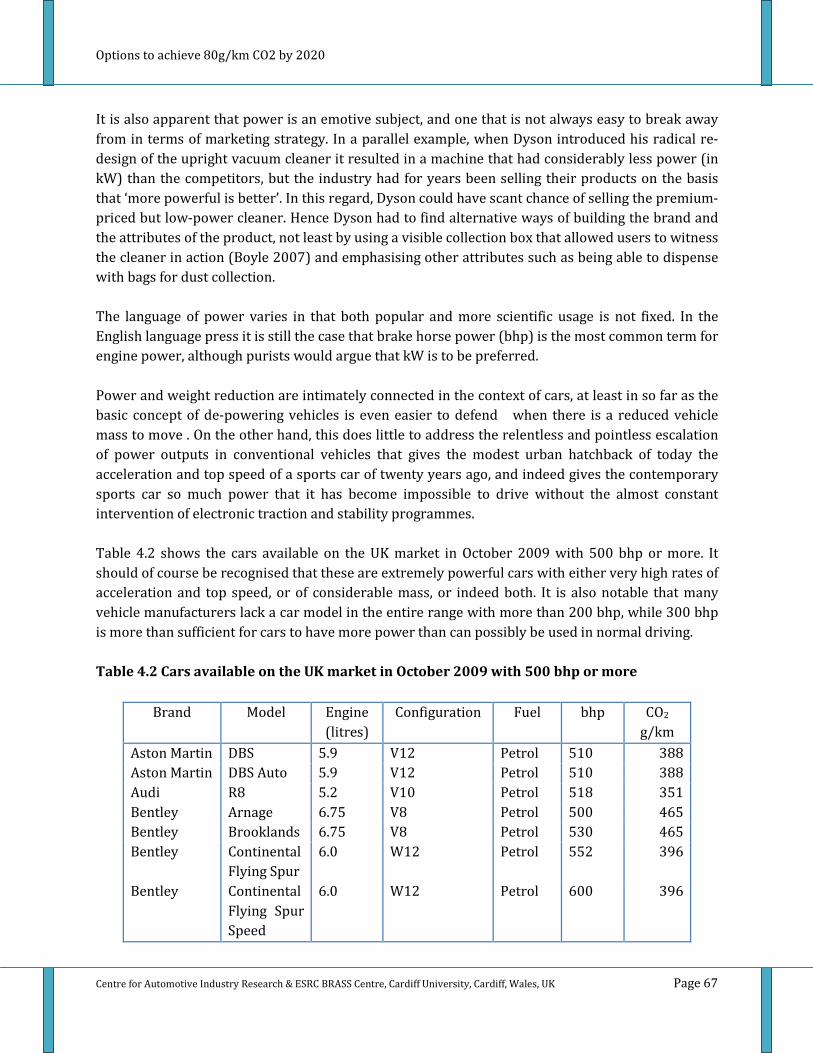
Options to achieve 80g/km CO2 by 2020
Centre for Automotive Industry Research & ESRC BRASS Centre, Cardiff University, Cardiff, Wales, UK Page 67
It is also apparent that power is an emotive subject, and one that is not always easy to break away from in terms of marketing strategy. In a parallel example, when Dyson introduced his radical re-design of the upright vacuum cleaner it resulted in a machine that had considerably less power (in kW) than the competitors, but the industry had for years been selling their products on the basis that ‘more powerful is better’. In this regard, Dyson could have scant chance of selling the premium-priced but low-power cleaner. Hence Dyson had to find alternative ways of building the brand and the attributes of the product, not least by using a visible collection box that allowed users to witness the cleaner in action (Boyle 2007) and emphasising other attributes such as being able to dispense with bags for dust collection. The language of power varies in that both popular and more scientific usage is not fixed. In the English language press it is still the case that brake horse power (bhp) is the most common term for engine power, although purists would argue that kW is to be preferred. Power and weight reduction are intimately connected in the context of cars, at least in so far as the basic concept of de-powering vehicles is even easier to defend when there is a reduced vehicle mass to move . On the other hand, this does little to address the relentless and pointless escalation of power outputs in conventional vehicles that gives the modest urban hatchback of today the acceleration and top speed of a sports car of twenty years ago, and indeed gives the contemporary sports car so much power that it has become impossible to drive without the almost constant intervention of electronic traction and stability programmes. Table 4.2 shows the cars available on the UK market in October 2009 with 500 bhp or more. It should of course be recognised that these are extremely powerful cars with either very high rates of acceleration and top speed, or of considerable mass, or indeed both. It is also notable that many vehicle manufacturers lack a car model in the entire range with more than 200 bhp, while 300 bhp is more than sufficient for cars to have more power than can possibly be used in normal driving. Table 4.2 Cars available on the UK market in October 2009 with 500 bhp or more
Brand Model Engine (litres)
Configuration Fuel bhp CO2 g/km
Aston Martin DBS 5.9 V12 Petrol 510 388 Aston Martin DBS Auto 5.9 V12 Petrol 510 388 Audi R8 5.2 V10 Petrol 518 351 Bentley Arnage 6.75 V8 Petrol 500 465 Bentley Brooklands 6.75 V8 Petrol 530 465 Bentley Continental
Flying Spur 6.0 W12 Petrol 552 396
Bentley Continental Flying Spur Speed
6.0 W12 Petrol 600 396

Options to achieve 80g/km CO2 by 2020
Centre for Automotive Industry Research & ESRC BRASS Centre, Cardiff University, Cardiff, Wales, UK Page 68
Bentley Continental GT
6.0 W12 Petrol 552 396
Bentley Continental GT Speed
6.0 W12 Petrol 600 396
Bentley Continental GT Supersports
6.0 W12 Petrol 621 388
Bentley Continental GTC
6.0 W12 Petrol 552 396
Bentley Continental GTC Speed
6.0 W12 Petrol 602 396
BMW M5 saloon 5.0 V10 Petrol 500 357 BMW M5 estate 5.0 V10 Petrol 500 348 BMW M6 5.0 V10 Petrol 500 342 BMW M6 coupe 5.0 V10 Petrol 500 352 Cadillac CTS 6.2 V8 Petrol 596 365 Corvette C6 7.0 V8 Petrol 505 350 Ferrari 430
Scuderia 4.3 V8 Petrol 503 360
Ferrari 599 GTB 6.0 V12 Petrol 611 490 Ferrari 612
Scaglietti 6.0 V12 Petrol 532 475
Jaguar XKR 5.0 V8 Petrol 503 292 Jaguar XKR
convertible 5.0 V8 Petrol 503 292
Lamborghini Gallardo Spyder
5.2 V10 Petrol 552 351
Lamborghini Gallardo 5.2 V10 Petrol 542 315 Lamborghini Murcielago 6.5 V12 Petrol 663 480 Lamborghini Murcielago
Cabriolet 6.5 V12 Petrol 631 495
Maybach 57 S 6.0 V12 Petrol 612 390 Maybach 62 6.0 V12 Petrol 612 383 Mercedes E63 AMG 6.3 V8 Petrol 514 345 Mercedes CLS E63
AMG 6.3 V8 Petrol 507 345
Mercedes S600L 5.5 V12 Petrol 510 340 Mercedes S63 AMG 6.3 V8 Petrol 518 344 Mercedes S65 AMG 6.5 V8 Petrol 604 346 Mercedes ML63 AMG 6.3 V8 Petrol 507 392 Mercedes SL63 AMG 6.3 V8 Petrol 518 330

Options to achieve 80g/km CO2 by 2020
Centre for Automotive Industry Research & ESRC BRASS Centre, Cardiff University, Cardiff, Wales, UK Page 69
Mercedes SL65 AMG 6.5 V8 Petrol 603 362 Mercedes SL65 AMG
Black 6.6 V8 Petrol 663 346
Porsche 911 GT2 3.6 Flat 6 Petrol 530 298
(Source: derived from Autocar, 21st October and 30th December 2009)
The above list excludes some of the special versions created by tuning companies such as Alpina, as well as very rare model such as the Bugatti Veyron. It is evident that few of the cars with 500 bhp or more can achieve less than 300 g/km CO2 emissions; most are more than four times the 80 g/km target figure. Kågeson (2005) illustrates that over time the specific power output per volume has increased in the European car industry, and the size of engine has increased also albeit by a lesser extent. “…it is evident that average power increased by 9 kW also in the 1990s and by an additional 7 kW in
the three years between 2000 and 2003. The total increase since 1990 amounts to 30 per cent.
Cylinder volume rose somewhat less (+ 10%), which means more power is now produced per unit of
engine volume.” (p9)
4.3 POWER AND WEIGHT: TECHNOLOGICAL SOLUTIONS
Traditionally, the focus of R&D to improve emissions performance, notably in terms of CO2 emissions, has been on improved powertrain rather than on weight just as regulation has tended to focus on g/km CO2 emissions in use rather than energy consumed per power delivered (Cousins, Bueno and Coronado 2007) for the purpose of moving a vehicle. In reality, as Cousins, Bueno and Coronado (2007) argue, the critical parameter has long been one of achieving the profitable production of low-powered vehicles when the prevailing body technology has been premised on all-steel architectures. Seen in historical perspective over the long run, it has often been the case that while concerns to improve fuel efficiency (and hence CO2 emissions) have been periodically important, those concerns have often been over-ridden by other policy issues regarding industrial development, balance of trade, competitiveness, and related matters. As a simple example:
Options to achieve 80g/km CO2 by 2020
Centre for Automotive Industry Research & ESRC BRASS Centre, Cardiff University, Cardiff, Wales, UK Page 70
The line of argument pursued by Cousins, Bueno and Coronado (2007) is worth elaborating further because it results in some provocative conclusions regarding the form of regulation adopted. Cousins, Bueno and Coronado (2007) show some key trends. First they show (for the UK, but there is a broad comparability with other EU nations) that in the period 1995 to 2002 there had been a steady increase in the average power provided by new cars, in the average mass of such new cars, and in engine capacity. Second, they show for the same time period that average new car CO2 emissions had fallen, but below the rate necessary at that time to meet the voluntary targets on CO2 emissions. Broadly, engine power had gone up in order to remain able to accelerate the increased mass of the vehicles. Certainly there had been improvements in the specific output of vehicles, but much of this had been used to accelerate larger mass rather than improve fuel economy. Third, the authors show that this trend to improved specific output of vehicles has been going on for a very long time, since the 1920s. The conclusion of this data analysis is that: “Thus technical improvements have enabled much more power to be obtained from the same size of
engine with small engines more than doubling in power; mid-sized engines 1600-2000cc going from
55 bhp to 130 bhp in 60 years; with similar gains for larger engine categories too.” (p1025)
Next comes, the important conceptual leap. The authors argue that the real world CO2 emissions from vehicles is a function of the installed base of power in vehicles (which has increased significantly over time) and the time budget available to use those vehicles. The real policy objective is to reduce the CO2 emissions over a period of time (say a year), so the distance measurement (g/km) is not really a relevant consideration or reflection of the actual CO2 emissions in use. More powerful vehicles can travel faster (with higher CO2 emissions) and accelerate more quickly (than is captured in the test cycle, and also with higher CO2 emissions). Hence the problem is that over time, with more powerful engines, the effective installed base of engines in cars has increased substantially (more cars, and cars with more powerful / bigger engines), with the same amount of time more or less dedicated to be available to travel. Carbon emissions are thus the product of the typical one hour per day that time budgets constrain the use of cars to, along with the typical duty cycle that the engines are exposed to, multiplied up by the installed capacity.
‘Immediately after WWII the highly graduated horsepower tax (annual vehicle license)
was replaced by a single annual tax amount irrespective of the size of the vehicle.
Specifically this was intended to encourage the design and production of larger
engined, more powerful vehicles, that would generate additional exports to countries
such as USA and Australia. A second intent was to increase the production volumes of
individual models by reducing the number of model types offered. Models had been
offered for each tax band and removing these bands would therefore increase model
volumes and with it improve the profitability of the industry.’ (Cousins, Bueno and Coronado, 2007: 1023)

Options to achieve 80g/km CO2 by 2020
Centre for Automotive Industry Research & ESRC BRASS Centre, Cardiff University, Cardiff, Wales, UK Page 71
Interestingly, the authors show that over time the cost of increased power per engine has declined considerably, but also that there is a strong relationship between engine power and vehicle price. This hints at another issue, that vehicle price is also related to mass…a heavier car requires a larger / more powerful engine but commands a higher retail price. The authors suggest an approximate level of £150 / bhp adjusted for inflation over time; anecdotal evidence has previously suggested a similar issue with weight, with the average car commanding about £12 / ton. In a related study, Schipper (2007) working for the World Resources Institute argues that: “As long as the upward spiral of car weight and power offsets much of the impact of more efficient
technology on fuel efficiency, fuel economy will not improve much in the future.” (p1)
The analysis from Schipper builds on that advanced above in that the study seeks to calculate actual CO2 emissions from a combination of test cycle data and use patterns. Hence the analysis shows that real CO2 emissions in the major industrial countries from cars grew over the long run (1970 to 2005) because in most cases improvements in actual per-vehicle efficiency tended to be swamped by more vehicles (including second vehicles per household), longer driving distances, and congestion. Schipper also notes that: “That a significant part of the improvements in Japan are related to the growing share of mini-cars
(displacement under 600 CC) suggest that technology is not the only factor that can or will yield
significant and rapid energy savings and CO2 restraint in new cars.” (p1)
It is clear that over recent decades, European cars have grown both in size and weight. In fact the weight of the average car has grown from around 900 kg to around 1120 kg in the 30 years up to 2003 (Jochem et al. 2004). Similarly, the range of weights for popular EU cars rose from 680-900 kg in 1970 to 1150-1250 kg by 2002 (WBCSD 2005). This matters because a heavier car takes more energy to accelerate to a given speed than a lighter car. For this reason, the power has also had to increase, while for other, more market-driven reasons, acceleration has increased. An anomaly is that some jurisdictions, notably Germany, still retain roads without speed limits. The need to travel at high speed distorts vehicle specifications worldwide, as the benchmark German specialist cars are all optimised for these high speeds, which makes them in many respects compromised at lower speeds, where in reality they spend most of their working lives. Japanese manufacturers for example, offer a number of vehicles on their domestic market which are deemed unsuitable for exports as they are not suited to such high speeds. A global maximum speed, of – say – 150 or 160 km/h would have a dramatic effect on vehicle design, delivering cars with smaller engines, with different transmission ratios, more optimised for lower speeds, and better, more comfortable ride. In addition, weight would be reduced, as less performance would be needed from many components such as brakes and suspension. This effect is also illustrated in Fig. 4.1 which shows a comparison between a 2009 VW Golf 2.0 TDI and its 1970s equivalent, the Golf 1.6 S. Many cars of the 1960s and 1970s had a more comfortable
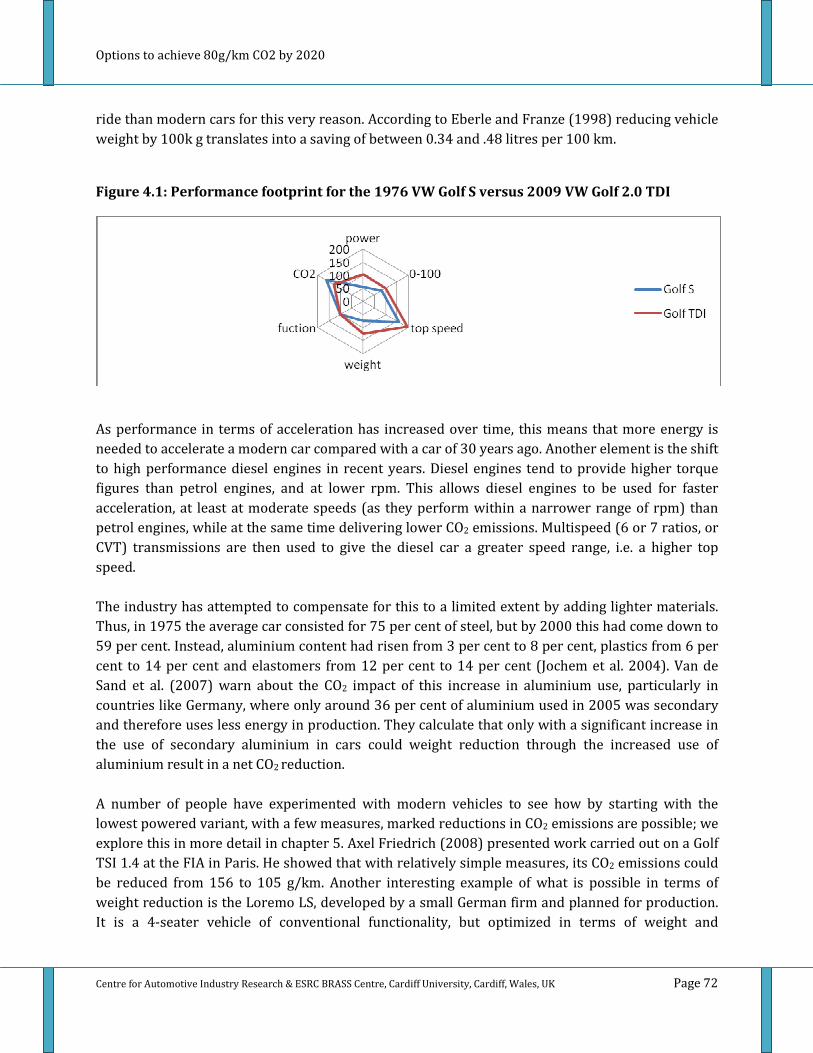
Options to achieve 80g/km CO2 by 2020
Centre for Automotive Industry Research & ESRC BRASS Centre, Cardiff University, Cardiff, Wales, UK Page 72
ride than modern cars for this very reason. According to Eberle and Franze (1998) reducing vehicle weight by 100k g translates into a saving of between 0.34 and .48 litres per 100 km.
Figure 4.1: Performance footprint for the 1976 VW Golf S versus 2009 VW Golf 2.0 TDI
As performance in terms of acceleration has increased over time, this means that more energy is needed to accelerate a modern car compared with a car of 30 years ago. Another element is the shift to high performance diesel engines in recent years. Diesel engines tend to provide higher torque figures than petrol engines, and at lower rpm. This allows diesel engines to be used for faster acceleration, at least at moderate speeds (as they perform within a narrower range of rpm) than petrol engines, while at the same time delivering lower CO2 emissions. Multispeed (6 or 7 ratios, or CVT) transmissions are then used to give the diesel car a greater speed range, i.e. a higher top speed. The industry has attempted to compensate for this to a limited extent by adding lighter materials. Thus, in 1975 the average car consisted for 75 per cent of steel, but by 2000 this had come down to 59 per cent. Instead, aluminium content had risen from 3 per cent to 8 per cent, plastics from 6 per cent to 14 per cent and elastomers from 12 per cent to 14 per cent (Jochem et al. 2004). Van de Sand et al. (2007) warn about the CO2 impact of this increase in aluminium use, particularly in countries like Germany, where only around 36 per cent of aluminium used in 2005 was secondary and therefore uses less energy in production. They calculate that only with a significant increase in the use of secondary aluminium in cars could weight reduction through the increased use of aluminium result in a net CO2 reduction. A number of people have experimented with modern vehicles to see how by starting with the lowest powered variant, with a few measures, marked reductions in CO2 emissions are possible; we explore this in more detail in chapter 5. Axel Friedrich (2008) presented work carried out on a Golf TSI 1.4 at the FIA in Paris. He showed that with relatively simple measures, its CO2 emissions could be reduced from 156 to 105 g/km. Another interesting example of what is possible in terms of weight reduction is the Loremo LS, developed by a small German firm and planned for production. It is a 4-seater vehicle of conventional functionality, but optimized in terms of weight and

Options to achieve 80g/km CO2 by 2020
Centre for Automotive Industry Research & ESRC BRASS Centre, Cardiff University, Cardiff, Wales, UK Page 73
aerodynamics as well as being pared down to the essentials. Yet, it can still operate at credible motorway speeds (see Table 4.3).
Table 4.3: Specification of the Loremo LS
Fuel consumption 1.5 l/100km CO2 (estimate based on fuel consumption) 41 g/km Vehicle weight 450 kg Engine type Diesel (EV version under development) Power output 20 ps Maximum speed 160 km/h Chassis Aluminium Body panels Polyurethane
(Source: adapted from van de Sand et al. 2007; www.loremo.com) A more powerful version is also planned, as well as an electric variant. The performance footprint for the Loremo LS, derived from limited information from the company website, which has not yet been verified by type approval testing, is shown in Fig. 4.2 below.
Figure 4.2: Performance footprint for the Loremo LS
A slightly different approach is taken by Gordon Murray Design (GMD). While the Loremo is roughly the size of a Golf, GMD’s T25 (petrol) and T27 (EV) are three-seat vehicles slightly shorter than a Smart ForTwo. The vehicle uses a tubular steel frame with plastic body panels. Here too everything is minimalist, although it offers modern comfort features. The T25/T27 is intended primarily as an urban vehicle. Both vehicles therefore abandon conventional steel monocoque technology and opt for a more modular approach which allows optimization of different sub

Options to achieve 80g/km CO2 by 2020
Centre for Automotive Industry Research & ESRC BRASS Centre, Cardiff University, Cardiff, Wales, UK Page 74
assemblies. UK start-up Axon takes a similar approach in using a lightweight structure – in this case low cost carbon fibre – with a small internal combustion engine. In the meantime, industry sources suggest that over the next few years even mainstream cars in all segments will see an improvement in CO2 terms of up to 30 per cent or 40 per cent over current levels (personal communication). This is quite a dramatic improvement and would mean in general terms that a vehicle that today emits 150 g/km would emit only about 100 g/km, while today’s 100 g/km cars – if they are included in this assessment – would go down to nearer 60-70 g/km. Provided the mix tends towards the lower end, delivering the aimed for average of 80 g/km by 2020 would therefore be perfectly feasible. Yet, if we expect to retain anything approaching the existing market mix in terms of segments, a more imaginative approach to the market may also be needed as there are still quite a few vehicles that emit well over 150 g/km. The average Land Rover Discovery, for example emits 244-270 g/km, while the lowest emitting BMW X5 slots in at 214 g/km. Even with a 30-40 per cent improvement, these would still be in the 130-180 g/km range, i.e. impressively better, though still well above the average of 130 g/km for 2015 and certainly helping prevent the market from reaching down to 80 g/km. Although the SUV concept itself can be improved significantly (see SUV box in chapter 2). Improvements in individual vehicle types could deliver significant reductions, even with a market mix that to most consumers would not look too radically different from today. Much also depends on how we define segments (see Chapter 5).
4.4 DE-POWERING AND WEIGHT REDUCTIONS TO ACHIEVE 80 G/KM.
None of the foregoing analysis says much about how to reverse these trends in order to achieve 80 g/km through reducing the top speed and acceleration of vehicles. Indeed, the main conclusion is that increased efficiency in engines has been used primarily to accommodate more car (heavier, more luxurious vehicles) and also to accommodate greater levels of performance in terms of acceleration and top speed. Without some form of external stimulus (i.e. significant real price increases in the cost of fuel; and / or overt regulation on acceleration and top speed) it is difficult to see how reduced CO2 emissions to this level can be achieved through de-powering. De-powering without weight reduction requires some consumer acceptance work, as the industry has put much emphasis on selling comfort and performance in a context where it has been difficult to make money on a basic car. However, according to Kågeson (2005): “Another way of demonstrating the trade-off is to calculate the fuel saving from restricting top speeds
and thereby engine power (and indirectly engine volume and weight). An average saving of 1.5 to 2.0
litres per 100 km for petrol-fuelled cars under town driving conditions would be feasible, if maximum
top speeds were restricted to 180 km/h (ECMT, 1995). This is equal to a reduction of around 20 per
cent at zero or negative cost.” (p23)
Kågeson does not calculate the effect of de-powering without changes in vehicle weight in terms of acceleration but this gives some notion of the impact of de-powering generally. In short, de-powering has a potential that is rather like large-scale material substitution (in the vehicle body
Options to achieve 80g/km CO2 by 2020
Centre for Automotive Industry Research & ESRC BRASS Centre, Cardiff University, Cardiff, Wales, UK Page 75
say) to initiate a virtuous weight and power reduction spiral. The lack of available data on this, compared with say weight reduction, is indicative of the unwillingness of the automotive industry to contemplate such a strategy. Yet, it is to some extent the approach followed for some of the new generation of sub-100g/km cars. One exception is Volvo, which is trying this de-powering approach of an otherwise unchanged car with the new 1.6 litre version of its flagship S80 luxury saloon. Although initial road tests have criticized its lack of performance, the true measure is going to be its success in the market, whereby one can imagine some fleet buyers receptive to the concept. Volkswagen’s fitment of a small 1.4 litre engine to the Passat is somewhat different in that it delivers relatively high performance and may be more of an indication of the direction the industry wishes to go.
4.5 TOP SPEED RESTRICTIONS
The amount of power needed to propel a vehicle along a road varies according to a range of factors, but in general terms if the road speed is doubled then the amount of power needed is more than doubled. Also in general terms, with a typical set-up in terms of engine size, gearing, etc. vehicles show a marked decline in fuel economy per distance travelled at speeds over 60 mph (120 km/h) as wind resistance, tyre resistance and other factors mount up. Speed limiting systems that can be engaged by the driver are now fitted to a growing number of cars, while interactive systems that can be triggered by the infrastructure are in an experimental stage, although legal issues surround any system that takes control of the car away from the driver. The technology now exists for both external measurement of vehicle speed via average speed cameras (or point speed cameras) and for on-board top speed control. In other words, it is technically straightforward to develop engine management system software that would limit the top speed of a car either progressively or via a simple cut-off point, or indeed via systems that feed back information to a driver such as a throttle pedal that stiffens up as speed increases beyond a set point (‘haptic throttle’). Moreover, vehicle manufacturers are bringing to market systems designed to allow so-called ‘intelligent’ adaptive cruise control with distance-sensing radar and automated speed control including emergency braking if needed. These systems are ideal for a speed-controlled road and would actually help to reinforce compliance. However, a more general move towards cars with a lower top speed is probably desirable. This could be used to enhance drivability at lower speeds while it could also lead to a virtuous cycle of weight and complexity reduction in a manner as outlined by Amory Lovins for his Hypercar concept (Weizsaecker et al. 1997). Cars that have a lower top speed can make do with smaller, lighter engines, smaller, lighter transmissions, smaller, lighter brakes, narrower, lighter wheels and tyres, simpler suspension, etc. As a result of the weight reduction from these changes, other systems can also be removed, simplified or reduced in weight, such as steering systems, door and window seals, aerodynamic aids for high speed stability, etc. In order to compensate car makers for their reduced ability to sell weight-adding ‘gadgets’ they could be induced to charge instead for technology options with genuine benefits, such as CO2 reduction or fuel saving, reduced maintenance and repair, enhanced functionality, etc. This would require a consumer re-education programme – a marketing issue.

Options to achieve 80g/km CO2 by 2020
Centre for Automotive Industry Research & ESRC BRASS Centre, Cardiff University, Cardiff, Wales, UK Page 76
4.6 ACCELERATION RESTRICTIONS
Legislation to control acceleration is much more problematic, although technically feasible. In the first place it has proven rather difficult to obtain data on the impact of differential acceleration on emissions, even though it is well established that reasonable ‘defensive’ driving with modest acceleration and gentle braking can yield ‘significant’ improvements in fuel economy. Engine downsizing and power reduction, such as in Volvo’s S80 1.6, mentioned above, are one way of implementing this. However, how this could be regulated for is difficult to define. In any case, while heavier cars may use their power to accelerate their bulk, a similar power output could be used in a lightweight sportscar for faster acceleration, with the latter even potentially returning lower CO2 emissions. Clearly, then, this is a difficult area. Ericsson (2001) showed that for a large number of real-world driving situations there were multiple variables that influenced fuel economy and exhaust emissions – including that of acceleration practices. However, the analysis also identified other factors such as gear-changing behaviour as important. A study by TNO into the effect of gear shift indicators (effectively therefore into the impact of eco-driving but without actually de-powering cars) showed that CO2 emissions were reduced by 3-11 per cent depending upon the model tested and the cycle considered (Vermeulen 2006:49). These studies are not quite the same as de-powering or restricting the rate of acceleration, but at least indicate that simply not using all the available power from an engine in normal circumstances can reduce CO2 emissions by up to 11 per cent, all other factors being equal. Legislation on curtailing top speed may have a secondary impact on the willingness of drivers to accept de-powered vehicles with lower rates of acceleration. On the other hand, such issues are also being addressed by the trend away from conventional manual transmissions, towards automated systems working according to pre-programmed protocols, rather than the driver’s whim or level of competence. A difficult task would be to define an acceptable rate of acceleration, if this was to be regulated specifically. This would be particularly problematic for two reasons. First, there are already a great many vehicles in use with considerably greater acceleration potential than would be regulated for new cars, thereby putting those new car drivers at a potential risk or under pressure from other drivers in certain situations. Put bluntly, drivers may feel they are not able to ‘keep up’ in normal driving conditions with de-powered low-acceleration vehicles under those circumstances. Second, while the installation of a defined acceleration envelope is possible in a technical sense with available engine management software and other parameters (engine size, gear ratios, etc.) it is at present not possible to enshrine a low-acceleration regime in the same manner that a speed limit regime can be defined. Measurement of rates of acceleration from outside the vehicle would be technically challenging in many circumstances, and so enforcement would be difficult to achieve. A further regulatory way forward is to combine power rating with weight or another footprint measure to arrive at limits for acceptable power to weight ratios, although this may have the effect of reducing innovation to improve such ratios unless a mechanism was included to reward ‘good’ performance in this sense. A footprint-based environmental rating system was developed at Cardiff
Options to achieve 80g/km CO2 by 2020
Centre for Automotive Industry Research & ESRC BRASS Centre, Cardiff University, Cardiff, Wales, UK Page 77
University some years ago and is used by a number of organizations to rate their own vehicle fleets, as well as being available to the public on-line (www.clifford-thames.com/ERV). In fact suggestions along these lines have also been put forward by European transport ministers (ECMT Resolution No. 91/5 on the Power and Speed of Vehicles). This could be combined with a moving target based on best practice, such as the Japanese ‘Front Runner’ system, or our own EOV (Environmentally Optimised Vehicle) regulatory model (Nieuwenhuis & Wells , 1997).

Options to achieve 80g/km CO2 by 2020
Centre for Automotive Industry Research & ESRC BRASS Centre, Cardiff University, Cardiff, Wales, UK Page 78
4.7 LEGISLATIVE AND POLICY FRAMEWORK FOR SCENARIO 3
The reduction in CO2 emission targets laid down in Regulation (EC) 443/2009 is focused on a fleet-wide average of manufacturers rather than prescribing the emission performance standards to be met by every passenger vehicle produced by a manufacturer independent of the segmentation (see Art. 1). Whilst the European Commission argue that the average new car fleet target provides flexibility to manufacturers in the way in which they set out to achieve compliance (which is most likely to involve off-setting higher CO2 emitting vehicles in their range by those with low CO2 emissions)8, this scheme is likely to lead to a greater divergence between the small, low CO2
8 Recital 10, Regulation 443/2009 states: “The legislative framework for implementing the average new car fleet
target should ensure competitively neutral, socially equitable and sustainable reduction targets which take account
Clifford-Thames/CAIR-BRASS Environmental Rating System for Vehicles (ERV)
www.clifford-thames.com/ERV
The ERV has two elements: emissions and footprint. The emissions element relates to
the emissions from the car as measured in the official test cycle. We use CO2, CO,
combined Hydrocarbons and Nitrous Oxides (HC + NOx) and particulates (PM), but,
as will be clear, the method is actually able to use more variables (such as noise
levels, levels of recycled material) should the data be available or deemed
appropriate. For each of these emissions we then calculate, for the car in question,
the relative percentage of the standard. An overall emissions performance score is
then calculated by adding the relative emissions scores using a weighting of 50% for
CO2 and 16.67% for each of CO, HC + NOx and particulates, also adding up to 50%.
This reflects the current EU and UK concerns about the role of CO2 in global warming.
However, these weightings can be changed if and when appropriate. It is this
inherent flexibility that is one of the key features of the model. To create the final
rating, the performance figure is then combined with a ‘footprint’ figure. The
footprint is determined by measuring the length (m), width (m) and weight (t) of the
car and is used as a proxy for the broader (i.e. non-engine emissions) aspects of the
environmental burden of the car. This is a very important consideration, because
even a zero emissions car has an environmental and indeed sustainability burden.
This burden includes the resource consumption required from raw materials,
transport of raw materials and processing of raw materials (with associated
environmental and social costs), paint emissions and other manufacturing impacts,
contribution to congestion and other road space requirements (parking, for
example), the degree of damage caused to people and property in an accident, etc.
Again, these data for the footprint are publicly available, and are beyond dispute or
estimation.

Options to achieve 80g/km CO2 by 2020
Centre for Automotive Industry Research & ESRC BRASS Centre, Cardiff University, Cardiff, Wales, UK Page 79
emitting vehicles and the heavier, higher CO2 emitting vehicles. In turn, this will have repercussions for the technical requirements and regulation of vehicles and road safety. Research examining the effects of vehicle weight and size on accident fatality risk has concluded that reducing vehicle weight as opposed to reducing wheelbase and track width (vehicle footprint) is the most significant factor in decreasing the number of fatalities (Department of Transportation, National Highway Traffic Safety Administration, 2006).
Experience from the US CAFE Regulations indicates that heavier vehicles subject to less stringent targets can encourage manufacturers to increase the mass of smaller vehicles to bring them outside the remit of regulatory measures. The proposal to adopt CO2 emission reduction targets for N1 category vehicles, set out under COM (2009) 593 Final, is therefore important.
Table 4.3: Current policy problems and solutions for Scenario 3
Problems Solution Method
Over-utility of vehicles Adoption of a per vehicle standard; Installation of speed limiters on passenger cars; Establish European-wide highway speed limits
Set maximum vehicle mass and power as part of type approval requirements; Require all passenger vehicles and light commercial vehicles to be equipped with speed limiters. At present, all commercial vehicles from 7.5 tonnes onwards have speed limiters (Directive 2002/85/EC) Require Member States to put in place maximum speed limits for all roads. This could be established under (i) vehicle safety requirements, (ii) air quality requirements (iii) CO2 emission reduction requirements
Vehicle performance and emissions are dependent on real world driving
Improved vehicle test procedures and test cycles to measure emissions
Review of test procedures to better reflect real world driving
4.8 SUMMARY
It is difficult to model this scenario in a meaningful way, as many small and medium cars currently available already meet these criteria of limited top speed, relatively modest weight and unspectacular acceleration. A move towards such vehicles would therefore meet the requirements here. However, one possible approach is to assume all vehicles sold will conform roughly to the
of the diversity of European automobile manufacturers and avoid any unjustified distortion of competition
between them…”

Options to achieve 80g/km CO2 by 2020
Centre for Automotive Industry Research & ESRC BRASS Centre, Cardiff University, Cardiff, Wales, UK Page 80
specification of the Loremo LS, outlined earlier in this chapter. With an estimated CO2 output of 41 g/km, configuring all cars in the market along its lines would clearly allow us to meet the 80 g/km limit without problem. The CO2 figure for the Loremo is estimated from the fuel consumption figure provided by the company. As neither fuel consumption, nor CO2 emissions have been tested for the Loremo according to the NEDC, these figures are open to dispute. Nonetheless it is fair to say that those figures, if or when they do become available will still be well below 80 g/km. The same holds for the GMD T25 and the Axon. Whether the existing car industry can be reconfigured to make vehicles of the Loremo type by 2020 is a different matter and clearly doubtful in view of the technologies used for its chassis and body structure. These can be produced in volume, but would require technologies that few car makers currently possess. However, in view of the cars currently available, a downsizing of cars in the current technology paradigm would address many of these issues. It is therefore productive to consider the arguments presented here in the context of the discussion in chapter 5, where we explore that scenario.
Our concluding points for comparison with the other scenarios are that:
• Average cost per vehicle to the manufacturer: high if opting for the Loremo model, low if opting for the downsizing model, although this would lead to loss of margins on these more basic models. Efforts would have to be made to start selling technology rather than gadgets and rebuilding margins that way.
• Lock-in effects impacting further efficiency improvements until 2050: medium, there would still be emissions, but these would be reduced significantly , although de-powering and weight reduction could work as a prerequisite for EV penetration in that over-engineering will not be possible for those as lightweight structures are needed to compensate for battery weight and to extend range.
• Co-benefits e.g. in the areas of safety, air pollution, noise: to the extent that current small cars are safe, excluding heavier vehicles would enhance their safety, while speed reduction would also have great safety benefits; toxic pollutants would be reduced, although noise levels would not improve, as most noise-reduction involves adding weight (Lotus-type electronic noise cancelling systems have not seen widespread implementation, but could be boosted under this scenario).
• Potential implications for: o Vehicle manufacturers: loss of profitability and the cost of transforming from selling
gadgets to selling CO2 reduction and fuel efficiency technologies; possible need to introduce new powertrain types, lightweight materials, etc.
o Consumers: would benefit through better fuel consumption, which would compensate for inevitably higher fuel prices; also through lower running costs in other respects as a result of simpler, more robust technologies.
o Regulators: would find it a challenge to convince the existing car industry to redirect its efforts; however, creative new entrants could create new jobs and new IP with wider social and economic benefits.

Options to achieve 80g/km CO2 by 2020
Centre for Automotive Industry Research & ESRC BRASS Centre, Cardiff University, Cardiff, Wales, UK Page 81
CHAPTER 5 – SCENARIO 4: MARKET / SEGMENT SHIFT
5.1 SHIFTS WITHIN SEGMENTS
Another productive approach which would require little additional cost is to shift to the lowest CO2 emitting vehicle in each segment. This is an approach advocated by Julia King, among others, who argues that by selecting the most fuel efficient vehicle in each segment, a CO2 reduction of 25 per cent is possible even today (King 2007). It is also often not appreciated how much difference in weight there can be between the base version and more highly specified variants. This needs to be compensated for by additional power, while high performance versions themselves also tend to be better specified with weight-adding features. Table 5.1 illustrates this for the VW Golf.
Table 5.1: VW Golf – performance and weight by variant
Variant Power (kW) Top Speed (km/h) Weight (kg)
1.4 16V 59 168 1129
1.4 TSI 90 197 1205
2.0 SDI 55 163 1227
GTI 147 235 1303
R32 184 250 1594
(Source: Stolwijk, 2007)
In other words, the high-performance Golf R32 is some 460 kg heavier than the base model, which amounts to a staggering 41 per cent. Moving beyond individual models to take into consideration models competing in the same segment from different manufacturers, there are also marked differences in weight.
Table 5.2: Weight range within segment
Make Model Weight (kg) CO2 (g/km)
Ford Focus 1.6 1127 159
Honda Civic 1.4 1140 135
Renault Megane 1.6 1150 163
Kia Cee’d 1.6 1163 152
Opel Astra 1.6 1165 163

Options to achieve 80g/km CO2 by 2020
Centre for Automotive Industry Research & ESRC BRASS Centre, Cardiff University, Cardiff, Wales, UK Page 82
Citroen C4 1.6 1175 159
Fiat Bravo 1.4 1205 158
Audi A3 1.6 1205 162
Peugeot 308 1.6 VTI 1277 159
Nissan Qashqai 1.6 1297 159
BMW 116i 1340 139
% best – worst 19 17.2
(Source: Stolwijk, 2007, Autocar 2009)
There are some reasons for this range of weights with the heaviest in our list at 1340 kg, 19 per cent heavier than the lightest. First of all, at the luxury end, as represented by such vehicles as the BMW and Audi, cars tend to be better specified to partly justify their higher price. In addition, the BMW is rear wheel drive, which tends to add weight due to a longer drive train. Also, the Nissan Qashqai is styled in a SUV idiom, despite competing in this hatchback segment, and this also tends to add weight, even though this base variant does not feature 4-wheel drive. Nevertheless, it shows the range of weights within one segment. However, do note that some manufacturers have been able to overcome this weight penalty through sound powertrain engineering and have nevertheless been able to return relatively good CO2 emissions figure in the NEDC. Consider how much better it would be if weight was reduced to the level of the lightest car and efficiency to the level of the most efficient within the same car. Julia King’s figure of 25 per cent reduction in CO2 seems perfectly feasible and we will explore this in more detail below. While the King Review suggested that much can be achieved by car buyers choosing the lowest CO2 emitting vehicle in each segment, this does raise the issue of segmentation itself.
5.2 SEGMENTATION
One of the persistent problems of automotive market analysis is the fact that there are various segmentation systems in use. As a typology we could identify the following:
• Market leader defined segments (traditional)
• Official (government or industry body) data segments
• Industry publication defined segments
• Consumer publication segments (two cases) Market leader defined segments used to be in more common use than they are today. The idea is that a segment is defined by the dominant model / brand in the (usually national) market. Hence in the UK, one might refer to the Ford Focus segment. At a European level one might refer to the VW Golf segment and so forth. This approach had some value, particularly when certain brands and models were dominant in the market, because other vehicle manufacturers could determine their

Options to achieve 80g/km CO2 by 2020
Centre for Automotive Industry Research & ESRC BRASS Centre, Cardiff University, Cardiff, Wales, UK Page 83
product and pricing strategies relative to these dominant brands. More recently, the erosion of such dominant models at national and European levels has negated the value of this intuitive and pragmatic approach to segments. The concept became transposed to that of different segment classes based on the idea of A Segment; B Segment (Fiesta); C Segment (Focus) and so on. Implicitly, therefore, this is a simple, size-based system ‘moderated’ by body style. This fails to capture the modern trend towards smaller premium-priced cars such as the MINI or Fiat 500. Official data segments are by their nature more enduring, not least because government bureaucracy does not lend itself to rapid change. Consumer magazines tend to be rather more fluid in their definitions, and to use more ‘qualifier’ terms. Thus Autocar may in practice talk of ‘large’ 4x4s even though this is not a distinct category. Automotive News Europe attempted a system more like that found in the US market, by separating out a parallel set of segments for the so-called ‘premium’ segments. Table 5.3 provides a summary.
The primary definitions appear to be based on body style, though it is not clear why MPVs should claim a definitive class, but estates do not. Secondary definitions depend upon the number of doors (the Autocar system ranges from 0 to 5 inclusive), the number of seats, the drivetrain, the price, or the ‘premium’ status of the model.
Table 5.3: Segment definitions compared
ANE Traditional Autocar What Car? SMMT
Open Open
Minicar Saloon;
Estate;
Hatchback.
Saloon;
Estate;
Hatchback.
Mini
Small A Supermini
Lower Medium B Lower Medium
Upper Medium C Upper Medium
Large D Executive
Small Minivan MPV
Medium Minivan
H Multipurpose vehicles
Large Minivan
Small SUV 4x4 4x4 Dual purpose 4x4
Medium SUV Dual purpose

Options to achieve 80g/km CO2 by 2020
Centre for Automotive Industry Research & ESRC BRASS Centre, Cardiff University, Cardiff, Wales, UK Page 84
4x4
Large SUV Dual purpose 4x4
Roadster & Convertible
G
Coupe Coupe Coupe
Entry Premium Luxury
Lower Premium
Medium Premium
E
Upper Premium
Roadster Premium
Open Open Sports
SUV Premium 4x4 4x4 Dual purpose 4x4
Exotic F
Car-Derived Van
Another manifestation of market fragmentation is the changing proportions of the major segments in each market. The UK provides a useful example as shown in Table 5.4.
Table 5.4: Segment market share in the UK: 1992 and 2006
Segment 1992 % 2006 %
Mini 0.89 0.99
Supermini 25.02 32.11
Lower medium 37.02 29.66

Options to achieve 80g/km CO2 by 2020
Centre for Automotive Industry Research & ESRC BRASS Centre, Cardiff University, Cardiff, Wales, UK Page 85
Upper medium 24.04 16.80
Executive 7.78 4.28
Luxury saloon 0.68 0.56
Specialist sports 1.61 2.27
Dual purpose 2.46 7.50
Multi-purpose vehicle 0.49 5.32
(Source: SMMT; note: uses SMMT segmentation system)
Table 5.4 illustrates the slow but sure shrinkage of the middle of the market that has occurred in the UK and many other markets. In 1992 the three major segments comprised 86.08 per cent of the market. By 2006 that top three segment market share declined to 78.57 per cent. It is true that the Supermini segment market share grew in this period, but in many respects this may just be a portent of things to come, not least because the next candidate for significant growth is the Mini segment. This is in response to generally less stable fuel prices, the spread of CO2 regulation and the ongoing recession/credit crunch.
If 130 g/km cars are to be the average in 2015 time, it is clear some radical changes are required soon and shifts in the relative popularity of segments are one way of addressing this. There is also the possibility of shifting within each segment to the most CO2 efficient vehicle. This will need a combination of more energy efficient large cars and more energy efficient small cars. In a sense, making large cars more fuel efficient is easier – there is more scope for improvement and more of a margin for recovering any additional costs associated with the changes. Alternatively compensating for the higher emitting cars with stretching small cars to become even more CO2 efficient is a possibility. Few cars capable of compensating for the larger cars sold currently exist and although there is no doubt that car makers are actively developing engines that will deliver significantly lower CO2 emissions, something more radical may be needed. One segment largely neglected by mainstream car makers is that sometimes called the ‘sub-car’; vehicles that exist in a fluid continuum somewhere between motorcycles and the MCC Smart ForTwo, although the latter has itself some sub-car characteristics.
5.3 NEW SEGMENTS
Environmental pressures are forcing us to reconsider our transport options. The last thing we want to do is limit these options in some artificial way. The traditional private transport options are selected from the following range:
Foot

Options to achieve 80g/km CO2 by 2020
Centre for Automotive Industry Research & ESRC BRASS Centre, Cardiff University, Cardiff, Wales, UK Page 86
Bicycle
Moped
Scooter
Motorbike
Car
In certain markets, some of these categories are not separated out, while in others the gaps between some of them have already been filled. Some markets do not distinguish in law between mopeds, scooters or motorbikes, for example. More interesting for our purposes is the gap-filling in some markets, such as the ‘voiture sans permis’ (VSP) in France, discussed below.
5.3.1 WHAT IS A CAR?
Cars already fill a range of niches and smaller cars are potentially – though not always actually – ‘greener’ than large cars or light trucks. The MCC Smart ForTwo has extended the concept of what constitutes a car downward in terms of size. In Japan this has been done for some time by the ‘kei’ or midget car segment. These very small cars are defined in terms of their physical size and engine size (660 cc maximum). In Japan they are considered quite separate from ‘normal’ cars, they are cheaper and many Japanese would not consider buying a kei car. On the other hand, kei car ownership is encouraged by government and brings with it a number of benefits, such as less onerous parking restrictions in urban areas. It is significant that in Japan’s recent recession the kei segment was the only car segment showing consistent growth – all other segments declined. Some kei cars have started to appear in Europe and more are likely to follow in order to try and meet JAMA’s CO2 reduction requirements.
5.3.2 VOITURETTES
Moving down the size scale one more notch we find the ‘voiture sans permis’ (VSP), also known as ‘quadricycle’ or ‘voiturette’. These are very small cars powered by industrial petrol or diesel engines of typically 50 cc to 500 cc capacity. In France the smallest ones are classed as if they were mopeds and can be driven without a licence from the age of 16 (used to be 14). These are limited to a 50 cc engine, maximum speed of 45 kph and a maximum weight of 350kg. The larger voiturette is subject to a tight weight limit of 400 kg. They are the modern iteration of the cyclecars of the 1920s.
Their popularity in France has prompted changes in legislation whereby they are now recognised under EU law and can be introduced under various regulatory regimes in other EU member states with Belgium, Netherlands, Italy and Spain at the forefront of their adoption. Even countries, such as the UK, which have traditionally been sceptical about the voiturette, now allow them in. Reliant has started importing the Ligier Ambra into the UK and Aixam-Mega also has an official importer, although educating potential buyers unused to the VSP concept may be a greater challenge. Other significant builders are Microcar and Erad. These ‘cars’ are usually built on a separate chassis – in some cases an aluminium spaceframe – and are covered with plastic panels. Battery-electric variants are offered and the internal combustion versions frequently use a rubber-belt

Options to achieve 80g/km CO2 by 2020
Centre for Automotive Industry Research & ESRC BRASS Centre, Cardiff University, Cardiff, Wales, UK Page 87
continuously variable transmission (CVT) for user-friendly operation. Aixam-Mega is the largest supplier with a production capacity of 13,000 a year and a market share in France of 42.7 per cent in 2004 (Doucet 2008).
It is estimated that the parc of VSPs in France consists of around 140,000 vehicles out of a European total of around 250,000, while 65 per cent of drivers are over 50 (Doucet 2008). Most are used in rural areas. In urban areas there are rental firms catering primarily for people who have lost their driving licence.
5.3.3 THE CAR – MOTORCYCLE INTERFACE
Moving sideways brings us to the gap between the smallest cars and motorbikes. In recent years a number of vehicles have been inserted into this gap. The BMW C1 launched in the late 1990s was a motor scooter with a roof. This novel concept, not entirely unlike some Japanese take away food delivery bikes and trikes, was designed to appeal to the commuter, who is fed up with the limitations of the car in a congested urban setting, but wants to avoid the exposure to the elements inherent in motorcycle use, and welcomes the added crash protection. Rival Mercedes went one step further with its F300 Life-Jet of 1997, a three-wheeler that leaned into corners like a bike – but there are no plans for production. However, other firms have taken up the three-wheeler challenge.
Closest to the Mercedes in concept is the Dutch Carver lean-steer vehicle with electronic stability control; a more detailed assessment may be found below. In recent months two UK designs have been proposed for this lean-steer bike-car sub-segment, the four-wheel Naro and the Clever. A small Swiss firm, Peraves, launched a novel device in the early 1990s. This was a luxury entrant retailing at a price on a par with an entry level Porsche, but with performance to match. The vehicle has since been updated and is still made and a passionate owners group exists. The vehicle is shaped like a streamlined tandem two-seater fuselage on two wheels, powered by a BMW motorcycle engine. Two stabiliser wheels emerge from the sides when speed falls below a certain minimum. Fun rather than practicality lies at the heart of these machines, though from an environmental viewpoint it must be said that in terms of fun per litre of fossil fuel these vehicles beat most conventional sports cars. More importantly, they have the potential of extremely low CO2 emissions, making them capable in theory of offsetting sales of 130 g/km + cars.
Riley (1994) in his book Alternative Cars in the 21st Century, proposes changes in legislation to allow the promotion of such ‘sub-cars’ for environmental reasons. His case is compelling particularly in the US context, where safety and product liability legislation can act as a barrier to such novel vehicle concepts. These niches frequently attempt to insinuate themselves into the gaps between existing legislative categories, which makes classification difficult. More flexibility on the part of legislators may be required in many markets, as policy makers have a vital role in creating potentially beneficial shifts to new modal options. So let us see what is currently available.
Human powered vehicles take us well away from cars, although some ‘velomobiles’ (sophisticated pedal cars) are offered. Moving up one notch from these velomobiles we find a unique Swiss product, the Twike. The Twike is a human-electric hybrid and it uses a simple aluminium tubular chassis fitted inside a glass-fibre body and a large polycarbonate windscreen, and seats two.

Options to achieve 80g/km CO2 by 2020
Centre for Automotive Industry Research & ESRC BRASS Centre, Cardiff University, Cardiff, Wales, UK Page 88
Although relatively heavy for human power at around 200 kg, once started, the momentum can easily be kept up with the two-person powertrain driving rubber belts. However its unique feature lies in the fact that it is supplied as a HPV-electric hybrid. The electric assistance can be used to tackle the Swiss terrain. The Twike was one of the vehicles promoted in the Swiss electric vehicle experiment in Mendrisio, but its price deters many. This brings us to another new niche; that of the increasingly popular electric or electrically-assisted bicycle. Figure 4.7 summarises these new niches. There is growing diversity beyond the conventional car in the varied world of personal transport. Education of consumers and legislators is needed to widen the market impact of such vehicles so a more optimised personal transport choice becomes available to all. Another problem is that most of these vehicles are still made in very small numbers by cottage-like craft industries. Volume production would be required before they could make an impact. However in some categories this is already happening. Conventional motorcycles could also be repositioned to becoming a more environment friendly mode, with the potential to replace the car for many journeys. The technology is out there to move closer to a more sustainable multi-mode transport system with the potential to really shift CO2 emissions downward.
Figure 5.1: Filling new personal transport niches
ATM SUV
Twike sports trike MPV
velomobile motorbike car (S,M,L,XL)
HPV scooter Smart
bicycle moped kei car
foot Segway electric bicycle VSP/quadricycle
Although a notional ‘A’ or city car segment did exist, until the 1990s it was largely populated by aging though funky designs such as the Citroen 2CV, original Fiat Panda and original Mini. The
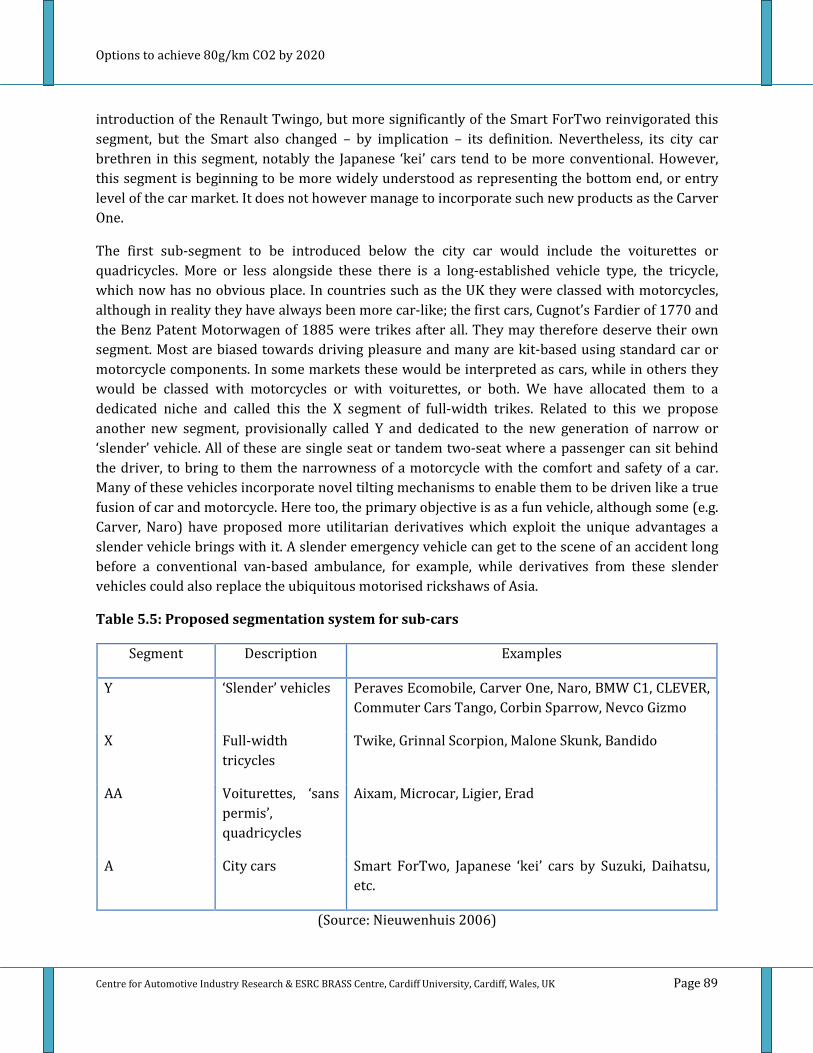
Options to achieve 80g/km CO2 by 2020
Centre for Automotive Industry Research & ESRC BRASS Centre, Cardiff University, Cardiff, Wales, UK Page 89
introduction of the Renault Twingo, but more significantly of the Smart ForTwo reinvigorated this segment, but the Smart also changed – by implication – its definition. Nevertheless, its city car brethren in this segment, notably the Japanese ‘kei’ cars tend to be more conventional. However, this segment is beginning to be more widely understood as representing the bottom end, or entry level of the car market. It does not however manage to incorporate such new products as the Carver One.
The first sub-segment to be introduced below the city car would include the voiturettes or quadricycles. More or less alongside these there is a long-established vehicle type, the tricycle, which now has no obvious place. In countries such as the UK they were classed with motorcycles, although in reality they have always been more car-like; the first cars, Cugnot’s Fardier of 1770 and the Benz Patent Motorwagen of 1885 were trikes after all. They may therefore deserve their own segment. Most are biased towards driving pleasure and many are kit-based using standard car or motorcycle components. In some markets these would be interpreted as cars, while in others they would be classed with motorcycles or with voiturettes, or both. We have allocated them to a dedicated niche and called this the X segment of full-width trikes. Related to this we propose another new segment, provisionally called Y and dedicated to the new generation of narrow or ‘slender’ vehicle. All of these are single seat or tandem two-seat where a passenger can sit behind the driver, to bring to them the narrowness of a motorcycle with the comfort and safety of a car. Many of these vehicles incorporate novel tilting mechanisms to enable them to be driven like a true fusion of car and motorcycle. Here too, the primary objective is as a fun vehicle, although some (e.g. Carver, Naro) have proposed more utilitarian derivatives which exploit the unique advantages a slender vehicle brings with it. A slender emergency vehicle can get to the scene of an accident long before a conventional van-based ambulance, for example, while derivatives from these slender vehicles could also replace the ubiquitous motorised rickshaws of Asia.
Table 5.5: Proposed segmentation system for sub-cars
Segment Description Examples
Y ‘Slender’ vehicles Peraves Ecomobile, Carver One, Naro, BMW C1, CLEVER, Commuter Cars Tango, Corbin Sparrow, Nevco Gizmo
X Full-width tricycles
Twike, Grinnal Scorpion, Malone Skunk, Bandido
AA Voiturettes, ‘sans permis’, quadricycles
Aixam, Microcar, Ligier, Erad
A City cars Smart ForTwo, Japanese ‘kei’ cars by Suzuki, Daihatsu, etc.
(Source: Nieuwenhuis 2006)

Options to achieve 80g/km CO2 by 2020
Centre for Automotive Industry Research & ESRC BRASS Centre, Cardiff University, Cardiff, Wales, UK Page 90
5.4 FUN VERSUS GREEN
With DaimlerChrysler launching the Smart ForTwo in the US as a cool green vehicle in the wake of rising gasoline prices, the idea of a vehicle that combines street credibility with green credentials is no longer so far fetched. The longer established Peraves Ecomobile from Switzerland, which uses a BMW motorcycle powertrain, implies such green credentials through its very name. Such slender vehicles have a small frontal area as part of their environmental advantage. This aerodynamic feature is difficult to replicate for wider vehicles and is one of the key advantages of these slender vehicles that justifies their dedicated segment in this system. This feature gives them the potential to weave through congested traffic like a motorbike, yet these vehicles can also be competent long distance tourers.
Americans, such as Reilly have long proposed small or narrow three-wheelers as dedicated commuter vehicles for the US. Many car and light truck miles in the US involve commuting by a single person and bringing about a migration of such commuters into slender lightweight vehicles could significantly reduce oil use, CO2 emissions and congestion. Although Commuter Cars’ Tango is a heavy vehicle due to the weight of its batteries, it is nevertheless a narrow one and has already enjoyed a certain measure of success among US celebrities such as George Clooney. As its makers claim in their brochure; “It only works for 90 per cent of your trips”. Several electric narrow vehicles have also been marketed as niche commuter vehicles in the US, notably the Gizmo and the Sparrow.
5.5 BARRIERS TO INTRODUCTION
Many EU markets are not used to lightweight sub-cars. Although French-style ‘voiturettes’ are now made or imported in Belgium, Netherlands, Italy, Spain and the UK, take-up has been very limited. The MCC Smart has become successful largely because it offers a near-conventional car-like driving and ownership experience, while being novel enough to stand out from the crowd. It also offers more car for the money than the craft-built quadricycles. No regulatory regime exists in many EU member states to favour this type of ultralight or slender vehicle, however desirable it might be. It may fall between two regulatory stools, not being classed as a car, or as a motorbike. On the other hand, there are broader regulatory trends that favour these vehicles such as the CO2 agenda and urban congestion regulation. Perhaps a new segmentation system incorporating such vehicles is called for.
Many manufacturers have launched new small cars and several more are in the pipeline. Small cars such as the Fiat Panda, Peugeot 107, Toyota Aygo, Citroen C1, Kia Picanto are among Europe’s best sellers. This has added a new dynamic to the bottom end of the mainstream car market which could not have been foreseen ten years ago. No doubt the European Commission’s policy on CO2 emissions has concentrated corporate minds on the small car as a means to meet the agreed level. If car makers’ ranges could be extended further down into these new niches and segments without losing face, meeting such standards would be that much easier. Note that in order to reach even the average of 130 g/km, for every gas-guzzler sold, one or more very fuel efficient counterparts will also have to find a paying customer, this need is even more pressing when we consider 80 g/km.

Options to achieve 80g/km CO2 by 2020
Centre for Automotive Industry Research & ESRC BRASS Centre, Cardiff University, Cardiff, Wales, UK Page 91
Perhaps the days of a slender car from one of the mainstream car makers is not that far off, several, including DaimlerChrysler, have shown concepts along these lines.
5.6 LEGISLATIVE AND POLICY FRAMEWORK FOR SCENARIO 4
The European automotive regulatory framework identifies various categories of vehicles based upon their utility, functionality and weight. The categories, whilst currently under review, are established in definition of vehicle categories and vehicle types (Annex II) of the Framework Directive (2007/46/EC). Such alterations to the existing segmentations of car manufacturers would require revision to the vehicle categories in order to ensure that ultra-light, small vehicles were nevertheless incorporated into the CO2 emission reduction targets for passenger vehicles and were not considered outside the scope of passenger vehicle regulations by virtue of the weight and utility. More importantly, this scenario identifies the need to create a market for these types of vehicles, to encourage car manufacturers to move in this direction (as opposed to towards larger, heavier vehicles as the case has been in the US) and at the same time to secure demand and product choice which places these types of vehicles ahead of more cumbersome, traditional IC engine and enhanced utility passenger vehicles.
Table 5.6: Current policy problems and solutions for Scenario 4
Problem Solution Method
Categorisation of new ultra-light vehicles
Clarify categorisation of vehicles
Revision of Annex II Directive 2007/46/EC to take into account upcoming new segmentations; Ensure Annex II is kept under review to reflect new technologies and car markets
Unsure market for ultra-light vehicles
Taxation Incentives; Fuel Prices: ADAC (2005) found fuel consumption is mostly only important because of the cost; Strengthen labelling and advertisement
Fiscal measures such as excise duty can change consumer choice; The European Commission commitment to revise the Car Labelling Directive must promote increased public awareness and incentivise more sustainable choices. (See ADAC Report, 2005)
Going back to the original point raised by the King Review, what could be achieved in terms of CO2 reduction if buyers chose the lowest emitting option in each segment from what is currently available? In order to assess this, first we have to identify the lowest CO2 vehicle in each segment. The findings are presented in table 5.7.

Options to achieve 80g/km CO2 by 2020
Centre for Automotive Industry Research & ESRC BRASS Centre, Cardiff University, Cardiff, Wales, UK Page 92
Table 5.7: Lowest CO2 emitting vehicles for each segment
Segment Lowest CO2 emitting models CO2 g/km
CO2 g/km from equivalent vehicle by 2020
Mini
City: Smart ForTwo dci
Hatchback: Citroen C1/Peugeot 107/Toyota Aygo
88
106
66
80
Supermini Ford Fiesta 1.6 TDCi Econetic 98 74
Lower medium Volkswagen Golf 1.6 TDI Bluemotion
99 74
Upper medium Toyota Prius 1.8 VVT-i T3 89 67
Executive Compact: BMW 320d EfficientDynamics Standard: Volvo S80 1.6 DRIVe SE
109
129
82
97
Luxury saloon BMW 730d SE 178 133
Specialist sports
Coupe: VW Scirocco 2.0 TDI 140
Specialist sports: Morgan 4-4
Mass produced sports: Mazda MX-5 1.8i SE
134
164
167
101
123
125
Dual purpose (SUV)
Small: Toyota RAV4 2.2 D-4D 150 XT-R
Large: Lexus RX 450h
154
148
116
111
Multi-purpose vehicle
Small: Mercedes A160 Blue Efficiency
Medium: Renault Scenic 1.5 dCi
Large: Ford S-Max/Galaxy 2.0 TDCi 140
116
130
159
87
98
119
We now need to make a judgement as to the likely segment mix by 2020 and also any likely improvement in CO2 emissions by 2020. Industry’s view is that an improvement of 20%-30% is

Options to achieve 80g/km CO2 by 2020
Centre for Automotive Industry Research & ESRC BRASS Centre, Cardiff University, Cardiff, Wales, UK Page 93
feasible over the next few years, say by 2015, from technologies already in the pipeline. Some of those technologies are already used on some of the class leading vehicles listed in Table 5.7, so the improvement in their equivalent models may be less. On the other hand, we are talking 10 years on, with another 5 years of development, when a new generation of low carbon technologies will have been introduced. In addition, the real threat from electric and hybrid technologies, which will become more common in any case, will induce low carbon innovation in ICE technologies. Therefore we have assumed a further improvement across the board of 25% by 2020 in all segments. While these may appear to be heroic assumptions from a current mainstream viewpoint, it is clear from feedback within the car and supplier sectors, that such improvements are technically feasible at manageable cost.
If we now assume that these class-leading figures improved by 25% are representative for their segments by 2020 we can map this onto a market forecast. We have based this on the 2006 UK figures presented in table 5.4 above. So we accept a segment mix from 2006 for 2020, but for a market – the UK – which in an EU context tends towards larger, more powerful vehicles than is typical for the EU average. Where we have listed several models for a segment, we have used their average figure.
Table 5.8: Possible market mix to achieve 80g/km by 2020 for Scenario 4
Segment (conventional) 2020 market share (%) Segment average CO2 g/km
Mini 0.99 73
Supermini 32.11 74
Lower medium 29.66 74
Upper medium 16.80 67
Executive 4.28 90
Luxury saloon 0.56 133
Specialist sports 2.27 116
Dual purpose 7.50 114
Multi-purpose vehicle 5.32 101
Fleet average adjusted by segment share
100.00 79
The results of a fleet average of 79 g/km of CO2 suggest that a combination of buyers opting for the most CO2-efficient models in each segment and assuming these models will enjoy a further

Options to achieve 80g/km CO2 by 2020
Centre for Automotive Industry Research & ESRC BRASS Centre, Cardiff University, Cardiff, Wales, UK Page 94
improvement of 25% in terms of CO2-efficiency from 2009 levels, even with existing segmentation patterns will get us beyond our target of 80g/km. In terms of cost these improvements are an integral part of current model and product development cycles. In other words the cost will not be significantly different from current product development cost, but the main focus of product development will be targeted at CO2 reduction technologies, instead of the current focus on comfort and safety technologies. In terms of the latter much is already in place, while some active safety technology will lead to more investments in infrastructure and can also be used to support low carbon technologies.
The summary points for this scenario are that:
• Average cost per vehicle to the manufacturer: low, although this could lead to loss of margins on these more basic models. Efforts would have to be made to start selling the technology used to achieve these low emissions (e.g. BMW ‘Efficient Dynamics’, VW ‘Blue Motion’, etc.) rather than gadgets and rebuilding margins that way – the challenge would be in marketing as much as engineering.
• Lock-in effects impacting further efficiency improvements until 2050: relatively low, as we would be dealing with existing mainstream technologies, by and large.
• Co-benefits e.g. in the areas of safety, air pollution, noise: to the extent that current cars are safe, there would be no change in that area; toxic pollutants would also be reduced, although noise levels would not improve.
• Potential implications for: o Vehicle manufacturers: loss of profitability and the cost of transforming from selling
gadgets to selling CO2 reduction and fuel efficiency technologies; possible need to introduce new powertrain types, lightweight materials, etc.
o Consumers: would benefit through better fuel consumption, which would compensate for inevitably higher fuel prices.
o Regulators: relatively low effort as the technologies are coming in any case; incentives would have to be provided to make consumers choose these options, or make manufacturers restrict choice to these options.

Options to achieve 80g/km CO2 by 2020
Centre for Automotive Industry Research & ESRC BRASS Centre, Cardiff University, Cardiff, Wales, UK Page 95
CHAPTER 6 – CONCLUSION: HOW TO GET TO 80 G/KM
6.1 COMBINING THE SCENARIOS
In this Chapter the various scenario possibilities are combined into one larger analysis that charts the potential solution to achieve 80 g/km CO2 emissions by 2020. In so doing, aspects of all the scenarios are brought together into a hypothetical but plausible mix of vehicle technologies, design strategies, and segment mixes to arrive at the 80 g/km figure. Note that this analysis is very much conducted at the aggregate level to apply to the entire industry rather than an individual vehicle manufacturer, although it is clearly the case that each vehicle manufacturer will have to arrive at some form of portfolio mix that allows such a target to be attained.
An important point is the regulatory treatment of electric vehicles, and in a related manner the treatment of plug-in hybrids. Both categories of vehicle may be expected to feature prominently in the ultimate product portfolio mix for 2020 if 80 g/km were to be achieved, but both raise difficulties with respect to the calculation and treatment of CO2 emissions per distance travelled, as discussed in chapter 3. The key issue is of course the means by which electricity is generated to power these vehicles, for which the CO2 emissions vary widely across EU Member States. In the case of plug-in hybrids, a further complication is that the proportion of the real-life driving time that pure battery electric mode will be used is also unknown, further complicating real-world CO2 emissions performance. One regulatory approach would simply be to measure CO2 emissions under the contemporary test cycle, which would yield both categories as zero emissions vehicles, provided the electric range of the PHEV exceeds or matches the distance in the NEDC, which will be the case for some of these. For the purposes of this analysis a nominal CO2 emission performance is attached to both technology packages: the pure battery electric vehicle and the plug-in hybrid, but it is recognised that this too is in some respects unsatisfactory.
Table 6.1 summarises the assumed CO2 emissions for four different size categories of car, along with the potential technology packages available. We must assume an average of 130 g/km for conventional, or ‘standard’ cars, in line with existing regulation. We have allocated this figure to ‘medium’ sized cars. In order to achieve this average large cars must also have improved and we have assumed a figure of 150 g/km. Depending on where this vehicle sits within the very broad ‘large’ category, this may be feasible, or not. In practice any vehicle that struggles with this limit, such as SUVs, would likely have been ‘hybridised’ by 2020 in order to reduce their CO2 output. In this context, the 150 g/km limit does seem realistic. For small cars, we have assumed 100 g/km, which is in line with current eco-variants. We assume, in other words, that the eco-variants of 2010 will perform as the mainstream models in 2020. Sub-cars even today, if we take the example of the latest models from Microcar, or Aixam, already achieve around 80 g/km and as their engines are also subject to improvement, we can assume this will have improved to 75 by 2020.

Options to achieve 80g/km CO2 by 2020
Centre for Automotive Industry Research & ESRC BRASS Centre, Cardiff University, Cardiff, Wales, UK Page 96
Table 6.1: Summary of the size categories and technology packages available to meet 80
g/km by 2020
Segment Large Medium Small Sub-car
Standard 150 130 100 75
Eco Variant (obsolete by 2020)
Eco Variant + stop-start 120 95 80 65
Petrol-electric Hybrid Vehicle 95 80 75 50
Diesel-electric Hybrid Vehicle 90 75 70 45
Plug-in Hybrid Electric Vehicle 65 50 50 30
BEV 50 40 36 15
The normal eco-variant without stop-start will have disappeared by 2020, as capacity for making such systems is being ramped up to such an extent that this will become a mainstream technology within the next 3 or 4 years. However, as environmental pressures and oil prices continue to increase, eco-variants will become an increasingly competitive sub-segment. These are accommodated under the ‘eco-variant + stop-start’ heading. We assume here that large cars will have achieved a figure of 120 g/km, although again the heavier types will have been hybridized. For the medium variants we have assumed a figure of 95 g/km, which reflects a slight improvement on the best models available today. The same approach has been taken for the small cars, which we assume to have improved from the currently typical 99g/km to 80 g/km. The hybrids have been reduced in line with these, although in practice, hybridization will be preferred for medium and large cars, whereby smaller cars will be capable of meeting the limits with more conventional technology solutions. We have small BEVs in at 36g/km, for reasons outlined in Chapter 3, as these are currently the dominant type. For the medium and large types we have used figures relative to this, with subcar variants at the level of the lowest figures achieved by BEVs. We have assumed a very small number of large BEVs. These would today be typified by the BEV conversions carried out on Range Rovers, however, by 2020 with the current high levels of investment in EV technologies paying off, these would be much more efficient; we have therefore assumed a figure of 50 g/km. Medium BEVs are very similar to small ones and are therefore very close to them at 40 g/km. Clearly at present any such figures are open to challenge; a more detailed analysis of the precise impacts of EVs can be found in EEA (2009), although the range given in the literature reviewed there still does not provide any clear figures that would meet with universal approval.

Options to achieve 80g/km CO2 by 2020
Centre for Automotive Industry Research & ESRC BRASS Centre, Cardiff University, Cardiff, Wales, UK Page 97
The AEA 2008 study defined the weight and CO2 emissions categories as shown in Table 6.2 wherein it can be seen that the defined ‘large’ vehicle with a mass of 1500 kg is actually only 100 kg above the assumed average weight for all European vehicles in this study at 1400 kg. The AEA study used 2006 data for the analysis and therefore reflects today’s mix. It must be assumed that by 2020 a different mix will prevail. We could use Fig. 1.1 as a guide and reflect on the popularity of small cars in the current climate. The technical improvements in small cars will make these the dominant segment in future; something that is reflected in our market mix for 2020.
Table 6.2: Weight and CO2 emissions for petrol and diesel cars, large, medium and small,
2006
Engine Vehicle Weight CO2 g/km Diesel % lower
Petrol Large 1500 238
Medium 1261 184
Small 957 149
Diesel Large 1690 201 37 g/km = 15%
Medium 1365 153 31 g/km = 16%
Small 1029 123 26 g/km = 17%
(Calculated from AEA 2008: 9)
To which we would add the sub-car segment for petrol and diesel at 750 kg and petrol emissions today of 105 g/km and diesel emissions of 90 g/km (16 per cent lower than petrol, rounded). The sub-car segment barely exists as of 2008, apart from modest sales in the so-called quadricycle category. However, following on from Scenario 4, as outlined in Chapter 5 this category is included as an important new market segment in the portfolio mix to achieve 80 g/km CO2 emissions across the whole new car sales fleet and we have taken the Smart ForTwo as a representative model. It currently emits 103 g/km in petrol form and 88 g/km in diesel form. In reality the 750 kg limit is probably still too high and reflects rather the current relatively heavy weight range of cars. Some A segment cars, such as the Smart are in this weight range, while some sports cars, such as the Lotus Elise and Caterham 7 are also within this limit. Quadricycles are currently limited to 350 kg (for 50 cc variants) and 400 kg (for 500 cc variants), so perhaps 500 kg for sub-cars is a better limit, although vehicles such as the Carver are over 500 kg, so perhaps criteria other than weight should also play a role. Also, many small BEVs are close in specification to quadricycles, from which some of them are in fact derived (e.g. Aixam) and for this reason we have assumed that BEV sub-cars are even smaller and lighter, perhaps more in the single-seat CityEl category. In any case the categorisation of small, medium and large as suggested in the AEA study is far too crude to be meaningful for most purposes.

Options to achieve 80g/km CO2 by 2020
Centre for Automotive Industry Research & ESRC BRASS Centre, Cardiff University, Cardiff, Wales, UK Page 98
From Table 6.1 it can be seen that electric vehicles are not treated as zero CO2 emissions here. Note also that there is no multiplier accorded to such electric vehicles, such that they cannot be used to offset multiple other vehicles. Moreover, this schematic does not allow for the split between petrol and diesel engines for the ‘Standard’, ‘Eco-variant’ and ‘Eco-variant plus stop start’ packages. It is assumed that further transition to diesel continues to 2020 as part of the carbon reduction strategy. This is particularly relevant to the technology packages ‘Standard’, ‘Eco-variant’ and ‘Eco-variant plus stop start’. However we should note the shortages of diesel fuel that have already led to exchanges of petrol and diesel across the Atlantic in recent years (Kendall, 2008).
It is apparent that while the simple low-carbon solution is to have the entire portfolio comprised of electric vehicles, the least cost portfolio will be to have the most ‘standard’ vehicles possible (including the fewest sub-cars as these would also involve significant changes to current practice). In terms of segmentation we clearly have to make some assumptions. Traditionally, we could have assumed that within an EU context, most sales would be in the medium segments, with small the next largest and large the next. Recent years have seen a trend away from larger cars, while there has also been a growth in sales of smaller cars, which themselves have grown to be more comparable in size with the medium size cars of 20 years ago, while performance and comfort features have also improved impressively. Recent progress along this line has added further appeal to small cars with the introduction of cars such as Ford’s Fiesta. It is reasonable to assume therefore, a continuing growth of the small car segment, whereby many buyers will have downshifted from large to medium and from medium to small. For this reason, we assume a market split as follows: 50 per cent small, 35 per cent medium, 5 per cent large and 10 per cent sub-cars for each technology category.
This reflects a significant shift towards smaller cars, for reasons outlined above – i.e. this is in line with current trends and with pressure to reduced CO2 this trend will be reinforced. Table 6.4 is based on these assumptions. The introduction of the sub-car category helps pull the average down, but of course this is offset by 5 per cent of the cars still being in the large category. This is useful because it helps understanding of the choices to be made by the vehicle manufacturers. If a vehicle manufacturer wants to remain with a high proportion of sales in the larger size categories in line with what they perceive as their core brand values, it is evident that there will have to be a higher proportion of hybrids in the product mix and an offsetting proportion of sub-car sales. Having made an assumption as to size distribution, we now have to make a judgment as to the share of each technology option. It is likely that eco-variant vehicles, improved along the lines of current regulation will be the dominant type, closely followed by the ‘standard’, which will also have enjoyed improvements. The vehicles with electric powertrain will still be in a minority, albeit a growing one. Nonetheless, we have adopted a relatively conservative scenario, as follows in Table 6.3.

Options to achieve 80g/km CO2 by 2020
Centre for Automotive Industry Research & ESRC BRASS Centre, Cardiff University, Cardiff, Wales, UK Page 99
Table 6.3: Forecast powertrain technology mix, 2020
Powertrain Technology Forecast market share 2020
Standard 15
Eco-variant with stop-start 50
Petrol hybrid 15
Diesel hybrid 5
Plug-in hybrid 5
BEV 10
Table 6.4: CO2 emissions per size and technology package average outcomes
Segment Market share 2020 (%)
Segment average CO2 g/km by 2020
kWh/km
Standard large 0.75 150 0.62
Standard medium 5.25 130 0.53
Standard small 7.5 100 0.41
Standard sub-car 1.5 75 0.31
Eco-variant large 2.5 120 0.49
Eco-variant medium 17.5 95 0.38
Eco-variant small 25.0 80 0.32
Eco-variant sub-car 5.0 65 0.26
Petrol hybrid large 0.75 95 0.38
Petrol hybrid medium
5.25 80 0.32
Petrol hybrid small 7.5 75 0.30

Options to achieve 80g/km CO2 by 2020
Centre for Automotive Industry Research & ESRC BRASS Centre, Cardiff University, Cardiff, Wales, UK Page 100
Petrol hybrid sub-car
1.5 50 0.20
Diesel hybrid large 0.25 90 0.36
Diesel hybrid medium
1.75 75 0.30
Diesel hybrid small 2.5 70 0.28
Diesel hybrid sub-car
0.5 45 0.18
Plug-in hybrid large 0.25 65 0.26
Plug-in hybrid medium
1.75 50 0.20
Plug-in hybrid small 2.5 45 0.18
Plug-in hybrid sub-car
0.5 40 0.16
BEV large 0.5 50 0.20
BEV medium 3.5 40 0.16
BEV small 5.0 36 0.13
BEV sub-car 1.0 15 0.06
Fleet average 100 80 0.33
Evidently, given this complexity there are a great many potential outcomes that would yield 80 g/km or better. Table 6.4 illustrates a possible mix based on what might be plausible and affordable for vehicle manufacturers and suppliers, for consumers and for regulators.
The final column in table 6.4 translates the CO2 data into kWh/km data. Because electric vehicles are no longer counted as zero, the inevitable result is that cuts in the higher energy consumption categories have to be made to attain a fleet average of 0.33 kWh/km. Therefore, the result of changing the regulatory regime to reflect kWh/km rather than CO2 emissions is that it is likely that there will be a further switch away from internal combustion engines and a greater level of growth in electric vehicles. As was noted before, the data here reflects a reasonable approximation of a potential outcome given the possible technology packages available, but in no way represents the only outcome for any given vehicle manufacturer or indeed the only possible net average outcome for the industry as a whole.

Options to achieve 80g/km CO2 by 2020
Centre for Automotive Industry Research & ESRC BRASS Centre, Cardiff University, Cardiff, Wales, UK Page 101
6.2 COSTS AND THE ACHIEVEMENT OF 80 G/KM
The issues of costs incurred by the vehicle manufacturers and costs as experienced by consumers are complex, such that any statement regarding costs needs to be treated with caution. This report does not seek to make a detailed cost analysis, but rather to place the achievement of 80 g/km in a more realistic understanding of costs. The following observations are relevant.
1. The automotive industry in Europe is not one based on price competition alone. Indeed, the vehicle manufacturers have sought to escape price competition through branding and qualitative differentiation. The price as paid by consumers is only part of the purchasing decision picture, and sensitivity to price varies widely by brand and product segment.
2. Not all additional cost is necessarily passed onto the consumer. Some part of the additional cost may be borne by other parts of the value chain.
3. Cost per unit is sensitive to volume such that a rapid uptake of a component, material or technology will result in a significant fall in per unit costs. Mandating a rapid reduction in carbon emissions will actually help the automotive industry in this regard, because it will provide the market volumes of a sufficient scale to reduce costs per unit dramatically.
4. There need not necessarily be a net consumer (or indeed social) cost if the additional purchase price cost is compensated for by reduced lifetime running costs associated with improved fuel economy. De-powered vehicles, smaller vehicles and low-performance vehicles would also attract much lower insurance premiums.
5. Any wider social costs can be compensated by social benefits in terms of e.g. reduced emissions-related health costs and / or reduced import costs for petroleum.
6. Cost levels for new technology have historically been prone to over-statement by the automotive industry, particularly when referring to technology mandated by regulation, as have warnings about the ‘end of the industry as we know it…’
7. The vehicle manufacturers rely upon the supply chain for over 75% of the ex-works value of a car. The management of that supply chain is therefore vital with respect to costs. Normal industry practice is for a 3% year on year cost reduction to be built into contracts, with more extreme cost reductions requested in times of crisis.
8. In terms of quality-adjusted pricing the available evidence is that the automotive industry reduces costs per vehicle by around €3,000 every 13 years while adding around €4,000 of content, according to McKinsey (2003). A reasonable assumption is that across the industry only 50% of costs would be passed onto consumers.
9. Consumers are willing to pay a significant premium for optional extra components and features that offer marginal extra performance, assumed aesthetic appeal, or comfort. The automotive industry can extract substantial sums for seemingly mundane items such as a Bluetooth connection, a metallic finish to the paint, or alloy wheels. To take just one example at random, the Jaguar XF 2.7D as tested in Autocar (25th March 2009) included metallic paint (£600); leather seats (£750); alloy wheels (£1,750); oak veneer trim (£150); heated / cooled seats (£470); blind spot detector (£450); parking camera (£395); bi-xenon lights (£450) and stereo (£1140). In total the car had a list price of £37,500 but an actual price of £43,655 and so the optional extras added a further 16% to the cost of the car.

Options to achieve 80g/km CO2 by 2020
Centre for Automotive Industry Research & ESRC BRASS Centre, Cardiff University, Cardiff, Wales, UK Page 102
10. List prices are only an approximate guide to transaction prices, once features such as trade-in values, finance and ‘free’ optional extras are included. As has been evidenced by the scrappage incentive schemes, vehicle manufacturers and dealers are willing to underwrite very large discounts on new car sales, which is suggestive of the availability of a considerable margin within which to operate.
11. Additional costs are not purely additional, because costs elsewhere on the vehicle may be saved. A simple example is that of the substitution of fuel injection systems replacing carburettors. Stop-start systems are also not purely additional, because some form of starter would have to be on the car anyway.
6.3 ROLE OF THE CUSTOMER
Traditionally, the car industry has blamed the customer for the nature of the products it makes: “we only make what the customer wants”. It was therefore refreshing a number of years ago during a visit to one car maker when we were told this was nonsense – the customer is not a car designer or automotive engineer we were told. It is significant that that car maker is also in the forefront of CO2 reduction today. Much less is the customer aware of the implications of his or her decisions; ordinary citizens do not have this information, nor do they have time to track down enough information to make such lifecycle assessments on each and every product they buy or use. The notion of primary customer responsibility was well and truly challenged by Stuart Hart’s influential article (Hart 1997) where he put the primary responsibility for greening products firmly in the court of the manufacturers. Hart encourages industry to help shape public policy not in its own short term interests but in the longer term social interests that are implied in the sustainability agenda. These will ultimately coincide, of course, a concept that has been recognised by at least some firms. If this partial abdication of customer responsibility seems novel, let us remember that as well as buying today’s product offerings, 15 million customers also quite happily bought Ford Model Ts, more than 20 million bought VW Beetles and some even bought BMW Isetta and Messerschmitt Kabinenroller bubble cars. The customer can only choose from what he or she is offered by manufacturers and dealers in the market place.
The consumer of automobility does have a role to play. Ultimately we need to recognise that most motorists – aided and abetted by the car industry – are currently engaged in car abuse – an affliction not unlike drug abuse. As with some such activities, moderate use need not be unduly harmful and needs to become the norm if we do not want to lose our right to automobility, which in truth is a privilege. We must abandon the automotive excess that has led to many modern cars being more akin to mobile boudoirs or mobile offices than true driving machines or even basic means of ‘getting from A to B’. To achieve these kinds of long term changes to the current automotive culture requires firm and long term regulatory measures at both European and Member State level. Further to the legislative changes identified for each scenario - presented above- we probably also need a ‘campaign for real motoring’ and responsible car use involving real driving machines with a realistic, useable performance envelope. The issues we need to address go far beyond CO2 and need to be seen within the broader context of sustainability. The car of tomorrow will therefore also need to address the issues of resource depletion, waste generation, congestion and quality of life in the broadest sense. It is likely that the products that will meet such

Options to achieve 80g/km CO2 by 2020
Centre for Automotive Industry Research & ESRC BRASS Centre, Cardiff University, Cardiff, Wales, UK Page 103
requirements are more involving, more likeable and more fun to drive than the often over-specified, over-weight devices of today.
6.4 THE LIMITS OF CO2 REGULATION
It is apparent from the foregoing analysis that the regulation of electric vehicles and indeed plug-in hybrids promises to be controversial if the basis used is CO2 emissions. While cars continue to use petrol or diesel it is possible to measure and therefore regulate the tailpipe emissions of CO2 in a broadly consistent manner. The introduction of vehicles that are full-time or part-time electric, or indeed other vehicle technologies such as compressed air engines or hydrogen fuel cells, means that CO2 emissions are no longer confined to the vehicle, and that therefore the attribution of such emissions becomes increasingly problematic.
With respect to pure electric vehicles (BEVs), much therefore depends upon how the electricity stored by the batteries is generated in the first place and this of course varies widely from country to country and case to case across Europe. It is theoretically possible to have an electric vehicle whose input electricity is entirely generated by renewable sources, which of course would be preferable, but under current and foreseeable circumstances in Europe such a solution is likely to remain marginal. The problem is particularly difficult with respect to plug-in hybrids because the proportion of the distances driven while under pure electric mode is of course unknowable in advance and is bound to vary widely according to circumstance, thereby making the CO2 attribution problem yet more complex. Moreover, it is worth noting that in an open European market there is no guarantee that a vehicle bought in one Member State market will not be used in another, and so it is not even possible to attribute CO2 emissions on a country by country basis. At best, a crude pan-European figure could be used to attribute the CO2 emissions per kWh generated, and then apply this figure to an electric vehicle with a given power consumption.
There are several strategies that could be adopted from a regulatory perspective at this point. A simple, but far from ideal, solution is to follow the course suggested above in table 6.4 and rate electric vehicles at an approximate pan-European CO2 emissions figure. A more robust approach is probably to go back to first principles and understand why CO2 emissions are regulated at all.
In essence the problem that regulation is seeking to resolve is that of energy inefficiency. The primary aim is therefore to reduce to an absolute minimum any waste of energy or, conversely to achieve the most efficient possible use of energy, no matter how that energy is obtained or transformed. Of course, the quest for energy efficiency is once that transcends the narrow concerns of the automotive industry or indeed the realisation of personal mobility, but equally the use of cars is one very important dimension that must be solved. In this regard, the 80 g/km target is merely a stepping stone, a partial way-marker, or a proxy indicator of what in reality must be a much deeper and more profound transformation. Even if a vehicle has zero CO2 emissions, indeed even if it is run entirely on renewable energy, there would still be a case for promoting the most energy efficient solution possible. Not least, even renewable power will have an investment cost, while the use in vehicles as opposed to elsewhere will have a large opportunity cost. Such a perspective has particular force when the relative paucity of renewable energy is considered, and compared with

Options to achieve 80g/km CO2 by 2020
Centre for Automotive Industry Research & ESRC BRASS Centre, Cardiff University, Cardiff, Wales, UK Page 104
the extravagance of contemporary energy consumption based on our collective use of fossil fuels. Put simply, in a low-carbon future it is likely that energy will be even more, not less, precious than now. Therefore the current political and policy obsession with carbon emissions must ultimately be replaced by a more coherent vision of sustainability – in transport as in other areas of life.
In regulating for this type of efficiency, therefore, the old basis of CO2 is effectively like using 20th Century metrics grounded in the technologies of the past when what is required is a 21st Century metric that no longer defines the technological solutions. Such a metric could be the use of kWh/km as a basic measure of efficiency and as a starting point for regulatory intervention. Clearly, regulating in terms of kWh/km would mark a significant departure for all concerned, be it the regulatory agencies, the vehicle manufacturers or indeed the wider public. It would not, however, preclude the search for improvements in electricity generation, distribution and conversion. Neither would it define the technology solution to be adopted, only the benchmark by which all solutions would be measured.

Options to achieve 80g/km CO2 by 2020
Centre for Automotive Industry Research & ESRC BRASS Centre, Cardiff University, Cardiff, Wales, UK Page 105
REFERENCES
ACEA (2009) European Automobile Industry Report 09/10, Brussels: European Automobile Manufacturers Association.
AEA (2008) Impacts of regulatory options to reduce CO2 emissions from cars, in particular on car
manufacturers, Final Report, AEA: Didcot.
AEA (July 2009) Assessment with respect to long term CO2 emission targets for passenger cars and vans: Final Report (AEA: London).
Aleklett, K. (2007), ‘Peak Oil and the Evolving Strategies of Oil Importing and Exporting Countries;
Facing the hard truth about import decline for OECD countries’, Discussion Paper No. 2007-17, December, Paris: OECD-International Transport Forum.
Anable, J. Mitchell, P. Layberry, R. (2006) Getting the genie back in the bottle: Limiting speed to reduce carbon emissions and accelerate the shift to low carbon vehicles, in Low CVP ‘Low Carbon Road Transport Challenge’ proposals to reduce road transport C02 emissions in the UK to help mitigate climate change, http://www.lowcvp.org.uk/assets/other/lowcvp_challenge_booklet.pdf. Audi (2009) Aluminium A5 coupe prototype shows the lighter side of Audi, copy obtained from http://green.autoblog.com/2009/10/01/audi-shows-off-lightweight-aluminum-carbon-fiber-a5-prototype/. Automotive News (2009), Green Cars; Nissan says zero-emission push timely amid crisis, Automotive News, July 8; www.autonews.com/apps/pbcs.dll/article?AID=/20090708/ANA02/307089965/. Accessed, 8.7.09. Automotive News (2009b), Reuters Autos Summit; Fisker picks distributor for Europe, Automotive News, November 3; www.autonews.com/apps/pbcs.dll/article?AID=/20091103/ANA05/311039911/. Accessed 3.11.09.
Avery, K. L., Myers, D.N., Cordell, B. and Harris, B.J. (2009) Evaluating the Sustainability of Passenger
Cars: Interventions and Trade-offs: A report to the Department for Environment, Food and Rural
Affairs. TRL Limited. Defra: London.
Barkholz, D. (2009), ‘ZF says driveline innovations could boost mileage 18%’, Automotive News
Europe, August 5; www.autonews.com/apps/pbcs.dll/article?AID=/20090805/COPY/308059992/1129&template=printart

Options to achieve 80g/km CO2 by 2020
Centre for Automotive Industry Research & ESRC BRASS Centre, Cardiff University, Cardiff, Wales, UK Page 106
Becker, T. A. (2009), Electric vehicles in the United States: A new model with forecasts to 2030, Berkeley, CA: Centre for Entrepreneurship and Technology.
Boyle, E. (2007) A study of entrepreneurial brand building in the manufacturing sector in the UK, Journal of Product & Brand Management, 12(2), 79-93. Capros, P., Kouvaritakis, N. and Mantzos, L. (2001) Economic Evaluation of Sectoral Emission
Reduction Objectives for Climate Change – Top-Down Analysis of Greenhouse Gas Emission Reduction
Possibilities in the EU Final Report. National Technical University Athens: Athens.
Casadei, A. and Broda, R. (2007) Impact of Vehicle Weight Reduction on Fuel Economy for Various
Vehicle Architectures, Copy obtained from http://www.autoaluminum.org/downloads/AluminumNow/Ricardo%20Study_with%20cover.pdf. CE Delft (2010) Green power for electric cars. Harvesting the climate potential of electric vehicles, http://www.greenpeace.org/eu-unit/press-centre/policy-papers-briefings/green-power-for-electric-cars-08-02-10#, Accessed 8/4/2010. CENEX & ARUP (2008) Investigation into the Scope for the Transport Sector to Switch to Electric
Vehicles and Plug-in Hybrid Vehicles (BERR & Department of Transport: London) http://www.berr.gov.uk/files/file48653.pdf Committee on Climate Change (2009), Meeting Carbon Budgets – the need for a step change;
Progress report to Parliament, October, Committee on Climate Change: London.
Connaught (2009), www.connaughtengineering.co.uk, Accessed 28/10/09.
Cousins, S.H.; Bueno, J.G. and Coronado, O. P. (2007) Powering or de-powering future vehicles to reach low-carbon outcomes: the long term view 1930-2020, Journal of Cleaner Production, 15(11-12), 1022-1031. Daly, H. (1996) Beyond Growth; The Economics of Sustainable Development, Boston: Beacon Press DeCicco, J., F. Fung and F. An (2006), Global warming on the road: the climate impact of America’s
automobiles, New York, USA: Environmental Defense.
De Steiguer, J. (2006) The Origins of Modern Environmental Thought, Tucson AZ: University of Arizona Press.
Department of Transportation, National Highway Traffic Safety Administration (2006) Study of
feasibility and effects of reducing use of fuel for automobiles: The Energy Policy Act of 2005 – Report to
Congress. Available online at: www.nhtsa.gov/portal/site/nhtsa/menuitem.d0b5a45b55bfbe582f57529cdba046a0/

Options to achieve 80g/km CO2 by 2020
Centre for Automotive Industry Research & ESRC BRASS Centre, Cardiff University, Cardiff, Wales, UK Page 107
Deutsche Bank (2008), Electric Cars: Plugged In; Batteries must be included, www.d-incert.nl/fileadmin/klanten/D-Incert/webroot/Background_documents/DeutscheBank_Electric_Cars_Plugged_In_June2008.pdf
Dings, J. (2009a), Reducing CO2 Emissions from New Cars: A Study of Major Car Manufacturers’
Progress in 2008, Brussels: Transport & Environment.
Dings, J (2009b) How to Avoid and Electric Shock; Electric Cars, from Hype to Reality, Brussels: European Federation for Transport and Environment.
Doucet, P. (2008) Les voitures sans permis au banc d’essai, Le Figaro, 9 May; www.lefigaro.fr/automobile/2008/05/09/03001-20080509ARTFIG00342. Accessed 19/11/09.
EABEV (2009), Energy Consumption, CO2 Emissions and other considerations related to Battery
Electric Vehicles, 8 April, Brussels & Paris: European Association for Battery Electric Vehicles, downloaded from www.going-electric.org. Accessed 5/1/10.
Eberle, R. and Franze, H. (1998), ‘Modelling the use phase of passenger cars’, LCI Proceedings Total
Life Cycle Conference, SAE: Warrendale PA.
EEA (2009) Environmental impacts and impact on the electricity market of a large scale introduction of electric cars in Europe - Critical Review of Literature. ETC/ACC Technical Paper 2009/4. Ericsson, E. (2001) Independent driving pattern factors and their influence on fuel-use and exhaust emission factors, Transportation Research Part D: Transport and Environment, 6(5), 325-345. ETSC (2008) German Autobahn: the speed limit debate, Speed Fact Sheet 01, Copy obtained from http://www.etsc.eu/documents/Speed_Fact_Sheet_1.pdf. Accessed 5th November 2009. Europcar (2009) ‘85% of Brits have changed car use to cut costs’, Europcar press release, 28/11/09.
European Commission, ‘Communication on the review of the Community Strategy to reduce CO2 emissions from passenger cars and light-commercial vehicles’ COM (2007) 19 Final. European Commission, ‘Communication on implementing the Community Lisbon Programme: A Strategy for the simplification of the regulatory environment’ COM (2005) 535 final. European Commission, ‘Communication to reduce CO2 emissions from passenger cars and improve fuel economy’ COM (1995) 689. European Commission, Directive 2008/50/EC on ambient air quality and cleaner air for Europe OJ [2008] L152/1

Options to achieve 80g/km CO2 by 2020
Centre for Automotive Industry Research & ESRC BRASS Centre, Cardiff University, Cardiff, Wales, UK Page 108
European Commission, Directive 2007/46/EC establishing a framework for the approval of motor vehicles and their trailers, and of systems, components and separate technical units intended for such vehicles OJ {2007} L263/1. European Commission, Directive 2006/40/EC relating to emissions from air-conditioning systems in motor vehicles and amending Directive 70/156 OJ [2006] L161/12. European Commission, Regulation (EC) 661/2009 concerning type-approval requirements for the general safety of motor vehicles, their trailers and systems, components and separate technical units intended therefore OJ [2009] L200/1. European Commission, Regulation (EC) 443/2009 setting emission performance standards for new passenger cars as part of the Community’s integrated approach to reduce CO2 emissions from light-duty vehicles. European Commission Enterprise and Industry Directorate-General (2006) CARS 21: A Competitive
Automotive Regulatory System for the 21st Century – Final Report (European Commission: Brussels). Fiat (2009), ‘Fiat sets new record for lowest CO2 emissions’, FIAT UK press release, 17 September; from www.newspress.co.uk/np-protected/releases/arc_sep_2009/58638fia.htm
Friedrich, A. (2008) The technology pathway to clean and efficient road transport, presented at FIA
workshop, Paris 15-16 May.
GMD (2009) Gordon Murray Design & Zytek Automotive announce electric city car programme, GMD Press Release; Shalford: Gordon Murray Design.
Greenpeace (2008) Energy [r]evolution. A sustainable EU 27 energy outlook.
Hart, S. (1997), ‘Beyond greening: strategies for a sustainable world’, Harvard Business Review, Jan-Feb, 66-76.
Helweg-Larsen, T. and Bull, J. (2007), Zero Carbon Britain; an Alternative Energy Strategy, Machynlleth: Centre for Alternative Technology.
Hoogma, R.; Kemp, R.; Schot, J. and Truffer, B. (2002) Experimenting for Sustainable Transport. The
Approach of Strategic Niche Management, London: Spon Press.
Heinberg, R. (2005), The party’s over: oil, war and the fate of industrialised societies, Gabriola Island, BC: New Society Publishers.
Heinberg, R. (2007), Peak Everything; Waking up to the century of declines, Gabriola Island, BC: New Society Publishers.
Howarth, A. (1987), Africar; The Development of a Car for Africa, Lancaster: The Ordinary Road.

Options to achieve 80g/km CO2 by 2020
Centre for Automotive Industry Research & ESRC BRASS Centre, Cardiff University, Cardiff, Wales, UK Page 109
IEA (2009), World Energy Outlook 2009 Factsheet: Global Energy Trends, International Energy Agency, available at http://www.iea.org/press/pressdetail.asp?PRESS_REL_ID=294 (accessed 15 January 2010).
Jochem, E., Schön, M., Angerer, G., Ball, M., Bradke, H., Celik, B., Eichhammer, W., Mannsbart, W., Marscheider-Weidemann, F., Nathani, C., Walz, R. And Wietschel, M. (2004), Werkstoffeffizienz –
Einsparpotenzial bei Herstellung und Verwendung energieintensiver Grundstoffe, Fraunhofer IRB Verlag.
Kable, G. (2007) ‘F700 shines light on next S-class’, Autocar, 12 September, 12-13. Kågeson, P. (2005) Reducing CO2 Emissions from New Cars, A T&E publication in association with Gröna Bilister, Copy obtained from http://www.transportenvironment.org/docs/Publications/2005pubs/05-1_te_co2_cars.pdf. Accessed 13th November 2009. Keegan, P. (2009) Zipcar - The best new idea in business, http://money.cnn.com/2009/08/26/news/companies/zipcar_car_rentals.fortune/index.htm. Accessed 7/9/2009.
Kendall, G. (2008), Plugged In; The end of the oil age, Brussels: WWF European Policy Office.
King, J. (2007) The King Review of Low Carbon Cars, Part 1: the potential for CO2 reduction, Norwich: HMSO; also at: www.hm-treasury.gov.uk/king
Lampinen, M. (2008a) Israel: Israel Corp commits to invest additional US$15.5m in Project Better Place, http://www.automotiveworld.com/news/emerging-markets/69439. Accessed 27/8/2009.
Lampinen, M. (2008b) Israel: Better Place to import US-built electric cars for field tests, http://www.automotiveworld.com/news/emerging-markets/72167. Accessed 27/8/2009.
LowCVP (2009), ‘DfT Research shows consumers willing to pay more for higher fuel economy’, LowCVP Newsletter, 29/1/09.
Lynas, M. (2007), Six degrees: our future on a hotter planet, London, UK: Fourth Estate.
McDonough, W. & Braungart, M. (2002), Cradle to Cradle; Remaking the way we make things, New York: North Point Press.
McKinsey (2003), HAWK 2015: Knowledge-based changes in the automotive value chain, New York: McKinsey & Co.
McKinsey (2009), Roads toward a low-carbon future: reducing CO2 emissions from passenger vehicles
in the global road transportation system, New York: McKinsey & Co. Inc.
Maxton, G. and Wormald, J. (2004), Time for a Model Change; Re-engineering the Global Automotive
Industry, Cambridge: University Press.

Options to achieve 80g/km CO2 by 2020
Centre for Automotive Industry Research & ESRC BRASS Centre, Cardiff University, Cardiff, Wales, UK Page 110
Mega (2009) ‘Gogo electric taps into the mood of Londoners’, Aixam-Mega press release 19 November.
Michelin (2009), ‘Michelin Energy Saver’, www.michelin.co.uk/michelinuk/en/auto-utilitaires/avantages/20070312100246.html. Accessed 27/10/09.
Mills, A. (2002) Carbon car comes of age, Materials World, 10(9), 21-22.
Moles, R., Foley, W. & O’Regan, B. (2006), ‘The environmental impacts of private car transport on the sustainability of Irish settlements’, in Davenport, J. and Davenport J. L. (eds), The Ecology of
Transportation: Managing mobility for the environment, Dordrecht: Springer.
Nagley, J. (2009), ‘Extended scrappage scheme will have environmental benefits’, www.cleangreencars.co.uk, Accessed 29/9/09.
Nieuwenhuis, P. (1995),’The impact of environmental legislation on the automotive industry’, Proceedings of the 1995 Business Strategy and the Environment Conference, 20/9-21/9, University of Leeds, Shipley, ERP Environment, 177-182. Nieuwenhuis, P. & Wells , P. (1997), The Death of Motoring?; Car Making and Automobility in the 21st Century, Chichester, John Wiley, ISBN 0-471-97084-0. Nieuwenhuis, P. (2004) 2003- Fuel Cell Year Zero, Automotive Environment Analyst, Issue No. 105, February, 36-37. Nieuwenhuis, P. (2006) ‘The car reinvented’, AWK Automotive Environment Analyst,
Nieuwenhuis, P. (2007), Car CO2 Reduction Feasibility Assessment; is 130 g/km possible?; special report, Cardiff: BRASS: www.brass.cf.ac.uk .
Nieuwenhuis, P. (2009a) ‘Division in Scandinavia: Sweden and Norway disagree on approach to green cars’, Automotive World Environment Monthly Digest, Issue No.164, Febuary, 30-32. Nieuwenhuis, P. (2009b), ‘The introduction of fuel cell technologies in the automotive industry: state of the art and perspectives’, Pogutz, S., Russo, A. and Migliavacca, P. (eds), Innovation, Markets
and Sustainable Energy; The Challenge of Hydrogen and Fuel Cells, Cheltenham: Edward Elgar.
Nieuwenhuis, P. Cope, P. and Armstrong, J. (1992), The Green Car Guide, London: Green Print.
Nieuwenhuis, P., and Wells, P. (1997) The Death of Motoring?; Car making and automobility in the
21st century, Chichester: John Wiley & Sons.
Nieuwenhuis, P. and Wells, P. (2003), The Automotive Industry and the Environment; A technical,
business and social future, Cambridge: Woodhead.
Nieuwenhuis P and Wells P (2009) Car Futures; Rethinking the Automotive Industry Beyond the
American Model, Warminster: Trend Tracker; also from; www.trendtracker.co.uk .
Options to achieve 80g/km CO2 by 2020
Centre for Automotive Industry Research & ESRC BRASS Centre, Cardiff University, Cardiff, Wales, UK Page 111
Orsato, R. (2009) When does it pay to be green? New York: Palgrave Macmillan.
Proctor, T. (2008a) US: Better Place wins California Governor's support for EV re-charging network, http://www.automotiveworld.com/news/environment/72610. Accessed 27th August 2009.
Proctor, T. (2008b) US: Hawaii added to Better Place's tally of EV infrastructure partners, http://www.automotiveworld.com/news/environment/72913. Accessed 27th August 2009.
Proctor, T. (2008c) Japan: Better Place joins government-sponsored EV feasibility study with Mitsubishi and Subaru, http://www.automotiveworld.com/news/environment/73100. Accessed 27/8/2009.
Proctor, T. (2008d) Australia: Better Place, AGL Energy and Macquarie Capital in AUS$1bn recharging network plan, http://www.automotiveworld.com/news/environment/71840. Accessed 27/8/2009.
Proctor, T. (2009e) Canada: Better Place signs EV infrastructure partnership with Ontario government, http://www.automotiveworld.com/news/environment/73953. Accessed 27/8/2009/
Riley, R. (1994) Alternative Cars in the 21st Century: A New Personal Transportation Paradigm, Warrendale PA, SAE .
Ryan, L. and Turton, H. (2007) Sustainable Automobile Transport: Shaping Climate Change Policy, Cheltenham, UK: Edward Elgar.
Schewel, L. (2008) Triple Safety: Lightweighting Automobiles to Improve Occupant, Highway, and Global Safety, SAE Paper 2008-01-2182. Copy obtained from http://www.rmi.org/images/PDFs/Transportation/SAE_TripleSafetyPaper_2008-01-1282_LS.pdf. Schipper, L. (2007) Automobile Fuel; Economy and CO2 Emissions in Industrialized Countries:
Troubling Trends through 2005/6, Working Paper, EMBARQ, the World Resources Institute Center for Sustainable Transport. Copy obtained from www.embarq.wri.org Accessed 3/11/2009. Seredynski, P. (2007) 500 – horsepower club, MSN Autos, http://editorial.autos.msn.com/article.aspx?cp-documentid=435332, Accessed 5/11/2009. Shnayerson, M. (1996), The Car that Could; The inside story of GM’s revolutionary electric vehicle, New York: Random House.
Society for Motoring Manufacturers and Traders Limited (SMMT) (2007b), 9th sustainability report, London, UK: Society of Motor Manufacturers and Traders.
Sperling, D., Salon, D., & Friedman, D. (2000), California’s ZEV/LEV Program ,Update of report RR-99-14, Davis CA: Institute of Transportation Studies, University of California (available from their website:www.its.ucdavis.edu).
Options to achieve 80g/km CO2 by 2020
Centre for Automotive Industry Research & ESRC BRASS Centre, Cardiff University, Cardiff, Wales, UK Page 112
Sperling, D. and Cannon, J.S. (eds) (2007), Driving climate change: cutting carbon from
transportation, Burlington, MA: Academic Press Elsevier.
Sperling, D. and D. Gordon (2009), Two Billion Cars; Driving toward sustainability, Oxford: University Press.
Staley, S. (2008), Mobility First: A new vision for transportation in a globally competitive twenty-first
century, Lanham, MD: Rowman and Littlefield.
Stern, N. (2006), The Stern Review; The Economics of Climate Change, London: HM Treasury; www.hm-treasury.gov.uk/stern_review_report.htm
Stolwijk, H. (2007), Alle Auto’s 2008, KNAC Autojaarboek, Alkmaar: Alk.
www.think.no
TechnoAssociates (2009) ‘Moves of automobile manufacturers and battery manufacturers around automotive lighium-ion batteries’, E2A Forum White Paper, Vol. 008, Tokyo: TechnoAssociates Inc.
TNO., IEEP and LAT (October 2006) Review and analysis of the reduction potential and costs of
technological and other measures to reduce CO2 emissions from passenger cars: Final Report (TNO: Delft).
Tremlett, G. (2009) Madrid reverses the chargers with electric car plan, The Guardian, 9 September, p19.
UKERC (2006) Quick hits: 2 limiting speed, copy obtained from http://www.eci.ox.ac.uk/research/energy/downloads/qh2-limitingspeed.pdf. Accessed 12/11/2009. Van de Sand, I., Acosta-Fernandez, J. and Bringezu, S. (2007), Abschätzung von Potenzialen zur
Verringerung des Ressourcenverbrauchs im Automobilsektor, Wuppertal: Institut für Klima, Umwelt, Energie.
Vermeulen, R.J. (2006) The effects of a range of measures to reduce the tail pipe emissions and/or the
fuel consumption of modern passenger cars on petrol and diesel, TNO report IS-RPT-033-DTS-2006-01695, Copy obtained from http://www.ecodrive.org/fileadmin/dam/ecodrive/Downloads/TNO-rapport_HNR_GSI_en_emissies_2006.pdf.
Wakefield, E. (1998), History of the Electric Automobile; Hybrid Electric Vehicles, Warrendale PA: SAE.
Way, A. (2009) Luxury motoring, battery style, Motor Industry Magazine, November, 4.

Options to achieve 80g/km CO2 by 2020
Centre for Automotive Industry Research & ESRC BRASS Centre, Cardiff University, Cardiff, Wales, UK Page 113
WBCSD (2005) Vehicle Technologies other than Propulsion Systems, World Business Council for Sustainable Development.
WEC (2007), ‘Energy and Climate Change study’, World Energy Council, available at http://www.worldenergy.org/documents/wec_study_energy_climate_change_online.pdf Accessed 12/2/2009).
Weizsaecker, E von; A. B. Lovins, L. H. Lovins (1997) Factor four: doubling wealth – halving resource
use, London: Earthscan
Williams, A. (2008) Project Better Place – the road to an electric future? http://www.automotiveworld.com/news/environment/69022. Accessed 12th May, 2009.
Wohlecker, R.; Johannaber, M. and Espig, M. (2007) Determination of Weight Elasticity of Fuel Economy for ICE, Hybrid and Fuel Cell Vehicles, SAE Paper 2007-01-0343. (Abstract only obtained from http://www.worldautosteel.org/Projects/MassReduction/FuelEfficiency.aspx)