lower san diego river water quality 2013 san diego river water quality - 2013 table of ... entrance...
TRANSCRIPT
LOWER SAN DIEGO RIVER WATER QUALITY 2013
Water Quality Monitoring Report Appendices sA-sF
Site 8 - Old Mission Dam
Support ing Water Qual i ty Monitoring Data for the Lower San Diego River
John C. Kennedy, PE
November 2013
S A N D I E G O R I V E R P A R K F O U N D A T I O N
P O B o x 8 0 1 2 6 , S a n D i e g o , C A 9 2 1 3 8 • t e l e p h o n e : 6 1 9 2 9 7 7 3 8 0 • f a x : 6 1 9 2 9 7 7 3 8 5 • i n f o @ S a n D i e g o R i v e r. o r g
Lower San Diego River Water Quality - 2013
Table of Contents (WQM Report - separate document)
Section 1. Introduction Section 2. LSDR Spatial Water Quality WY13/12 Section 3. LSDR Temporal Water Quality WY13/12Section 4. WY13 WQIndex Compared to Prior Years
WY13 WQM Report Supplemental Appendices Table of Contents
E. SD RiverWatch WQ Monitoring Program ................................................... pg E1-E4 Table E.1 LSDR Sections, Reaches and Monitoring Sites Table E.2 - LSDR WQM Site Information! Table E.3 - LSDR Water Quality Monitoring Parameters! Figure E.1 - Lower San Diego River Catchment and WQM SitesF. LSD River Hydrology and Water Quality ..................................................... pg F1-F3 Table F.1 - Lower SDR Average Daily Flows (WY05-WY13) !! Table F.2 - Rainfall and Long-Term Average Daily Flow (1914-2013)!! Table F.3 - Annual Rainfall and Average Daily Flow (WY05-WY13)! Charts F.1 - B.3 LSDR Hydrologic DataG. 2013 Monthly WQM Data by Site ................................................................. pg G1-G7
Table G.1 West, Mid & East Section Water Temperature Table G.2 West, Mid & East Section pHTable G.3 West, Mid & East Section Specific ConductivityTable G.4 West, Mid & East Section Dissolved Oxygen ConcentrationTable G.5 West, Mid & East Section DO as Percent of Saturation
H. 2013 Monthly WQ Data (by Others) ............................................................. pg H1-H2Table H.1 USGS San Diego River Stream Flow Table H.2 SDCW San Diego River Coliform Bacteria Counts
I. Water Quality Indexing and WQIs by River Site ....................................... pg I1-I2 Table I.1 WY13 WQI Values by WQM Site - West Section! Table I.2 WY13 WQI Values by LSDR WQM Site - Mid & East SectionsJ. WQM Data Summary (WY05-WY13) ............................................................ pg J1-J2 Table J.1 WQM Data Summary (Annual & Seasonal Averages)! Table J.2 WQM Data Summary (9-Yr Spatial Averages)! Charts J.1-J.3
Questions regarding the San Diego River WQM database or interpretation of results expressed in these appendices can be directed to the attention of the report’s author, John C. Kennedy, through contacting SDRPF at [email protected], or the RiverWatch Coordinator at 619-297-7380.
L o w e r S a n D i e g o R i v e r W Y 11 Wa t e r Q u a l i t y M o n i t o r i n g R e p o r t A p p e n d i c e s
S D R P F - R i v e r Wa t c h i D e c e m b e r 2 0 11!
Appendix E - San Diego RiverWatch WQ Monitoring Program
Appendix E provides an overview of SDRPF’s RiverWatch water quality monitoring (WQM) program that, over the past 9 years, has been continuously engaged in collecting and evaluating data pertaining to the Lower San Diego River (LSDR) watershed on a monthly basis.
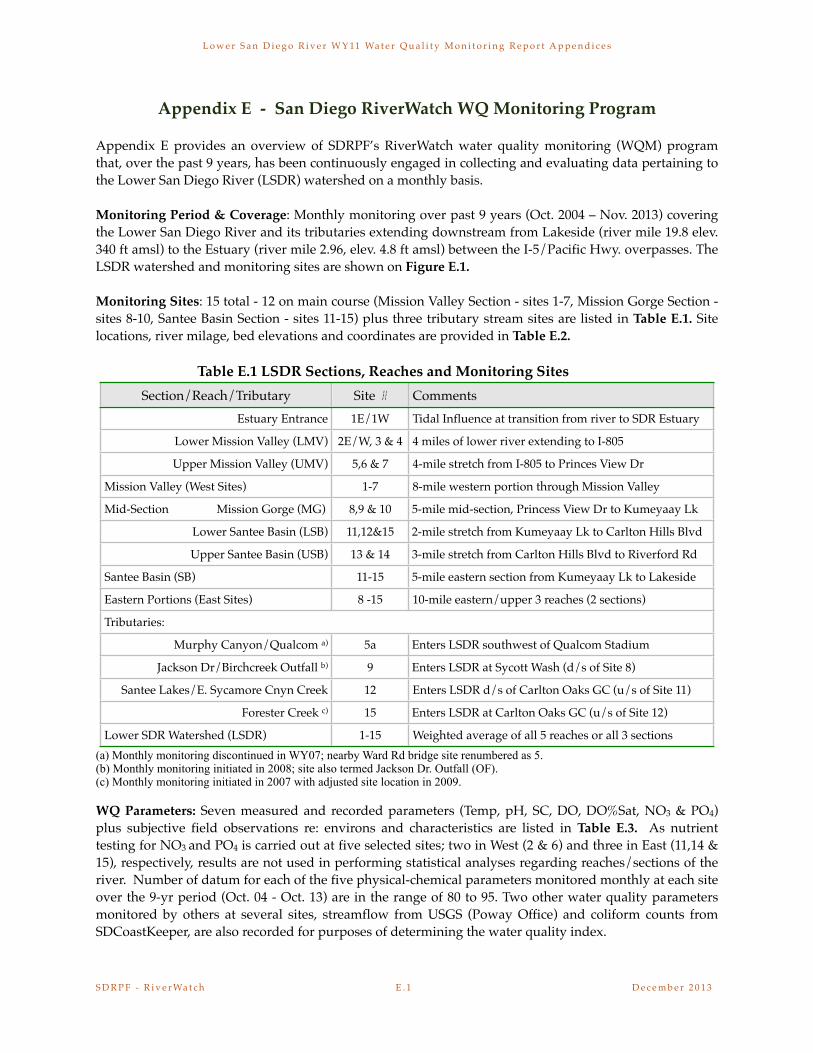
Monitoring Period & Coverage: Monthly monitoring over past 9 years (Oct. 2004 – Nov. 2013) covering the Lower San Diego River and its tributaries extending downstream from Lakeside (river mile 19.8 elev. 340 ft amsl) to the Estuary (river mile 2.96, elev. 4.8 ft amsl) between the I-5/Pacific Hwy. overpasses. The LSDR watershed and monitoring sites are shown on Figure E.1. Monitoring Sites: 15 total - 12 on main course (Mission Valley Section - sites 1-7, Mission Gorge Section - sites 8-10, Santee Basin Section - sites 11-15) plus three tributary stream sites are listed in Table E.1. Site locations, river milage, bed elevations and coordinates are provided in Table E.2.
Table E.1 LSDR Sections, Reaches and Monitoring SitesSection/Reach/Tributary Site # Comments
Estuary Entrance 1E/1W Tidal Influence at transition from river to SDR Estuary
Lower Mission Valley (LMV) 2E/W, 3 & 4 4 miles of lower river extending to I-805
Upper Mission Valley (UMV) 5,6 & 7 4-mile stretch from I-805 to Princes View Dr
Mission Valley (West Sites) 1-7 8-mile western portion through Mission Valley
Mid-Section Mission Gorge (MG) 8,9 & 10 5-mile mid-section, Princess View Dr to Kumeyaay Lk
Lower Santee Basin (LSB) 11,12&15 2-mile stretch from Kumeyaay Lk to Carlton Hills Blvd
Upper Santee Basin (USB) 13 & 14 3-mile stretch from Carlton Hills Blvd to Riverford Rd
Santee Basin (SB) 11-15 5-mile eastern section from Kumeyaay Lk to Lakeside
Eastern Portions (East Sites) 8 -15 10-mile eastern/upper 3 reaches (2 sections)
Tributaries:Tributaries:Tributaries:
Murphy Canyon/Qualcom a) 5a Enters LSDR southwest of Qualcom Stadium
Jackson Dr/Birchcreek Outfall b) 9 Enters LSDR at Sycott Wash (d/s of Site 8)
Santee Lakes/E. Sycamore Cnyn Creek 12 Enters LSDR d/s of Carlton Oaks GC (u/s of Site 11)
Forester Creek c) 15 Enters LSDR at Carlton Oaks GC (u/s of Site 12)
Lower SDR Watershed (LSDR) 1-15 Weighted average of all 5 reaches or all 3 sections (a) Monthly monitoring discontinued in WY07; nearby Ward Rd bridge site renumbered as 5. (b) Monthly monitoring initiated in 2008; site also termed Jackson Dr. Outfall (OF).(c) Monthly monitoring initiated in 2007 with adjusted site location in 2009.
WQ Parameters: Seven measured and recorded parameters (Temp, pH, SC, DO, DO%Sat, NO3 & PO4) plus subjective field observations re: environs and characteristics are listed in Table E.3. As nutrient testing for NO3 and PO4 is carried out at five selected sites; two in West (2 & 6) and three in East (11,14 & 15), respectively, results are not used in performing statistical analyses regarding reaches/sections of the river. Number of datum for each of the five physical-chemical parameters monitored monthly at each site over the 9-yr period (Oct. 04 - Oct. 13) are in the range of 80 to 95. Two other water quality parameters monitored by others at several sites, streamflow from USGS (Poway Office) and coliform counts from SDCoastKeeper, are also recorded for purposes of determining the water quality index.
L o w e r S a n D i e g o R i v e r W Y 11 Wa t e r Q u a l i t y M o n i t o r i n g R e p o r t A p p e n d i c e s
S D R P F - R i v e r Wa t c h E . 1 D e c e m b e r 2 0 1 3!
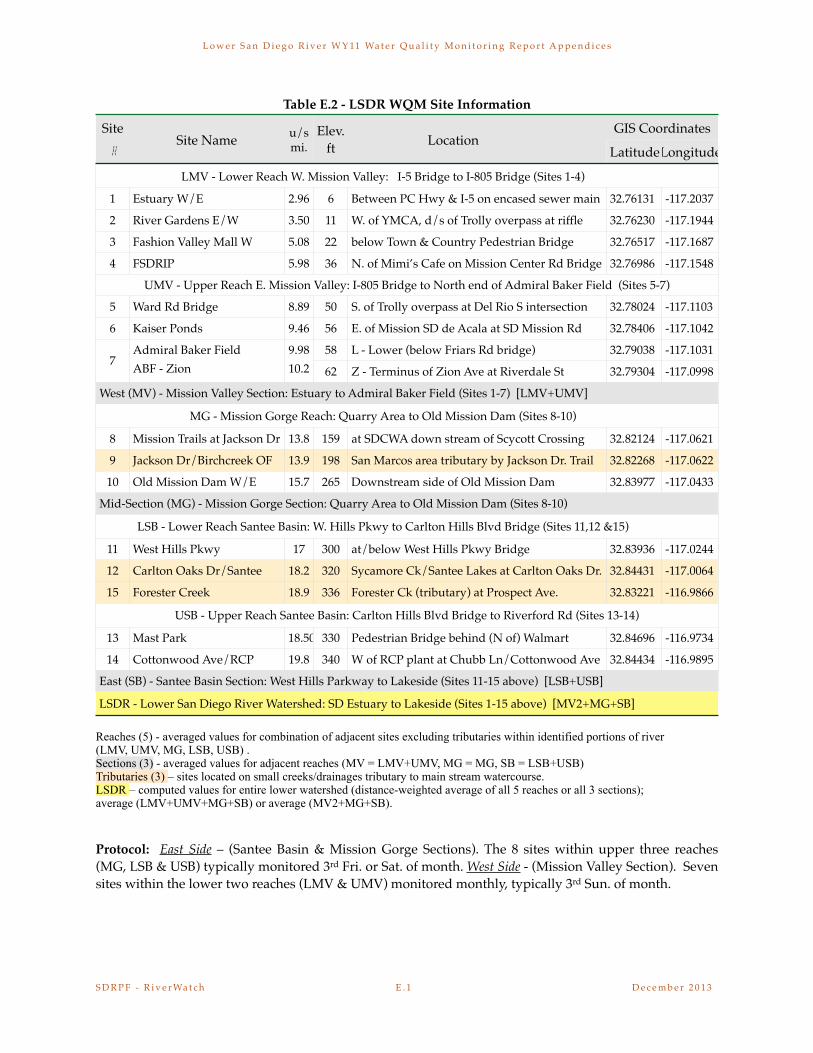
Table E.2 - LSDR WQM Site Information
Site #
Site Name u/s mi.
Elev. ft Location
GIS CoordinatesGIS CoordinatesSite #
Site Name u/s mi.
Elev. ft Location
LatitudeLongitude
LMV - Lower Reach W. Mission Valley: I-5 Bridge to I-805 Bridge (Sites 1-4)LMV - Lower Reach W. Mission Valley: I-5 Bridge to I-805 Bridge (Sites 1-4)LMV - Lower Reach W. Mission Valley: I-5 Bridge to I-805 Bridge (Sites 1-4)LMV - Lower Reach W. Mission Valley: I-5 Bridge to I-805 Bridge (Sites 1-4)LMV - Lower Reach W. Mission Valley: I-5 Bridge to I-805 Bridge (Sites 1-4)LMV - Lower Reach W. Mission Valley: I-5 Bridge to I-805 Bridge (Sites 1-4)LMV - Lower Reach W. Mission Valley: I-5 Bridge to I-805 Bridge (Sites 1-4)
1 Estuary W/E 2.96 6 Between PC Hwy & I-5 on encased sewer main 32.76131 -117.2037
2 River Gardens E/W 3.50 11 W. of YMCA, d/s of Trolly overpass at riffle 32.76230 -117.1944
3 Fashion Valley Mall W 5.08 22 below Town & Country Pedestrian Bridge 32.76517 -117.1687
4 FSDRIP 5.98 36 N. of Mimi’s Cafe on Mission Center Rd Bridge 32.76986 -117.1548
UMV - Upper Reach E. Mission Valley: I-805 Bridge to North end of Admiral Baker Field (Sites 5-7)UMV - Upper Reach E. Mission Valley: I-805 Bridge to North end of Admiral Baker Field (Sites 5-7)UMV - Upper Reach E. Mission Valley: I-805 Bridge to North end of Admiral Baker Field (Sites 5-7)UMV - Upper Reach E. Mission Valley: I-805 Bridge to North end of Admiral Baker Field (Sites 5-7)UMV - Upper Reach E. Mission Valley: I-805 Bridge to North end of Admiral Baker Field (Sites 5-7)UMV - Upper Reach E. Mission Valley: I-805 Bridge to North end of Admiral Baker Field (Sites 5-7)UMV - Upper Reach E. Mission Valley: I-805 Bridge to North end of Admiral Baker Field (Sites 5-7)
5 Ward Rd Bridge 8.89 50 S. of Trolly overpass at Del Rio S intersection 32.78024 -117.1103
6 Kaiser Ponds 9.46 56 E. of Mission SD de Acala at SD Mission Rd 32.78406 -117.1042
7Admiral Baker Field ABF - Zion
9.98 10.2
58 L - Lower (below Friars Rd bridge) 32.79038 -117.10317
Admiral Baker Field ABF - Zion
9.98 10.2 62 Z - Terminus of Zion Ave at Riverdale St 32.79304 -117.0998
West (MV) - Mission Valley Section: Estuary to Admiral Baker Field (Sites 1-7) [LMV+UMV]West (MV) - Mission Valley Section: Estuary to Admiral Baker Field (Sites 1-7) [LMV+UMV]West (MV) - Mission Valley Section: Estuary to Admiral Baker Field (Sites 1-7) [LMV+UMV]West (MV) - Mission Valley Section: Estuary to Admiral Baker Field (Sites 1-7) [LMV+UMV]West (MV) - Mission Valley Section: Estuary to Admiral Baker Field (Sites 1-7) [LMV+UMV]West (MV) - Mission Valley Section: Estuary to Admiral Baker Field (Sites 1-7) [LMV+UMV]West (MV) - Mission Valley Section: Estuary to Admiral Baker Field (Sites 1-7) [LMV+UMV]
MG - Mission Gorge Reach: Quarry Area to Old Mission Dam (Sites 8-10)MG - Mission Gorge Reach: Quarry Area to Old Mission Dam (Sites 8-10)MG - Mission Gorge Reach: Quarry Area to Old Mission Dam (Sites 8-10)MG - Mission Gorge Reach: Quarry Area to Old Mission Dam (Sites 8-10)MG - Mission Gorge Reach: Quarry Area to Old Mission Dam (Sites 8-10)MG - Mission Gorge Reach: Quarry Area to Old Mission Dam (Sites 8-10)MG - Mission Gorge Reach: Quarry Area to Old Mission Dam (Sites 8-10)
8 Mission Trails at Jackson Dr 13.8 159 at SDCWA down stream of Scycott Crossing 32.82124 -117.0621
9 Jackson Dr/Birchcreek OF 13.9 198 San Marcos area tributary by Jackson Dr. Trail 32.82268 -117.0622
10 Old Mission Dam W/E 15.7 265 Downstream side of Old Mission Dam 32.83977 -117.0433
Mid-Section (MG) - Mission Gorge Section: Quarry Area to Old Mission Dam (Sites 8-10) Mid-Section (MG) - Mission Gorge Section: Quarry Area to Old Mission Dam (Sites 8-10) Mid-Section (MG) - Mission Gorge Section: Quarry Area to Old Mission Dam (Sites 8-10) Mid-Section (MG) - Mission Gorge Section: Quarry Area to Old Mission Dam (Sites 8-10) Mid-Section (MG) - Mission Gorge Section: Quarry Area to Old Mission Dam (Sites 8-10) Mid-Section (MG) - Mission Gorge Section: Quarry Area to Old Mission Dam (Sites 8-10) Mid-Section (MG) - Mission Gorge Section: Quarry Area to Old Mission Dam (Sites 8-10)
LSB - Lower Reach Santee Basin: W. Hills Pkwy to Carlton Hills Blvd Bridge (Sites 11,12 &15)LSB - Lower Reach Santee Basin: W. Hills Pkwy to Carlton Hills Blvd Bridge (Sites 11,12 &15)LSB - Lower Reach Santee Basin: W. Hills Pkwy to Carlton Hills Blvd Bridge (Sites 11,12 &15)LSB - Lower Reach Santee Basin: W. Hills Pkwy to Carlton Hills Blvd Bridge (Sites 11,12 &15)LSB - Lower Reach Santee Basin: W. Hills Pkwy to Carlton Hills Blvd Bridge (Sites 11,12 &15)LSB - Lower Reach Santee Basin: W. Hills Pkwy to Carlton Hills Blvd Bridge (Sites 11,12 &15)LSB - Lower Reach Santee Basin: W. Hills Pkwy to Carlton Hills Blvd Bridge (Sites 11,12 &15)
11 West Hills Pkwy 17 300 at/below West Hills Pkwy Bridge 32.83936 -117.0244
12 Carlton Oaks Dr/Santee 18.2 320 Sycamore Ck/Santee Lakes at Carlton Oaks Dr. 32.84431 -117.0064
15 Forester Creek 18.9 336 Forester Ck (tributary) at Prospect Ave. 32.83221 -116.9866
USB - Upper Reach Santee Basin: Carlton Hills Blvd Bridge to Riverford Rd (Sites 13-14) USB - Upper Reach Santee Basin: Carlton Hills Blvd Bridge to Riverford Rd (Sites 13-14) USB - Upper Reach Santee Basin: Carlton Hills Blvd Bridge to Riverford Rd (Sites 13-14) USB - Upper Reach Santee Basin: Carlton Hills Blvd Bridge to Riverford Rd (Sites 13-14) USB - Upper Reach Santee Basin: Carlton Hills Blvd Bridge to Riverford Rd (Sites 13-14) USB - Upper Reach Santee Basin: Carlton Hills Blvd Bridge to Riverford Rd (Sites 13-14) USB - Upper Reach Santee Basin: Carlton Hills Blvd Bridge to Riverford Rd (Sites 13-14)
13 Mast Park 18.50 330 Pedestrian Bridge behind (N of) Walmart 32.84696 -116.9734
14 Cottonwood Ave/RCP 19.8 340 W of RCP plant at Chubb Ln/Cottonwood Ave 32.84434 -116.9895
East (SB) - Santee Basin Section: West Hills Parkway to Lakeside (Sites 11-15 above) [LSB+USB]East (SB) - Santee Basin Section: West Hills Parkway to Lakeside (Sites 11-15 above) [LSB+USB]East (SB) - Santee Basin Section: West Hills Parkway to Lakeside (Sites 11-15 above) [LSB+USB]East (SB) - Santee Basin Section: West Hills Parkway to Lakeside (Sites 11-15 above) [LSB+USB]East (SB) - Santee Basin Section: West Hills Parkway to Lakeside (Sites 11-15 above) [LSB+USB]East (SB) - Santee Basin Section: West Hills Parkway to Lakeside (Sites 11-15 above) [LSB+USB]East (SB) - Santee Basin Section: West Hills Parkway to Lakeside (Sites 11-15 above) [LSB+USB]
LSDR - Lower San Diego River Watershed: SD Estuary to Lakeside (Sites 1-15 above) [MV2+MG+SB]LSDR - Lower San Diego River Watershed: SD Estuary to Lakeside (Sites 1-15 above) [MV2+MG+SB]LSDR - Lower San Diego River Watershed: SD Estuary to Lakeside (Sites 1-15 above) [MV2+MG+SB]LSDR - Lower San Diego River Watershed: SD Estuary to Lakeside (Sites 1-15 above) [MV2+MG+SB]LSDR - Lower San Diego River Watershed: SD Estuary to Lakeside (Sites 1-15 above) [MV2+MG+SB]LSDR - Lower San Diego River Watershed: SD Estuary to Lakeside (Sites 1-15 above) [MV2+MG+SB]LSDR - Lower San Diego River Watershed: SD Estuary to Lakeside (Sites 1-15 above) [MV2+MG+SB]
Reaches (5) - averaged values for combination of adjacent sites excluding tributaries within identified portions of river (LMV, UMV, MG, LSB, USB) .Sections (3) - averaged values for adjacent reaches (MV = LMV+UMV, MG = MG, SB = LSB+USB)Tributaries (3) – sites located on small creeks/drainages tributary to main stream watercourse.LSDR – computed values for entire lower watershed (distance-weighted average of all 5 reaches or all 3 sections); average (LMV+UMV+MG+SB) or average (MV2+MG+SB).
Protocol: East Side – (Santee Basin & Mission Gorge Sections). The 8 sites within upper three reaches (MG, LSB & USB) typically monitored 3rd Fri. or Sat. of month. West Side - (Mission Valley Section). Seven sites within the lower two reaches (LMV & UMV) monitored monthly, typically 3rd Sun. of month.
L o w e r S a n D i e g o R i v e r W Y 11 Wa t e r Q u a l i t y M o n i t o r i n g R e p o r t A p p e n d i c e s
S D R P F - R i v e r Wa t c h E . 1 D e c e m b e r 2 0 1 3!

Table E.3 - LSDR Water Quality Monitoring Parameters
WQ Parameter unit CommentsMeasured monthly at all sites:Measured monthly at all sites:Measured monthly at all sites:
1. Temperature (Temp) oC Basic characteristic and WQ driver (Table C.1)
2. pH - Degree of acidity (<7.0) or alkalinity (>7.0) (Table C.3)
3. Specific Conductivity (SC) mS/cm Measure of ionic content or dissolved solids (Table C.2)
4. Dissolved Oxygen (DO) mg/L Good indicator of relative water quality (Table C.4)
5. Percent of DO Saturation (DO%Sat) % Good indicator of general water quality (Table C.5)
Sampled/tested monthly at selected sites: (typically 5 - 3 East & 2 West)Sampled/tested monthly at selected sites: (typically 5 - 3 East & 2 West)Sampled/tested monthly at selected sites: (typically 5 - 3 East & 2 West)
6. Nitrate (NO3-N) mg/L Important nutrient for biological activity
7. Phosphate (PO4-P) mg/L Key nutrient for biological activity
Discontinued on regular basis in 2006:Discontinued on regular basis in 2006:Discontinued on regular basis in 2006:
8. Turbidity NTU Discontinued due to inaccurate/invalid readings
9. Barometric Pressure mBars Suspended readings as external data readily available
Environmental Observations recorded at all sites:Environmental Observations recorded at all sites:Environmental Observations recorded at all sites:
Atypical or notable conditions (scum, discoloration, odors, etc.), trash/debris, homeless encampments, biological activity (aquatic, avian, terrestrial), expansion of invasive species, erosion, scouring, other noteworthy comments re: watercourse, shoreline and adjacent environs.
Atypical or notable conditions (scum, discoloration, odors, etc.), trash/debris, homeless encampments, biological activity (aquatic, avian, terrestrial), expansion of invasive species, erosion, scouring, other noteworthy comments re: watercourse, shoreline and adjacent environs.
Atypical or notable conditions (scum, discoloration, odors, etc.), trash/debris, homeless encampments, biological activity (aquatic, avian, terrestrial), expansion of invasive species, erosion, scouring, other noteworthy comments re: watercourse, shoreline and adjacent environs.
General WQ Conditions observed at all sites: (numerical coding added in 2010)General WQ Conditions observed at all sites: (numerical coding added in 2010)General WQ Conditions observed at all sites: (numerical coding added in 2010)
Weather Condition, Presence of Algae, Clarity, Color, Odor, Flow, Foam, Litter, Odor, Oil and Grease (O&G)Weather Condition, Presence of Algae, Clarity, Color, Odor, Flow, Foam, Litter, Odor, Oil and Grease (O&G)Weather Condition, Presence of Algae, Clarity, Color, Odor, Flow, Foam, Litter, Odor, Oil and Grease (O&G)
Parameters measured by others at selected sitesParameters measured by others at selected sitesParameters measured by others at selected sites
10. Coliform counts MPN/100mL
SDCoastKeeper data taken at Fashion Valley Rd and Old Mission Dam monitoring sites (Table H.2)
11. Stream Flow cfs USGS gauging stations at Fashion Valley and Mast Rd near Santee (Table H.1)
Team Leaders and multiple citizen volunteers (typically 3-8 persons) meet at an appointed site, organize field equipment/transportation, drive to sites, measure physical-chemical water quality using Sonde instrument, note special conditions/observations, collect samples for subsequent testing, return to office, perform nutrient (NO3 & PO4) tests, store samples for subsequent laboratory (e.g., sediment toxicity) analyses and clean/check-in/store field equipment.
Data Management: Water quality data are typically managed in a three-step process. 1. Raw (source) data - each site, several of which have two monitoring locations (e.g. upstream/downstream of dam, riffle or crossing), date/time, measured WQ parameters, and non-quantifiable supporting observations and comments. 2. Compiled (vetted/proofed) data - provided on Ecolayers w/date, site location, parameter value and additional observations of interest.3. Processed (formatted/aggregated) data - with statistical computations associated with LSDR sites, reaches, sections and tributaries for each WQ parameter of interest including those monitored by others.
L o w e r S a n D i e g o R i v e r W Y 11 Wa t e r Q u a l i t y M o n i t o r i n g R e p o r t A p p e n d i c e s
S D R P F - R i v e r Wa t c h E . 1 D e c e m b e r 2 0 1 3!

Statistical Computations: Various basic statistical values have been calculated from the data.! Mean – average of a series (sum of values divided by number of values)! Median – middle value of an ordered series (50% larger - 50% smaller)! Minimum – lowest or smallest value measured! Maximum – highest or greatest value measured! Range – Difference between maximum and minimum values
1st Quartile (Q1) – 25% of values smaller - 75% larger! 2nd Quartile (Q2) – 50% of values larger - 50% smaller (same as median value)! 3rd Quartile (Q3) – 75% of values smaller - 25% larger
Variance – sum of the squares of deviation from the mean or average valueStandard Deviation (SD) – square root of the variance
! Skew – third moment about the mean divided by the standard deviation (SD)! Coefficient of Variance (CoV)– Variance divided by the mean! Trend line - Moving average value taken over 12 month period
Figure E.1 - Lower San Diego River Catchment and WQM Sites
Color Code for LSDR reaches on figure above: Estuary (orange), LMV (purple), UMV (red), MG (dark green), LSB (violet), USB (dark blue), Lakeside (light green), tributaries (light blue). Figure details can be downloaded through Google Earth from SDRPF website/River Monitoring page: file <Fig1.1WQMR.kmz>
L o w e r S a n D i e g o R i v e r W Y 11 Wa t e r Q u a l i t y M o n i t o r i n g R e p o r t A p p e n d i c e s
S D R P F - R i v e r Wa t c h E . 1 D e c e m b e r 2 0 1 3!

Appendix F - LSDR Hydrology and Water Quality
Stream flow or discharge, the volume of water moving past a designated location over a fixed period of time, is a primary driver of changes in water quality. Flow, often expressed as cubic feet per second (cfs) or million gallons per day (mgd), constitutes the amount of water moving off a watershed into a watercourse, as affected by weather (increasing during rainstorms and decreasing during dry spells) and changing during different seasons. Flow decreases during summer months when rainfall is minimal, evaporation rates high and actively growing riparian vegetation extracts water from the ground. August and September are typically months of lowest flow. A function of both volume and velocity, stream flow has a major impact on living organisms, watercourse habitats and on overall water quality. Velocity of flow, typically increasing as volume increases, determines the kinds of organisms that live in the system and also affects the amount of silt and sediment thats transported. Fast moving watercourses usually contain higher levels of DO than slow streams, as they are better aerated.
LSDR average daily flow (ADF) values as recorded at the two USGS gauging stations in the lower watershed are expressed in Table F.1 for both the monitoring period (Oct 2004 - Oct 2013) and the past 48 years (1965-2013) of official records. The two averages are in close accord for both stations.
Table F.1 - Lower SDR Average Daily Flows (WY05-WY13)
Season West - Mission ValleyWest - Mission Valley East - Santee BasinEast - Santee Basin LSDR (a) LSDR (a) LSDR (a) LSDR (a)
Units (b) cfs mgd cfs mgdmgdmgd cfs mgdFall (Oct/Nov) 20.7 13 13.1 8.58.58.5 17 11
Winter (Dec-Mar) 83.6 54 45.9 303030 65 42
Spring (April/May) 18.7 12 12.2 888 15.5 10
Summer (June-Sept) 2.3 1.5 1.7 1.11.11.1 2.0 1.3
9-Yr Annual Avg. (2005-2013) 35.2 23 20.1 131313 27.6 18
48-Yr Annual Avg. (1965-2013) 36.3 23.5 21.7 141414 29.0 18.7
Total Annual Discharge, AF (c) 25,760/26,32025,760/26,320 14,560/15,68014,560/15,68014,560/15,680 20,165/20,94020,165/20,94020,165/20,940(a) Lower San Diego River average daily flow represents a mean hydrologic condition based on averaging the two USGS gauging station stream flow values. (b) ADF values are expressed in both cubic feet per second (cfs) and million gallons per day (mgd); 1 mgd = 1.547 cfs(c) Annual discharge volume expressed in acre-feet (1 AF = 325,900 gallons); 9- and 48-Yr averages.
Correlations between total annual rainfall and ADF considered over the past 99 years of hydrologic record and during the period of SDRPF RiverWatch monitoring for the two lower SDR gauging stations are presented in Tables F.2 and F.3, respectively. WY05 was a “Very Wet” hydrologic year, whereas WY07 was “Very Dry”. WY06 & 08 were both “Dry” years while WY09 & 10 were considered “Normal” in terms of both total annual rainfall and average daily flow. The 9-yr ADF in the East and West is 21 and 37 cfs, respectively; both values are approximately the same as the past 45- as well as 99-yr SDR average daily discharges.
Monthly discharge data (min, max and average daily flow) at the two gauging stations extending from Oct 2004 through Oct 2013 are presented in Chart F.1. Average daily flow (ADF) for the lower San Diego River varies from less than 1 cfs (0.6 mgd) during the summer (dry) months to nearly 200 cfs (130 mgd)during some winter (wet) seasons in the East (Santee Basin) and up to 380 cfs (246 mgd) in the West (Mission Valley) section. ADF values have been trending upward since WY07 as shown by the 12-month moving average.
L o w e r S a n D i e g o R i v e r W Y 11 Wa t e r Q u a l i t y M o n i t o r i n g R e p o r t A p p e n d i c e s
S D R P F - R i v e r Wa t c h F. 1 D e c e m b e r 2 0 1 3!

Table F.2 - Rainfall and Long-Term Average Daily Flow (1914-2013)
Type # of
YearsPercent of Total YearsPercent of Total Years
Total Annual Rainfall (a) Total Annual Rainfall (a) Total Annual Rainfall (a) Average Daily Flow, mgdAverage Daily Flow, mgdAverage Daily Flow, mgdAverage Daily Flow, mgdType
# of Years
Percent of Total YearsPercent of Total Years inches mm Avg., mm East (b)East (b) West (c) LSDR
Very Wet 3 3%
30%
>20 >500 580 68 113113 92
Wet 10 10% 30% 15-20 380-499 430 48 8181 66
Above Norm (d) 17 17%
30%
12-15 300-379 340 26 4444 35
Normal 38 39% 39% 8-12 200-299 245 10 1818 15
Dry 25 26%31%
5-8 125-199 160 7 1212 10
Very Dry 5 5%31%
<5 <125 100 5 99 7
Annual Avg. 99 100%100% 10.2 260 18 2828 23a) Total annual rainfall from 1 October through September 31. b) Santee Basin USGS Stream Gauge Station # 11022480 at Mast Roadc) Mission Valley USGS Stream Gauge Station # 11023000 at Fashion Valley Mall; incomplete data prior to 1968.d) Above normal annual rainfall (12-15 in/yr) resulting in LSDR average daily flows from 15 to 50 mgd.
Table F.3 - Annual Rainfall and Average Daily Flow (WY05-WY13)
(Type of Year)Annual RainfallAnnual RainfallAnnual RainfallAnnual Rainfall
Variance (a)ADF, mgdADF, mgdADF, mgdADF, mgdADF, mgd
Variance (d)(Type of Year)Annual RainfallAnnual RainfallAnnual RainfallAnnual Rainfall
Variance (a)East (b)East (b) West (c)West (c) LSDR
Variance (d)(Type of Year)mmmm inchesinches
Variance (a)East (b)East (b) West (c)West (c) LSDR
Variance (d)
WY05 (Very Wet) 571 22.4922.49 124%124% 32.9 64.864.8 4949 137%
WY06 (Dry) 154 6.066.06 -39%-39% 6.9 11.311.3 99 -57%
WY07 (Very Dry) 98 3.853.85 -61%-61% 4.6 8.38.3 66 -71%
WY08 (Dry) 184 7.257.25 -28%-28% 8.6 16.116.1 1212 -42%
WY09 (Below Normal) 232 9.159.15 -9%-9% 9.7 17.617.6 1414 -32%
WY10 (Normal) 268 10.5510.55 6%6% 16.2 27.527.5 2222 6%
WY11 (Above Normal) 321 12.6212.62 26%26% 25.1 39.939.9 3333 59%
WY12 (Dry) 204 8.038.03 -20%-20% 7.4 12.312.3 1010 -52%
WY13 (Dry) 169 6.656.65 -33%-33% 5.2 6.86.8 66 -71%
9-Yr Average (05-13) 245 9.639.63 -4%-4% 13.0 24.724.7 1919 -8%
30-Yr Norm (‘83-13) 250 9.859.85 -2%-2% 16.1 25.225.2 2121 0%
99-Yr Average (’14-13) 254 10.010.0 0%0% 18 2828 2323 11%(a) Percent difference from long term average annual rainfall (254 mm/yr or 10.0 in/yr); black-above, red-below average.b) Santee Basin USGS Stream Gauge Station at Mast Rd.c) USGS Stream Gauge Station at Fashion Valley Mall; incomplete data prior to 1965.d) Percent difference from 30-Yr average annual daily flow (i.e., 21 mgd).
Monthly and seasonal average annual flows and rainfall over the monitoring period for both stations are shown in Chart F.2. The seasonal flow patterns describe range, variance and correlation in monthly ADF and rainfall over the past 9 years. Winter season streamflow within the lower watershed is 100-to-250 times greater than summer, dry season flow. Average annual, winter and summer flows and rainfall for each of the water years are presented in Chart F.3. Highest flows during the monitoring period at both gauging stations were recorded in WY05 (very wet year); the lowest in WY07 (very dry year). Water years (WY06&08) witnessed below normal rainfall and runoff/streamflow. WY10 witnessed near normal
L o w e r S a n D i e g o R i v e r W Y 11 Wa t e r Q u a l i t y M o n i t o r i n g R e p o r t A p p e n d i c e s
S D R P F - R i v e r Wa t c h F. 1 D e c e m b e r 2 0 1 3!

rainfall and river discharge. WY11 was an above normal year whereas WY12 and WY13 were both below normal in terms of total annual rainfall and average daily stream flow.
L o w e r S a n D i e g o R i v e r W Y 11 Wa t e r Q u a l i t y M o n i t o r i n g R e p o r t A p p e n d i c e s
S D R P F - R i v e r Wa t c h F. 1 D e c e m b e r 2 0 1 3!
Chart F.3 - LSDR Streamflow and Rainfall by Water Year
22.60
6.00
3.85
7.20
9.15
10.60
12.70
7.91
6.55
9.62
0
1
10
100
1000
WY05 WY06 WY07 WY08 WY09 WY10 WY11 WY12 WY13 9-Yr Avg
Avera
ge D
aily F
low
, cf
s
0
2
4
6
8
10
12
14
16
18
20
22
24
An
nu
al R
ain
fall,
inch
es
Total Annual Rainfall
West(MV) AADF
East(SB) AADF
Winter ADF (west)
Winter ADF (east)
Summer ADF (west)
Summer ADF (east)
Chart F.2 - LSDR Monthly Streamflow and Monthly Rainfall (WY13, WY12, WY11, 9-Yr and 30-Yr Averages)
28
24
55
40
51
24
14
7
0.3 0.4 0.1 0.9
26
42
11
0.6
20
0
50
100
150
200
250
300
Oct Nov Dec Jan Feb Mar Apr May Jun Jul Aug Sep Fall Win Spri Su Ann
Avera
ge D
aily F
low
, cf
s
0
10
20
30
40
50
60
70
80
Mo
nth
ly R
ain
fall,
mm
Monthly Rainfall (9-Yr)WY13 ADFWY12 ADFWY11 ADF30-Yr AADF9-Yr AADF
Chart F.1 - LSDR Average Daily Flow and Monthly Rainfall (Oct 2004 - Sep 2013)
0
0
1
10
100
1,000
10,000
O N D J F M A M J J A S O N D J F M A M J J A S O N D J F M A M J J A S O N D J F M A M J J A S O N D J F M A M J J A S O N D J F M A M J J A S O N D J F M A M J J A S O N D J F M A M J J A S O N D J F M A M J J A S
WY05 WY06 WY07 WY08 WY09 WY10 WY11 WY12 WY13
Avera
ge D
aily F
low
, cf
s
0
20
40
60
80
100
120
140
160
Rain
fall,
mm
/m
o
Rainfall, mm/mo
Mission Valley ADF, cfs
Santee Basin ADF, cfs
Max DayMin Day
SB Trendline (12mo Mov Avg)
MV Trendline (12 mo Mov Avg)

Appendix G - LSDR Monthly WQM Site Data
Table G.1(W) West Section Water Temperatures (WY13/WY12)Si te # 1 2 3 4 5 6 7
Reach Lower Mission ValleyLower Mission ValleyLower Mission ValleyLower Mission Valley Upper Mission ValleyUpper Mission ValleyUpper Mission Valley
Oct 20.4/20.1 20.8/19.6 20.9/20.0 21.5/20.8 19.2/18.9 20.4/20.2 20.0/19.7
Nov 16.4/18.2 16.2/15.6 17.0/15.9 16.8/15.5 15.0/14.8 15.4/15.0 14.7/15.1
Dec 12.0/16.9 12.2/11.4 12.7/11.1 11.4/11.2 11.4/10.8 11.7/10.8 11.4/11.1
Jan 10.5/12.3 10.5/12.5 10.4/12.5 10.2/12.2 9.5/11.2 9.8/11.8 9.6/11.5
Feb 13.6/14.1 13.3/13.6 13.4/13.7 13.5/13.6 12.3/13.0 12.8/13.2 12.3/13.1
Mar 17.1/13.8 17.3/13.4 17.3/13.4 17.3/13.4 16.4/13.0 17.2/12.9 17.1/12.0
Apr 19.6/19.7 19.1/20.0 19.4/20.2 19.3/20.0 17.8/19.4 18.8/20.0 18.1/20.0
May 23.0/22.6 22.2/22.6 22.5/22.7 19.3/23.1 20.2/21.4 21.9/22.3 21.2/21.7
Jun 22.0/24.0 22.8/23.4 22.7/23.5 23.0/24.4 19.1/21.5 21.5/22.6 21.9/22.8
Jul 23.6/25.3 23.0/24.2 23.5/24.2 23.8/25.7 19.9/21.5 21.4/22.8 22.4/23.8
Aug 24.6/27.7 23.2/25.7 23.5/26.4 24.0/27.3 19.6/22.7 20.6/24.3 22.9/25.6
Sept 20.8/25.0 21.8/23.5 22.1/23.8 23.1/25.1 19.4/20.3 20.0/22.0 21.6/23.1
WY Avg b 18.6/20.0 18.5/18.8 18.8/18.9 19.0/19.4 16.7/17.4 17.6/18.2 17.8/18.3
a) All values expressed in oC; WY13 values less than WY12 are expressed in red.b) Water Year 2013/2012 values are based on averaging of monthly data (Oct- Sept).
Table G.1(E) Middle and East Section Water Temperatures (WY13/WY12)Si te 8 9 10 11 12 13 14 15
Reach Mission GorgeMission GorgeMission Gorge Lower Santee BasinLower Santee Basin Upper Santee BasinUpper Santee Basin LSB c
Oct 18.6/19.0 15.9/17.1 18.1/19.8 18.2/18.6 -/20.7 19.4/19.6 19.2/19.6 19.4/19.9
Nov 13.3/15.1 12.2/13.4 12.9/15.2 14.2/15.2 -/16.2 14.3/15.1 14.2/15.6 13.2/15.2
Dec 10.1/9.1 7.4/5.7 10.2/9.5 11.8/9.2 12.1/11.6 11.6/10.3 12.3/10.1 9.9/9.3
Jan 8.2/10.2 6.8/9.3 8.4/10.6 8.7/10.8 9.3/12.8 8.9/10.8 9.7/11.1 9.2/10.4
Feb 11.5/12.3 9.8/10.3 11.8/12.9 11.4/12.1 14.6/14.9 12.1/13.3 12.4/13.1 12.6/13.7
Mar 15.7/16.5 13.2/13.5 16.5/17.3 15.2/15.5 19.0/18.1 17.0/15.9 16.5/16.3 16.8/16.3
Apr 14.9/16.4 11.2/13.8 15.4/18.6 13.8/16.7 18.2/21.7 17.6/19.4 17.6/18.6 15.4/18.4
May 20.1/20.6 16.9/17.5 21.4/22.2 18.4/18.5 -/21.0 20.5/21.3 20.9/21.0 20.4/21.4
L o w e r S a n D i e g o R i v e r W Y 11 Wa t e r Q u a l i t y M o n i t o r i n g R e p o r t A p p e n d i c e s
S D R P F - R i v e r Wa t c h G . 1 N o v e m b e r 2 0 1 3!

Si te 8 9 10 11 12 13 14 15
Jun 20.8/20.9 18.7/18.2 22.3/22.7 19.8/19.6 -/21.3 23.9/22.0 21.6/22.0 22.5/23.6
Jul 21.0/21.2 19.7/18.9 23.5/23.1 20.8/20.6 -/21.5 22.9/22.7 21.6/22.9 22.6/25.8
Aug 20.9/21.6 18.8/21.0 23.4/24.2 20.2/22.9 - /- 24.0/24.5 20.8/24.2 22.7/25.4
Sep 20.0/21.7 18.6/20.0 21.9/23.0 20.1/21.0 23.0/- 21.6/23.3 19.8/22.4 21.2/23.2
WY Avg b 16.3/17.1 14.1/14.9 17.2/18.3 16.1/16.7 16.0/18.0 17.8/18.2 17.2/18.1 17.2/18.6
a) All values expressed in oC; WY13 values less than WY12 are expressed in red.b) Water Year 2013/2012 values are based on averaging of monthly data (Oct- Sept).c) Tributary discharges within the Lower Santee Basin reach just upstream of Carlton Hills Golf course.
Table G.2(W) West Section Specific Conductivity (WY13/WY12)Si te # 1 2 3 4 5 6 7
Reach Lower Mission ValleyLower Mission ValleyLower Mission ValleyLower Mission Valley Upper Mission ValleyUpper Mission ValleyUpper Mission Valley
Oct 7.50/3.27 3.74/2.76 2.79/2.98 3.01/3.12 3.57/3.54 3.60/3.53 2.66/2.84
Nov 13.9/14.6 3.33/1.36 3.16/1.32 2.89/1.36 3.70/1.49 4.18/1.26 2.95/1.67
Dec 1.48/13.1 1.44/1.66 1.47/1.50 1.61/1.45 1.71/1.37 1.49/1.15 1.40/1.29
Jan 2.30/3.46 2.29/2.69 2.28/2.55 2.34/2.60 2.19/2.32 2.03/2.45 2.02/2.41
Feb 2.01/1.46 2.06/1.49 2.15/1.54 2.27/1.59 2.22/1.37 2.05/1.25 1.89/1.14
Mar 1.29/1.12 1.27/0.86 1.20/0.75 1.27/0.80 1.37/0.79 1.21/0.77 1.50/0.63
Apr 2.76/2.06 2.75/2.02 2.64/1.87 2.60/1.71 2.54/1.59 2.49/1.40 2.49/1.57
May 2.26/3.80 2.30/3.56 2.41/3.46 2.53/3.36 2.59/3.48 2.36/2.97 2.16/3.24
Jun 12.1/6.88 3.36/3.50 3.30/3.44 3.13/3.27 3.35/3.42 2.90/3.05 3.05/3.23
Jul 11.1/9.97 3.60/3.43 3.44/3.41 3.00/3.18 2.85/3.35 3.33/3.13 2.95/3.21
Aug 13.5/12.3 3.65/3.70 3.42/3.69 3.01/3.40 3.48/3.42 3.71/3.52 2.94/3.01
Sep 13.5/12.6 3.74/3.87 3.50/3.83 3.03/3.44 3.17/3.74 4.14/3.95 2.97/2.92
WY Avg b 6.98/7.04 2.79/2.58 2.65/2.53 2.56/2.44 2.73/2.49 2.79/2.37 2.42/2.26
a) All values expressed in milli-Siemen/cm; WY13 values less than WY12 are expressed in red.b) Water Year 2013/2012 values are based on averaging of monthly data (Oct- Sept).
Table G.2(E) Middle and East Section Specific Conductivity (WY13/WY12)Si te 8 9 10 11 12 13 14 15
Reach Mission GorgeMission GorgeMission Gorge Lower Santee BasinLower Santee Basin Upper Santee BasinUpper Santee Basin LSB c
Oct 3.21/2.63 5.67/5.14 2.67/2.64 2.68/2.61 -/2.0 2.27/2.18 1.82/1.91 2.60/2.65
Nov 2.21/1.88 5.40/4.79 2.21/1.90 2.53/2.02 -/1.96 2.41/1.74 1.83/1.63 2.73/2.71
L o w e r S a n D i e g o R i v e r W Y 11 Wa t e r Q u a l i t y M o n i t o r i n g R e p o r t A p p e n d i c e s
S D R P F - R i v e r Wa t c h G . 1 N o v e m b e r 2 0 1 3!

Si te 8 9 10 11 12 13 14 15
Dec 1.66/1.99 3.96/4.93 1.69/2.02 1.72/2.12 1.70/1.66 1.55/1.79 1.70/1.48 2.28/2.73
Jan 2.08/1.99 4.72/4.88 2.12/1.99 2.15/2.07 1.80/1.51 1.90/1.81 1.68/1.53 2.67/2.57
Feb 2.03/1.64 4.48/4.29 2.09/1.66 2.14/1.81 1.57/1.42 1.91/1.60 1.65/1.56 2.84/2.65
Mar 1.50/1.99 4.29/4.74 1.68/2.01 1.72/2.03 1.38/0.73 1.49/1.76 1.37/1.55 2.61/2.70
Apr 2.22/1.66 4.83/4.65 2.23/1.84 2.18/1.84 1.37/1.38 1.90/1.50 1.70/1.38 2.81/2.73
May 1.91/2.98 4.79/7.43 2.05/3.09 2.29/3.19 -/2.33 1.82/2.47 1.56/2.08 2.83/4.29
Jun 2.57/2.79 5.39/6.39 2.64/2.87 2.70/2.94 -/2.42 2.09/2.24 1.67/1.84 2.90/3.63
Jul 4.49/2.60 5.62/5.35 2.78/2.65 2.76/2.69 -/2.5 2.25/2.01 1.75/1.59 3.16/2.97
Aug 3.32/5.51 5.65/5.57 2.80/2.79 2.50/2.74 - /- 2.43/2.10 1.78/1.67 2.97/2.96
Sep 4.07/3.71 5.60/5.62 3.13/2.93 2.99/2.80 -1.78/- 2.49/2.26 -/1.64 2.86/2.80
WY Avg b 2.61/2.61 5.03/5.32 2.34/2.37 2.36/2.41 1.60/1.79 2.04/1.96 1.68/1.66 2.77/2.95
a) All values expressed in milli-Siemens/cm; WY13 values less than WY12 are expressed in red.b) Water Year 2013/2012 values are based on averaging of monthly data (Oct- Sept).c) Tributary discharges within the Lower Santee Basin reach just upstream of Carlton Hills Golf Course.
Table G.3(W) West Section pH (WY13/WY12)Si te # 1 2 3 4 5 6 7
Reach Lower Mission ValleyLower Mission ValleyLower Mission ValleyLower Mission Valley Upper Mission ValleyUpper Mission ValleyUpper Mission Valley
Oct 8.02/8.10 7.92/7.95 7.96/8.04 7.97/7.60 7.77/7.73 7.75/7.46 7.55/7.13
Nov 7.83/7.80 7.90/8.00 7.86/8.00 7.87/8.00 7.83/7.90 7.87/8.10 7.56/8.20
Dec 7.00/7.66 7.00/7.95 7.60/7.58 7.20/7.88 7.10/7.85 7.20/7.87 7.00/7.78
Jan 7.82/7.93 7.76/7.92 7.83/7.89 7.75/7.87 7.63/7.84 7.56/7.90 7.68/8.05
Feb 7.85/7.73 7.82/7.69 7.83/7.76 7.84/7.62 7.69/7.46 7.67/7.53 7.79/7.13
Mar 7.94/8.48 7.86/8.28 7.85/8.33 7.95/7.94 7.80/8.12 7.96/7.94 8.01/8.10
Apr 7.98/7.80 8.10/7.67 8.08/7.72 7.88/7.65 7.84/7.59 7.61/7.62 7.46/7.31
May 7.74/7.39 7.54/7.31 7.55/7.24 7.53/7.27 7.44/7.08 7.36/7.50 7.38/7.22
Jun 7.76/7.58 7.69/7.47 7.80/7.39 7.79/7.37 7.55/7.09 7.51/7.27 7.32/7.07
Jul 7.86/7.76 7.81/7.62 8.01/7.53 7.97/7.46 7.72/7.09 7.60/7.03 7.52/6.92
Aug 7.77/7.76 7.69/7.40 7.97/7.74 7.95/7.89 7.64/7.27 7.53/7.47 7.27/7.29
Sep 7.69/8.13 7.68/7.90 7.94/8.16 8.07/8.20 7.76/7.94 7.57/7.87 7.50/7.41
WY Avg b 7.77/7.84 7.73/7.76 7.86/7.78 7.81/7.73 7.38/7.58 7.60/7.63 7.50/7.47
a) All values are unit-less. b) Water Year 2013/2012 based on averaging monthly results (Oct- Sept).
L o w e r S a n D i e g o R i v e r W Y 11 Wa t e r Q u a l i t y M o n i t o r i n g R e p o r t A p p e n d i c e s
S D R P F - R i v e r Wa t c h G . 1 N o v e m b e r 2 0 1 3!

Table G.3(E) Middle and East Section pH (WY13/WY12)Si te 8 9 10 11 12 13 14 15
Reach Mission GorgeMission GorgeMission Gorge Lower Santee BasinLower Santee Basin Upper Santee BasinUpper Santee Basin LSB c
Oct 7.86/7.23 8.75/7.35 8.20/7.35 7.51/7.23 -/7.48 7.78/7.10 8.15/7.23 8.06/7.35
Nov -/8.00 7.47/7.90 7.47/8.10 -/7.7 7.87/8.10 7.78/7.70 -/7.90 -/8.1
Dec 7.00/7.81 6.90/7.88 7.20/8.11 7.26/7.54 7.00/8.23 7.00/7.93 6.90/8.14 7.40/8.10
Jan 8.00/7.87 8.26/8.20 8.10/8.30 7.65/7.66 8.20/8.26 7.66/8.04 7.93/8.20 8.10/8.20
Feb 8.28/8.06 8.09/7.96 8.23/8.30 7.71/7.90 8.41/8.23 7.83/8.20 8.10/8.20 8.20/8.18
Mar 8.15/7.80 8.34/7.88 8.09/8.15 7.90/7.33 8.26/8.11 8.02/7.85 8.19/8.06 8.11/8.06
Apr 7.90/7.86 8.20/7.79 8.38/8.21 7.60/7.30 8.69/8.24 7.95/7.98 8.30/8.30 8.74/8.02
May 7.59/7.87 7.66/8.12 7.78/7.86 7.36/7.08 -/8.00 7.58/7.87 7.58/8.29 7.62/8.10
Jun 7.70/7.53 7.75/7.91 7.94/7.77 7.29/7.01 -/7.90 7.60/7.37 7.85/7.82 7.93/8.05
Jul 7.45/7.18 7.77/7.69 8.01/7.67 7.83/6.94 -/7.80 7.84/6.87 8.08/7.35 8.10/8.00
Aug 7.52/6.94 7.99/7.84 8.27/7.84 7.67/7.58 -/- 7.74/6.98 8.13/7.42 8.20/7.53
Sep 7.50/6.99 7.73/7.96 7.97/7.57 7.60/7.44 8.2/- 7.83/7.25 7.94/7.63 8.00/7.55
WY Avg b 7.72/7.59 7.91/7.87 8.02/7.94 7.58/7.39 8.13/8.03 7.80/7.60 7.92/7.88 8.04/7.94
a) All values are unit-less; WY13 values less than WY12 are expressed in red.b) Water Year 2013/2012 values are based on averaging of monthly data (Oct- Sept).c) Tributary discharges within the Lower Santee Basin reach just upstream of Carlton Oaks Golf course.
Table G.4(W) West Section Dissolved Oxygen (WY13/WY12)Si te # 1 2 3 4 5 6 7
Reach Lower Mission ValleyLower Mission ValleyLower Mission ValleyLower Mission Valley Upper Mission ValleyUpper Mission ValleyUpper Mission Valley
Oct 4.80/4.46 1.96/3.30 3.47/2.29 6.03/5.13 3.28/4.03 0.40/2.56 5.58/3.49
Nov 6.47/7.60 5.63/5.85 5.70/5.97 6.35/7.42 4.93/6.55 2.79/5.21 8.16/8.52
Dec 6.76/6.15 5.75/6.36 6.09/6.74 6.13/7.23 5.70/6.41 4.74/5.71 6.79/7.39
Jan 11.6/6.99 10.6/7.50 11.4/8.02 12.4/9.17 9.86/7.75 11.2/7.40 13.3/9.05
Feb 7.76/6.39 7.70/6.04 8.27/7.62 10.0/9.70 7.82/7.11 8.24/6.57 9.75/6.88
Mar 6.02/6.66 6.17/6.01 7.4/6.33 8.32/6.67 5.59/7.11 5.64/7.12 7.62/7.75
Apr 8.50/5.15 5.97/4.14 6.06/3.65 9.12/7.29 5.21/5.04 5.97/7.38 6.65/5.86
May 6.70/4.18 3.07/3.08 2.56/1.86 4.36/3.08 3.73/2.79 2.03/4.27 3.62/4.06
Jun 6.06/4.96 2.11/2.69 3.03/1.90 4.64/3.67 3.22/2.78 1.78/3.14 3.03/4.71
Jul 0.69/5.73 0.70/2.30 0.92/1.93 1.12/4.25 1.49/2.77 0.60/2.00 1.79/5.36
L o w e r S a n D i e g o R i v e r W Y 11 Wa t e r Q u a l i t y M o n i t o r i n g R e p o r t A p p e n d i c e s
S D R P F - R i v e r Wa t c h G . 1 N o v e m b e r 2 0 1 3!

Si te # 1 2 3 4 5 6 7
Aug 4.87/6.64 0.96/1.71 5.12/4.39 6.06/6.95 3.58/2.74 1.83/0.45 2.57/5.95
Sep 4.04/6.29 0.65/4.30 5.40/2.29 7.40/6.23 4.16/3.35 0.74/0.1 2.66/3.25
WY Avg b 6.19/5.93 4.27/4.44 5.46/4.42 6.83/6.40 4.88/4.87 3.83/4.33 5.96/6.02
a) All values expressed in milligrams/liter; WY13 values less than WY12 are expressed in red.
Table G.4(E) Middle and East Section Dissolved Oxygen (WY13/WY12)
Si te 8 9 10 11 12 13 14 15
Reach Mission GorgeMission GorgeMission Gorge Lower Santee BasinLower Santee Basin Upper Santee BasinUpper Santee Basin LSB c
Oct 6.93/8.07 10.3/10.4 4.83/7.14 5.02/6.00 -/5.33 1.27/1.22 2.40/2.27 3.26/5.33
Nov 10.5/10.4 12.8/10.1 10.7/9.78 7.22/8.25 -/9.76 0.18/0.96 2.51/2.99 6.26/7.19
Dec 10.0/10.5 10.4/12.3 8.42/9.07 7.05/8.33 8.93/8.67 2.80/1.64 4.54/3.44 6.50/7.52
Jan 12.9/9.9 12.3/11.1 12.7/8.54 10.6/8.35 9.70/7.45 3.86/2.25 4.83/3.28 9.65/7.04
Feb 10.4/9.24 10.4/10.8 8.90/8.50 7.62/5.96 7.83/7.31 3.01/1.86 3.93/5.54 6.28/6.89
Mar 10.5/8.30 10.9/9.75 9.38/7.50 7.64/6.52 7.25/6.99 2.02/0.67 3.73/3.06 7.17/7.11
Apr 8.51/7.82 10.1/8.39 9.36/6.87 6.68/6.37 7.91/6.47 1.54/0.34 2.89/3.36 6.00/5.64
May 6.63/6.57 8.80/9.23 5.53/8.30 4.29/5.09 -/6.54 0.41/0.26 2.48/2.85 3.25/7.82
Jun 5.02/6.44 5.06/8.52 4.93/7.10 5.42/4.71 -/6.25 0.40/0.39 2.74/2.40 6.63/7.76
Jul 2.56/6.31 5.24/7.80 1.80/5.90 5.28/4.33 -/6.01 1.06/0.51 1.42/1.95 2.49/7.70
Aug 2.75/3.43 8.79/9.30 9.15/3.20 5.42/6.33 -/- 2.01/0.61 2.62/1.76 5.35/6.33
Sep 2.32/1.42 8.29/8.25 2.40/0.96 5.33/4.85 6.17/- 0.42/0.09 2.77/2.33 3.39/3.95
WY Avg b 7.41/7.36 9.44/9.66 7.35/6.91 6.47/6.26 7.97/7.07 1.58/0.90 3.07/2.94 5.52/6.69
a) All values expressed in milligrams/liter; WY13 values less than WY12 are expressed in red.b) WY13/12 Avg. values are based on averaging of monthly data (Oct-Sept).c) Tributary discharges within the Lower Santee Basin reach just upstream of Carlton Oaks Golf course.
Table G.5(W) West Section Dissolved Oxygen Percent Saturation (WY13/WY12)Si te # 1 2 3 4 5 6 7
Reach Lower Mission ValleyLower Mission ValleyLower Mission ValleyLower Mission Valley Upper Mission ValleyUpper Mission ValleyUpper Mission Valley
Oct 54/49 22/36 39/25 63/58 36/44 5/28 63/38
Nov 70/85 57/59 57/60 67/75 49/66 29/51 81/85
Dec 61/62 53/58 56/61 55/66 52/58 44/51 62/67
Jan 105/66 94/71 102/76 112/86 86/71 99/71 90/83
L o w e r S a n D i e g o R i v e r W Y 11 Wa t e r Q u a l i t y M o n i t o r i n g R e p o r t A p p e n d i c e s
S D R P F - R i v e r Wa t c h G . 1 N o v e m b e r 2 0 1 3!

Si te # 1 2 3 4 5 6 7
Feb 75/63 74/58 77/74 98/94 73/68 79/63 94/65
Mar 62/64 64/57 77/61 86/64 57/67 59/67 82/72
Apr 93/56 65/46 66/41 100/80 55/55 64/81 76/55
May 80/49 36/36 30/22 52/36 43/33 24/51 43/47
Jun 72/61 25/32 35/23 55/45 36/32 20/37 35/55
Jul 9/72 8/28 11/24 13/53 16/32 12/23 21/63
Aug 61/88 12/21 62/57 73/88 40/32 21/6 30/74
Sep 47/84 8/48 63/27 88/77 46/38 9/1 31/38
WY11 Avg b 66/67 43/46 56/46 72/68 49/50 39/44 59/62
a) All values expressed in percent; WY13 values less than WY12 are expressed in red.b) Water Year 2013/2012 values are based on averaging of monthly values (Oct- Sept).
Table G.5(E) Middle and East Section Dissolved Oxygen Percent Saturation (WY13/WY12)
Si te 8 9 10 11 12 13 14 15
Reach Mission GorgeMission GorgeMission Gorge Lower Santee BasinLower Santee Basin Upper Santee BasinUpper Santee Basin LSB c
Oct 75/87 107/110 53/79 54/65 -/59 15/14 27/25 37/59
Nov 101/104 121/99 102/99 72/83 -/101 2/10 25/31 60/74
Dec 89/90 88/98 76/79 64/75 86/80 26/15 44/31 59/66
Jan 109/88 105/98 114/77 94/76 88/71 34/21 43/29 86/64
Feb 93/87 93/99 85/81 70/56 78/73 32/18 39/53 58/67
Mar 107/85 105/95 98/80 77/66 79/72 22/7 38/34 64/73
Apr 86/83 94/84 94/75 65/67 85/75 17/4 28/36 62/62
May 74/69 91/101 64/98 53/56 -/75 6/3 27/34 37/90
Jun 57/70 56/93 58/84 61/52 -/73 7/5 34/28 66/83
Jul 31/70 58/85 23/70 60/49 -/70 13/6 17/23 30/75
Aug 32/40 96/105 109/38 61/75 -/- 25/8 32/22 66/78
Sep 27/17 90/95 29/12 62/56 61/- 5/1 31/21 39/53
WY Avg b 73/74 92/97 75/73 66/65 79/75 17/9 32/31 55/70
a) All values expressed as percent; WY13 values less than WY12 are expressed in red.b) Water Year 2013/2012 values are based on averaging of monthly (Oct- Sept) data.c) Tributary discharges within the Lower Santee Basin reach just upstream of Carlton Oaks Golf course.
L o w e r S a n D i e g o R i v e r W Y 11 Wa t e r Q u a l i t y M o n i t o r i n g R e p o r t A p p e n d i c e s
S D R P F - R i v e r Wa t c h G . 1 N o v e m b e r 2 0 1 3!

Appendix H - WY13 LSDR WQM Data by Others
U.S. Geological Survey (USGS) stream flow values (mean daily discharge in cubic feet per second) presented in Table H.1 for the two Lower San Diego River gauging stations are provisional data subject to revision. Processing and review of the 2012 data is typically completed in December with subsequent approval for publication. The two stations are managed by the Poway South Field Office. Data for the San Diego River gauging stations as well as other streams and rivers throughout California are available via URL at http://waterdata.usgs.gov/nwis/dv?.
Table H.1 USGS Stream Flow Data (WY13/WY12)
Fashion Valley (Sta. 11023000)Fashion Valley (Sta. 11023000)Fashion Valley (Sta. 11023000)Fashion Valley (Sta. 11023000) Santee Basin (Sta. 11022480)Santee Basin (Sta. 11022480)Santee Basin (Sta. 11022480)Santee Basin (Sta. 11022480)
Month Min. Max. ADF3 a ADFm b Min. Max. ADF3 a ADFm b
Oct 1.3/1.3 3/82 1.8/3.2 2.2/6.3 0.4/1.1 10/29 0.8/4.1 1.4/4.8
Nov 0.8/1.9 4/361 1.9/19 2.3/40 1.8/2.5 12/206 2.1/17 2.3/18.6
Dec 1.5/9.0 220/187 17/21 27/42 3.1/7.7 224/128 17/9 16/24
Jan 8.4/8.2 140/84 9.7/20 20/10 6.4/6.8 165/61 7.5/7.0 14.2/8
Feb 9/17 36/121 12.3/41 25/28 6.9/6.5 100/100 7.6/12 21/15.8
Mar 9/27 118/227 21/172 29/35 6.2/6.0 231/178 15.7/6.4 28/21
Apr 9/10 7/104 3.8/15 8/39 3.3/6.7 6/84 3.7/11.3 6.4/25.3
May 3.9/7.2 45/15 2.8/5.0 6.4/18 1.2/2.5 39/14 2.7/4.2 5.9/13.3
Jun 2.2/4.2 3.0/3.8 1.9/2.8 1.7/3.6 0.2/1.4 1.4/3.0 0.5/2.5 1.3/3.0
Jul 1.3/2.2 3.2/2.2 2.6/1.5 2.6/1.5 0.0/0.8 0.8/1.9 0.02/0.6 0.2/2.0
Aug 1.4/1.5 2.1/2.5 1.0/2.1 1.7/1.7 0.0/0.4 0.4/1.0 0.1/0.6 0.0/1.0
Sep 1.2/1.2 0.8/2.2 0.3/1.7 0.7/1.9 0.0/0.2 1.5/2.8 0.1/0.5 0.2/0.7
WY13/12 Avg. 6.4/25 10.5/19 4.8/6.3 8.1/11.5
a) Average daily flow during 3-day period of water quality monitoring.b) Average daily flow for entire month.c) WY13 values lower (less) than WY12 are expressed in red.
Average daily flow in WY13 was down 30% (3.4 cfs) in the eastern portion of the LSDR and down 45% (8.5 cfs) in the western portion from WY12. LSDR total discharge during WY13 amounted to 5,864 AF vs 8,326 AF for WY12 and 26,000 AFY on average over the past 48 years of record. Average annual streamflow for WY13 amounted to less than 23 % of the 48-year mean flow for LSDR. The summer season (June-Sept) of WY13 represented one of the lowest periods of dry weather flow recorded at Fashion Valley since the mid 1980’s.
L o w e r S a n D i e g o R i v e r W Y 1 2 Wa t e r Q u a l i t y M o n i t o r i n g R e p o r t A p p e n d i c e s
S D R P F - R i v e r Wa t c h H . 1 N o v e m b e r 2 0 1 3!

San Diego CoastKeeper (SDCK) coliform count values (in MPN/100 mL) from the organization’s two San Diego River monitoring stations for WY13 and WY12 are presented in Table H.2. Monitoring results from 2009 through 2011 for selected San Diego area watersheds, including the lower San Diego River (HSU 907.1), can be accessed via the organization’s URL website at: http//www.sdwatersheds.org/wiki/Main-Page.
Table H.2 San Diego CoastKeeper Coliform Count Data WY13/WY12
Fashion Valley Road (SDG-010)Fashion Valley Road (SDG-010)Fashion Valley Road (SDG-010)Fashion Valley Road (SDG-010) Old Mission Historical Dam (SDG-020)Old Mission Historical Dam (SDG-020)Old Mission Historical Dam (SDG-020)Old Mission Historical Dam (SDG-020)
Month EColi (a) Enterocc (b)Enterocc (b) TCB (c) EColi (a) Enterocc (b)Enterocc (b) TCB (c)
Oct 310/110 280/90280/90 3080/2490 620/160 100/10100/10 11200/6870
Nov -/150 -/- -/- -/2600 -/360 - /-- /- -/4610
Dec - /- - /-- /- - /- - /- - /-- /- - /-
Jan 2490/- 1200/-1200/- 24190/- 3450/- 8660/- 8660/- 24190/-
Feb -/30 - / -- / - -/1250 -/10 - /-- /- -/1010
Mar 90/240 710/1220710/1220 850/2140 20/- 40/- 40/- 1180/-
Apr 10/40 40/3040/30 800/480 30/70 60/7060/70 4880/1160
May 20/160 90/3090/30 1550/1040 10/10 60/3060/30 5170/930
June 110/30 40/4040/40 2140/2190 10/30 20/68020/680 360/1140
July 20/30 30/9030/90 1330/1330 10/10 10/15010/150 140/680
Aug -/50 - /-- /- -/1400 -/20 -/10-/10 -/670
Sept -/230 - /-- /- - /1940 - /50 - /10- /10 - /610
WY13/12 Avg. 440/110440/110 340/250 4850/1690 590/80590/80 1280/190 6730/1960
WY MCC (d) 80/8080/80 140/80 2170/1530 55/3055/30 80/80 2360/6730
Summer 35/7035/70 50/50 1640/1520 10/1010/10 20/140 640/780
Winter 160/90160/90 310/150 2670/1530 190/80190/80 220/30 6290/2470
a) Escherichia-coli (E.coli) bacteria expressed in MPN/100mLb) Enterococcus (faecalis) bacteria expressed in MPN/100mLc) Total Coliform bacteria (common) expressed in MPN/100mL.d) Mean coliform counts for WY13/WY12 calculated by SDRPF RiverWatch for comparative purposes only; values are neither
endorsed nor validated by the San Diego CoastKeeper organization. e) WY13 values lower (less) than WY12 are expressed in red.Mean coliform counts vary can vary considerably from month to month however there is little evidence of an established pattern from season to season, from east to west or from year to year. Highest TCB’s are typically monitored following storm flow (wet weather) events such as in Jan. of this year.
L o w e r S a n D i e g o R i v e r W Y 1 2 Wa t e r Q u a l i t y M o n i t o r i n g R e p o r t A p p e n d i c e s
S D R P F - R i v e r Wa t c h H . 1 N o v e m b e r 2 0 1 3!

Appendix I - Water Quality Indexing
Decision-makers, non-technical water managers, numerous vested watershed stakeholders as well as the general public usually have neither time nor training to study and understand detailed technical assessments of water quality data. Over the last several decades numerous indexes have been developed to summarize water quality data in an easily expressed and readily understood format. Water quality professionals are often resistant to any automated, uncritical summarization represented by such indexes; there are sound reasons to use results with caution. Often scientists and water resource professionals prefer to provide no answer rather than an imperfect answer that can lead to misunderstanding. Layman and many decision makers, however, prefer an imperfect answer to no answer at all. Using an index may not be the optimal way to fully understand large-scale water quality issues, but it does provide a reasonable tool for gaining insight. Professionals can appreciate the need for imperfect answers and conversely others need to recognize and accept an answer’s limitations.
Water quality indexing was first proposed and demonstrated in the 1970s, however, prior to the personal computer, calculations were fairly labor-intensive so the technique was not widely used or accepted by many monitoring agencies. As use and limitations were commonly misunderstood, the potential of using an index for communicating water quality status and trends was often overlooked. Evaluation of water quality in terms of raw data can be very misleading and confusing not only for the layman but also to stakeholders with diverse and sometimes conflicting perspectives. It is typically difficult for individuals interested in water quality to interpret reams of raw data in order to gain an understanding of water quality conditions. This quest often results in faulty conclusions regarding water quality status and watershed management practices. An index is simply an attempt to integrate complex analytical data and generate a single number expressing the relative degree of impairment of a water body at a given point in time or given locale. The underlying objective of the exercise is to enhance communications with the general public, interested stakeholders, public agencies and increase citizen awareness of water quality conditions.
By design indexes contain less information than the raw data they summarize; many uses of water quality data cannot be met with an index. An index is generally most useful for comparative purposes (e.g., what river sites or reaches have particularly poor water quality?) and for temporal questions (e.g., how is the water quality at present relative to what is has been in the past?). Indexes are less suited to specific questions. Site-specific decisions need to be based on analysis of original water quality data. Basically, an index can be a useful tool for “communicating water quality information to the lay public and to legislative decision makers,” it is not, however “a complex predictive model for technical and scientific application”. This index was developed as a mechanism to summarize and report routine monitoring data to interested parties. SDRPF’s RiverWatch team does not monitor biological constituents or toxic substances, thus issues related to public health, body contact recreation and aquatic life are not effectively addressed by the index.
Besides being general in nature (i.e., imprecise), there are several reasons that an index may fail to accurately communicate water quality information. First, most indexes are based on pre-identified sets of water quality constituents. For example, a specific site may show a good WQI score, and yet have water quality impaired by other constituents not included in the index. Another reason, data aggregation can mask, normalize or over-emphasize short-term water quality issues. A satisfactory WQI at a particular site or reach does not necessarily mean that water quality is or always was satisfactory. A good score, however, does at least indicate that inferior water quality for those constituents evaluated is not chronic during the period included for the index.
L o w e r S a n D i e g o R i v e r W Y 1 2 Wa t e r Q u a l i t y M o n i t o r i n g R e p o r t A p p e n d i c e s
S D R P F - R i v e r Wa t c h I . 1 N o v e m b e r 2 0 1 3

The index has been developed for the purpose of providing a simple and concise expression of regularly monitored physical-chemical and bacteriological water quality data compiled by the SDRPF RiverWatch Team as well as several other monitoring groups; it is intended to aid in assessment of the Lower San Diego River watershed primarily for non-body contact recreational uses and environmental enhancement. It constitutes a mechanism to compare averages, variances and trends in normalized values over time (temporally) and by relative location (spatially) within the watershed. The index allows anyone to easily interpret large amounts of aggregated data and relate overall water quality variation to changes, be they from natural causes or man-made impairments. The WQI is used to identify general water quality trends over the past 8 years of monitoring and potential problem areas within the SDR watershed. Such patterns and locations can then be screened and evaluated in greater detail through direct observation of pertinent site-specific data by public agencies and water quality professionals entrusted with protection and enhancement. Used in this manner, the index provides a supplemental metric for evaluating effectiveness of the many San Diego River water quality improvement programs and also assist responsible agencies and organizations in establishing priorities for watershed management.
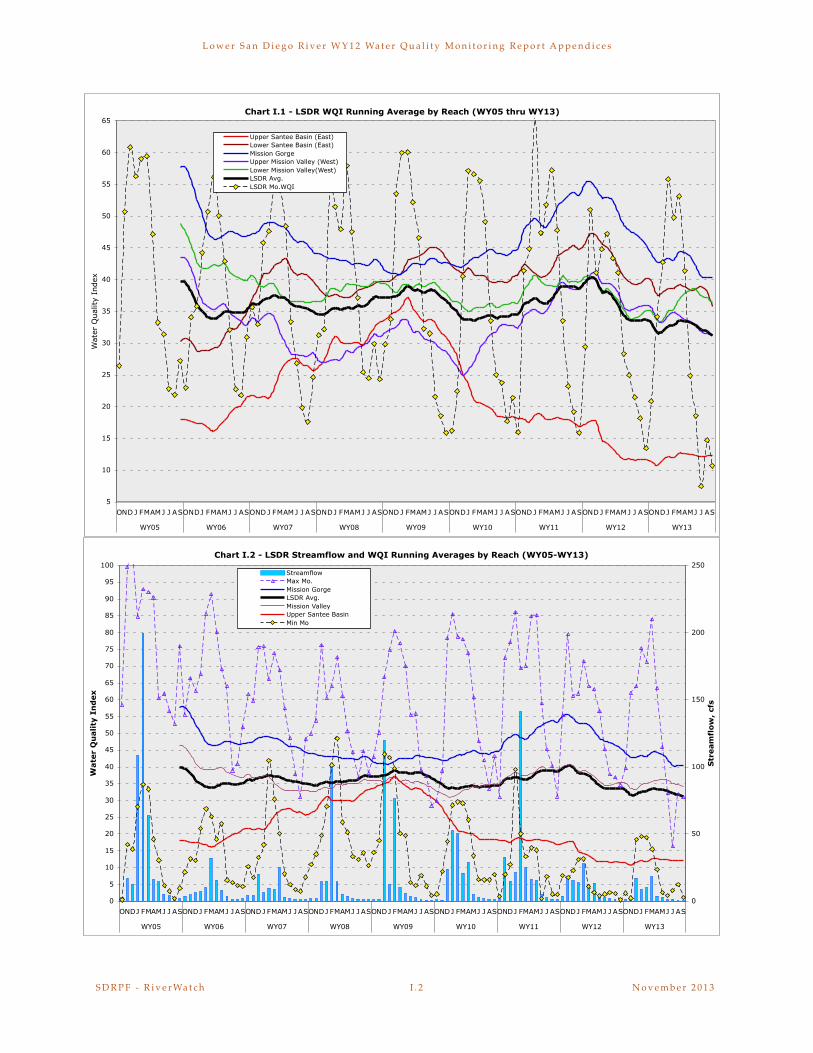
Running average LSDR WQI values from WY05 through WY12 are expressed by river reach and river section on Charts I.1 and I.2, respectively. Chart I.1 also presents overall LSDR monthly WQI values over the 8-year period. Both seasonal patterns and trends in WQI values can be seen. Chart I.2 provides the range (max-min) in monthly WQI values as well as average monthly streamflow. The water quality fluctuations over time in individual reaches, sections and the overall (average) Lower San Diego River expressed on both a running average basis and the annual cycle can be observed. The Upper Santee Basin reach (Sites 13 & 14) presents lowest index values since March of 2010, whereas the Mission Gorge (middle section) reach consistently presents highest values. There has been a general decline in overall water quality, as evidenced by the WQI values, since November of 2011. The running (12-mo) average index value fell by 9 units (22.5%) from high of 40 (13% above the 9-yr mean) over the last 22 months to a current (Sept ’13) low of 31 (-13% below the 9-yr mean).
Chart I.3 presents a temporal summary of variances in the water quality index values profiled on a monthly, seasonal and average annual water year basis for each river reach and the overall LSDR average. These variances are compared to changes in streamflow on the same basis. The positive correlations are evident, i.e., increase in average daily flow results in improved water quality. Low flow throughout the summer period results in poorest water quality.
Chart I.4 provides a spatial profile of average annual WQI by river monitoring site, reach and section for this year (WY13), last (WY12) and the 9-Yr winter, summer and annual averages. The sites are in chronological order ascending upstream. The current (WY13) average annual WQI values shown in black are below those from last year (WY12) shown in red at all monitoring sites. The WQI values for WY13 are also below the 9-Yr averages (yellow bars) at all but two (7&12T) monitoring sites. For the third consecutive year, Site 13 (Mast Park) has demonstrated lowest water quality values.
L o w e r S a n D i e g o R i v e r W Y 1 2 Wa t e r Q u a l i t y M o n i t o r i n g R e p o r t A p p e n d i c e s
S D R P F - R i v e r Wa t c h I . 1 N o v e m b e r 2 0 1 3
L o w e r S a n D i e g o R i v e r W Y 1 2 Wa t e r Q u a l i t y M o n i t o r i n g R e p o r t A p p e n d i c e s
S D R P F - R i v e r Wa t c h I . 2 N o v e m b e r 2 0 1 3!
Chart I.1 - LSDR WQI Running Average by Reach (WY05 thru WY13)
5
10
15
20
25
30
35
40
45
50
55
60
65
OND J FMAMJ J ASONDJ FMAMJ J ASOND J FMAMJ J ASONDJ FMAMJ J ASOND J FMAMJ J ASONDJ FMAMJ J ASOND J FMAMJ J ASOND J FMAMJ J ASONDJ FMAMJ J AS
WY05 WY06 WY07 WY08 WY09 WY10 WY11 WY12 WY13
Wat
er Q
ual
ity
Index
Upper Santee Basin (East)Lower Santee Basin (East)Mission GorgeUpper Mission Valley (West)Lower Mission Valley(West)LSDR Avg.LSDR Mo.WQI
Chart I.2 - LSDR Streamflow and WQI Running Averages by Reach (WY05-WY13)
0
5
10
15
20
25
30
35
40
45
50
55
60
65
70
75
80
85
90
95
100
ONDJ FMAMJ J ASONDJ FMAMJ J ASONDJ FMAMJ J ASONDJ FMAMJ J ASONDJ FMAMJ J ASONDJ FMAMJ J ASONDJ FMAMJ J ASONDJ FMAMJ J ASONDJ FMAMJ J AS
WY05 WY06 WY07 WY08 WY09 WY10 WY11 WY12 WY13
Wate
r Q
uality
In
dex
0
50
100
150
200
250
Str
eam
flo
w,
cfs
StreamflowMax Mo. Mission GorgeLSDR Avg.Mission ValleyUpper Santee BasinMin Mo

L o w e r S a n D i e g o R i v e r W Y 1 2 Wa t e r Q u a l i t y M o n i t o r i n g R e p o r t A p p e n d i c e s
S D R P F - R i v e r Wa t c h I . 2 N o v e m b e r 2 0 1 3!
Chart I.3 LSDR Temporal WQI Profiles and Streamflow
2
9
27 27
69
22
14
73 2 1 1
6
36
11
2
37
8 7
14
2016
23
106
16
39
56
62
6465
69
66
55
46
33
29 30
48
65
60
34
65
55
51
47 47
49
56
48
44
51
25
37
47
54 53 53
48
35
28
2120 21
31
52
41
22
41
37 37
3938
35
39
34
31
37
1415
28
34
40
33
28
20
15
109
11
14
34
24
11
18
22
27
36
34
18
15
1011
21
5
10
15
20
25
30
35
40
45
50
55
60
65
70
75
O N D J F M A M J J A S Fall Winter SpringSummer WY05 WY06 WY07 WY08 WY09 WY10 WY11 WY12 WY13
Wat
er Q
ual
ity
Index
0
10
20
30
40
50
60
70
80
90
100
Str
eam
flo
w,
cfs
Streamflow
Mission Gorge
Lower Santee Basin
Lower Mission Valley
LSDR
Upper Mission Valley
Upper Santee Basin
Chart I.4 LSDR Spatial WQI Profiles
40
3336 36
30
35 3739 40
37
22 20
4747
55
39
29
35
43
31
25
38
46
33
42
36
45
26
8
16
37
30 30
43
35
32
41
50
39
47
41
44
36
5
18
5250
56
64
51 50
55
70
50
61
51
54
51
34
32
29
1617
30
24
12
15
36
24
32
28
23
26
11 11
0
5
10
15
20
25
30
35
40
45
50
55
60
65
70
75
1 2 3 4 5 6 7 8 9T 10 11 12T 15T 13 14
Est YMCA FVM FSDRIP Ward Kaiser ABF MT BC Seep OMD W.Hills CO/SLks ForCk Mast Pk RCP
Wate
r Q
uality
In
dex
9-Yr Annual Avg.
WY13 Annual Avg.
WY12 Annual Avg.
9-Yr Winter Avg.
9-Yr Summer Avg

Appendix J - LSDR Water Quality Monitoring Data Summary Sheets
Table J.1 WQM Data Summary (Annual & Seasonal Averages)Table J.1 WQM Data Summary (Annual & Seasonal Averages)Table J.1 WQM Data Summary (Annual & Seasonal Averages)Table J.1 WQM Data Summary (Annual & Seasonal Averages)Table J.1 WQM Data Summary (Annual & Seasonal Averages)Table J.1 WQM Data Summary (Annual & Seasonal Averages)Table J.1 WQM Data Summary (Annual & Seasonal Averages)Table J.1 WQM Data Summary (Annual & Seasonal Averages)Table J.1 WQM Data Summary (Annual & Seasonal Averages)Table J.1 WQM Data Summary (Annual & Seasonal Averages)Table J.1 WQM Data Summary (Annual & Seasonal Averages)WY05 WY06 WY07 WY08 WY09 WY10 WY11 WY12 WY13 9-Yr Avg.
Annual (October-September):Annual (October-September):Annual (October-September):Annual (October-September):Annual (October-September):Annual (October-September):Annual (October-September):Annual (October-September):Annual (October-September):Annual (October-September):Annual (October-September):
ADF, cfs 76 14 10 19 21 34 50 15 9 32
Temp, oC 17.7 18.3 17.7 17.7 17.7 18.1 17.8 18.0 17.3 17.8
SpC, uS/cm 2.125 2.175 2.409 2.313 2.486 2.357 2.204 2.380 2.490 2.326
DO, mg/L 6.84 5.87 5.91 6.31 6.20 5.40 5.82 5.59 5.68 5.99
DO%Sat, % 67 58 59 65 65 57 60 58 58 61
pH 7.58 7.33 7.49 7.89 7.61 7.85 7.89 7.72 7.78 7.68
MCC, #/uL - - - - 440 600 420 510 800 550
WQI 41 37 37 39 38 35 39 34 31 37
Grade C+ C C C C C- C D+ D C
Summer (June-September) Period:Summer (June-September) Period:Summer (June-September) Period:Summer (June-September) Period:Summer (June-September) Period:Summer (June-September) Period:Summer (June-September) Period:Summer (June-September) Period:Summer (June-September) Period:Summer (June-September) Period:Summer (June-September) Period:
ADF, cfs 3.6 2.5 1.5 1.6 1.2 1.9 2.7 1.9 1.1 2.0
Temp, oC 21.8 23.7 21.8 22.9 22.8 21.9 21.7 22.9 21.7 22.5
SpC, uS/cm 2.612 2.470 2.759 3.059 3.239 3.031 2.852 3.121 3.068 2.912
DO, mg/L 5.11 5.02 4.85 5.45 4.94 3.94 4.03 4.00 3.50 4.54
DO%Sat, % 53 56 52 63 56 46 46 47 40 51
pH 7.58 7.33 7.70 8.08 7.72 7.70 7.85 7.47 7.75 7.69
MCC, #/uL - - - - 350 90 260 430 400 310
WQIa 26 27 22 26 22 22 23 20 13 22
Grade D- D E D- E E E+ E E E
Winter (December-March) Period:Winter (December-March) Period:Winter (December-March) Period:Winter (December-March) Period:Winter (December-March) Period:Winter (December-March) Period:Winter (December-March) Period:Winter (December-March) Period:Winter (December-March) Period:Winter (December-March) Period:Winter (December-March) Period:
ADF, cfs 175 23 22 51 54 86 127 23 23 63
Temp, oC 13.5 12.8 13.8 12.4 13.3 15.7 13.7 12.4 12.4 13.5
SpC, uS/cm 1.437 1.953 2.028 1.562 1.552 1.369 1.324 1.687 2.021 1.659
DO, mg/L 9.55 6.72 6.97 7.17 7.45 6.35 7.66 7.24 8.01 7.47
DO%Sat 89 60 67 68 73 64 75 68 76 71
pH 7.51 7.46 7.42 7.89 7.52 7.85 7.96 7.96 7.74 7.70
MCC, #/uL - - - - 560 1480 470 720 1640 970
WQIa 59 47 51 53 56 52 53 44 50 52
Grade B C+ B- B- B B- B- C B- B-a) Percent change in this year’s value (WY13) from last year (WY12).
(b) Percent change in this year’s value (WY13) from first year (WY05).(c) Percent change in this year’s value (WY13) above (+) or below (-) 9-yr Average.d) Values in red represent values below 9-Yr average.
L o w e r S a n D i e g o R i v e r W Y 1 2 Wa t e r Q u a l i t y M o n i t o r i n g R e p o r t A p p e n d i c e s
S D R P F - R i v e r Wa t c h J . 1 N o v e m b e r 2 0 1 3!

Table J.2 WQM Spacial Data Summary (9-Yr Averages)Section Mission ValleyMission Valley Mission Gorge Santee BasinSantee Basin Watershed
Sites 1-4 5-7 8-10 11,12 &15 13&14 all (1-15)
Reach LMV UMV MG LSB USB LSDR (a)
Annual (Oct-Sept):Annual (Oct-Sept):Annual (Oct-Sept):Annual (Oct-Sept):Annual (Oct-Sept):Annual (Oct-Sept):Annual (Oct-Sept):
ADF, cfs 35 30 20 (b) 19 15 28
Temp, oC 19.2 17.7 17.0 17.2 18.0 17.8
SC, mS/cm 2.552 2.537 2.235 2.223 1.742 2.326
DO, mg/L 5.58 4.94 7.87 6.89 3.75 5.96
DOSat, % 59 51 81 66 38 61
pH 7.70 7.55 7.66 7.81 7.67 7.66
MCC, #/100mL 430 - 540 - - 550
WQIa 39 34 51 39 21 37
Grade C D+ B- C D C
Rating Fair Marginal Good Fair Marginal Fair
Summer (June-Sept) Period:Summer (June-Sept) Period:Summer (June-Sept) Period:Summer (June-Sept) Period:Summer (June-Sept) Period:Summer (June-Sept) Period:Summer (June-Sept) Period:
ADF, cfs 2.3 2.1 1.2 (c) 1.5 1.1 2.0
Temp, oC 24.3 21.7 21.7 21.7 22.8 22.5
SC, mS/cm 3.301 3.215 2.842 2.599 1.984 2.912
DO, mg/L 4.04 3.17 6.55 5.85 2.80 4.54
DOSat, % 48 36 74 61 32 51
MCC, #/100mL 270 - 560 - - 310
WQIa 23 17 34 26 11 22
Grade E+ E D+ D- E E
Rating PoorPoor MarginalMarginal Poor Poor
Winter (Dec-March) Period:Winter (Dec-March) Period:Winter (Dec-March) Period:Winter (Dec-March) Period:Winter (Dec-March) Period:Winter (Dec-March) Period:Winter (Dec-March) Period:
ADF, cfs 80 72 50 40 25 63
Temp, oC 14.4 13.6 12.8 13.0 13.5 13.5
SC, mS/cm 1.782 1.732 1.533 1.786 1.394 1.659
DO, mg/L 7.36 6.95 9.03 8.07 4.88 7.47
DOSat, % 72 67 86 72 45 71
MCC, #/100mL 1740 - 860 - - 970
WQIa 56 52 65 52 34 52
Grade B B- B B- D+ B-
Rating GoodGoodGoodGood Marginal Good
(a) Weighted average of all reaches within the Lower SDR watershed. (b) Stream flow based on averaged river gains and losses between Santee Basin and Mission Valley. (c) During periods when surface water is evident; intermittent dry-weather conditions.
L o w e r S a n D i e g o R i v e r W Y 1 2 Wa t e r Q u a l i t y M o n i t o r i n g R e p o r t A p p e n d i c e s
S D R P F - R i v e r Wa t c h J . 1 N o v e m b e r 2 0 1 3!