louisiana-texas coastal response during recent hurricanes and an oil spill from ocean color and...
TRANSCRIPT

Louisiana-Texas coastal response during recent hurricanes and an oil spill from ocean color
and model results
Eurico D’SaDong-Shan Ko*, Mitsuko Korobkin, Nan Walker
Dept. of Oceanography and Coastal SciencesLouisiana State University
*Naval Research Laboratory, Stennis Space Center
Thanks: NASA Ocean Color Data Processing Team
Funding: NASA MMS
2010 NASA OCRT Meeting

• How do hazards and pollutants impact the hydrography and biology of the coastal zone? How do they affect us and can we mitigate their effects?
NOAA -CSCOR
• Background• Mississippi River ranks 2nd globally in terms of drainage
basin and river discharge
• Discharge from the Mississippi-Atchafalaya River strongly
influences biogeochemical properties of the northern Gulf of Mexico
• Science Question

Economic importance• oil & gas• ~1/3 of US fisheries yield
Major issues • Eutrophication and hypoxia • Hurricanes and storms • And now a major oil spill
• Background

• Methods and data
• Ocean color and model results
• Two major hurricanes in 2008• Hurricane Gustav- 1 Sep• Hurricane Ike – 13 Sep
• Outline
• Deepwater Horizon- oil spill• Short-term monitoring
using MODIS and model results

Components:• Field data
• Used WAVCIS platform-based measurements for model validation
• NOAA tide station data
• Remote Sensing• Ocean color products from
MODIS and SeaWIFS• SST from MODIS• winds from QuikSCAT
• 3-D NCOM Model• Sea level, Currents• SST, SSS• Horizontal resolution: ~1.9 km
Gulf Coast Information Systemhttp://gulf-coast.lsu.edu

Satellite data
• MODIS • SST• Chl• 250 m
SPM = 17.783 (Rrs670/Rrs555)1.11
Suspended Particulate Matter (SPM) algorithm for SeaWiFS
D’Sa, Miller & Del Castillo 2007 Geophysical Research Letters
• SeaWiFS• Chl – OC4• SPM algorithm
• QuikSCAT • Wind speed• Direction
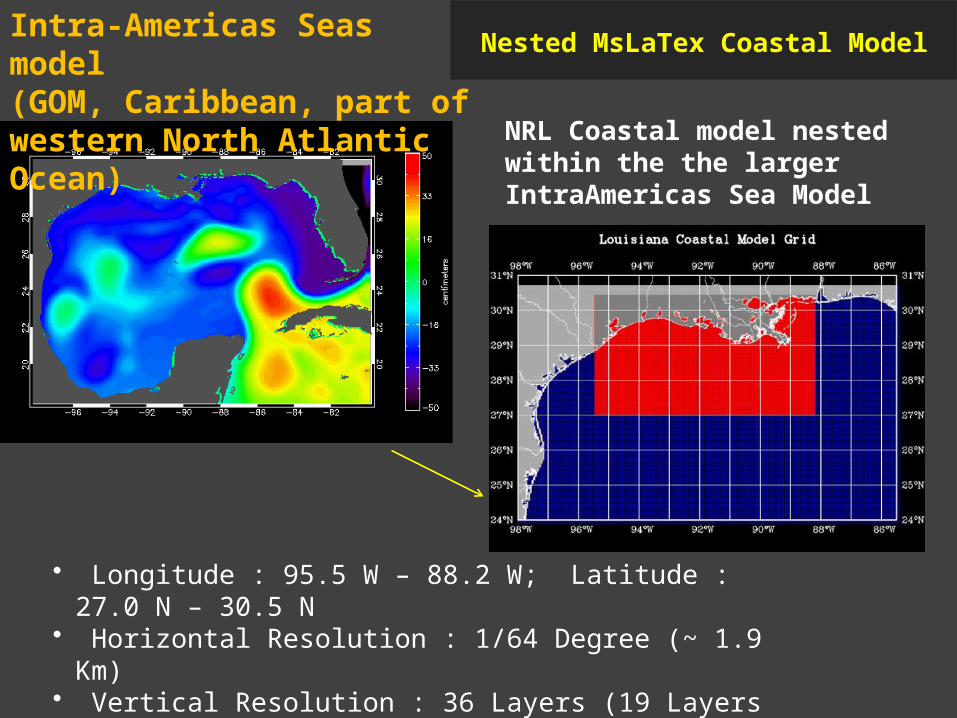
Nested MsLaTex Coastal Model Intra-Americas Seas model(GOM, Caribbean, part of western North Atlantic Ocean)
NRL Coastal model nested within the the larger IntraAmericas Sea Model
• Longitude : 95.5 W – 88.2 W; Latitude : 27.0 N – 30.5 N• Horizontal Resolution : 1/64 Degree (~ 1.9 Km)• Vertical Resolution : 36 Layers (19 Layers on the shelf)• Number of Grids : 372 x 200

Short-term SPM -fronts
3/23/05 3/28/05
NCOM- model simulation of sea level & currents
Wind forcing effects on: sea level, currents and SPM
D’Sa and Ko, Sensors 2008

Hurricane studies
•SST and ocean color have been used to study effects of hurricanes
• A common observation has been a decrease in SST and Chl blooms associated with hurricane passage
(Babin et al. 2004; Walker et al. 2005)
• Sediment resuspension events have been detected in NGOM from
ocean color during Hurricanes Dennis and Rita in 2005 (Hu and Muller-Karger 2006; Lohrenz et al. 2008)
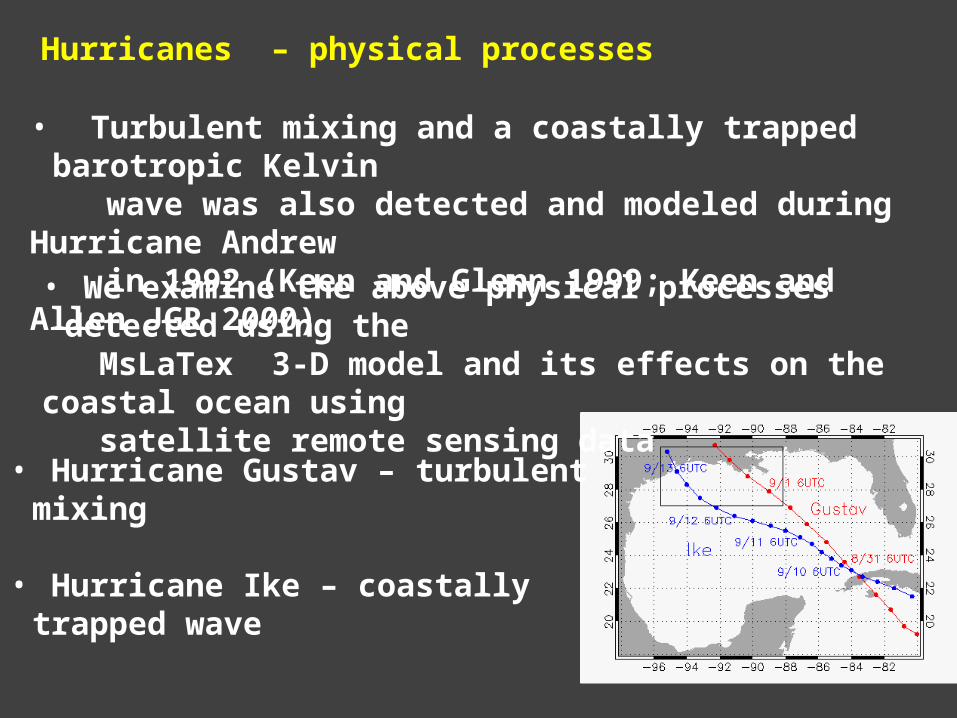
Hurricanes – physical processes
• Turbulent mixing and a coastally trapped barotropic Kelvin wave was also detected and modeled during Hurricane Andrew in 1992 (Keen and Glenn 1999; Keen and Allen JGR 2000)
• We examine the above physical processes detected using the MsLaTex 3-D model and its effects on the coastal ocean using satellite remote sensing data
• Hurricane Gustav – turbulent mixing
• Hurricane Ike – coastally trapped wave

Coastal response to Hurricane Ike
D’Sa, Korobkin and Ko 2010 – Remote Sensing Letters – in press

Hurricane Ike effect on SST
Avg 5-day (6-10 Sep 2008)
Avg 5-day (14-18 Sep 2008)

Mean Sea Level (tide stations)
vs
and Sea Surface Height (model)

Hurricane Ike – coastally trapped barotropic Kelvin wave
More than one maxima and reported earlier than expected surge appears to be due to a coastally trapped wave
CTW is a rapidly moving disturbance that takes the form of a wave field and travels along the coastline
CTW form as hurricane winds force the ocean water against the coast and create a bulge of high sea level
CTW have been shown to amplify the storm surge (Morey et al 2006)
NCOM SSH on 11 Sep, 1200 UTC NCOM SSH on 12 Sep, 0600 UTC

Hurricane Ike – coastally trapped barotropic Kelvin wave
Time-distance plot of SSH simulated by NCOM along 28.5°N lat. suggests the appearance of a large wave at the Mississippi Canyon (~90W longitude) on Sept 12.
It traveled from 90-95° W in ~ 8 hrs => speed 17 m s-1.
Assuming H = 30m
Speed of CTW
√gH = 17 ms-1
Hypothesis:Forerunner wave
Sediment resuspension

Hurricane Ike
Effects on coastal SPM
• SPM from SeaWiFS for 17, 25, 27, 30 Sep
• Two wind events 15, 21
• Discharge of inundated
waters
• Plumes of elevated SPM
• River discharge increased by 12% (25- 29 Sept)

Oil Spill in the Gulf of Mexico
April 20 explosion at the Deepwater Horizon rigModis 250 m res imagery has been most usefulMany sources – : NASA MODIS web-rapid response project
MODIS Terra – 29 April
MODIS Terra – 4 May
NCOM SSH on 11 Sep, 1200 utc
Hu et al. 2003 and 2008 - used MODIS 250 for detecting oil in surface waters

MODIS Chl (Aqua)
MODIS Terra – 29 April: True color
MODIS Rrs(412) (Aqua)
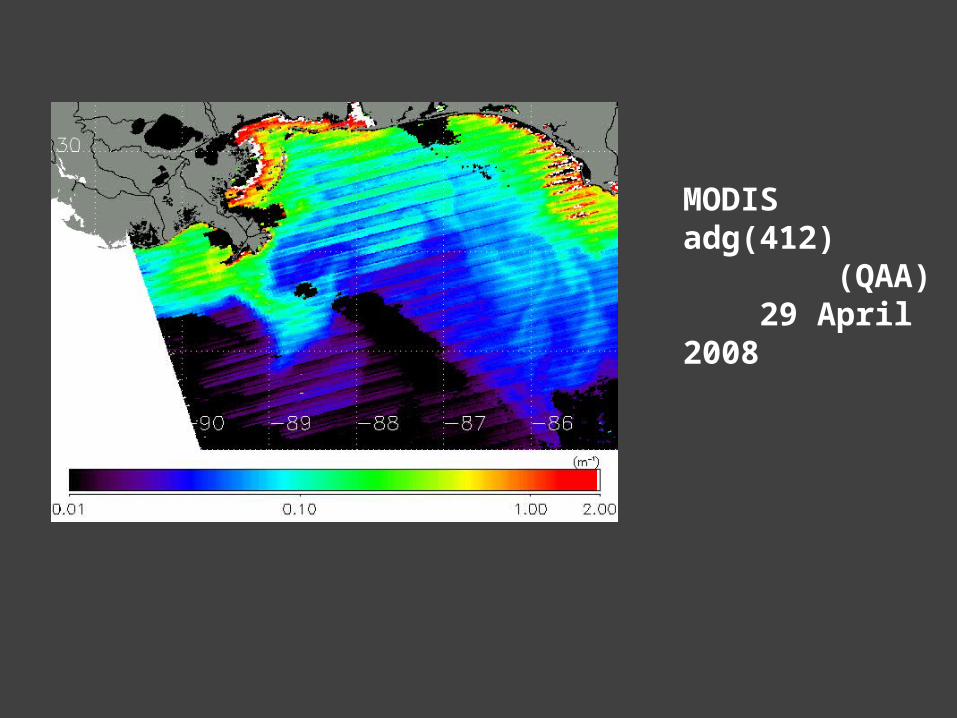
MODIS adg(412) (QAA) 29 April 2008
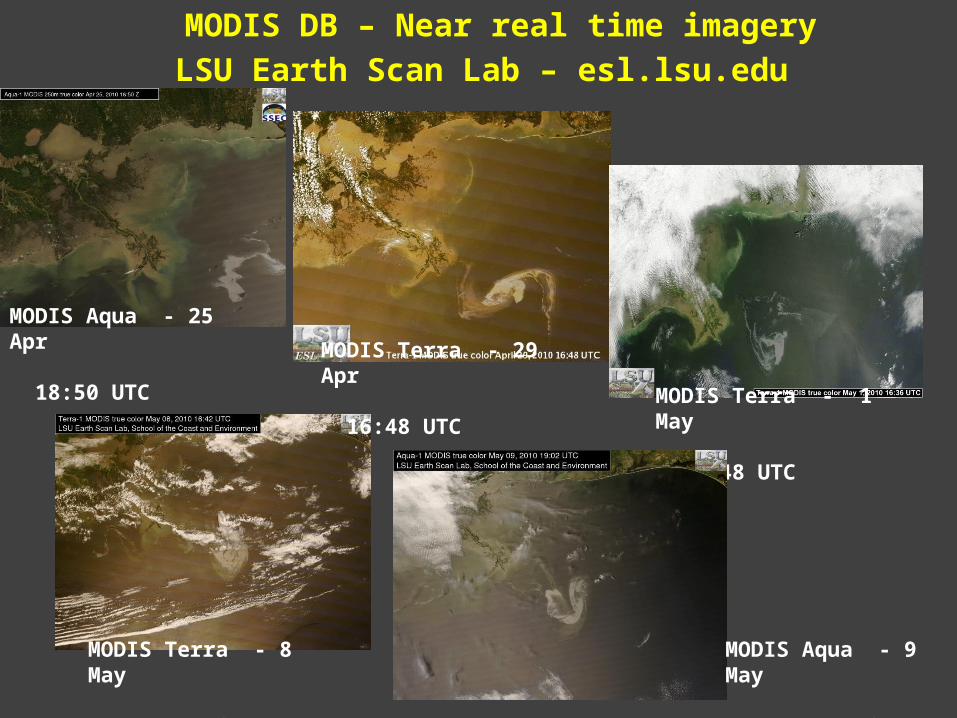
MODIS Aqua - 25 Apr 18:50 UTC
MODIS DB – Near real time imagery
LSU Earth Scan Lab – esl.lsu.edu
MODIS Terra - 29 Apr 16:48 UTC
MODIS Terra - 1 May 16:48 UTC
MODIS Terra - 8 May 16:48 UTC
MODIS Aqua - 9 May 16:48 UTC


Gulf of Mexico Oil Spill
MODIS Terra - 29 Aprband 2 -856 nm
Converted to model grid using optimal interpolation
Surface velocity distribution
Gulf oil spill – effects on ocean color products
• MODIS 250 m after accounting for sun glint and cloud could be assimilated into numerical models for spill trajectory analysis
• Reflectance characteristics different for MODIS Aqua and Terra
• Different effects of oil slick and sheen on reflectance data
• Need to account for changing nature of the oil in surface waters due to degradation; also surface vs subsurface
• Hyperspectral sensors (AVIRIS, HySpiri, GEO-CAPE)
• baseline optical data would be very useful in characterizing changes

• Coastal response to hurricanes not clear from remote sensing or numerical models alone
• combining satellite and model data provided considerable insights into interaction of physical (turbulent mixing and coastally trapped waves) and biogeochemical processes
• MODIS 250 m data proving to be most useful for oil spill monitoring
• Need for timely field data to characterize ocean color data related to oil spill
Conclusions

Thank You