louisa bypass experimental project
TRANSCRIPT

KTC-90-16
LOUISA BYPASS EXPERIMENTAL PROJECT
Final Report
by
Kamyar Mahboub Head of the Bituminous Materials Research Section
and
L. John Fleckenstein Research Investigator
Kentucky Transportation Center College of Engineering University of Kentucky
In cooperation with Kentucky Transportation Cabinet
and Federal Highway Administration
U.S. Department of Transportation
The contents of this report reflect the views of the authors who are responsible for the facts and accuracy of the data presented herein. The contents do not necessarily reflect the official views or policies of the University of Kentucky, of the Kentucky Transportation Cabinet, or the Federal Highway Administration. This report does not constitute a standard, specification, or regulation. The inclusion of manufacturer names and trade names are for identification purposes and are not to be considered as endorsements.
June 1990
Technical Report Documentation Page
1. Report No. 2. Government Accession No. 3. Recipient's Catalog No.
KTC-90-16 4. THie and SubtHie 5. Report Date
June 1990 Louisa Bypass Experimental Project
6. Performing Organization Code
7. Author(s) 8. Performing Organization Report No.
Kamyar Mahboub, L. John Fleckenstein KTC-90-16
9. Performing Organization Name and Address 10. Work Unit No. (TRAIS)
Kentucky Transportation Center College of Engineering 11. Contract or Grant No.
University of Kentucky FAR Task 38
Lexington, KY 40506-0043 13. Type of Report and Period Covered
Final 12. Sponsoring Agency Name and Address
Kentucky Transportation Cabinet State Office Building 14. Sponsoring Agency Code
Frankfort, KY 40622
15. Supplementary Notes Publication of this report was sponsored by the Kentucky Transportation Cabinet with the U.S. Department of Transportation, Federal Highway Administration. STUDY TITLE: Louisa Bypass Experimental Project.
16. Abstract
In an effort to reduce rutting in the new Louisa Bypass in Lawrence County, Kentucky, a large-stone asphaltic base mix (Class K) was used in the base layer. A one-inch surface wearing course was used in this project, a polymer-modified asphalt was used in the surface course on half of the project. In order to facilitate subsurface drainage, a free draining subbase (No. 57's) was placed between the large-stone base and a dense-graded aggregate (DGA) layer. The drainage design was further enhanced by edge and median drains. Construction processes were monitored and photographed. Laboratory and field studies were conducted to determine the perfmrnance characteristics of individual pavement components. Performance of the Louisa Bypass project has been and will be monitored.
17. Key Words 18. Distribution Statement
Asphalt Mixture Pavement Materials Large-stone Mix Edge Drain Unlimited, with approval of the Asphalt Additive Kentucky Transportation Cabinet. Polymer Asphalt
19. Security Classlf. (of this report) 20. Securily Classif. (of this page) 21. No. of Pages 22. Price
Unclassified Unclassified 57
Form DOT 1700.7 (8-72) Reproduction of completed page authorized
TABLE OF CONTENTS
EXECUTIVE SUM.MARY
INTRODUCTION
DEVELOPMENT OF LARGE-STONE MIX DESIGN CRITERIA Aggregate Gradation Analyses Marshall Mix Design Compressive Strength Resilient Modulus Static and Dynamic Creep
CONSTRUCTION OF THE LOUISA BYPASS Mix Design Plant Mixing Laydown Operations Compaction Operations Quality Control
OTHER EXPERIMENTAL FEATURES Drainage Structures Polymer-Modified Surface Wearing Course
CONSTRUCTION PROBLEMS
LONG-TERM PERFORMANCE MONITORING Drainage Inspection Analysis of Pavement Rutting Data Performance of Pavement Drainage Blanket
CONCLUSIONS AND RECOMMENDATIONS
REFERENCES
ACKNOWLEDGEMENTS
DISCLAIMER
iii
page
2
2
3
3
4
5 5
6
7
7
8
9
9
10 10 10
11
11
12 12 14
15
16
18
18

EXECUTIVE SUMMARY
Large-stone mixes are becoming a very popular means for reducing rutting in flexible pavements. Aggregate interlock in large-stone mixes provides for very efficient dissipation of compressive and shear stresses that are known to be responsible for rutting and shoving in flexible pavements. The primary focus of this study was on large-stone mixes; however, the Louisa Bypass project also included control and trial sections for a polymer-modified asphalt surface wearing course. Additionally, in order to facilitate drainage, a free draining subbase (No. 57's) was placed between the large-stone asphaltic base and a dense graded aggregate (DGA) layer. The drainage design was further enhanced by edge and median drain systems. An examination of the drainage system revealed that the majority of installations on this project were partially damaged during construction.
A field trial project followed the laboratory investigations. Construction of the Louisa Bypass, which is located in the mountainous region of eastern Kentucky, was studied. This report documents laboratory and field data associated with the Louisa Bypass project. Construction processes were photographed, and problems were documented.
Pavement coring was conducted in order to determine the magnitude and cause of rutting in individual pavement layers. A pavement trench was excavated for further examination of pavement layers. Field data revealed that rutting was concentrated within steep uphill grade locations where heavy coal trucks travel at very slow speeds. Data from pavement cores and a pavement trench indicate that rutting in the large stone mix may have been caused by insufficient direct stone-on-stone contact which made the mixture susceptible to permanent deformation. Visual observations of the pavement trench at the location where the rutting was greatest (1.8 inches) revealed no definite shear pattern within the cross section ofthe large stone base layer. However, laboratory measurements showed a significant reduction in the air voids content of the top four inches of the pavement after two years of exposure to coal haul traffic loads. This significant reduction in air voids coupled with a lack of sufficient stone-on-stone contact contributed to the plastic behavior of the material. Pavement elevation data indicate that there has been an overall settlement of the roadway. This settlement may be attributed to consolidation of the subgrade, and also densification of the drainage blankets caused by upward migration of fines from the dense graded aggregate (DGA) into the open-graded No. 57 layer and overall consolidation and penetration of particles along the interface between the two layers. This condition was perhaps accelerated by poor pavement drainage.
1
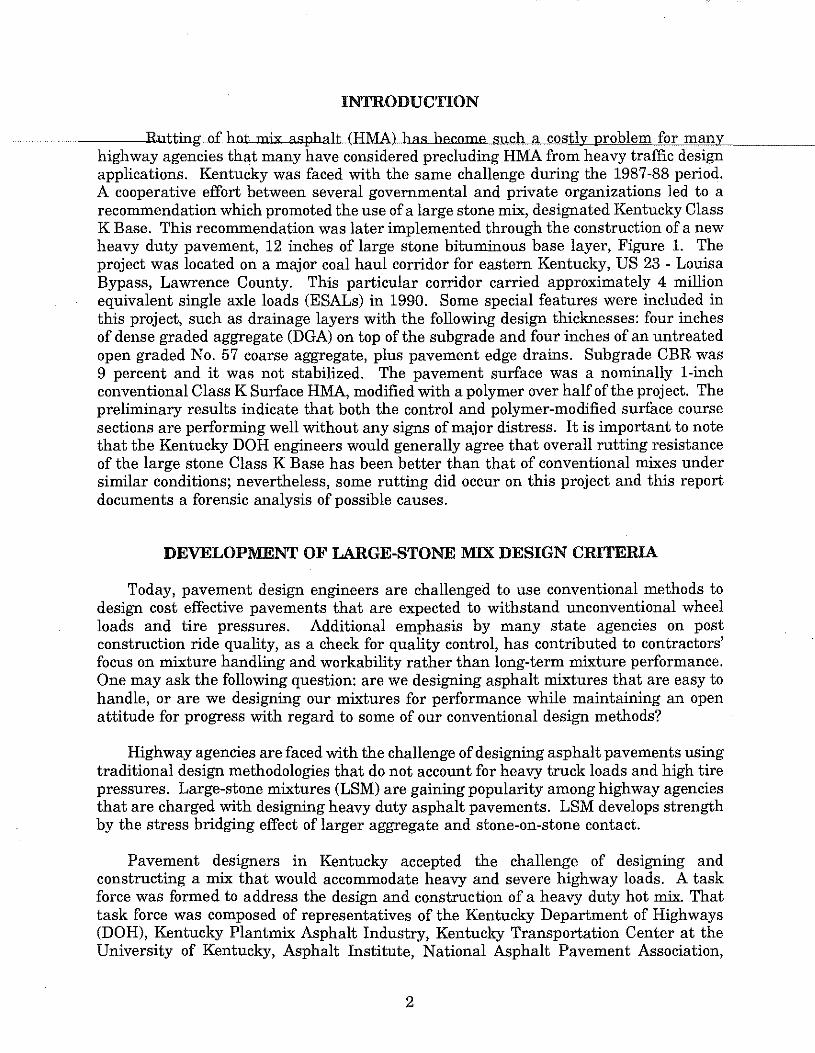
INTRODUCTION
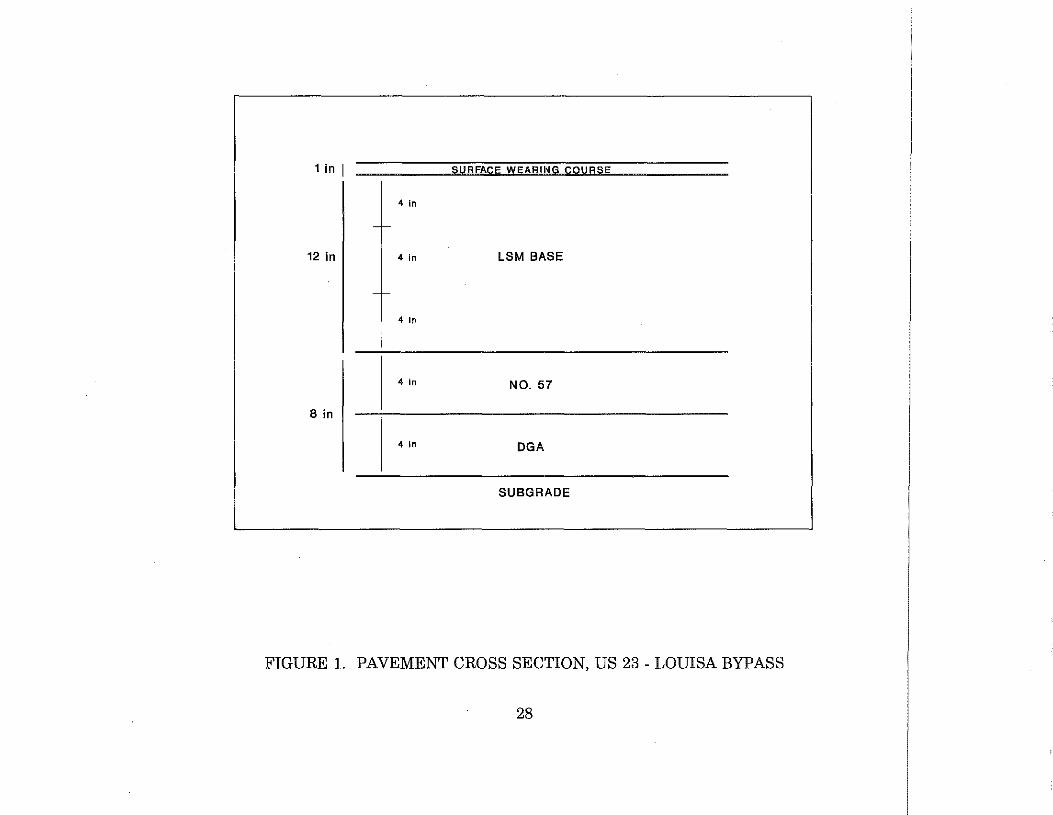
Rutting of bot mix asphalt (HMA) has become such a costly problem for many highway agencies that many have considered precluding HMA from heavy traffic design applications. Kentucky was faced with the same challenge during the 1987-88 period. A cooperative effort between several governmental and private organizations led to a recommendation which promoted the use of a large stone mix, designated Kentucky Class K Base. This recommendation was later implemented through the construction of a new heavy duty pavement, 12 inches of large stone bituminous base layer, Figure 1. The project was located on a major coal haul corridor for eastern Kentucky, US 23 - Louisa Bypass, Lawrence County. This particular corridor carried approximately 4 million equivalent single axle loads (ESALs) in 1990. Some special features were included in this project, such as drainage layers with the following design thicknesses: four inches of dense graded aggregate (DGA) on top of the subgrade and four inches of an untreated open graded No. 57 coarse aggregate, plus pavement edge drains. Subgrade CBR was 9 percent and it was not stabilized. The pavement surface was a nominally l-inch conventional Class K Surface HMA, modified with a polymer over half ofthe project. The preliminary results indicate that both the control and polymer-modified surface course sections are performing well without any signs of major distress. It is important to note that the Kentucky DOH engineers would generally agree that overall rutting resistance of the large stone Class K Base has been better than that of conventional mixes under similar conditions; nevertheless, some rutting did occur on this project and this report documents a forensic analysis of possible causes.
DEVELOPMENT OF LARGE-STONE M1X DESIGN CRITERIA
Today, pavement design engineers are challenged to use conventional methods to design cost effective pavements that are expected to withstand unconventional wheel loads and tire pressures. Additional emphasis by many state agencies on post construction ride quality, as a check for quality control, has contributed to contractors' focus on mixture handling and workability rather than long-term mixture performance. One may ask the following question: are we designing asphalt mixtures that are easy to handle, or are we designing our mixtures for performance while maintaining an open attitude for progress with regard to some of our conventional design methods?
Highway agencies are faced with the challenge of designing asphalt pavements using traditional design methodologies that do not account for heavy truck loads and high tire pressures. Large-stone mixtures (LSM) are gaining popularity among highway agencies that are charged with designing heavy duty asphalt pavements. LSM develops strength by the stress bridging effect of larger aggregate and stone-on-stone contact.
Pavement designers in Kentucky accepted the challenge of designing and constructing a mix that would accommodate heavy and severe highway loads. A task force was formed to address the design and construction of a heavy duty hot mix. That task force was composed of representatives of the Kentucky Department of Highways (DOH), Kentucky Plantmix Asphalt Industry, Kentucky Transportation Center at the University of Kentucky, Asphalt Institute, National Asphalt Pavement Association,
2
Chevron USA Inc., and Ashland Oil Co. The task force recommended that alterations in the aggregate gradations could yield more stone-on-stone contact, higher stress resistance (especially shear stress), and thereby provide needed improvements in rutting and shoving resistance.
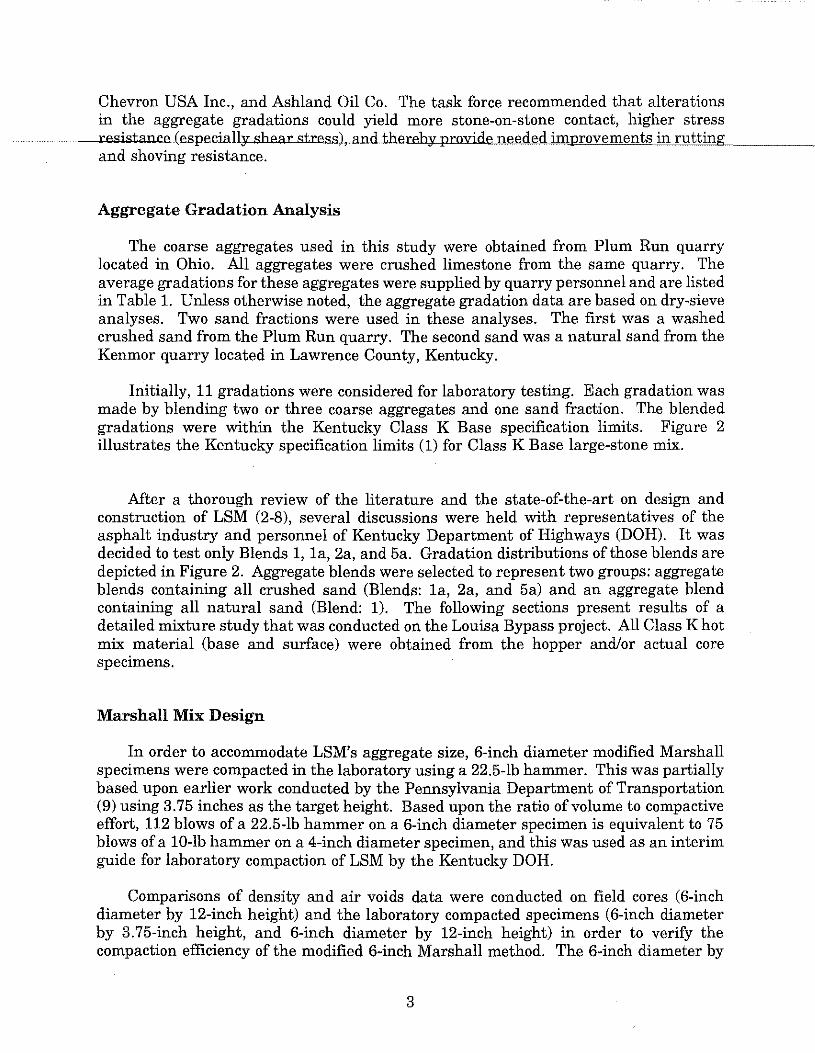
Aggregate Gradation Analysis
The coarse aggregates used in this study were obtained from Plum Run quarry located in Ohio. All aggregates were crushed limestone from the same quarry. The average gradations for these aggregates were supplied by quarry personnel and are listed in Table 1. Unless otherwise noted, the aggregate gradation data are based on dry-sieve analyses. Two sand fractions were used in these analyses. The first was a washed crushed sand from the Plum Run quarry. The second sand was a natural sand from the Kenmor quarry located in Lawrence County, Kentucky.
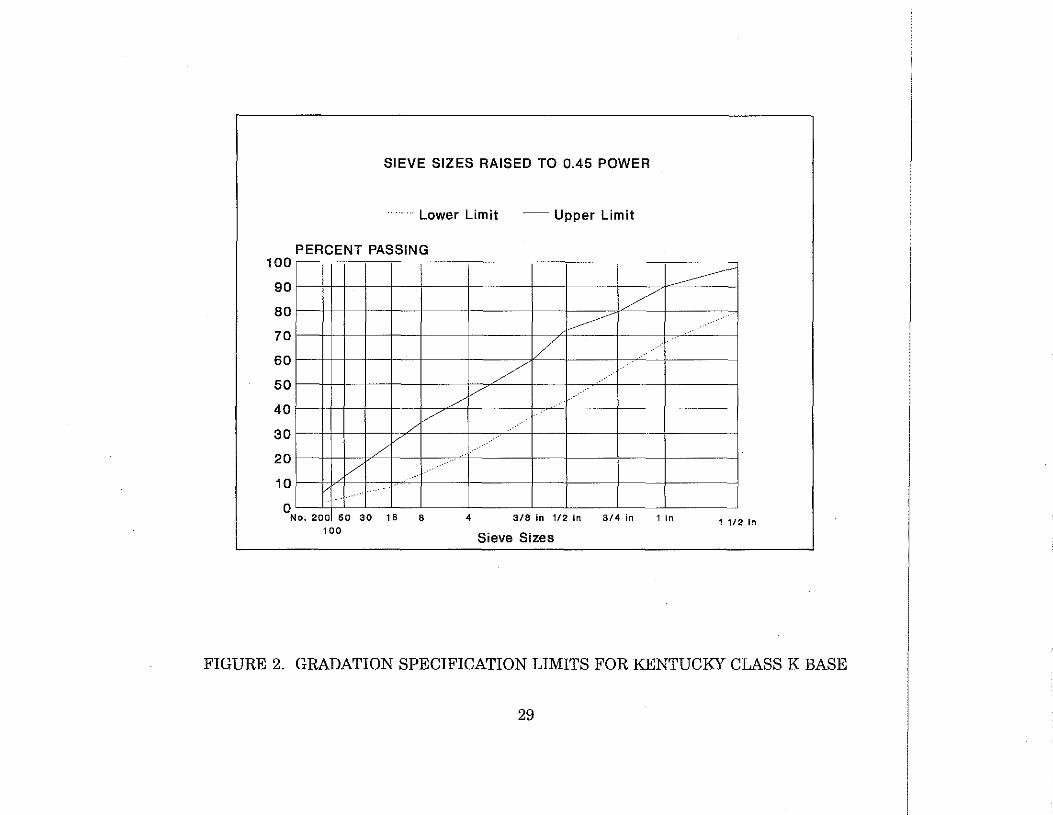
Initially, 11 gradations were considered for laboratory testing. Each gradation was made by blending two or three coarse aggregates and one sand fraction. The blended gradations were within the Kentucky Class K Base specification limits. Figure 2 illustrates the Kentucky specification limits (1) for Class K Base large-stone mix.
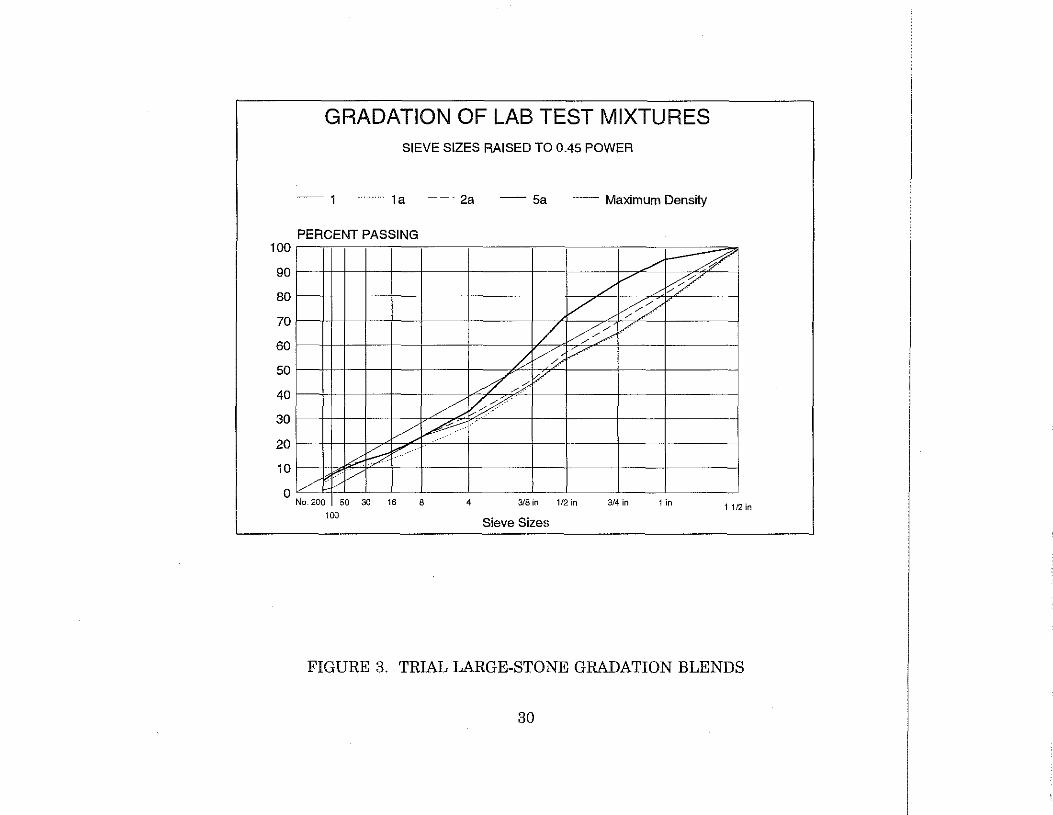
Mter a thorough review of the literature and the state-of-the-art on design and construction of LSM (2-8), several discussions were held with representatives of the asphalt industry and personnel of Kentucky Department of Highways (DOH). It was decided to test only Blends 1, 1a, 2a, and 5a. Gradation distributions of those blends are depicted in Figure 2. Aggregate blends were selected to represent two groups: aggregate blends containing all crushed sand (Blends: 1a, 2a, and 5a) and an aggregate blend containing all natural sand (Blend: 1). The following sections present results of a detailed mixture study that was conducted on the Louisa Bypass project. All Class K hot mix material (base and surface) were obtained from the hopper and/or actual core specimens.
Marshall Mix Design
In order to accommodate LSM's aggregate size, 6-inch diameter modified Marshall specimens were compacted in the laboratory using a 22.5-lb hammer. This was partially based upon earlier work conducted by the Pennsylvania Department of Transportation (9) using 3.75 inches as the target height. Based upon the ratio of volume to compactive effort, 112 blows of a 22.5-lb hammer on a 6-inch diameter specimen is equivalent to 75 blows of a 10-lb hammer on a 4-inch diameter specimen, and this was used as an interim guide for laboratory compaction of LSM by the Kentucky DOH.
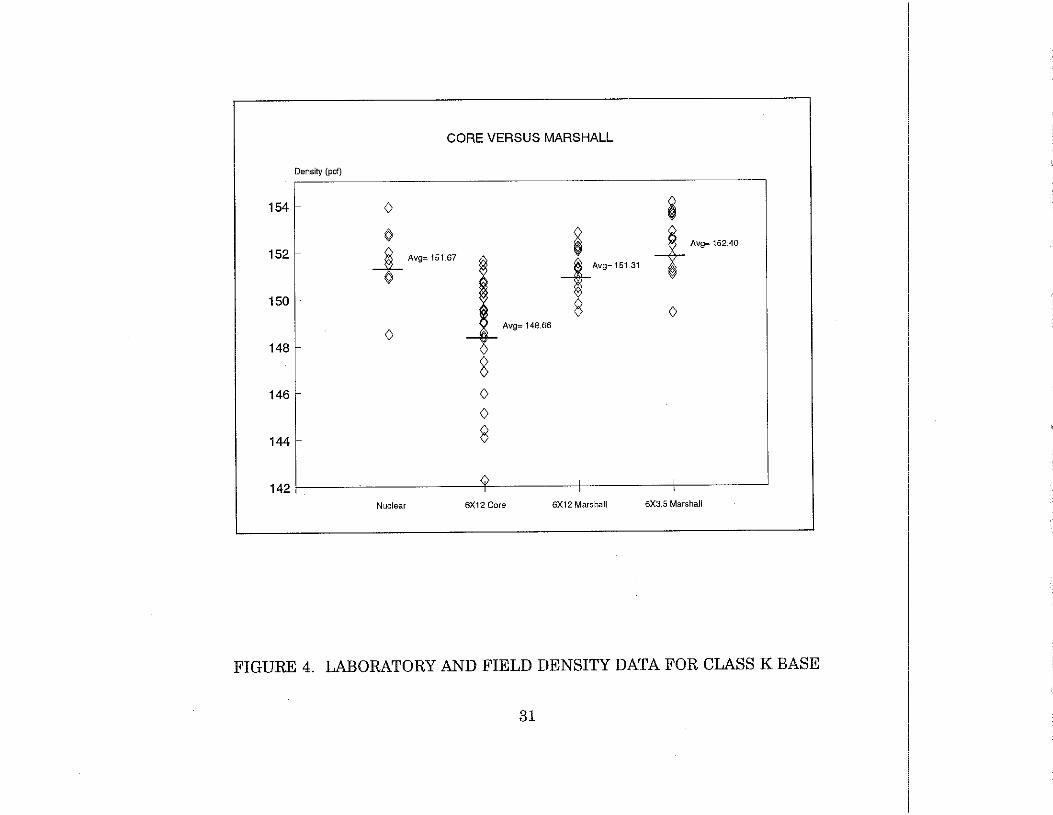
Comparisons of density and air voids data were conducted on field cores (6-inch diameter by 12-inch height) and the laboratory compacted specimens (6-inch diameter by 3.75-inch height, and 6-inch diameter by 12-inch height) in order to verify the compaction efficiency of the modified 6-inch Marshall method. The 6-inch diameter by
3
12-inch high LSM specimens were compacted in three 4-inch lifts based on weight/volume relationships and a sufficient number of 22.5-lb blows to yield densities similar to the 6-inch diameter by 3 75-inch high specimens. Results are presented in Figures 4 and 5 which demonstrate that target densities and air voids may be readily achieved using the modified 6-inch Marshall method. The laboratory compaction procedures produced higher densities and lower air voids; this phenomenon is almost universal in all mixture design procedures. The 6-inch diameter by 12-inch high pavement cores and laboratory manufactured specimens were later tested for creep and permanent deformation.
The first trial specimen was compacted at 135 blows per side in an effort to obtain high Marshall stability. Compaction was equivalent to 88 blows per side on a 4-inch diameter standard Marshall specimen which resulted in a relatively high density (approximately 150 pounds per cubic foot) and a low void content; however, considerable particle crushing occurred. All remaining 6-inch diameter specimens were compacted at 112 blows per side. From the mixture stability point of view, Blend la was recommended as the gradation of choice for large-stone base construction in Kentucky (10); Marshall mix design data are summarized in Table 2.
One may say the 6-inch Marshall should not include particles that are larger than 1.125 inches when considering similitude of the standard 4-inch Marshall specimen that contains top-size aggregate requirement of 0.75 inch, which may appear as a point of concern regarding the type of LSM that was used in Kentucky (Class K Base top-size: 1.5-inch). This is a minor concern since at least 95 percent of the Class K particles pass the 1.5-inch sieve.
Realizing that not all bituminous laboratories have 6-inch diameter Marshall molds and testing capabilities, the U.S. Corps of Engineers (11) recommended a procedure by which large particles (larger than l-inch diameter) are removed from the gradation and replaced with particles ranging from 3/4-inch and up to l-inch. This procedure was used on both 4-inch and 6-inch diameter specimens and results are presented in Table 3. These data suggest that mix variables such as density, air voids, voids in the mineral aggregate (VMA), and flow were only slightly affected by this procedure. The mixture stability, however, exhibited a pronounced sensitivity to the Corps of Engineers large aggregate replacement procedure. It is therefore recommended not to alter the gradation of LSM in order to satisfy the requirements of the 4-inch diameter Marshall test, unless verifiable stability correlations are available for the Corps of Engineers gradation adjustment procedure.
Compressive Strength
In addition to the conventional stability and flow tests, mechanistic tests were conducted in order to obtain data for defining the fundamental mechanical deformation characteristics of LSM. Tests included compressive strength, creep and permanent deformation, and resilient modulus.
It was decided to conduct a limited sensitivity study since there was a lack of sufficient data on the effectiveness of the modified Marshall mix design procedure as
4

compared to other mix design procedures. The objective of this limited study was to quantifY the sensitivity of the strength and deformation characteristics of the Kentucky Class K Base mix to variations in asphalt content and method of compaction. Three methods of compaction were used, they were: 6-inch modified Marshall, vibratory, and kneading.
The unconfined compression test is often used as an indirect index test for determining the resistance of an asphaltic mixture to shear flow and permanent deformation; i.e, rutting and shoving. In this study, the compressive strength tests were conducted by the Asphalt Institute. Specimens were 6 inches in diameter and 6 inches in height. Unconfined compressive tests were conducted at 77'F and 0.05 inch per minute rate of loading. These data are presented in Figure 6. The data suggest that the method oflaboratory compaction has a significant influence on the compressive strength ofLSM.
It is clear that the modified Marshall compacted specimens were sensitive to variations in asphalt content. This is particularly desirable for mix design purposes. A moderate peak in the LSM compressive strength occurs in the neighborhood of the optimum asphalt content.
Resilient Modulus
Elastic modulus is a measure of a material's response to load and deformation. Modulus of elasticity relates the forces causing deformation to actual deformation. In pavement technology, the resilient modulus has long been used as a surrogate parameter for elastic modulus because it lends itself to relatively simple testing procedures. For pavement design and analysis purposes, generally, higher moduli indicate more resistance to deformation, deflection, and longer pavement life. A high modulus surface and/or base layer will also protect the subgrade from being overstressed and should reduce the probability of subgrade failure.
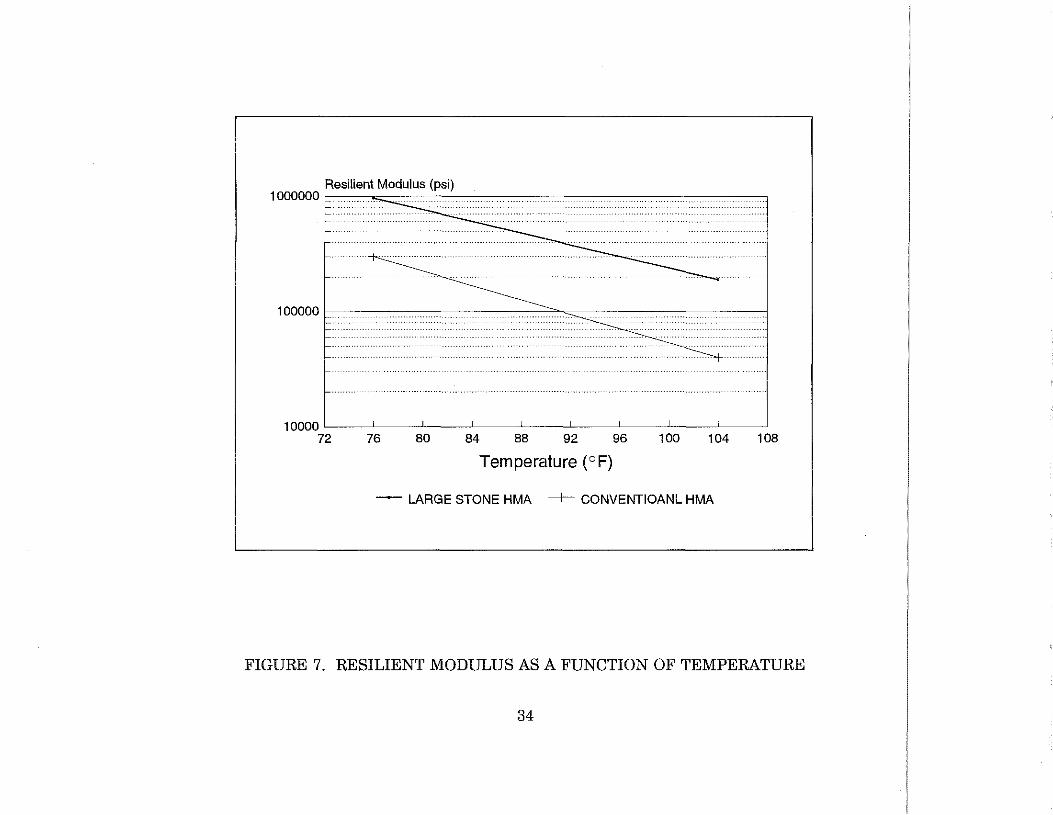
Characterization of the LSM from a structural point of view was of great interest to Kentucky DOH officials. Resilient modulus tests were conducted at various temperatures to better understand the potential structural benefits of the LSM. Chevron U.S.A., Inc., in Richmond, California, participated in the resilient modulus testing program. The resilient modulus data for a range of temperatures are summarized in Figure 7. The data indicate that an LSM pavement layer offers a higher level of structural capacity as compared to a conventional hot mix asphalt (HMA) layer of the same thickness. Largestone mixes may be very cost competitive in terms of their added structural capacity combined with their lower optimum asphalt content.
Static and Dynamic Creep
The Kentucky Transportation Center at the University of Kentucky conducted several creep tests on 6-inch diameter by 12-inch high pavement cores and laboratory compacted specimens of the same dimensions at 104'F. This mechanistic methodology
5
is often used for characterizing permanent deformation. Both static and dynamic (cyclic repeated-load) creep tests were conducted at 29 psi. The static creep test consisted of monitoring the creep strain for one hour under a constant load of 29 psi. Dynamic creep tests were conducted under repeated-load, square-shaped pulses at 1-Hertz. The resilient and permanent components of deformation were recorded. The data from both static and dynamic tests were then merged in order to study permanent deformation characteristics of LSM under static and dynamic modes. This was possible under the assumption of linear viscoelasticity. For example, the cumulative creep deformation caused by a set of ten, 1-Hertz, load pulses was assumed to be equivalent to the creep deformation caused by ten seconds of continuous static creep load. The merged data are presented in Figure 8. The trends in Figure 8 indicate that laboratory specimens which were compacted using the modified Marshall hammer are less prone to permanent deformation than the LSM pavement cores. This is due to the fact that higher densities and efficient packing of particles are more likely to be achievable under laboratory conditions.
The stone-on-stone contact of aggregate particles in the LSM reduces the probability of plastic flow due to low air voids and/or high densities. Mix design criteria that are commonly applied to conventional HMA should be re-examined before extrapolating them to LSM design situations. The observation that the method of laboratory compaction significantly influences the mechanical behavior of the LSM is consistent with the compressive strength data presented in Figure 6.
CONSTRUCTION OF THE LOUISA BYPASS
The Kentucky DOH personnel selected several coal haul sections for field testing of an experimental LSM. The Louisa Bypass on U.S. 23 in Lawrence County (3 miles, 4 lanes) is a newly constructed pavement located on the major coal-haul corridor for eastern Kentucky. The subgrade was constructed under a separate contract (F-23-1-58). This contract required a rock subgrade, defined as a 12-inch lift of shot sandstone. However, the available quantity of sandstone, from excavation, permitted only about 30% of the subgrade to be rock subgrade. The remaining subgrade was constructed with material having on average Kentucky CBR of 9 percent, based upon over 30 tests by Kentucky DOH. The subgrade was then covered with eight inches of granular subbase which consisted of four inches of dense graded aggregate covered by four inches of No. 57 rock. These variations provide an opportunity for evaluation oflong-term performance variations due to structural factors. The pavement was originally intended to be a fulldepth asphalt structure; however, due to the presence of shale in the subgrade, which is prone to rapid strength deterioration, it was decided to include a granular subbase layer. The subbase layer consisted offour inches of dense graded aggregate (DGA) covered with four inches of an open graded, large-stone drainage layer.
Twelve inches of LSM base was constructed on top of the subbase layer in three 4-inch lifts. A l-inch surface wearing course completed the project. Asphalt grade AC-20 was used for the project and the asphalt in the surface wearing course was modified with a polymer over half of the project. The use of polymer-modified asphalt was part of the Kentucky DOH's experiments with modified asphalts. The Kentucky Transportation Center maintains a permanent file of project photographs. Pavement related
6
construction activities (late 1987 through late 1988) were documented on photographs, slides, and videotapes, which are available for review upon request.
The following items are the result of numerous observations that were made during construction of the Louisa Bypass and in particular the large-stone base. Some of these points may apply to all types of hot mix asphalt (HMA) construction; however, in many instances, large-stone mixes are more sensitive to construction errors than their conventional counterparts (12). It is extremely important to maintain close technical supervision over mix design, plant mixing, mix laydown, and compaction operations during the construction of LSM.
Mix Design
The 6-inch diameter by 3.75-inch thick modified Marshall method of mix design® was adopted by the Kentucky DOH. There are several factors that contribute to a successful LSM mix design.
1- Adequate asphalt film thickness is necessary for workability and durability. This is controlled by the asphalt content and percent mineral filler in the aggregate. In conventional HMA construction, asphalt film thickness ranges from 6 to 8 microns and fme materials act as asphalt extenders (13). Current experience shows that LSM have similar film thickness to conventional mixes.
2- Percent voids in the mineral aggregate (VMA) must be sufficient to accommodate the desired film thickness at maximum field density without excessive reduction in air voids. The VMA of Kentucky LSM was 11.5 percent which is consistent with the widely accepted criterion set by the Asphalt Institute (14) and the National Asphalt Pavement Association (3).
3- Laboratory compaction of 6-inch diameter by 3.75-inch high Marshall specimens may be achieved at 112 blows per side using a 22.5-lb Marshall hammer (9, 15, 16). Densities achieved in the laboratory may be closely duplicated during construction, see Figure 4.
4- Air voids should be in the range of 3.5 to 5.5 percent with the average being 4.5 percent. This range will minimize both air and water permeabilities. Figure 4 illustrates the variations in the air void content of laboratory and field specimens.
Plant Mixing
The contractor for this project, Mountain Enterprises - Inc., used a batch plant for mixing. The facility had a 100-ton surge tank, which contributed partly to segregation due to transport. This problem was ameliorated by a front-back-center sequence of
7

mixture drops during truck loadings. Figure 9 shows an overview of the mixing plant; the mix temperature was approximately 310'F at the time of transport. The following is a list of observations and recommendations dealing with the plant mixing operations.
1- Plant mixing time may need to be adjusted slightly for LSM. A longer mixing time, as compared to conventional HMA, may be necessary to assure coating of larger aggregate particles.
2- Overall, mixing of the LSM did not induce unusual wear upon the plant mixing equipment, except the gradation unit screens, which showed somewhat higher than usual wear.
3- Careful attention must be paid to aggregate feeding and mixture handling to avoid segregation. Cone formation and the resulting segregation of aggregate and mixture may be avoided by multiple material drops; this will minimize segregation.
Laydown Operations
The contractor used a tracked paver for the first lift on top of the unbound No. 57 subbase layer; other lifts were placed with a conventional rubber tired paver. Generally, contractors seem to prefer a stabilized layer as a working platform, one option that is gaining popularity in Kentucky is an asphalt stabilized No. 57 subbase layer (2% AC content). Figure 10 shows an overview of the laydown operation; mixture temperature ranged from 300'F to 280"F at the time of laydown.
Segregation is always a potential problem with large stone mixtures. Although this problem was difficult to quantify, the construction of the Louisa Bypass project included test strips which allowed appropriate adjustments to be made to minimize segregation. There are several important laydown operational details that may be used to minimize segregation in the LSM. The following is a list of recommendations dealing with the LSM laydown operations.
1- Coarse particles accumulating in the paver wings should be discarded and never be incorporated into the flow of mix to the screen hopper.
2- Mixture in the receiving hopper bed should be maintained at a minimum depth of 18 to 24 inches to prevent accumulated coarse particles from reaching the slat conveyor.
3- The receiving hopper gates should be set to provide as nearly continuous flow of the mixture as possible. A continuous operation of the distribution augers at full capacity is required to ensure mass movement of material for the entire screed.
4- Paver speed should be regulated to accommodate the mixture production and transport rates. Avoiding "stop-and-go" in the paver operation reduces
8
segregation, improves the texture of spread, and eliminates any tendency for screed settlement (15-17).
5- A minimum lift thickness of 3.5 inches will minimize the effect of large aggregate boundary restrictions for the Class K Base mix.
Compaction Operations
Figures 11 and 12 show typical compaction equipment that was used in this project. The following is a list of observations and recommendations dealing with the LSM compaction operations.
1- Although most LSM gradations are very coarse graded and tend to be harsh, required density may readily be achieved through proper use of a variety of suitable conventional compaction equipment.
2- Primary compaction should commence immediately after mixture spreading. Density may readily be achieved at compaction temperatures ranging from 280'F to 250'F. Compaction at lower temperatures requires considerable increase in roller coverage and is not recommended. Lateral displacement of this rather harsh mix was not a problem. A successful compaction sequence for this project included the following: (a) two passes of a vibratory roller in the static mode for breakdown rolling, (b) six passes of a vibratory roller at high frequency and low amplitude for primary compaction, (c) the mixture density was not increased by the pneumatic roller, additional compactive effort was required in the finish rolling to obtain the desired density, and (d) two passes of a static roller to smooth the surface.
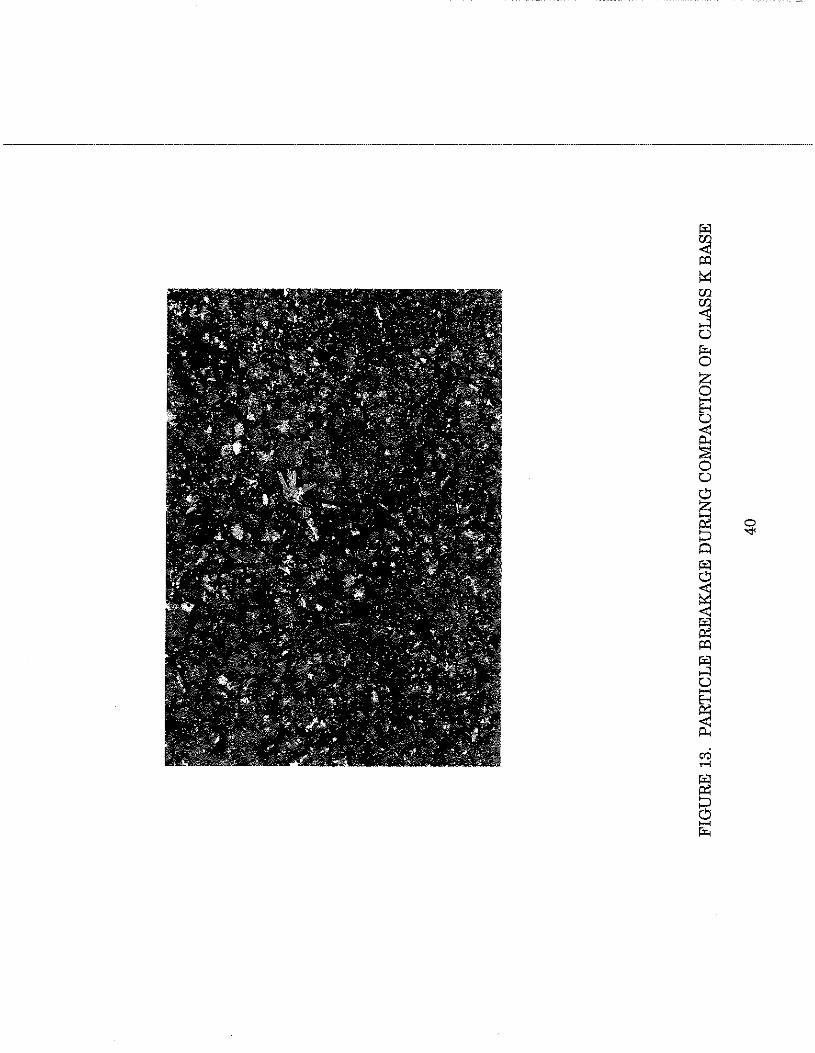
3- Since the stone-on-stone contact structure of LSM may produce high point stresses of large aggregate particles during compaction, the frequency and amplitude of the vibratory roller may need to be adjusted to reduce particle breakage and optimize compaction, see Figure 13. This is especially true whenever relatively rigid bases (Kentucky Mountain Parkway LSM overlay on broken and seated portland cement concrete project) are encountered.
Quality Control
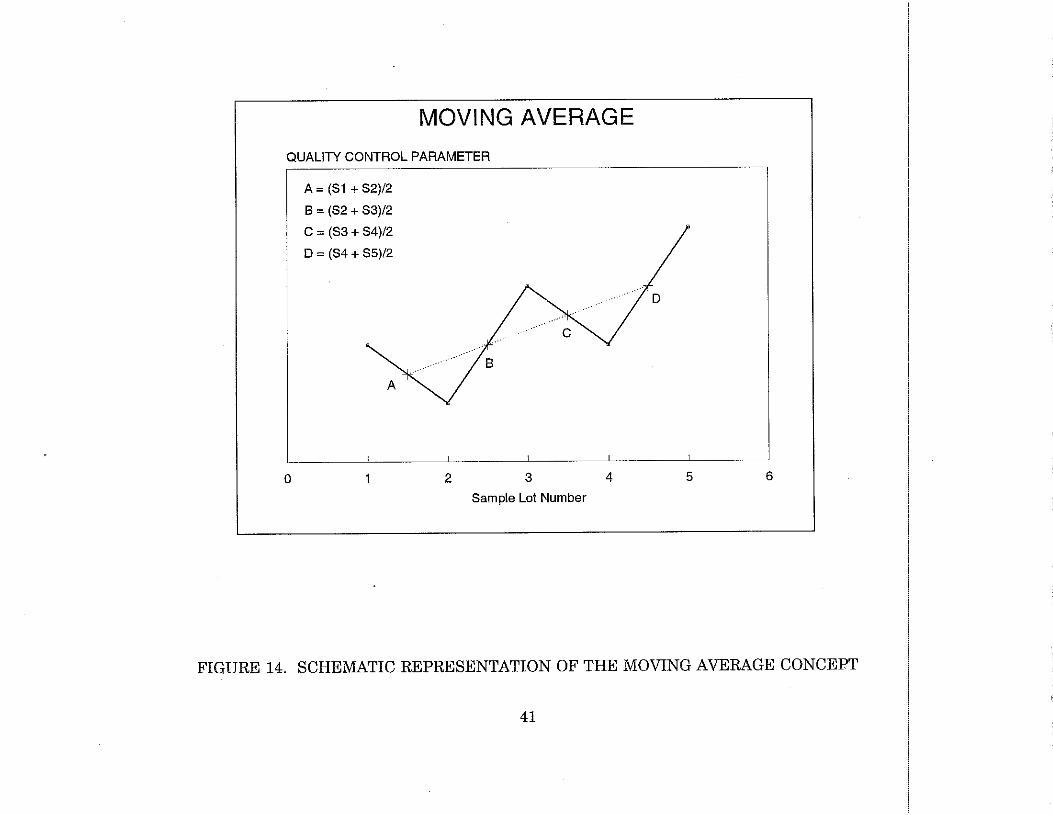
1- Quality control should be used in the construction of LSM in order to ensure adherence to design parameters such as aggregate gradation, asphalt content, density, and air void content. Moving averages should be maintained and used as the basis for evaluating variability of mixture parameters. A schematic of the concept of moving averages that is recommended for quality control is presented in Figure 14.
9
2- Asphalt extraction and gradation tests should be conducted on as large quantities of LSM material as equipment will permit so that samples will
________ __,b~e1'-"rue7p!!r_l2e~sde'2!n'!'t"'a~ti!!·v~1e;co'!!f~t!c'h~e,_b':-u~lgk'-f.lmga!.'tc"'e~ri"'a""l.'--'To..co'.':t':'cal~d':'ca~il:t_Y_lm~d~ix':'t~u1~r':'e.'o":u';:1tp!'u.':'.'Ct-':'o:'cf_<:th';:e~---- _____ _ p ant an aspha t cement tonnage is a convenient an re ative y accurate way of determining the average daily asphalt content in lieu of time consuming extraction tests.
3- Compaction pattern is a function of equipment that is available at the site. The pattern should be established initially by construction of a test section (at least 500-foot long and 12-foot wide). Construction of a control strip is also useful for detecting potential segregation problems. Rolling patterns and coverages that are required to produce the desired density should be maintained throughout the job. Target density on the job was based upon 93 to 94 percent of solid volume (i.e. 6 to 7 percent air void). The control range was set at 92 to 97 percent of solid volume.
4- Field density evaluations should be made frequently to assure that the compaction procedure is adequate. If the desired density is not being achieved, adjustments to roller coverage should be made. If large adjustments are required, a new test section should be constructed.
OTHER EXPERIMENTAL FEATURES
Drainage Structures
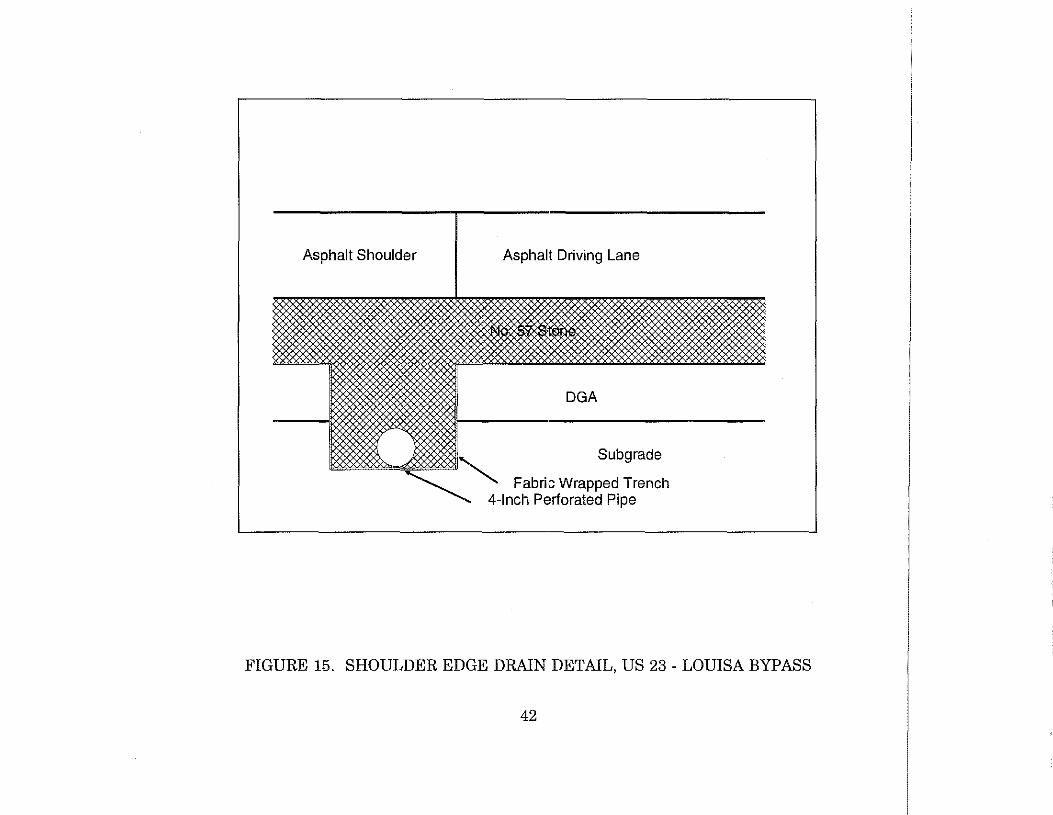
Portions of the Louisa Bypass were constructed on a weak shale native to eastern Kentucky. Drainage and pavement support were both critical issues during the design and construction of this bypass. A 4-inch layer of No. 57 stone was placed between 4 inches of DGA and 12 inches of asphaltic concrete. This layer is utilized as a drainage layer which transports water from under the pavement to the edge drains and adds additional support to the pavement structure. The longitudinal edge drains were installed throughout the entire project in both directions in the center median and the outside shoulders. The edge drain consisted of a 1-foot by 1-foot trench in which the bottom and sides were lined with filter fabric. A 4-inch perforated pipe was placed in the trench and backfilled with No. 57 stone. Figure 15 shows a typical cross section ofthe edge drain and the drainage layer.
Additional surface drainage was added in the superelevated sections where 12-inch slotted drain pipe was placed in the center median (Figure 16).
Polymer-Modified Surface Wearing Course
A one-inch surface wearing course was placed on top of the 12-inch large-stone bituminous base layer. A control (Station 1170 to Station 1285, Figure 17) and polymermodified section (Station 1285 to Station 1313, Figure 17) experimental section arrangement was developed to evaluate the effectiveness of the polymer-modified surface
10

course in reducing rutting when applied on top of a rather thick and relatively stiff LSM pavement layer. The bridge at approximately the midpoint of the project (Station
____ -~1~218;""5"'"+"'-7""'3~F~id~fi~r_,ed,1=:7'-"-.w~a"'s:-'c""o';;n~s~idhpe'f1r""e"'d_ct"'o';-dbfe~t~h"'-e~d~ic.evd~id~i~n:!2g-lp~o~i;:.n) ::.t _::b::;eb~tw:;;:e::en::-:-:t~h:.::e~c:::o;::n~t::_ro-;l:_;an-;d;;_ _____ _ po ymer-mo i 1e sections. Bot anes ( riving an passing on ot approac es nort and south) were included in this experiment. All lanes on the north end of the bridge were surfaced with polymer-modified mix, while the south end of the project was surfaced with a control mix. Table 4 presents a summary of data characterizing the surface course on this project.
CONSTRUCTION PROBLEMS
A full strength asphalt emulsion SS-1h prime was sprayed on the DGA prior to the placement of the No. 57 stone. On July 21, 1988, it was observed that the prime had been over sprayed onto the filter fabric which lined the trench between Station 1164+00 to Station 1322+50, see Figure 18. In summary, the primary purpose of the filter fabric was to keep fines from the subgrade and DGA out of the drainage system. It is possible that the prime coat stained fabric may retard water from entering the edge drain. This condition has clearly provided an opportunity for excessive free moisture accumulation in the subbase and subgrade, a point which will be discussed in more detail under the section devoted to performance of the drainage blanket.
Additionally, a section of DGA was sprayed between Station 1308+00 to Station 1322+50 on July 21, 1988; late that afternoon a rain washed the prime coat from the DGA into the edge drains. It appeared that the emulsion prime coat had been washed into the drains on most of the southbound side. In several areas, the filter fabric appeared to have been stained with the diluted prime coat. Dark colored water had been observed flowing from the headwalls after several rainstorms over a period of months.
A construction error was identified where DGA was being used as a backfill for the edge drain. The resident engineer was notified and the DGA was replaced with the specified backfill material.
Segregation ofHMA is a problem that is very difficult to quantify, Figures 19 and 20 show that the segregation was not a major problem. The contractor made an effective use of test strips to determine two things: a) ways to reduce segregation during laydown, and b) optimum roller coverage during compaction.
LONG-TERM PERFORMANCE MONITORING
The Louisa Bypass has been in service for approximately 2112 years (since July 31, 1989). Plans have been made to monitor the long-term performance of this project under Project KYHPR-85-107, Subtask 19. Figure 17 is a schematic of the Louisa Bypass. Several inter-layer thin metal strips were placed between the 4-inch LSM lifts. Borescope holes were drilled at those locations to determine the contribution of each layer to the overall rutting; this tool proved to be ineffective and pavement cores were collected for that purpose. A pavement trench was also excavated for a detailed study of
11
individual pavement layers. A mini camera was used to examine the condition of the drainage system.
The following sections describe performance characteristics of different components of the Louisa Bypass project.
Drainage Inspection
The drainage system was inspected on an annual basis (August 1990, and August 1991). The following is a summary of observations.
Headwalls
The headwalls of the edge drains and the slotted surface drains were inspected. The edge drain outlets appeared to be free of silt. No water was flowing from the drains at the time of inspection but water was standing in the corrugations of the pipe. It appears the headwalls are functioning satisfactory. The slotted surface drains appeared to be relatively free of organic matter.
Drainage Pipes
The borescope inspection was not effective in providing high resolution view ofthe drainage pipes. A mini-television camera was used instead. The mini camera was inserted in the drainage system and revealed that the majority the perforated drainage pipe system was compressed due to the overburden pressure. Faulty installation of drainage systems on this project is consistent with the findings of a recent report by the Kentucky Transportation Center (KTC-90-10 "Performance of Corrugated Polyethylene Pipe"). This observation is an indication that the pavement drainage system may not be effective.
Analysis of Pavement Rutting Data
Six monitoring points were established for rut measurements prior to the bypass being opened to traffic. The surface at all six monitoring points appeared to be smooth and no rutting or irregularities were noted. Rut measurements were then taken in August 1990. The measurements are included in Table 5.
The August 1991 field investigations revealed that severe rutting was isolated to locations where trucks travel at relatively slow speeds (10-20 mph) along the northbound driving lane on a steep uphill grade. The greatest amount of rutting after two years of service occurred at milepost 17 .46, and it was measured to be 1.8 and 1.2 inches under the right and left wheel paths, respectively. Figure 21 shows a reconstructed view of the pavement cross section at milepost 17.46 based upon data from pavement cores.
The following sections present an analysis of data based upon a pavement trench (Figure 22) and pavement cores at milepost 17 .46, where the greatest amount of rutting
12
on this project developed. All statistical comparisons were conducted using an analysis of variance (AN OVA) technique, and a least significant difference procedure when needed (18), at 95% level of significance (i.e. alpha error - 5%). In the analyses of pavement · cores, an assumption was made that quality control measures during the construction of this project, as reported by Williams (15, 17), produced a uniform quality mixture (in terms of mixture air voids, and density) within each lane and within each lift at any given milepost. In other words, it was reasonable to assume that before traffic was allowed on this roadway, there were no significant differences in large stone HMA air voids and densities at locations corresponding to future "under" and "between" the traffic wheel paths for any given milepost within each lane and within each lift. Examination of the post-construction data, and specifically the relative coefficient of variability for the air voids and the density of each lift, as a measure of data dispersion, revealed that this assumption was reasonable. The quantitative justification for this assumption is presented in Table 6. It was possible to show that the three 4-inch lifts of the large stone asphaltic base had significantly different air voids prior to traffic, with the top and middle lifts having the highest air voids and the bottom layer having the lowest (F -Value = 19.79>F005233 = 3.29), Table 7. Lower air voids in the bottom lift could be attributed to the follo~rig: a) higher asphalt content (4.1% in the bottom lift as opposed to 3.7% in the middle and top lifts) which was used as a means for reducing the potential for stripping in the bottom lift, and b) some partial compaction during compaction of the middle and top lifts.
The authors believe that the process that has led to rutting on this project is not very different from the one known for conventional hot mix asphalt (HMA). The evidence clearly shows that there has been a significant reduction in the air voids content of the large stone HMA after two years of exposure to heavy truck traffic. It is believed that rutting ofHMA is typically a two-stage process. First, traffic-induced densification often reduces the air void content to a critically low level, which is different for different mixtures. Second, in the absence of a strong aggregate interlock, the critically densified mix deforms plastically under load. In the case of the Class K base, this simply means that the concentration of stone-on-stone contact was not great enough and therefore, some modification of the gradation may be warranted.
The data from the pavement trench did not indicate any distinguishable shear planes within the large stone base layer. The fact that shear planes were not visually detectable in the trenched cross section does not diminish the possibility of shear deformations. Typically, if oblong-shaped aggregate particles are present in the mix, they often align themselves along the direction of shear flow patterns. The large stone aggregate in this project did not include a large percentage of oblong particles, hence the existence of shear flow patterns was not visually verifiable.
The following sections describe significant changes that were observed within each asphaltic sublayer.
Surface Wearing Course
A one-inch thick, dense graded conventional surface wearing course having a construction variability of 1/8 to 1/4 inch throughout the project was used to provide a
13
smooth riding surface. An examination of the pavement trench, at the location where rutting was maximum, indicated that the surface wearing course was by and large stable
------~~WL~~uuur~a~b~le~a~mMonuun~t~owfLr~uwt~t~inllL~w~a~s~d~e~t~e~ct~e~d~in~th~at~la~y~e~r~-~T~h~e~l~-~in~c~h~s~u~r£~a~c~e __ __ layer conformed to the rutting contour of the large stone base. layer. Data will e -----expanded to include the long-term performance of the polymer-modified wearing course.
Top Lift of Large Stone Mixture
The top four inches of the large stone base showed significant changes in the air voids content after two years of service. Along the right wheel path, where the rutting was highest, the air voids were significantly reduced; a change from an average of 6.1 percent to an average of3.0 percent, Table 8. This reduction in air voids was statistically highly significant (F-Value = 188.26>>F00515 = 6.61). The between the wheels cores indicated a significant reduction in the ~ir voids content (F-Value = 70.69>>F00515 = 6.61), but was not as highly significant as the previously indicated change in the right wheel path. The significant reduction in the air voids content effectively indicates an inservice compaction due to traffic. In fact, within the top lift after two years of service, air voids were much lower under the right wheel path than between the wheels (F-Value = 24.02>>F0.05 ,1,4 = 7.71). This behavior may be attributed to the high magnitude of compressive stresses and especially shear stresses within this zone.
Middle Lift of Large Stone Mixture
After two years of service, the middle four inches of the large stone base showed no significant change in the air voids under the right wheel path (F-Value = 0.05<F00515
= 6.61). The between the wheels data indicated a significant reduction in the air void's for this layer (F-Value = 30.7 4>Fo.os,1,5 = 6.61), this trend is somewhat inconclusive at this point and more data are needed to verify this observation.
Bottom Lift of Large Stone Mixture
The bottom lift showed a significant increase in the air voids content after two years of service. The trend was consistent for both under the right wheel (F-Value = 399.5>>F0.05 ,1,5 = 6.61) and between the wheels (F-Value = 15.2>F0,05 ,1,5 = 6.61). This observation is somewhat inconclusive, but the movement of the subbase layers (DGA and No. 57) may have provided an opportunity for an effective decompaction of the bottom base layer. At this point, further studies are needed before any definite conclusions can be made. For example, an analysis of asphalt content of cores obtained from the bottom lift may shed some light on the possible cause (stripping, etc.).
Performance Analysis of the Pavement Drainage Blanket
A two-layer drainage blanket was included in this project as a means for facilitating subsurface pavement drainage. A dense graded aggregate (DGA) layer was placed directly on top of the subgrade (4-inch design thickness). The top surface of the DGA layer was treated with a light emulsion prime coating (SS-lh) prior to placement of the No. 57 subbase (4-inch design thickness). Gradation distributions for the DGA and No. 57 stone are presented in Figure 23. After two years of service, the pavement was
14

trenched at a location where rutting was most severe. The analysis of the trench revealed that the initial nominally 8-inch, two-layer, drainage blanket was approximately 6 75 inches in thickness Considering variations in the construction of such pavement layers, further evidence was sought to characterize this phenomenon. It was noted that the post-construction visual distinction between the two layers has been diminished and the emulsion prime coating was ineffective in this regard.
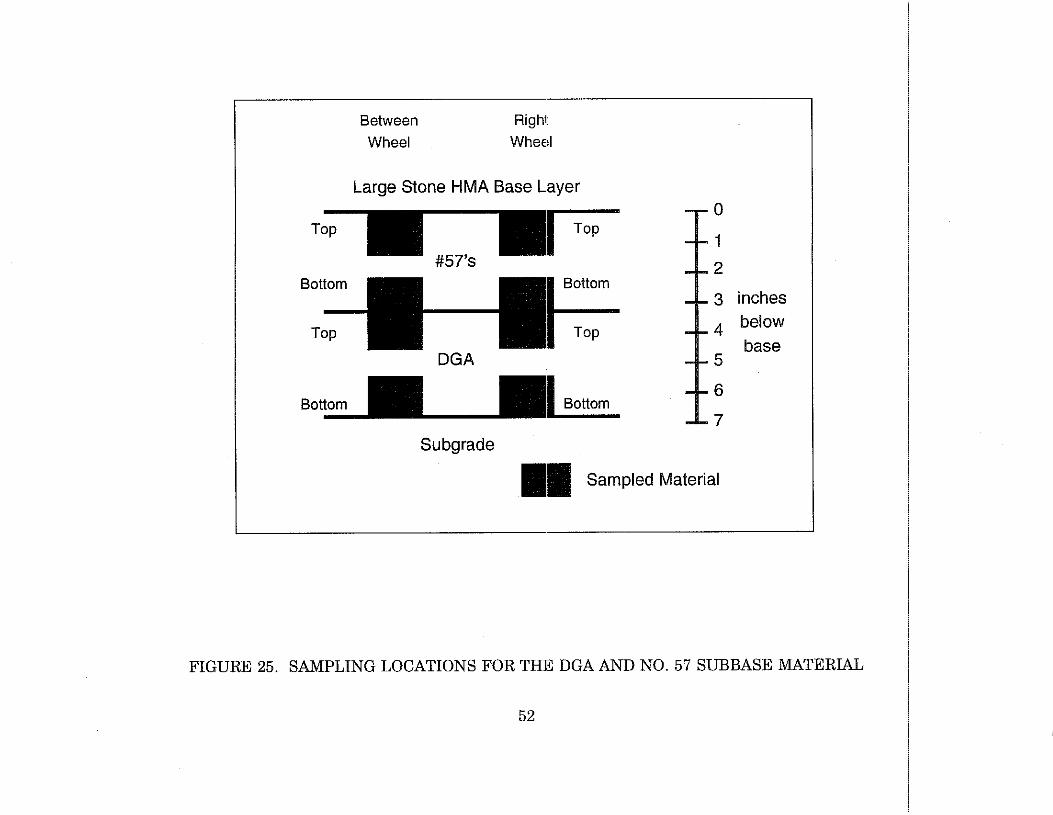
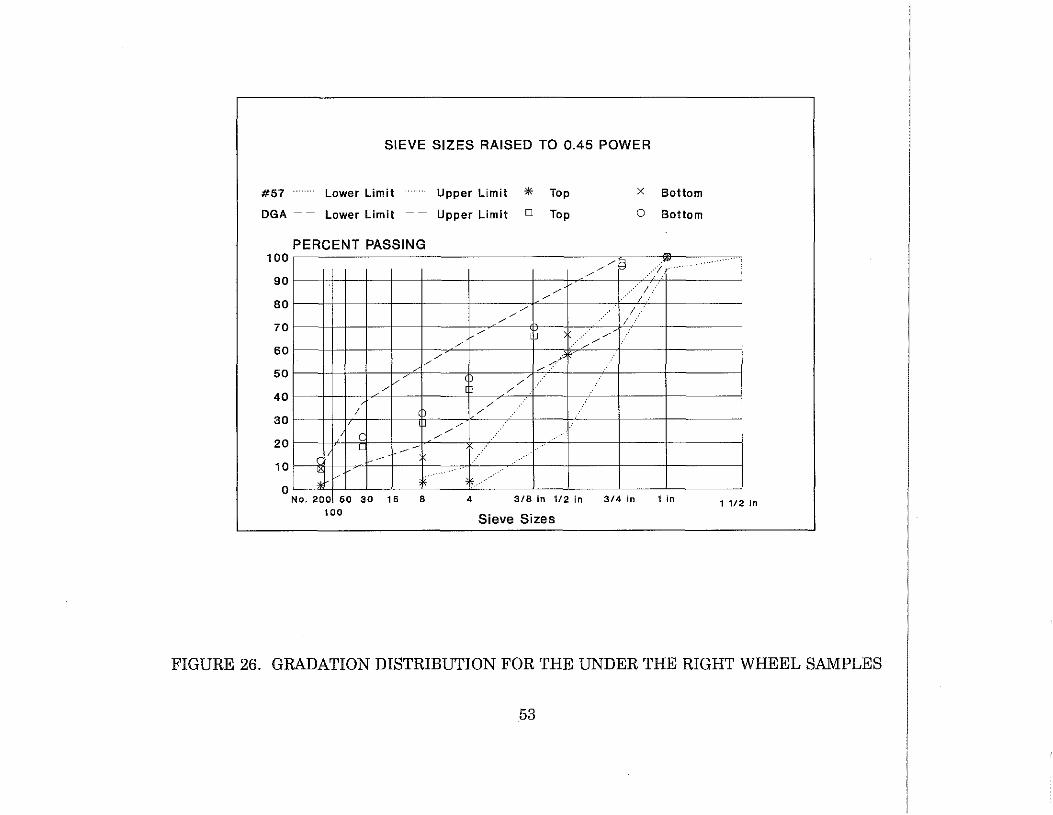
Roadway elevation data revealed an overall pavement settlement, Figure 24. As a follow up to this observation, the filter criteria as reported by the U.S. Bureau of Reclamation (19), were checked for the theoretical gradations (defined as the mid-points within the specification limits) for both DGA and No. 57 drainage layers as a possible reason for the penetration of particles at the interface. It was discovered that the filter criteria were either marginally satisfied or not satisfied at all. This information is summarized in Table 9 (numbers shown in brackets refer to the filter characteristics of the pavement drainage blanket). As a follow-up, actual DGA and No. 57 samples were taken from the pavement trench location in accordance with the details presented in Figure 25. The data showed that there has been some intrusion of small particles into the No. 57 layer, pushing parts of the gradation distribution of the No. 57 materials outside of the specification limits, Figures 26 and 27. This phenomenon was more severe at the under the wheel location. Water associated migration of DGA fines into the No. 57's is possible. Load associated forcing of the No. 57's into the DGA may also cause the thinning. This seems plausible because of the hampered drainage conditions, as described in previous sections, and gradation differences ofthe "between the wheel track" and "under the wheel track" samples. Obviously, more work is needed before the actual cause is determined.
CONCLUSIONS AND RECOMMENDATIONS
Several features were included in this experimental project, but the primary focus of this paper has been on the rutting performance of the large stone asphalt base. In general, the Kentucky Class K large stone asphalt base rates a mixed review. It has clearly improved the rutting performance as compared to conventional asphalt pavements on coal haul roads. On the other hand, there are clear indications that the insufficient concentration of stone-on-stone contact has provided an opportunity for some trafficinduced densification followed by plastic deformation. The fact that shear planes were not visually detectable in the trenched cross section does not diminish the possibility of shear deformations. The large stone aggregate in this project did not include a large percentage of oblong particles, hence the existence of shear flow patterns was not visually verifiable. The changes in the air voids and density in the middle and bottom base layers were somewhat inconclusive and further data are needed prior to any final conclusions.
Large-stone mixes (LSM) offer a number of desirable properties for heavy duty asphalt pavements. The LSM properties that receive high marks include stability, compressive strength, resilient modulus, and creep, all of which contribute to a more rut resistant asphalt mixture. Large-stone mixes offer higher structural capacity at lower optimum asphalt content compared to conventional mixes rendering them cost competitive. It was demonstrated that desired densities and air voids could be readily
15

achieved using a modified Marshall laboratory compaction procedure.
Exp!lrience in Kentucky indicates that large stone mixes (LSM) may be designed and constructed with minimum modification to the existing design and construction procedures. Special attention should be devoted to plant and paver operations for reducing the probability of segregation. Lift thickness should not be reduced below 3.5 inches (for 1.5-inch top size gradation) in order to insure adequate degrees offreedom for particle reorientation during compaction. Current construction equipment and procedures are appropriate for LSM. Careful attention to production and construction details is essential to providing a uniform mixture and an effectively constructed LSM pavement layer.
Mix design and construction procedures for LSM are not being fully developed yet. Additional work based upon the 6-inch diameter modified Marshall procedure is needed to standardize laboratory procedures for specimen preparation and testing. It is recommended that the long-term performance monitoring of this roadway continue. Adjustments in the Kentucky Class K gradations are recommended to ensure a more stone-on-stone contact. This can be done by reducing the fine and mid-size portions and increasing the relative content of larger aggregate.
No significant gain in improving performance of the 1-inch surface mix via adding a polymer to the asphalt is evident at this time. However, this may be a premature conclusion because the road has been in service for a relatively short time and distress modes are not fully developed yet.
The placement of the No. 57 subbase layer directly over the dense graded aggregate (DGA) warrants a review; adjustments are warranted to minimize the migration of fines. Installation of pavement drainage systems, in particular perforated plastic pipe, should be in accordance with recommendations contained in report KTC-90-10 "Performance of Corrugated Polyethylene Pipe".
REFERENCES
1. Kentucky Transportation Cabinet, Department of Highways. Standard Specifications for Road and Bridge Construction. Frankfort, Kentucky, 1988.
2. P.S. Kandhal. Testing and Evaluation of Large Stone Mixes Using Marshall Design Procedures. An Interim Report, National Center for Asphalt Technology, Auburn University, April 1989.
3. M. Acott. The Design of Hot Mix Asphalt for Heavy Duty Pavements. Quality Improvement Series 111/86, National Asphalt Pavement Association, Maryland, 1988.
4. M. Acott. Design and Performance Study of a Heavy Duty Large Stone Hot Mix Asphalt Under Concentrated Punching Shear Conditions. Information Series 105, National Asphalt Pavement Association, Maryland, 1989.
16
5. F.M. Fehsenfeld. Performance of Open-Graded "Big-Rock Mixes" in Tennessee and Indiana. Information Series 104/88, National Asphalt Pavement Association, Maryland, 1988
6. R.L. Davis. Large Stone Mixes: A Historical Insight. Information Series 103/88, National Asphalt Pavement Association, Maryland, 1989.
7. M. Acott. Large Stone Hot Mix Asphalt. Special Report, National Asphalt Pavement Association, Maryland, April 1987.
8. M. Acott. Today's Traffic Calls for Heavy Duty Asphalt Mixes. Roads & Bridges Magazine, January 1989.
9. Comparison of 4 and 6-Inch Diameter Molded Specimens. Pennsylvania Department of Transportation, Bureau of Materials, Testing and Research, Status Report, February 1969.
10. D. Allen, and H. Roghani. "Evaluation of Stability and Rutting Potential of Asphaltic Concrete Using Big-Stone Gradations". Research Report UKTRP-88-4, Kentucky Transportation Center, University of Kentucky, February 1988.
11. U.S. Army Corps of Engineers. Properties of Bituminous Mixtures in which More Than 10 Percent of Aggregate Exceed 1 in., Method 103 (MIL-STD-620A).
12. K. Mahboub, and E.G. Williams. Construction of Large-Stone Asphalt Mixes (LSAM) in Kentucky. TRR 1282, Transportation Research Board, Washington, D.C., 1990.
13. F. Hugo. A Critical Review of Asphalt Paving Mixes in Current Use with Proposal for a New Mix. Proceedings, First Conference on Asphalt Pavements for South Mrica, Durham, South Mrica, 1969.
14. Mix Design Method for Asphalt Concrete. Manual Series No.2 (MS-2), The Asphalt Institutes,1984.
15. E. Williams. Design and Construction of Large-Stone HMA Bases in Kentucky. HMA Magazine, National Asphalt Pavement Association, Winter 1988.
16. K. Mahboub, and D.L. Allen. Characterization of Rutting Potential of Large-Stone Asphalt Mixes (LSAM) in Kentucky, TRR 1259, Transportation Research Board, 1990.
17. E. Williams. Author's Reply. HMA Magazine, Letters Section, National Asphalt Pavement Association, Summer 1989.
18. L. Sachs, and Z. Reynarowych. Applied Statistics. A Handbook of Techniques. Second Edition, Springer-Verlag, New York, 1984.
17
19. U.S. Bureau of Reclamation. Earth Manual, Second Edition, Denver, 1974.
ACKNOWLEDGEMENTS
The authors would like to thank the Kentucky Transportation Cabinet and Federal Highway Administration for support of this study. The following individuals from the Kentucky Transportation Cabinet were instrumental for successful completion of this work: Mr. Gilbert Newman, State Highway Engineer; Mr. Larry Epley, Director of Division of Materials; and Mr. Dwight Walker, Bituminous Materials Engineer. Special thanks go to Mr. Ellis Williams, Duo Services Consultant, for his helpful advice. Thanks are also extended to Mr. Dean Blake, Executive Director of Plantmix Asphalt Industry of Kentucky for his encouragement. Ms. Amy Simpson, University of Kentucky, offered valuable assistance with the graphics.
DISCLAIMER
The contents ofthis paper reflect the views ofthe authors who are responsible for the facts and the accuracy of the data presented herein. The contents do not necessarily reflect the official views or policies of the Kentucky Transportation Cabinet, the Federal Highway Administration, nor of the University of Kentucky. This paper does not constitute standard, specification, or regulation. The inclusion of manufacturer names or trade names should not to be considered as endorsements.
18

TABLE 1. TRIAL AGGREGATE GRADATION BLENDS
Percent Passing
Source Plum Run Kenmor<Il
Sieve No.4 No. 56 No. 78 Sand Sand
2" 100
1 1/ " 2 95 100
1" 26 87 :
a; u 4 9 61 100
1/211 2 25 94
31 tt 8 1 7 70 I
4 3 11 100 92
8 3 88 72
16 58 52
30 34 44
50 19 36
100 8 25
200 4 16
(1) Data are based upon wet sieve analysis.
19
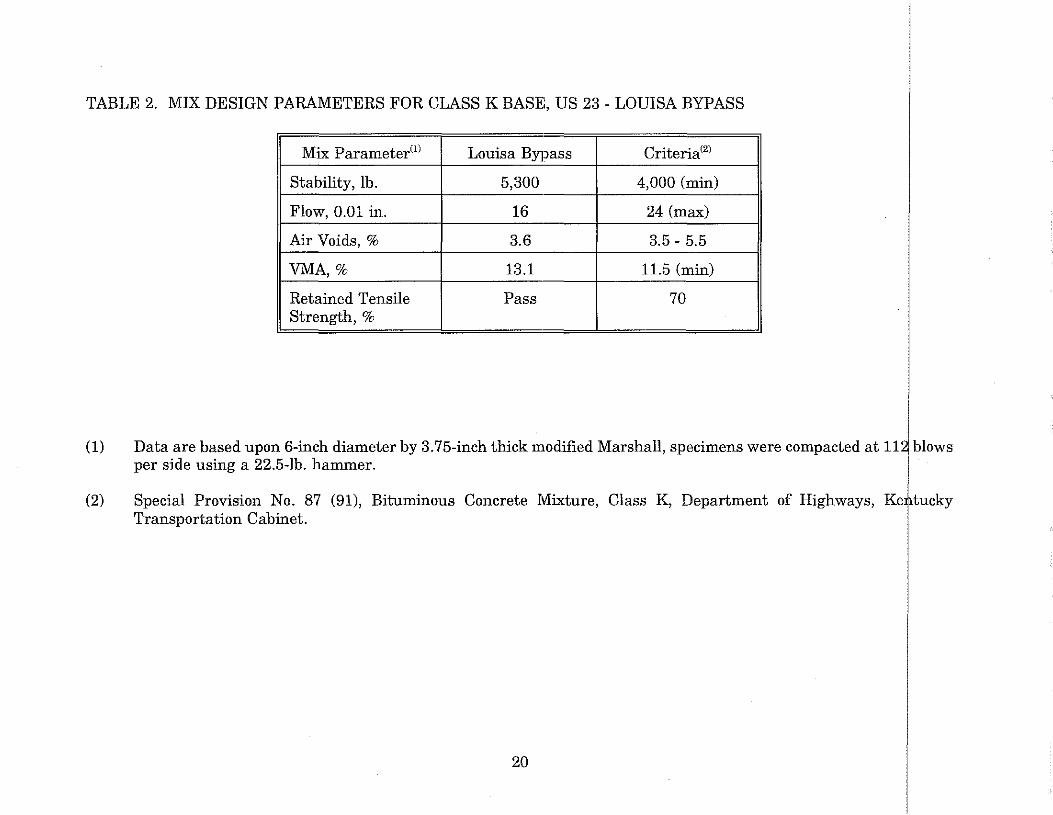
TABLE 2. MIX DESIGN PARAMETERS FOR CLASS K BASE, US 23- LOUISA BYPASS
Mix Parameter11J Louisa Bypass Criteriac2J
Stability, lb. 5,300 4,000 (min)
Flow, 0.01 in. 16 24 (max)
Air Voids,% 3.6 3.5 - 5.5
VMA,% 13.1 11.5 (min)
Retained Tensile Pass 70 Strength,%
-------- ------
'
(1) Data are based upon 6-inch diameter by 3.75-inch thick modified Marshall, specimens were compacted at llJ blows per side using a 22.5-lb. hammer. I
I
(2) Special Provision No. 87 (91), Bituminous Concrete Mixture, Class K, Department of Highways, Keltucky Transportation Cabinet. T
20

TABLE 3. SUMMARY OF MARSHALL MIX DESIGN DATN'l
Aggregate Blends
Mix Parameter 1 1a 2a 5a 1a<2l 1a<3J
Stability, lb. 5,100 5,000 5,200 4,500 4,100 2,850
Flow, 0.01 in. 22 20.5 26.5 23 20 14
Air Voids,% 5 4.7 4.3 4 4.3 4.5
VMA,% 12.6 11.5 12.2 14.5 12.4 13.2
(1) Data are based on 6-inch diameter by 3.75-inch thick modified Marshall specimens compacted at 112 blows per side using a 22.5-lb. hammer, unless otherwise indicated.
(2) U.S. Army Corps of Engineers, Method 103 (11), 6-inch mold, 112 blows.
(3) U.S. Army Corps of Engineers, Method 103 (11), 4-inch mold, 112 blows.
21
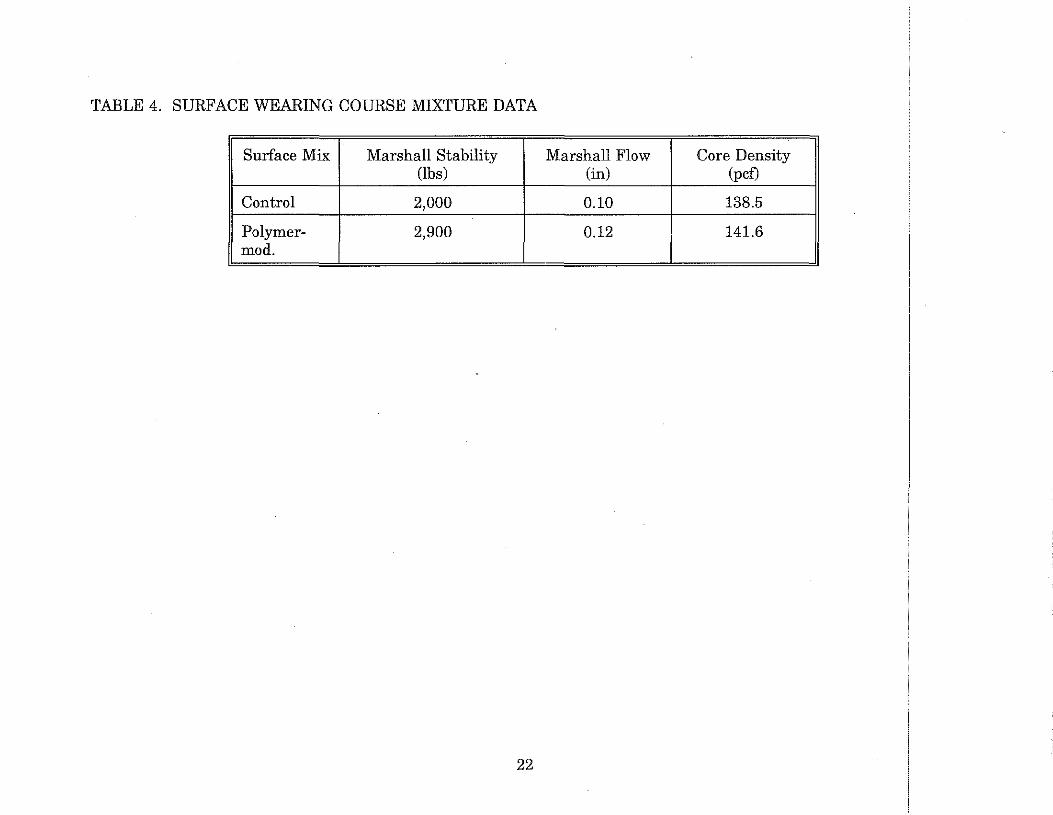
TABLE 4. SURFACE WEARING COURSE MIXTURE DATA
Surface Mix Marshall Stability Marshall Flow Core Density (lbs) (in) (pcf)
Control 2,000 0.10 138.5
Polymer- 2,900 0.12 141.6 mod.
22

TABLE 5. RUT MEASUREMENTS NORTHBOUND (INCH), AUGUST 1990
Driving Lane Passing Lane Milepost
LW RW LW RW Section Location
15.41 .25 .5 0 .375 Control before Curve
15.44 0 .25 .125 .25 Control Curve
15.72 .43 .43 .25 .43 Control Base of Hill
15.78 .70 .75 .25 .50 Control Mid Hill
17.22 .25 .37 .125 .25 Kraton Lower Hill
17.34 .62 .62 .25 .375 Kraton Upper Hill
23
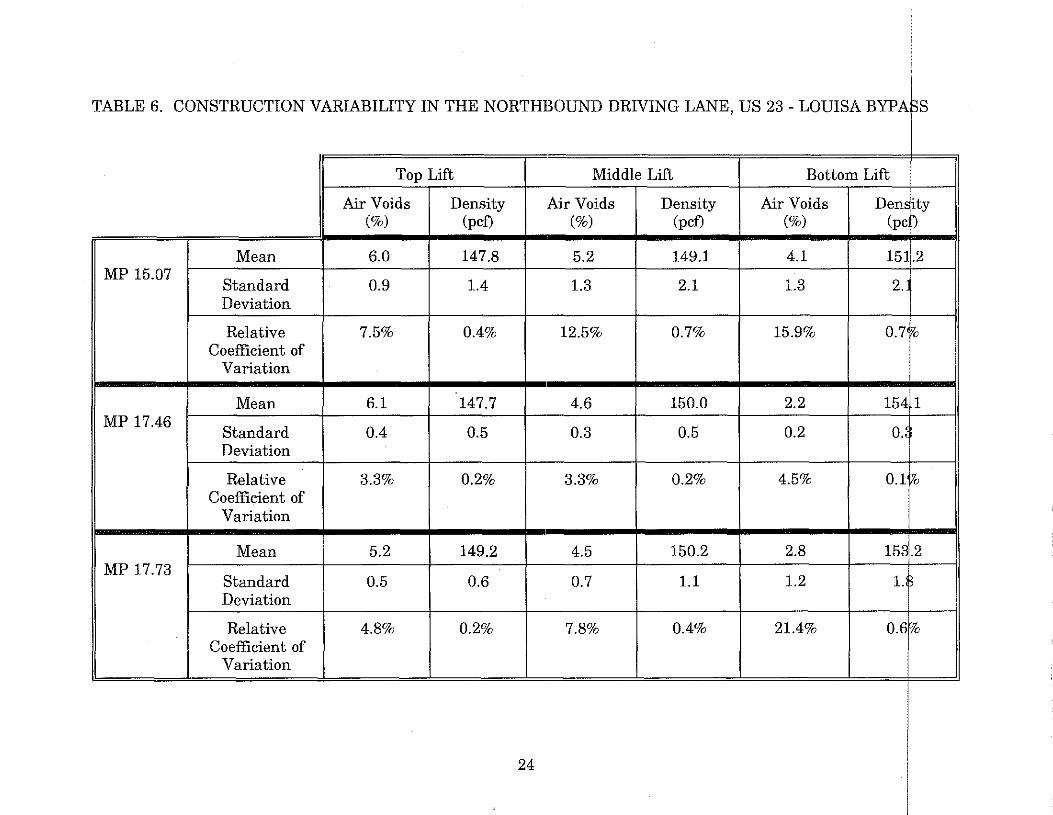
TABLE 6. CONSTRUCTION VARTABILITY IN THE NORTHBOUND DRIVING LANE, US 23- LOIITSA BYPJS
Top Lift Middle Lift Bottom Lift
Air Voids Density Air Voids Density Air Voids Dens 'ty (%) (pcD (%) (pcD (%) (pc )
Mean 6.0 147.8 5.2 149.1 4.1 15 .2 MP 15.07
Standard 0.9 1.4 1.3 2.1 1.3 2. Deviation
Relative 7.5% 0.4% 12.5% 0.7% 15.9% 0. 7 P{, Coefficient of
Variation
Mean 6.1 147.7 4.6 150.0 2.2 154 1 MP 17.46
Standard 0.4 0.5 0.3 0.5 0.2 0. Deviation
Relative 3.3% 0.2% 3.3% 0.2% 4.5% 0.1 Wo Coefficient of
Variation
Mean 5.2 149.2 4.5 150.2 2.8 153 .2 MP 17.73
Standard 0.5 0.6 0.7 1.1 1.2 1. Deviation
Relative 4.8% 0.2% 7.8% 0.4% 21.4% 0.6 % Coefficient of
I Variation --- ---
24
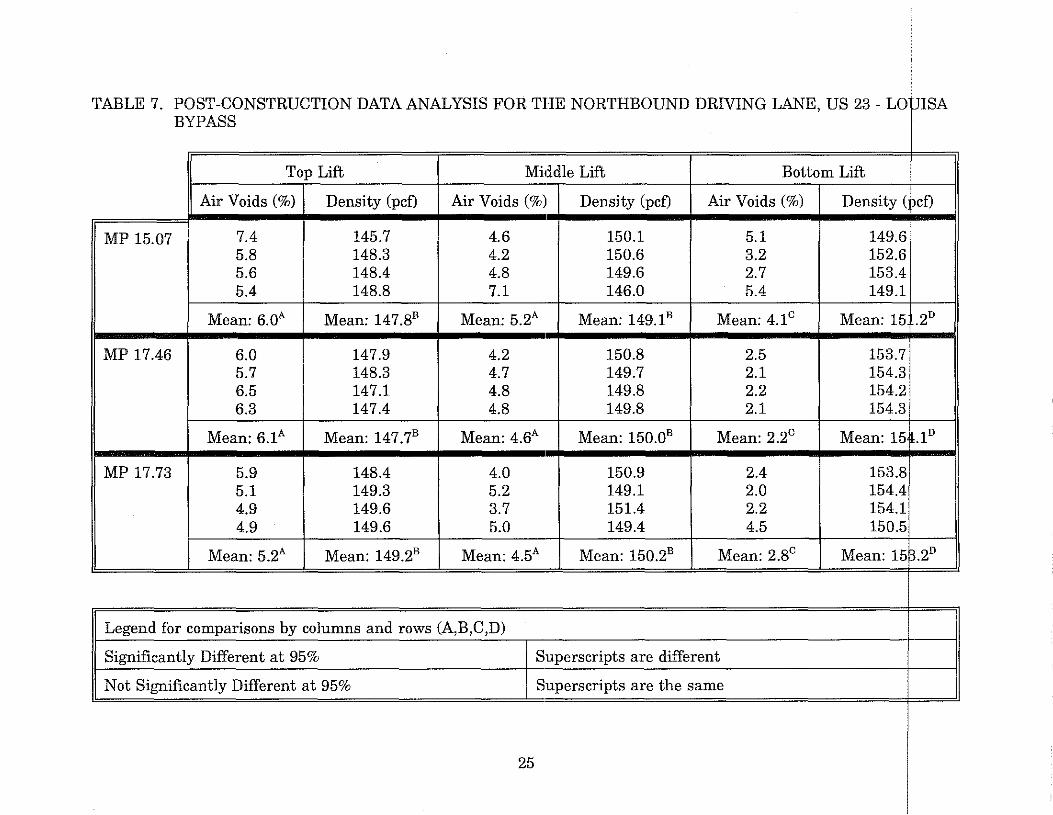
TABLE 7. POST-CONSTRUCTION DATA ANALYSIS FOR THE NORTHBOUND DRIVING LANE, US 23 - LO"(J1SA BYPASS I
Top Lift Middle Lift Bottom Lift
Air Voids(%) Density (pcf) Air Voids(%) Density (pcf) Air Voids(%) Density ( cf)
MP 15.07 7.4 145.7 4.6 150.1 5.1 149.6 5.8 148.3 4.2 150.6 3.2 152.6 5.6 148.4 4.8 149.6 2.7 153.4 5.4 148.8 7.1 146.0 5.4 149.1
Mean: 6.0A Mean: 147.8B Mean: 5.2A Mean: 149.1B Mean: 4.1c Mean: 15 .2D
MP 17.46 6.0 147.9 4.2 150.8 2.5 153.7 5.7 148.3 4.7 149.7 2.1 154.3 6.5 147.1 4.8 149.8 2.2 154.2 6.3 147.4 4.8 149.8 2.1 154.3
Mean: 6.1A Mean: 147.7B Mean: 4.6A Mean: 150.0B Mean: 2.2c Mean: 15 .1D
MP 17.73 5.9 148.4 4.0 150.9 2.4 153.8 5.1 149.3 5.2 149.1 2.0 154.41 4.9 149.6 3.7 151.4 2.2 154.11 4.9 149.6 5.0 149.4 4.5 150.5
Mean: 5.2A Mean: 149.2B Mean: 4.5A Mean: 150.2B Mean: 2.8c Mean: 15 3.2°
Legend for comparisons by columns and rows (A,B,C,D)
Significantly Different at 95% Superscripts are different I
Not Significantly Different at 95% Superscripts are the same
25 I

TABLE 8. STATISTICAL COMPARISONS FOR THE NORTHBOUND DRIVING LANE, US 23- LOUISA BYPA ss
Time: 0 yrs. Time: 2 yrs. Time: 2 yrs. BW,RW BW RW I
Air Voids(%) Density (pcf) Air Voids(%) Density (pcf) Air Voids(%) Density (r cf)
Top Lift 6.0 147.9 3.7 151.5 2.9 152.81 5.7 148.3 4.0 151.1 2.8 152.9 6.5 147.1 4.3 150.6 3.2 152.3 6.3 147.4
Mean: 6.1A Mean: 147.71 Mean: 4.0n Mean: 151.1J Mean: 3.0c Mean: 15~ .7K
Middle Lift 4.2 150.8 3.7 151.4 4.1 150.8 4.7 149.7 3.7 151.4 4.9 149.6 4.8 149.8 3.5 151.8 4.7 149.8 4.8 149.8
Mean: 4.6A Mean: 150.01 Mean: 3.6n Mean: 151.5J Mean: 4.6A Mean: 15 .1!
Bottom Lift 2.5 153.7 3.9 151.4 5.3 149.31 2.1 154.3 5.4 149.1 5.4 149.1 2.2 154.2 3.4 152.3 5.0 149.7 2.1 154.3
Mean: 2.2° Mean: 154.1L Mean: 4.213 Mean: 150.9J Mean: 5.2n Mean: 14 .4J
Legend for comparisons by columns and rows (A,B,C,D,I,J,K,L)
Significantly Different at 95% Superscripts are different
Not Significantly Different at 95% Superscripts are the same _L __
26
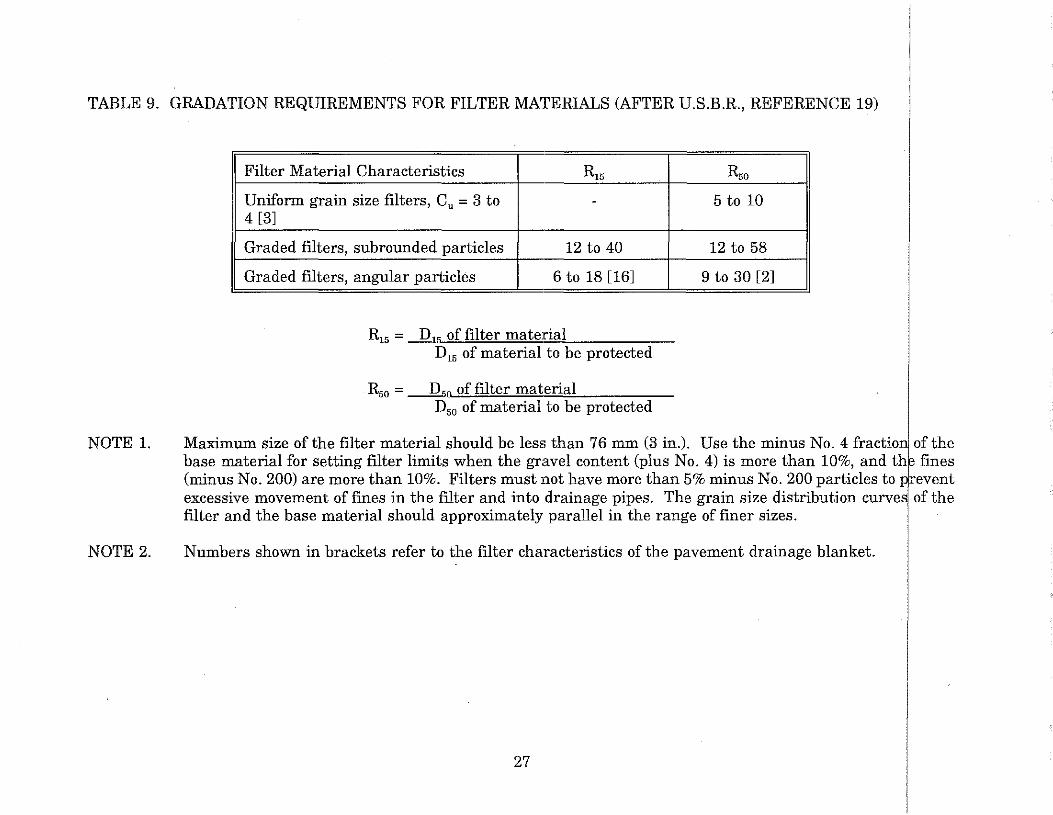
TABLE 9. GRADATION REQUIREMENTS FOR FILTER MATERIALS (AFTER U.S.B.R., REFERENCE 19)
NOTE 1.
NOTE 2.
Filter Material Characteristics R,s Rso
Uniform grain size filters, Cu = 3 to - 5 to 10 4 [3]
i
Graded filters, subrounded particles 12 to 40 12 to 58
Graded filters, angular particles 6 to 18 [16] 9 to 30 [2]
R15 = _1215 of filter material D15 of material to be protected
R50 = ___!!,;0 of filter material D50 of material to be protected
Maximum size of the filter material should be less than 76 mm (3 in.). Use the minus No.4 fractio~ofthe base material for setting filter limits when the gravel content (plus No. 4) is more than 10%, and th fines (minus No. 200) are more than 10%. Filters must not have more than 5% minus No. 200 particles to revent excessive movement of fines in the filter and into drainage pipes. The grain size distribution curve of the filter and the base material should approximately parallel in the range of finer sizes.
Numbers shown in brackets refer to the filter characteristics of the pavement drainage blanket.
27
1 in 1 SURFACE WEABJJ'IJLCOURSE
4 in
+ 12 in 4 in LSM BASE
+ 4 in
4 in NO. 57
8 in
4 in DGA
SUBGRADE
FIGURE 1. PAVEMENT CROSS SECTION, US 23- LOUISA BYPASS
28
100
90
80
70
60
50
40
30
20
10
0
SIEVE SIZES RAISED TO 0.45 POWER
·· Lower Limit -- Upper Limit
PERCENT PASSING
~
/ ~ ...• ~·
// .. ·
.·.
/ ..... ·.
/ v J ...
v ....... .
/
/ . .......
v 1 ......
\lo. 20 0 50 30 1 6 B 4 3/8 in 1/2 in 3/4 in 1 in 1 1/2 in 100
Sieve Sizes
FIGURE 2. GRADATION SPECIFICATION LIMITS FOR KENTUCKY CLASS K BASE
29
GRADATION OF LAB TEST MIXTURES SIEVE SIZES RAISED TO 0.45 POWER
-- 1 1 a -- ~ 2a -- 5a -- Maximum Density
PERCENT PASSING
100 - - /.?' ./ /::7
go /v o/ 80 v ~/ ?o //~~;.Y 60 ~v/0'v 50 4//y 40 ~v~ 30 v~/
~: k;;~...-/·· ~~v
0 No_2oo I so 30 16 a 4 318 in 1/2 in 3/4 in 1 in 1 112 in
100 Sieve Sizes
FIGURE 3. TRIAL LARGE-STONE GRADATION BLENDS
30
Density (pcf)
154
152
150
148
146 f-
144
CORE VERSUS MARSHALL
0
~ ____!__ Avg= 151.67
~
0 ---ij- Avg= 148.E!6
8 0
0
B
~ tA,g=15U1
B
~ -t A'g= 15240
0
Nuclear 6X12 Core 6X12 Marshall 142 6X3.5 Marshall
FIGURE 4. LABORATORY AND FIELD DENSITY DATA FOR CLASS K BASE
31

PERCENT AIR VOIDS
CORE VERSUS MARSHALL
.A.~ir~V~o~id~s~(0
~~~)~~~~~---------------------------------------, 12r
10
8
6
4
2f-
0
8 0 0
t @
Avg= 6.12
0 t _,. t -.~"'
0~----------~----------~----------r---------~
6X12 Core 6X12 Marshal! 6X3.5 Marsha\!
FIGURE 5. LABORATORY AND FIELD AIR VOIDS DATA FOR CLASS K BASE
32

COMPRESSIVE STRENGTH
AND METHOD OF COMPACTION
Unconfined Compressive Strength {psi) 400,-----~----~~----------------------------------
~--------~~------"*
350
------~ 300
&--_
250L_ ____ _L ______ L_ ____ _L ______ L_ ____ _L ______ l_ ____ ~
3.4 3.6 3.8 4 4.2 4.4 4.6 4.8 Asphalt Content (%)
- KNEADING -s- VIBRATORY --- MARSHALL
FIGURE 6. COMPRESSIVE STRENGTH AS A FUNCTION OF ASPHALT CONTENT AND METHOD OF COMPACTION FOR LARGE-STONE ASPHALT MIXES
33
Resilient Modulus (psi)
1000000~•••••••••••••••~••••••••·· ······················••·••••••••••••••••••m<•l
100000~----------------------~~------------------~
10000L_ __ _l ____ ~----L---~--·---L----~--~-----L--~
72 76 80 84 88 92 96 100 104 108 Temperature (°F)
- LARGE STONE HMA ---+- CONVENTIOANL HMA
FIGURE 7. RESILIENT MODULUS AS A FUNCTION OF TEMPERATURE
34

-1
10
-2
10
-3
10
Static Creep Strain (infm)
=
-~-
10
Dynamic Permanent Strain (infm)
Lab Oa.ss K Base, Static Creep, 3.5% Air
Lab Class K Surface, Static Creep, 3.5% Air
Pavement K-Base Cores, Static Creep, 5% Air
Pavement K-Base Cores, Dynamic Creep, 5.5% Air
---
100
Creep Time (sec.)
10
10
10
1000
-1
-2
-3
FIGURE 8. CREEP AND PERMANENT DEFORMATION DATA FOR LABORATORY AND FIELD SPECIMENS AT 104'F
35


""' w. ~ ~ w. w. :s 0
""' iJ1 E-1 ~ 0 t-
~ cr.>
~ 0 ,...;
~ 5 -~

FIGURE 11. VIBRATORY ROLLER, OPERATES IN STATIC AND DYNAMIC MODES
38

p:: ~ ...:I ...:I 0 p:: 0 -~ O'l ~ "" §:: C"l ......
~ f5 -~'<:;
~
~ ~
~ r:n
j 0 ~ 0 z 0 ...... E-< 0 p:; ~ 0 0 c!J
~ ~ p Q ~
~ ~ ~
~ 0 ...... E-<
~ o:i ,....;
~ § ...... ~
MOVING AVERAGE
QUALITY CONTROL PARAMETER
0
A= (S1 + S2)/2
B = (S2 + S3)/2
C = (S3 + S4)/2
D = (S4 + SS)/2
A
2 3 4
Sample Lot Number
D
5 6
FIGURE 14. SCHEMATIC REPRESENTATION OF THE MOVING AVERAGE CONCEPT
41
Asphalt Shoulder
~
~
Asphalt Driving Lane
DGA
Subgrade
Fabric Wrapped Trench 4-lnch Perforated Pipe
FIGURE 15. SHOULDER EDGE DRAIN DETAIL, US 23 -LOUISA BYPASS
42

/ Slotted Drain Pipe
Asphalt /
Co~ncrete Asphalt
DGA
I " Fabric Wrapped Trench 4-lnch Perforated P1pe
FIGURE 16. MEDIAN DRAIN DETAIL, US 23- LOUISA BYPASS
43

SU.IIIliiiOO STUI71~
IISIIJI ffii!BIIA
STA.Il!l2t40 STA.I2ffit-1'1KY1! I STA. 1211!1t45
STU~ Fium Medim
STA.128S+7l
STA.lt9it25
STA.1312+;ID
STA.M 00 Fml.
CIBSS of Hi!t-aJ: AIIIBIIM. TIJle of Terri111: IIJOOA!Nlfl lesi7' Speed: 5S llflH Required NlSD: 431 •in !equired P!D: IU.
alle!in Pruiett lb'th to KY1! bl KYl! lb-th to End Project
~um==-=llUIIY=,.,..,UlJ:::I:::-SA-:cB'f~PASSo:::-!l Project: F2l-l(!lll tbte-: FSP lli4 0023 014-m! L.ettinJ Date: 5-<HI
ADT ~tll!l!21: al'IBI bM!I!IJ ADT Futtn! 20011: a mJI b JI5SO ON: ellllll b 00 liZ r12l
e IDl UI'.ATIIJIS
1?21 STRIA: UllTIOO
NilE: ltlt To Scale
Flml lnspectioo: lf<rdl 1!11 Op!nii!J Date: 7-31-8!1 IM': Mside Wheel Palli 1\f: bide bel Palli
FIGURE 17. SCHEMATIC OF THE LOUISA BYPASS PROJECT
44
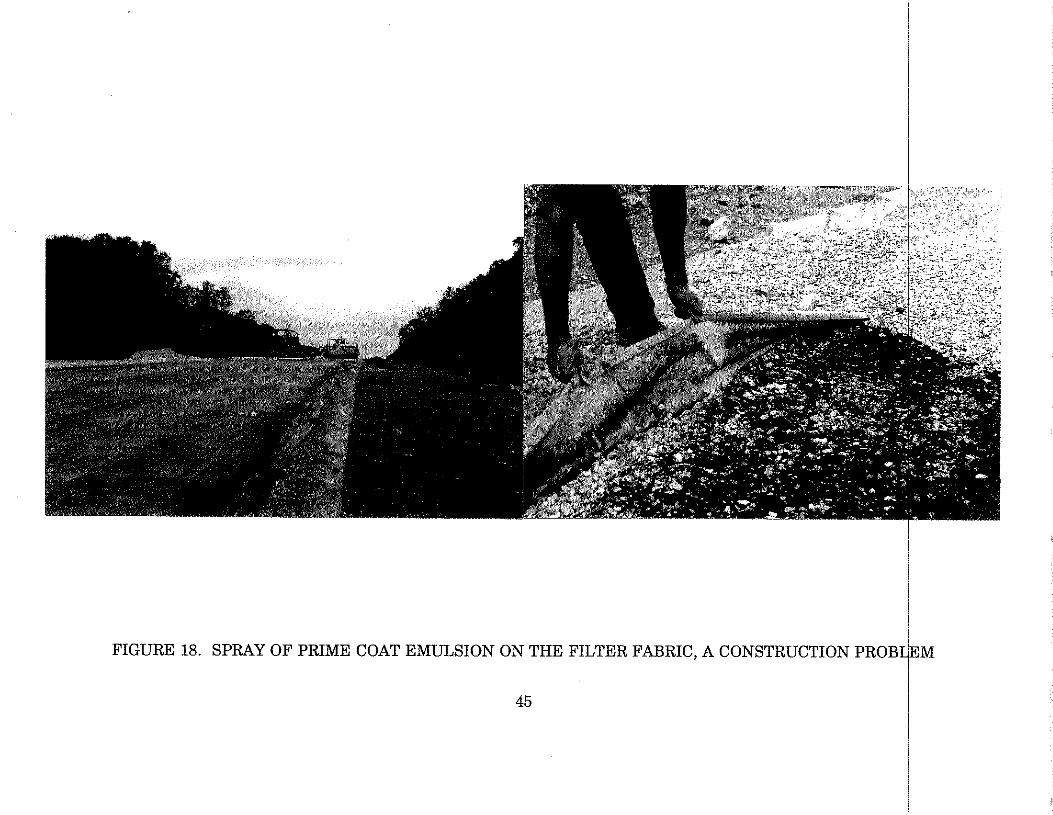
FIGURE 18. SPRAY OF PRIME COAT EMULSION ON THE FILTER FABRIC, A CONSTRUCTION PROB~EM
I 45

FIGURE 19. SURFACE TEXTURE OF COMPACTED CLASS K BASE
46
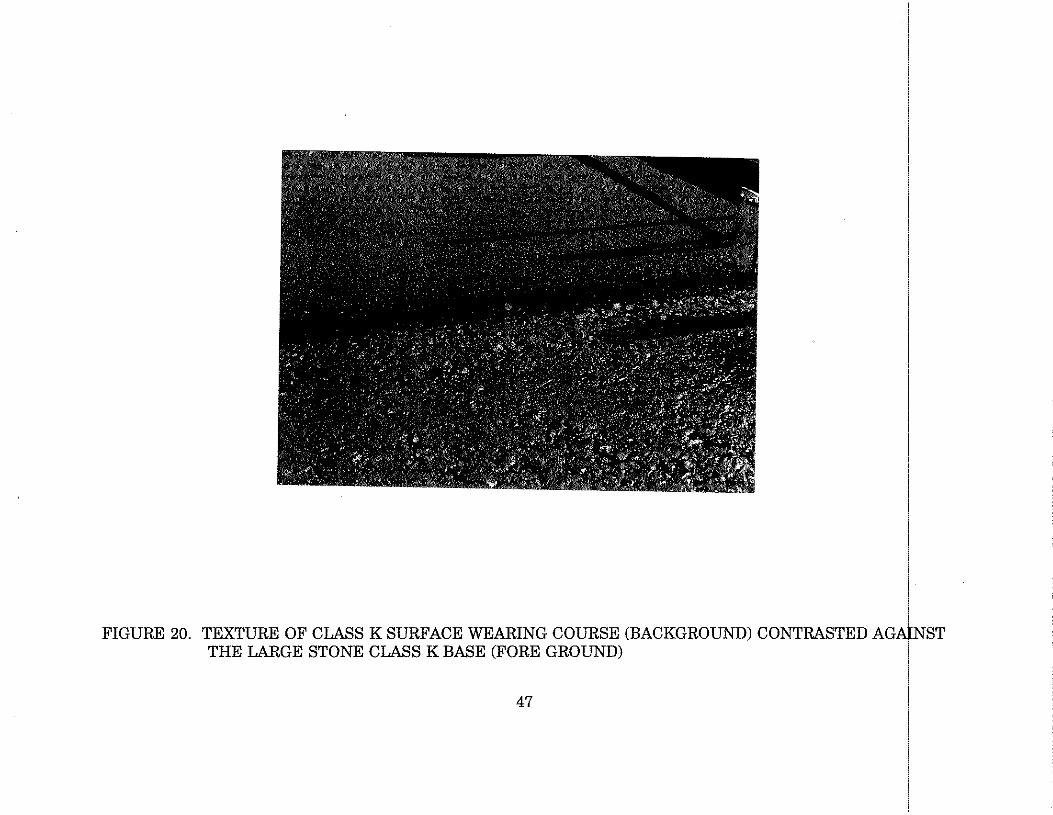
FIGURE 20. TEXTURE OF CLASS K SURFACE WEARING COURSE (BACKGROUND) CONTRASTED AGAj[NST THE LARGE STONE CLASS K BASE (FORE GROUND)
47

0
-2
-4
-6
-8
-10
-12
-14
-16
CORE DEPTH (in.)
CENTERLINE
-RUTTING
8 MID 1/3 BASE
LEFT WHEEL BETWEEN WHEELS RIGHT WHEEL
CORE SAMPLES
E2Zi SURFACE COURSE EfHll TOP 1/3 BASE
fZS:I BOTTOM 113 BASE
Northbound driving lane; M.P. 17.46
FIGURE 21. A RECONSTRUCTED VIEW OF THE PAVEMENT CROSS SECTION BASED UPON PAVEMENT CORES, US 23- LOUISA BYPASS
48
1991

FIGURE 22. PHOTOGRAPH OF PAVEMENT TRENCH AT MILE POST 17.46, US 23- LOUISA (APRIL 10, 1991)
49

100
90
80
70
60
50
40
30
20
10
0
SIEVE SIZES RAISED TO 0.45 POWER
Lower Limit #57
Lower Limit DGA
PERCENT PASSING
Upper Limit #57
Upper Limit DGA
Average #57
Average DGA
/ / A -·- .. :-:-.~---····
/
/ / f;'/i
/
/ / /i lji
/
/ / /" .//'i /
/
/ <··/ /i /
/
/ / I. v i /
I ___.. v // .i· / i / /
i/ / /
1/// .. .. · / ---
/ ···v//
-.!o. 20 0 50 30 16 8 4 3/B in 1/2 in 3/4 in 1 in 1 1/2 in 100 Sieve Size,s
FIGURE 23. GRADATION DISTRIBUTION OF THE DENSE GRADED AGGREGATE (DGA) AND NO. AGGREGATE
50

Relative Elevation (in) 6,---------~~----------------------------,
5 ·-~-
~-4 ~-
3
2
1
~--~-~-
~-
-------- -- -OL_ ____ _L ______ L_ ____ _L _____ ~L_ ____ _L ____ ~----~
0 2 4 6 8 10 12 14
Distance from Centerline of Road (ft)
- Dec. 13, 1990 -- · Oct. 27, 1988
Northbound driving lane; M.P. 17.46
FIGURE 24. ROADWAY ELEVATION DATA, US 23- LOUISA BYPASS
51
Sampled Material
FIGURE 25. SAMPLING LOCATIONS FOR THE DGA AND NO. 57 SUBBASE MATERIAL
52
SIEVE SIZES RAISED TO 0.45 POWER
#57 Lower Limit
DGA Lower Limit
100
90
80
70
60
50
40
30
20
10
0
PERCENT PASSING
/ /
/ /
I
c ~
~
_i ~
,· ~
No. 20 0 50 30 1 6 8
100
Upper Limit * Top
Upper Limit o Top
/ /
/ /
/
/ /
/
.. /
~-/~// /
/ /"? /.·· •
/ .. ··· _i /
/ ... i /
/ / . / /
t / ..... k/
~
x Bottom
0 Bottom
)·····
/i
/i
4 3/8 in 1/2 in 3/4 in 1 in
Sieve Size,s 1 1/2 in
FIGURE 26. GRADATION DISTRIBUTION FOR THE UNDER THE RIGHT WHEEL SAMPLES
53

SIEVE SIZES RAISED TO 0.45 POWER
#57 Lower Limit
DGA-- Lower Limit
PERCENT PASSING 100
90
80
70
60 /
50 /
/ 40
30 / I e
~ 20
~
C I ~
Upper Limit * Top
Upper Limit D Top
/ /
/
/ /
/
/
/
/ / / /:"
/ .... /
/// ...........
/
./ / ..... /
1// / .
X Bottom
0 Bottom
////~ / r .. ················ 1/ /i
./.· / // Li
./
ii
./·
I
~ ~ ...... (/
10
0 No. 200 50 30 16 8 4 3/B in 1/2 in 3/4 in 1 in 1 1/2 in
100 Sieve Sizes
FIGURE 27. GRADATION DISTRIBUTION FOR THE BETWEEN THE WHEELS SAMPLES
54