lost, theft, damaged and destroyed (ltdd) 3.0 reports november 2011 itcso training academy
TRANSCRIPT

Lost, Theft, Damaged and Destroyed (LTDD) 3.0 Reports
November 2011
ITCSO Training Academy

Course Topics
Module One LTDD 3.0 Reports
Lesson One Accessing LTDD 3.0 Reports
Topic One Accessing LTDD 3.0 Reports
Topic Two Report Formats
Lesson Two Running LTDD 3.0 Reports
Topic One Running a Report
Topic Two Viewing a Report
2
Course Topics
Module Two LTDD 3.0 Ad Hoc Reports
Lesson One Ad Hoc Reports Overview
Topic One Ad Hoc Reports Overview
Topic Two Launch a New Query
Topic Three Ad Hoc Report Components
Lesson Two Using LTDD 3.0 Ad Hoc Reports
Topic One Inserting Data
Topic Two Editing Data
Topic Three Changing Layout
Topic Four Running a Report
Topic Five Saving a Report
Course Topics
Note: Links will only work in PowerPoint’s slide show view.

Course Topics
3
Module Three LTDD 3.0 Cubes
Lesson One Cube Overview Lesson Two Choosing and Limiting Data Lesson Three Advanced Analysis Tools
Topic One Accessing LTDD 3.0 Cubes
Topic One Choosing Data Topic One Drill Down and Drill Up
Topic Two Analysis Studio Interface Topic Two Context Filter Topic Two Nesting
Topic Three Source Tree Topic Three Exclude Items Topic Three Swap Rows and Columns
Topic Four Overview Area Topic Four Top or Bottom Values Topic Four Charts
Topic Five Work Area Topic Five Suppress Zeros Topic Five View Output
Topic Six Toolbar
Course Topics (continued)
Note: Links will only work in PowerPoint’s slide show view.

At the end of this module you will be able to:
• Access LTDD 3.0 reports
• Select different filters in the reports
• Run the reports
• View the reports
4
Module One Objectives

Module One Lessons
Lesson One Accessing LTDD 3.0 Reports
Lesson Two Running LTDD 3.0 Reports
5
Module One Lessons

Lesson One Topics
Topic One Accessing Reports
Topic Two Report Formats
6
Lesson One Topics

Once you have logged into eTools, the Reports portal can be accessed by selecting the Reports link on the top-navigation menu.
Graphic 1.1.1.1: Accessing eTools Reports
Locating LTDD 3.0 Reports on Reports Portal (Graphic 1.1.1.1)
1. Log into the eTools Portal.
2. Click Reports on the top-navigation menu.
•Reports portal page appears
3. Click the Lost, Theft, Damaged and Destroyed 3.0 icon.
•The Report List for Lost, Theft, Damaged and Destroyed (LTDD) 3.0 appears (Graphic 1.1.1.2)
7
Topic One – Accessing Reports
How to Access LTDD 3.0 Reports

Graphic 1.1.1.2: Report List View
If reports are available, the Report List Lost, Theft, Damaged and Destroyed 3.0 displays by default.
The top-navigation menu displays links for Reports, Cubes and Ad hoc.
If the Report List does not display by default, simply click the top-navigation Reports link.
8
Topic One – Accessing Reports
How to Access LTDD 3.0 Reports(continued)

The file formats used to display reports are defined at the bottom of the Report List page for each application. If an icon does not display next to a report name, that format is not available for that report.
To see data in a specific report format, click the icon for the type of file you need. Once you select the filters for the report and click the Finish button, the data selected will display in the type of file that you selected.
HTML •Report prompts page displays in a new webpage•When you choose to run the report, the results display in a webpage
Excel •Report prompts page displays in a new webpage•When you choose to run the report, the results display in Excel•Excel’s Save As option will save the file as a comma separated value (CSV) format
CSV •Unformatted Excel (CSV) Format - best used for manual manipulation of large data sets•Not an option for Contract Receipt and Review 3.0
PDF •Report prompts page displays in a new webpage•When you choose to run the report, the results display in Adobe Acrobat (.pdf) format
9
Topic Two – Report Formats
LTDD 3.0 Report Formats

Lesson Two Topics
Topic One Running a Report
Topic Two Viewing a Report
10
Lesson Two Topics

11
Topic One – Running a Report
Reports and Descriptions
The table below lists two of the available LTDD 3.0 reports and provides a description for each.
Case Detail Report – LTDD Property
• This report contains detailed fields associated with LTDD cases. A generic report for use with the cube for drill-down purposes and also with extensive prompts to allow considerable customization of content by users.
Case Summary by Decision - LTDD Property
• This report displays the government portion, contractor portion, liability value, and the acquisition value for cases submitted (new or reopened) during a time period, with a certain decision.

12
Topic One – Running a Report
Reports and Descriptions
The table below lists two of the available LTDD 3.0 reports and provides a description for each.
Case Summary by Status - LTDD Property
• This report displays the government portion, contractor portion, liability value, and the acquisition value for cases submitted (new or reopened) during a time period, with a certain status.
External Case Details Report - LTDD Property
• This report contains detailed fields associated with LTDD cases. A generic report for use with the cube for drill-down purposes and also with extensive prompts to allow considerable customization of content by users.

13
Topic One – Running a Report
Reports and Descriptions
The table below lists two of the available LTDD 3.0 reports and provides a description for each.
External Case Summary By Status Report - LTDD Property
• This report displays the government portion, contractor portion, liability value, and the acquisition value for cases submitted(new or reopened)during a time period, with a certain status
External Property Owner Case Summary By Decision Report - LTDD Property
• This report displays the government portion, contractor portion, liability value, and the acquisition value for cases submitted(new or reopened)during a time period, from a certain property owner, with a certain decision

14
Topic One – Running a Report
Reports and Descriptions
The table below lists two of the available LTDD 3.0 reports and provides a description for each.
External Property Owner Case Summary By Status Report - LTDD Property
• This report displays the government portion, contractor portion, liability value, and the acquisition value for cases submitted (new or reopened) during a time period, from a certain property owner, with a certain status
Item Detail Report - LTDD Property
• This report contains detailed fields associated with a LTDD Case including UIIs for each line item in the case.

15
Topic One – Running a Report
Reports and Descriptions
The table below lists two of the available LTDD 3.0 reports and provides a description for each.
LTDD Cases Report
• The External Cases report displays all cases not administered by DCMA.
PA Case Workload - LTDD Property
• This report displays a workload view for a Property Administrator with case level detail.

16
Topic One – Running a Report
Reports and Descriptions
The table below lists two of the available LTDD 3.0 reports and provides a description for each.
Property Owner Case Summary by Decision - LTDD Property
• This report displays the government portion, contractor portion, liability value, and the acquisition value for cases submitted (new or reopened) during a time period, from a certain property owner, with a certain decision.
Property Owner Case Summary by Status - LTDD Property
• This report displays the government portion, contractor portion, liability value, and the acquisition value for cases submitted (new or reopened) during a time period, from a certain property owner, with a certain status.

Graphic 1.2.1.1: Report List View
Running a Report (Graphic 1.2.1.1)
1. Click the desired View icon next to the report.
•The Report Filter page appears(Graphic 1.2.1.2)
17
Topic One – Running a Report
Running a Report
Graphic 1.2.1.1 shows the predefined reports for LTDD 3.0. Follow the directions below to view a report.
Note: As seen in Graphic 1.2.1.1, Reports for LTDD 3.0 are available in HTML, Excel, and PDF formats.

18
Topic One – Running a Report
Report Filter Options
The table below lists the available report filters for both LTDD Case Detail Report - LTDD Property and Case Summary by Decision – LTDD Property
LTDD Case Detail Report-LTDD Property Case Summary by Decision – LTDD Property
• Case Submitted Date Range• Division• CMO• Status• Decision• Property Owner• Property Type• LTDD Indicator
• Case Submitted Date Range• Division• CMO Office• Property Administrator• Decision

19
Topic One – Running a Report
Report Filter Optionscontinued
The table below lists the available report filters for both Case Summary by Status – LTDD Property and External Case Details Report – LTDD Property
Case Summary by Status – LTDD Property External Case Details Report – LTDD Property
• Case Submitted Date Range• Region• CMO Office• Property Administrator• Team• Status
• Case Submitted Date Range• Service• Property Owner• Decision• Property Type• LTDD Indicator• Status

20
Topic One – Running a Report
Report Filter Optionscontinued
The table below lists the available report filters for both External Case Summary by Status Report – LTDD Property and External Property Owner Case Summary by Decision Report– LTDD Property
External Case Summary by Status Report – LTDD Property
External Property Owner Case Summary by Decision Report– LTDD Property
• Case Submitted Date Range• Service• Property Owner• Decision• Status
• Case Submitted Date Range• Service• Property Owner• Decision

21
Topic One – Running a Report
Report Filter Optionscontinued
The table below lists the available report filters for both External Property Owner Case Summary By Status Report - LTDD Property and Item Detail Report - LTDD Property
External Property Owner Case Summary By Status Report - LTDD Property
Item Detail Report - LTDD Property
• Case Submitted Date Range• Service• Property Owner• Decision
• Case Number

22
Topic One – Running a Report
Report Filter Optionscontinued
The table below lists the available report filters for both LTDD Cases Report and PA Case Workload - LTDD Property
LTDD Cases Report IPA Case Workload - LTDD Property
• Case Submitted Date Range• Primary CAGE Code• Property Owner• Status
• Case Submitted Date Range• Region• CMO Office• Property Administrator• Team• Status

23
Topic One – Running a Report
Report Filter Optionscontinued
The table below lists the available report filters for both Property Owner Case Summary by Decision - LTDD Property and Property Owner Case Summary by Status - LTDD Property
Property Owner Case Summary by Decision - LTDD Property
LTDD Property and Property Owner Case Summary by Status - LTDD Property
• Case Submitted Date Range• Region• CMO Office• Property Owner• Decision• Status
• Case Submitted Date Range• Region• CMO Office• Property Owner• Status

Graphic 1.2.1.2: Select Filters and Finish Button
Filtering a Report (Graphics 1.2.1.2 – 1.2.1.3)
1. Select your desired filters in each field.
•Use Select all or Deselect all to quicklymake selections and use the Ctrl key toselect multiple items in the fields
2. Click the Finish button.
24
Topic One – Running a Report
Selecting Report Filters
Follow the directions below to select filters for your report.
Note: The Division filter (Graphic 1.2.1.3) is a required field. You must select at least the Division filter to run a report.
Graphic 1.2.1.3: Division Filter

If you selected the HTML version, the report results display in a webpage.
Links at the bottom of the page allow you to:
• Return to the Top of the report
• Go one Page up• Go one Page down• Bottom link takes you to the end of the report where the filters you specified are displayed
Graphic 1.2.2.1: HTML Report Example
25
Topic Two – Viewing a Report
HTML Report Output

If you selected the Excel version, a dialogue box prompts you to open or save the Excel report.
Saving the file allows you to review the information later without running the report again. Follow the directions below to open or save a report.
Opening & Saving an Excel Report (Graphic 1.2.2.2)
1. Click the Open button.
• The data opens in Excel
OR
Click the Save button.
• The data saves in Excel format
Graphic 1.2.2.2: File Save Dialogue
26
Topic Two – Viewing a Report
Excel Report Output

Graphic 1.2.2.3: Excel Report Example
On this page you can view an example of an Excel report for LTDD 3.0 (Graphic 1.2.2.3).
27
Topic Two – Viewing a Report
Excel Report Output(continued)

Graphic 1.2.2.4: Adobe Acrobat PDF Report Example
If you selected Adobe Acrobat PDF, you will be prompted to save the file. The report will display in the PDF format as shown in Graphic 1.2.2.4.
28
Topic Two – Viewing a Report
PDF Report Output

At the end of this module you will be able to:
• Describe Ad hoc reports
• Create a new query
• Insert and edit data
• Change data layout
• Run Ad hoc reports in various report formats
• Save Ad hoc reports
29
Module Two Objectives

Module Two Lessons
Lesson One Ad Hoc Reports Overview
Lesson Two Using LTDD 3.0 Ad Hoc Reports
30
Module Two Lessons

Lesson One Topics
Topic One Ad Hoc Report Overview
Topic Two Launch New Query
Topic Three Ad Hoc Report Components
31
Lesson One Topics

An Ad hoc report is a report that is created for a specific task and thus cannot be adapted for other purposes.
An Ad hoc report provides you with the flexibility to:
• Select the types of data to be shown
• Manipulate the data shown
• Change the display of selected data
• Report the data in a different format
• Save the data for future use
Graphic 2.1.1.1: Sample Ad Hoc Report
32
Topic One – Ad Hoc Reports Overview
About Ad Hoc Reports
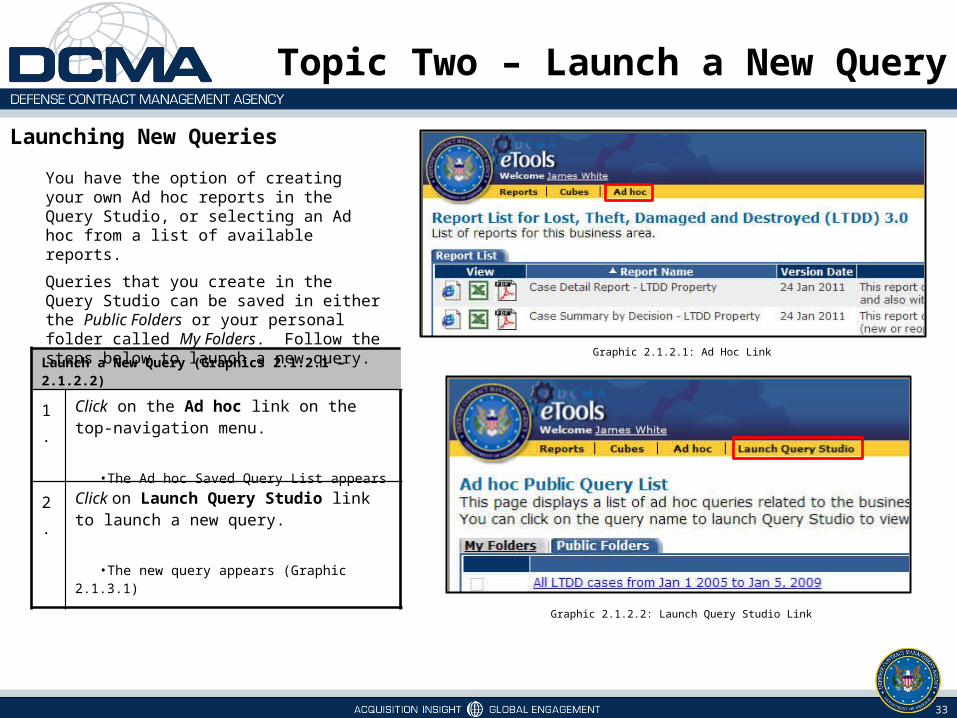
Launching New Queries
Graphic 2.1.2.1: Ad Hoc Link
Graphic 2.1.2.2: Launch Query Studio Link
Launch a New Query (Graphics 2.1.2.1 – 2.1.2.2)
1. Click on the Ad hoc link on the top-navigation menu.
•The Ad hoc Saved Query List appears
2. Click on Launch Query Studio link to launch a new query.
•The new query appears (Graphic 2.1.3.1)
33
Topic Two – Launch a New Query
You have the option of creating your own Ad hoc reports in the Query Studio, or selecting an Ad hoc from a list of available reports.
Queries that you create in the Query Studio can be saved in either the Public Folders or your personal folder called My Folders. Follow the steps below to launch a new query.

The Ad hoc for LTDD has three main components to help the user select, filter, view, and manipulate selected data.
The Menu on the left includes the options to Insert Data, Edit Data, Change Layout, Run Report and Manage File.
The Toolbar on the top provides tools for saving, cutting and pasting, filtering, sorting, and manipulating the data displayed in the report area.
The Report Area contains all the data for the user to view and manipulate.
Graphic 2.1.3.1: Ad Hoc Report Components
34
Topic Three – Ad Hoc Report Components
Components of Ad Hoc Reports
ToolbarMenu
Report Area

Lesson Two Topics
Topic One Inserting Data
Topic Two Editing Data
Topic Three Changing Layout
Topic Four Running Report
Topic Five Saving a Report
35
Lesson Two Topics

Graphic 2.2.1.1: Preview With No Data Link
36
Ad hoc reports allow the user to customize a data query by selecting specific fields to define the search criteria. Before inserting data into the report, it is recommended to select Preview with No Data.
Follow the directions below to preview your report with no data before inserting the data.
Preview With No Data
Preview With No Data (Graphics 2.2.1.1 – 2.2.1.2)
1. Click Run Report on the Menu.
•A list of tools appears
2. Click Preview with No Data.
•Data has been turned off (Graphic 2.2.1.2)
Topic One – Inserting Data
Graphic 2.2.1.2: Data Turned Off
Note: Previewing reports with no data will
optimize the load time while designing your
report, since many reports contain large
amounts of data.

Inserting Data Items (Graphics 2.2.1.3 – 2.2.1.4)
1. Click Insert Data on the Menu.•Available data tables appear in the Menu
2. Click the plus (+) sign next to LTDD Adhoc.•The LTDD Adhoc data table expands
3. Click the plus (+) sign next to Contract Information.
•The Contract Information folder expands
4. Ctrl + Click Team and Parent CMO data items.
5. Click the Insert button.•The report appears in the Report area
(Graphic 2.2.1.5)
Graphic 2.2.1.3: Expand Folders
37
Topic One – Inserting Data
Now that data has been turned off, you can begin designing your Ad hoc report. Follow the directions below to insert data items.
Design the Report
Graphic 2.2.1.4: Insert Data into Report Area
Note: You can also double-click a data item to
insert it or drag and drop a data item into the
report area to insert it.

Graphic 2.2.1.5: Report View With No Data
The report is displayed containing no data. Now that the report is designed how you need it to look, follow the directions below to view the report with data.
38
Topic One – Inserting Data
View Report With Data
Turn Data On (Graphics 2.2.1.5 – 2.2.1.6)
1. Click Run Report on the Menu.
•A list of tools appears (Graphic 2.2.1.6)
2. Click Run with All Data.
•Data has been turned on (Graphic 2.2.2.1)
Graphic 2.2.1.6: View Report With Data

Editing Data in an Ad Hoc Report (Graphic 2.2.2.1)
1. Select Edit Data from the Menu.•A list of tools for editing data appears
2. Click the column heading of the data field in the report area to select it.
•The column heading turns green after it is selected
3. Select a tool in the Menu to edit the data.•Most of the tools in the Menu are alsoavailable on the Toolbar
Graphic 2.2.2.1: Edit Data
39
Topic Two – Editing Data
Now that the data has been turned on, follow the steps below to Edit Data in an Ad hoc report.
Editing Data

Changing Layout for an Ad Hoc Report (Graphic 2.2.3.1)
1. Select Change Layout from the main menu.
•A list of Layout options appears in the Menu
2. Click the column heading in the Report Area.
•The heading turns green after it is selected
•Ctrl + Click to select multiple columnheadings
3 Click on a layout option in the menu to change the layout of the data.
Graphic 2.2.3.1: Change Layout
40
Topic Three – Changing Layout
Follow the steps below to change the layout of data in an Ad hoc report.
Changing Layout

If you have difficulty identifying the purpose of a specific tool, hovering your mouse over a Menu item gives a brief description of it. The graphic on this page shows the description for the Edit Title Area tool .
41
Topic Three – Changing Layout
Changing Layout(continued)
Graphic 2.2.3.2: Tool Description
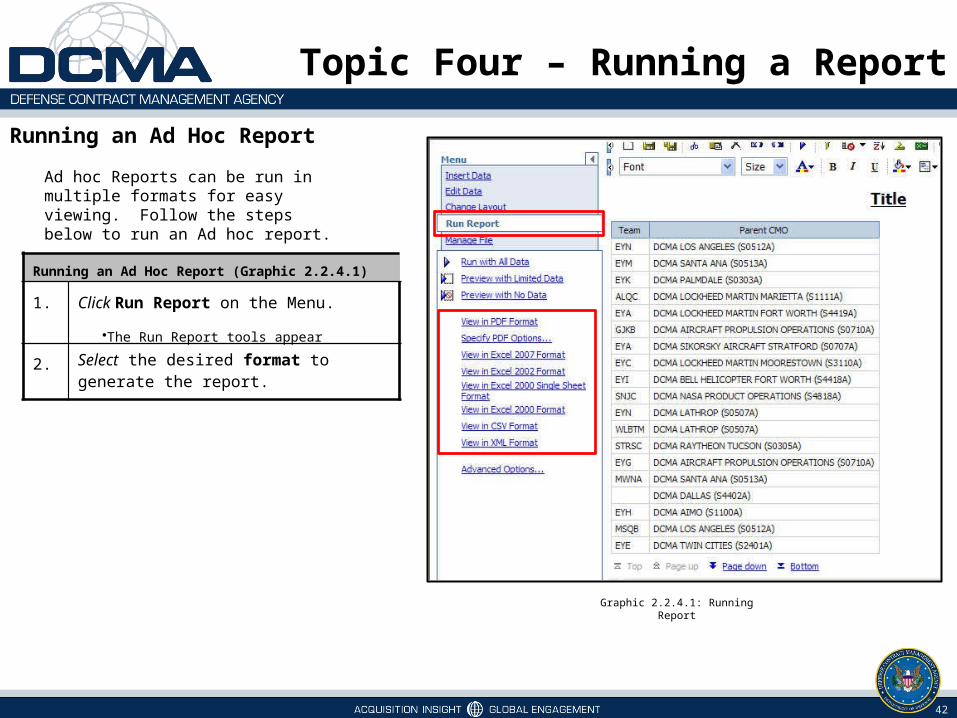
Graphic 2.2.4.1: Running Report
42
Topic Four – Running a Report
Ad hoc Reports can be run in multiple formats for easy viewing. Follow the steps below to run an Ad hoc report.
Running an Ad Hoc Report
Running an Ad Hoc Report (Graphic 2.2.4.1)
1. Click Run Report on the Menu.
•The Run Report tools appear
2. Select the desired format to generate the report.

Saving Ad Hoc Reports (Graphics 2.2.5.1 – 2.2.5.2)
1. Select Manage File from the Menu.
•A list of Save options appears in the Menu
2. Select Save As.
•The Save As window appears
3. Enter a Name, Description, and Screen tip for the report.
•As indicated on the screen, the file will besaved to My Folders
4. Click OK.
•The saved report now appears in the Adhoc Saved Query List (Graphic 2.2.5.2)
Graphic 2.2.5.1: Manage File
43
Topic Five – Saving a Report
Follow the steps below to save the Ad hoc report to My Folders.
Saving Reports
Graphic 2.2.5.2: Ad Hoc Saved Query List
Note: Only you can access Ad hoc reports
saved in My Folders.

Changing Save Location (Graphics 2.2.5.3 – 2.2.5.4)
1. Click the Select another location link.
•The Select a Location window appears
2. Click the Cognos folder link.
•The Public Folders link appears
Graphic 2.2.5.3: Select Save Location
44
Topic Five – Saving a Report
While viewing the Save As window, follow the steps below to change the save location of your report.
Change Save Location
Graphic 2.2.5.4: Select a Location Window

Changing Save Location (Graphics 2.2.5.5 – 2.2.5.6)
3. Click the Public Folders link.
•The Public Folders list appears (Graphic2.2.5.6)
4. Click the radio button to select a folder.
5. Click OK.
•The report has been saved in theselected Public Folder
45
Topic Five – Saving a Report
Change Save Locationcontinued
Graphic 2.2.5.6: Select Public Folder
Graphic 2.2.5.5: Public Folders Link
Note: All users with access to the Public
Folders can view Ad hoc reports saved in that
location.

Course Topics
Module Three Lessons
Lesson One Cube Overview
Lesson Two Choosing and Limiting Data
Lesson Three Advanced Analysis Tools
Module Three Lessons
46

Course Topics
At the end of this module you will be able to:
• Access LTDD cubes
• Locate each component of a LTDD cube
• Limit data displayed
• Drill down data
• Nest data
• Swap rows and columns
• Display data in chart format
• View data in different formats
Module Three Objectives
47

Module Three – Lesson One
48
Module Three – LTDD Cubes
Lesson One – LTDD Cubes Overview
Topic One Accessing LTDD Cubes
Topic Two Analysis Studio Interface
Topic Three Source Tree
Topic Four Overview Area
Topic Five Work Area
Topic Six Toolbar

Course Topics
Graphic 3.1.1.1: LTDD Report List
The Report List displays after you click on the Loss Theft Damage Destroyed (LTDD) icon on the eTools portal page. Reports are displayed by default (Graphic 3.1.1.1).
The reports menu bar displays a link to access Cubes. Click on Cubes to be directed to the Cube List page.
49
Accessing LTDD Cubes
Topic One – Accessing Cubes

Course Topics
The Cube List for LTDD displays after you click the Cubes link on the reports menu bar. The cube list may contain one or more cubes depending on the application. To launch the Analysis Studio Cube, click on the HTML icon next to the cube name (Graphic 3.1.1.2).
Graphic 3.1.1.2: LTDD Cube List
50
Topic One – Accessing Cubes
Accessing LTDD Cubescontinued

Menu Bar File, Edit, View, Settings, Run and Help
Tool Bar Contains icons for commonly used features
Source Tree A list of all of the resources that can be analyzed for the chosen cube
Work Area The main section of the screen that displays the results of the chosen data fields
Overview Area
Let’s you know what’s in the columns, what’s in the rows, and what is being filtered
Topic Two – Analysis Studio Interface
Graphic 3.1.2.1 Default Cube View
51
Once you click on the HTML icon, the Analysis Studio interface appears. The layout of Analysis Studio looks and functions similar to the previous cubes layout.
Interface Overview

Use the Source Tree (Graphic 3.1.3.1)
1. Click on the Plus icon next to the Receiving Organization folder.
2. Drill Down to the Organization level.
3. Click on the plus icon next to Measures.
• Measures are how you quantify the data, such as Total Dollar Value of Contract etc.
Topic Three – Source Tree
Graphic 3.1.3.1: Source Tree
52
Source TreeThe source tree presents a list of the data available for the cube. The data presented is based on:
• Dimensions – Descriptive data, e.g., Receiving Organization, Status.
• Hierarchies - Levels of dimensions, e.g., Receiving Organization ->DCMA->DCMA Aeronautical Systems Division->DCMA Chicago.
• Measures – Numerical data.
Use the steps below to become familiar with the contents of the selected cube.

Topic Four – Overview Area
Graphic 3.1.4.1: Overview Area
53
Purpose of the Overview Area
Use the overview area as a convenient place to explore and change the contents of the work area.It displays the applied filters and you will be able to rearrange rows and columns, drill up or down, and provide context for the work area (covered in Lesson Two).
You can also add dimensions to your work area by dragging them from the source tree and dropping them in the overview area.

Topic Four – Overview Area
Graphic 3.1.4.1: Overview Area - Context Filter
54
Context Filter
In addition to the rows and columns you also have the Context Filter.
The context you specify applies as a whole to the work area. For example, you can drag Submit Date from the Source Tree to the context area. When you click a specific Fiscal Year (FY) from the list, the values in the crosstab changes to represent data for that fiscal year. See the example in the graphic to the right.
We’ll look at how to add data to the Overview Area and the Work Space in Lesson Two.

Topic Five – Work Area
55
Using the Work Area
The Source Tree and the Overview are the tools you will use in Analysis Studio to analyze and manipulate the content your want to view in your cube.
The Work Area displays the end result of the information you pulled in to analyze.
As you decide what data to analyze you will view it in the crosstab view, as seen in the graphic to the right. The data will be presented in columns and rows.
The column header contains all of the DCMA Divisions. The row headers contain the Receiving Organizations. The measure is displayed in the top left cell. In this example, the measure is Total Dollar Value of Contracts.
Row Header
DCMA Organization
Graphic 3.1.5.1: Cross Tab View
Measure
Number of Line Items
Column Header
Submit Date

Course Topics
Icon Name Description
Run Export data to Adobe Acrobat, Excel, or a comma-separated value file
Top or Bottom
Limit data to the top or bottom values of a set
Zero suppression
Show or hide zero values
Sort Sort Rows or Columns in ascending or descending order by labels or values
Chart View the data as a bar chart, graph, or other graphic
Swap Switch columns to rows, or vice versa
Graphic 3.1.6.2: Cubes Toolbar
Graphic 3.1.6.2 shows the toolbar with some basic tools circled that can be used to manipulate how data are displayed.
56
Topic Six– Toolbar
LTDD 3.0 Toolbar
Graphic 3.1.6.1: Cube Layout

Module Three – Lesson Two
57
Module Three – Loss Theft Damaged Destroyed (LTDD) Cubes
Lesson Two – Choosing and Limiting Data
Topic One Choosing Data
Topic Two Context Filter
Topic Three Exclude
Topic Four Top or Bottom Values
Topic Five Suppress Zeros
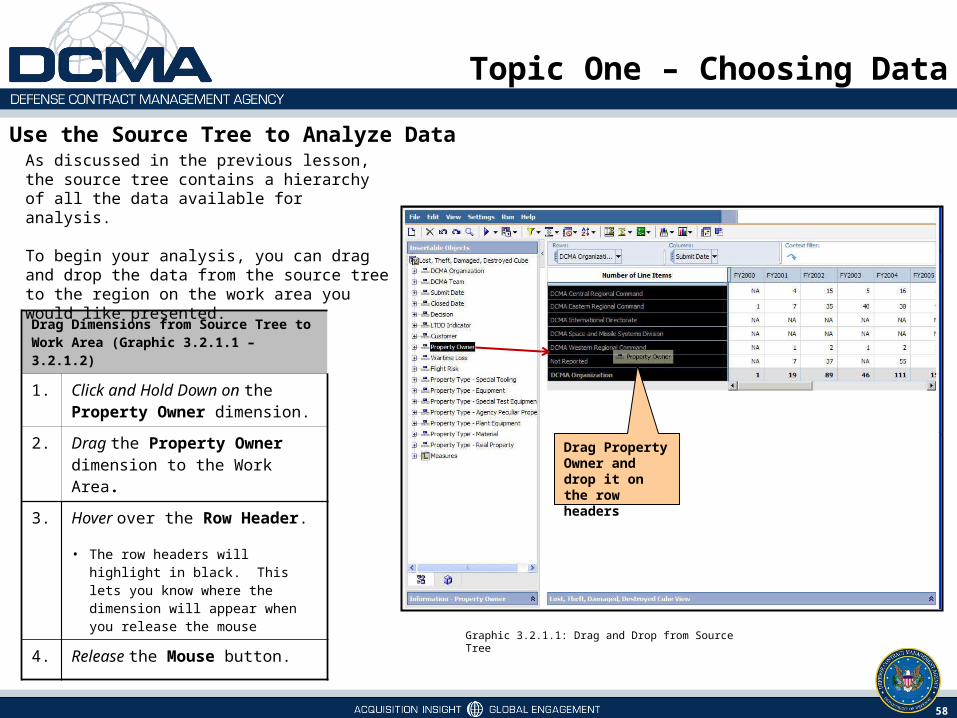
Drag Dimensions from Source Tree to Work Area (Graphic 3.2.1.1 – 3.2.1.2)
1. Click and Hold Down on the Property Owner dimension.
2. Drag the Property Owner dimension to the Work Area.
3. Hover over the Row Header.
• The row headers will highlight in black. This lets you know where the dimension will appear when you release the mouse
4. Release the Mouse button.
Topic One – Choosing Data
Graphic 3.2.1.1: Drag and Drop from Source Tree
58
Use the Source Tree to Analyze Data As discussed in the previous lesson, the source tree contains a hierarchy of all the data available for analysis.
To begin your analysis, you can drag and drop the data from the source tree to the region on the work area you would like presented.
Drag Property Owner and drop it on the row headers

Topic One – Choosing Data
Graphic 3.2.1.2 : Rows Defined as Property Owner
59
Use the Source Tree to Analyze Data
The Graphic below is the result of the previous exercise. Notice that the row headers display the Timeliness. The label at the bottom of the row headers identify the data that is being displayed.
Bottom cell defines what is being analyzed in the rows.

Topic One – Choosing Data
Graphic 3.2.1.3: Drag and Drop from Source Tree
60
Use the Source Tree to Analyze Data Continued You can drag any dimension from the source tree to define the data presented in the columns or rows.
In the exercise below, you will drag Status to the column header.
Drag Dimensions from Source Tree to Work Area (Graphic 3.2.1.3 – 3.2.1.4)
1. Click and Hold Down the Customer dimension.
2. Drag the Customer dimension to the Work Area.
3. Hover over the Column Header.
• The column headers will highlight in black. This lets you know where the dimension will appear when you release the mouse
4. Release the Mouse button.
• The Columns are now defined by contract status (see Graphic 3.2.1.4 on the next slide)
Drag Customer and drop it on the column headers

Topic One – Choosing Data
Graphic 3.2.1.4: Columns Defined as Status
61
Use the Source Tree to Analyze Data
The graphic below is the result of the previous exercise. Notice that the column headers display the Status. The label at the bottom of the row headers identify the data that is being displayed.
Top and far right cell defines what is being analyzed in the columns.

Drag Dimensions from Source Tree to Overview Area (Graphic 3.2.1.5 – 3.2.1.6)
1. Click and Hold Down the Wartime Loss dimension.
2 Drag the Wartime Loss dimension to the Columns section.
3. Hover over the Columns box till it highlights in black (Graphic 3.2.1.5)
4. Release the mouse button.
• The Columns are now defined by the Submit Date (see Graphic 3.2.1.6 on next slide)
Another way to define the data in the columns and/or rows is to drag your dimensions to the overview area.
In the Overview Area there is a section for Rows, one for Columns and one for Context Filter.
The steps below walk you through dragging and dropping dimensions to the Overview Area.
Topic One – Choosing Data
Graphic 3.2.1.5 : Submit Date Dropped on Columns in Overview Area
62
Drag Dimension from the Source Tree to the Overview Area

Topic One – Choosing Data
Graphic 3.2.1.6 : Dimension Replaced in Overview Area
63
Drag Dimension from the Source Tree to the Overview Area
The graphic below displays the result of the previous exercise.

Course Topics
Graphic 3.2.2.1: Dimensions Folders
Filtering Using Context Filters (Graphics 3.2.2.1 & 3.2.2.2)
1. Right-click on desired folder.
• In the example, FY 2010 Submit Date was right-clicked
• A drop-down menu appears
2.
Select Filter as Context from the drop-down menu (Graphic 3.2.2.1).
• The cube view will update and show the Total Dollar Value of Contracts submitted in FY 2010 (see Graphic 3.2.2.2 on next slide)
64
Topic Two – Context Filter
Filtering Options
Note: You can also drag FY 2010 from the Submit Date list into the Context filter section of the overview area.
Filtering limits the view of information within the cube and displays the information based on the filters you apply.
You can limit data by :• Using Context filters• Excluding unwanted information• Applying a top or bottom rule• Removing rows or columns with zero values

Course Topics
On the previous slide, we used the Dimensions Folders to select Damaged from the LTDD Indicator list as the filter.
The results displays the Number of Line Items by organization and customer, filtered by the number of cases of damage (Graphic 3.2.2.2).
Graphic 3.2.2.2: Result of Filtering Using Context Filter
65
Topic Two – Context Filter
Filtering Options

Course Topics
Graphic 3.2.3.1: Filtering Using Exclude
Using the exclude option is another way to filter your data. Using this option enables you to exclude the value from being displayed and hides the row or column from the cube view.
Filtering Using Exclude (Graphic 3.2.3.1 & 3.2.3.2)
1. Right-click a row or column.
• For this exercise, select the DCMA Central Regional Command row.
2. Click Exclude.
• The Work Area will display without the DCMA Central Region row (see Graphic 3.2.3.2 on next slide)
66
Topic Three – Exclude Items
Exclude Items

Topic Three – Exclude Items
Graphic 3.2.3.2: DCMA Central Region Excluded from the Work Area
67
Exclude Items
The graphic below displays the result of filter using the exclude option for the DCMA Central Region from the Work Area.
DCMA Central Regional Command values are excluded from the Subtotal and the row is hidden. The DCMA Organization total still includes the values.

Course Topics
Graphic 3.2.4.1: Selecting Top 5
You can quickly focus your analysis on items of greater significance by selecting the top or bottom values . For example, you can identify the top 5 Property Owners in terms of numbers of cases where they were relieved of liability
Select Top Values (Graphic 3.2.4.1 & 3.2.4.2)
1. Right-click on Property Owner in the Overview Area.
2. Select menu item.
3. Select menu item .
4. Select menu item .
• The Requesting Organizations with the 5 highest Total Dollar Value of Contracts denied is displayed (see Graphic 3.2.4.2 on next slide)
68
Topic Four – Top or Bottom Values
Selecting Top or Bottom Values

Topic Four – Top or Bottom Values
Graphic 3.2.4.2 : Top 5 Denied Requesting Organizations
69
Selecting Top or Bottom Values
The graphic below displays the result of selecting the top 5 liability-denied Property Owners.

Course Topics
Graphic 3.2.5.1: Filtering Using Dimensions Bar
You can suppress empty cells in both columns and rows. By default, rows and columns that contain zeros and nulls are removed.
Suppressing all zero and null values (Graphic 3.2.5.1 & 3.2.5.2)
1. Click on the Toolbar.
2. Select Suppress Rows and Columns menu item.
• Rows and columns with all zeros are hidden (see Graphic 3.2.5.2 on next page)
70
Topic Five – Suppress Zeros
Suppressing Zeros and Null Values

Topic Five – Suppress Zeros
Graphic 3.2.5.2: Suppression applied
71
Suppressing Zeros and Null Values
The graphic below displays the result of suppressing zeros.
Notice the “Suppression is applied” caption.

Module Three – Lesson Three
72
Module Two – Duty Free Entry (LTDD) Cubes
Lesson Three – Advanced Analysis Tools
Topic One Drill Down and Drill Up
Topic Two Nesting
Topic Three Swap Rows and Columns
Topic Four Charts
Topic Five View Output

Course Topics
Drill Down (Graphics 3.3.1.1 & 3.3.1.2)
1. Click on DCMA Central Regional Command in the DCMA list (Graphic 3.3.1.1)
• The Work Area now displays the items categorized under DCMA Central Regional Command (Graphic 3.3.1.1)
• Note that DCMA Central Regional Command now displays at the bottom of the rows – this indicates that it is the parent container for the items displaying as rows
2. Click DCMA Central Regional Command at the bottom of the row headers in the work area (Graphic 3.3.1.2)
• You drill back up and see all DCMA Divisions
You can drill down and up to change the focus of your analysis by moving between levels of information.
In the example below, you will drill down to view DCMA Central Regional Command details.
Graphic 3.3.1.1: Drill Down
73
Topic One – Drill Down and Drill Up
Drilling Down and Up in the Hierarchy
Graphic 3.3.1.2: Drill Up

Course Topics
Graphic 3.3.2.1: Nesting data
Nesting (Graphics 3.3.2.1– 3.3.2.3)
1. Click and drag Customer to the border on the right of the row headers.
• As you hover your mouse over the border it will display as a blinking black line
2. Release the mouse button to drop and nest Submit Date to the right of Property Owner. • The Work Area now displays Submit
Date as it relates to DCMA divisions (see Graphic 3.3.2.2 on next slide)
Nesting displays one set of data as it relates to another set of data.
In the following example, we will nest the Customer dimension within the Property Owner dimension.
74
Topic Two – Nesting
Nesting Cube Data

The graphic to the right shows the results of the exercise on the previous screen. The data displays all of the Poperty Owners broken down by Customers.
Notice that the Overview Area shows a nested Property Owner row to the right of the DCMA columns.
Using the Overview Area is another way you can nest items. You simply drag the dimension from the Source Tree and drag it to the desired nested location in the Overview Area.
Topic Two – Nesting
Graphic 3.3.2.2: Nest Data Sets in Overview Area
75
Nesting Using the Overview Area
Delete Nesting
1. Right-click the dimension in the Overview Area to be deleted.
• A menu specific to that row will display
• If attempting to remove a nested column you would select the cell to the left of the column headers to be deleted
2. Select Delete (Graphic 3.3.2.3).
Graphic 3.3.2.3: Delete Nested Data

Course Topics
Graphic 3.3.3.1: The Cube View of the Data
Using the Swap Tool
You can swap rows and columns option to display your data. The following example illustrates how to use the Swap tool to swap rows and columns.
Topic Three – Swap Rows and Columns
76
Using Swap Tool (Graphic 3.3.3.1 – 3.3.3.2)
1. Locate the Swap icon on the toolbar at the top of the cube.
2. Click the Swap icon to swap the rows and columns.

Course TopicsGraphic 3.3.3.2: The Data View as a Result of Using the Swap Tool
Using the Swap Tool
The resulting screen displays the rows and columns that have been swapped.
Topic Three – Swap Rows and Columns
77

Course Topics
Creating Charts
Graphic 3.3.4.1: Using Chart Tool
Using Chart Tool (Graphic 3.3.4.1 & 3.3.4.2)
1. Click the icon on the toolbar.
2. Select the Column Chart menu item.
3. Click the Standard menu item.
• The chart is displayed above the crosstab (see Graphic 3.3.4.2 on next slide)
• You can also choose to show values on the chart.
Charts are a graphical way of presenting information. You can use charts to reveal trends and relationships.
In the example below, you will use the chart tool to create a standard column chart.
Topic Four – Charts
78

Course Topics
Using the Chart Tool
Graphic 3.3.4.2: Chart and Crosstab Displayed
The resulting page display the data in a Chart format (Graphic 3.3.4.2).
Note: You can use the display button on the toolbar to display the data in a chart or crosstab view.
Topic Four – Charts
79

Course Topics
Using the Run Tool
Graphic 3.3.5.1: Using File Tool
Using the Run Tool (Graphic 3.3.5.1 – 3.3.5.2)
1. Click the icon on the toolbar.
2. Select the Run Report (PDF) menu item.
• The report is displayed in PDF format (see Graphic 3.3.5.2 on next slide)
Once you have selected the data to view, you have the option to save your for review at a later time.
You can view and save your output in:• HTML – for viewing large sets of data• PDF – for printing• Excel – different Excel formats are supported• CSV – cannot export charts to CSV files• XML – used as an input source for other
applications
The following example shows you how to use the Run tool to export data.
Topic Five – View Output
80

Course Topics
Using the Run Tool
Graphic 3.3.5.2: Data Exported to PDF
Depending on the format option you selected (HTML, PDF, Excel, CSV, or XML), the report displays (Graphic 3.3.5.2).
Selecting the Report Options from the Run menu (Graphic 3.3.5.3) allows brings up the Report Option page (Graphic 3.3.5.4). You can specify the report title, orientation, and page size for your report.
Topic Five – View Output
81
Graphic 3.3.5.3: Run MenuGraphic 3.3.5.4: Report Options