loss of well control occurrence and size … blowout/well release descriptions ... 16.5.3 kick...
TRANSCRIPT

Title: Loss of Well Control Occurrence and Size Estimators, Phase I and II
CLIENT: Authors: BSEE Per Holand
Report no. Version Date ES201471/2 Final Report 04-May 2017 04-May 2017
Final REPORT

ExproSoft AS Strandveien 43, 7043 Trondheim Postal address: P.O. Box 6095 Sluppen, 7434 Trondheim, Norway Tel.: (+47) 73 20 04 00 Fax: (+47) 73 20 04 01
REPORT
Client: BSEE
SUBJECT: Loss of Well Control Occurrence and Size Estimators, Phase I and II
Distribution: Name Company
Dr. Elaine Kleiner, COR BSEE
Classification Project no Version no Date No. of pages
Open ES201471 Final report 04.05.2017 200
Prepared by: Reviewed by: Approved by: Signature
Signature Signature
Dr. Per Holand MSc. Hans Peter Jenssen MSc. Roger Klausen
SUMMARY
Loss of Well Control (LOWC) events reported in the SINTEF Offshore Blowout Database
for the period 2000–2015 are carefully studied in this report. The events are classified with
respect to the operational phases: exploration drilling, development drilling, workover
activities, well completion activities, production, wireline and abandoned wells.
Information about the individual LOWC events pertaining to the following issues is sought:
Equipment failures
Human errors
Testing of equipment prior to incident
Observation of well kicks
Violation of rules and regulations
Information sources that are part of the SINTEF database system are reviewed together with
several other sources, with a special focus on BSEE’s eWell system.
Well kicks from the US GOM OCS in the period 2011–2015 are identified through a
systematic review of the Well Activity Reports (WAR) in the BSEE eWell system.
The report describes, categorizes, and analyzes the observed LOWC events for the period
2000–2015, and compares the LOWC frequencies in the US GoM with other regulated areas.
This report overrides the previous Phase I report. This report is the combined final report
from Phase I and Phase II.

Loss of Well Control Occurrence and Size Estimators, Phase I and II
Page 2
TABLE OF CONTENTS TABLE OF CONTENTS ......................................................................................................... 2
GLOSSARY OF ACRONYMS AND DEFINITIONS .......................................................... 6
EXECUTIVE SUMMARY ...................................................................................................... 9
PREFACE ............................................................................................................................... 23
INTRODUCTION .................................................................................................................. 24
MAIN CHANGES FROM PHASE I REPORT .................................................................. 25
MAIN DATA SOURCE FOR LOWC DATA ............................................................... 26
1.1 DATABASE STRUCTURE ......................................................................................... 26 1.1.1 Incident Category and Sub-category .................................................................... 26 1.1.2 Blowout/Well Release Descriptions ..................................................................... 27
1.1.3 Exposure Data ...................................................................................................... 28 1.2 PHASE OF OPERATION ........................................................................................... 29 1.3 NORTH SEA SPECIFIC REQUIREMENTS ................................................................... 30
1.4 QUALITY OF LOWC DATA .................................................................................... 30
EXPOSURE DATA ......................................................................................................... 33
2.1 EXPOSURE DATA FOR US GOM OCS, UK AND NORWAY ..................................... 33 2.2 DRILLING EXPOSURE DATA FROM VARIOUS COUNTRIES ...................................... 35 2.3 WATER DEPTH RELATED DRILLING EXPOSURE US GOM OCS ............................ 36
2.4 DRILLING EXPOSURE SUBSEA VS. SURFACE BOPS US GOM OCS ........................ 37
LOWC BARRIERS ......................................................................................................... 39
OVERVIEW OF LOWC DATA .................................................................................... 41
4.1 WHEN AND WHERE DO LOWC EVENTS OCCUR? .................................................. 41
4.2 DURING WHAT OPERATIONAL PHASES DO LOWC EVENTS OCCUR? ..................... 41 4.3 COUNTRIES REPRESENTED WITH LOWC EVENTS IN THE DATABASE .................... 42 4.4 WELL CATEGORIES IN DRILLING ........................................................................... 43 4.5 NORTH SEA REQUIREMENTS ................................................................................. 44
SHALLOW ZONE DRILLING LOWC EVENTS ...................................................... 47
5.1 SHALLOW ZONE LOWC EXPERIENCE ................................................................... 47 5.1.1 Shallow Zone LOWC Causes ............................................................................... 50 5.1.2 Equipment Failures Contribution to Shallow Zone LOWC Risk. ........................ 52
5.2 HUMAN ERRORS IN SHALLOW ZONE LOWC EVENTS ........................................... 53
DEEP ZONE DRILLING LOWC EVENTS ................................................................ 55
6.1 WELL BARRIERS IN DEEP ZONE DRILLING ............................................................ 55
6.2 DEEP ZONE DRILLING LOWC EXPERIENCE .......................................................... 56 6.3 DEEP ZONE DRILLING LOWC CAUSES ................................................................. 61
6.3.1 Loss of the Primary and Secondary Barriers ....................................................... 61 6.3.2 Brief LOWC Descriptions .................................................................................... 64
6.4 HUMAN ERRORS IN DEEP ZONE DRILLING LOWC EVENTS .................................. 66
6.5 EQUIPMENT FAILURES IN DEEP ZONE DRILLING LOWC EVENTS ......................... 68
WORKOVER LOWC EVENTS .................................................................................... 70

Loss of Well Control Occurrence and Size Estimators, Phase I and II
Page 3
7.1 WORKOVER LOWC EXPERIENCE .......................................................................... 70
7.2 WORKOVER LOWC CAUSES ................................................................................. 75 7.2.1 Loss of the Primary and Secondary Barriers ....................................................... 75 7.2.2 Brief LOWC Event Descriptions .......................................................................... 77
7.3 HUMAN ERRORS IN WORKOVER LOWC EVENTS .................................................. 81 7.4 EQUIPMENT FAILURES IN WORKOVER LOWC EVENTS ......................................... 83
COMPLETION LOWC EVENTS ................................................................................. 86
8.1 COMPLETION LOWC EXPERIENCE ........................................................................ 86 8.2 COMPLETION LOWC CAUSES ............................................................................... 89
8.2.1 Loss of the Primary and Secondary Barriers ....................................................... 89
8.2.2 Brief LOWC Descriptions .................................................................................... 90 8.3 HUMAN ERRORS IN COMPLETION LOWC EVENTS ................................................ 91 8.4 EQUIPMENT FAILURES IN COMPLETION LOWC EVENTS ....................................... 92
PRODUCTION LOWC EVENTS ................................................................................. 94
9.1 PRODUCTION LOWC EXPERIENCE ........................................................................ 94 9.1.1 Production LOWCs with External Causes ........................................................... 95
9.1.2 Production LOWCs with “Normal” Causes ........................................................ 97 9.1.3 Production LOWC Trends .................................................................................... 99 9.1.4 Brief LOWC Descriptions .................................................................................. 100
9.2 HUMAN ERRORS IN PRODUCTION LOWC EVENTS .............................................. 106 9.2.1 LOWC Events With External Causes ................................................................. 107
9.2.2 LOWC Events Without External Causes ............................................................ 107
WIRELINE LOWC EVENTS ...................................................................................... 108
10.1 WIRELINE LOWC EXPERIENCE ........................................................................... 108
10.2 HUMAN ERRORS IN WIRELINE LOWC EVENTS ................................................... 110 10.3 EQUIPMENT FAILURES IN WIRELINE LOWC EVENTS .......................................... 110
ABANDONED WELL LOWC EVENTS .................................................................... 111
UNKNOWN PHASE LOWC EVENTS ...................................................................... 113
LOWC CHARACTERISTICS ..................................................................................... 114
13.1 LOWCS FLOW PATHS AND RELEASE POINTS ...................................................... 114
13.2 LOWCS DURATION ............................................................................................ 118 13.3 HOW THE LOWCS FLOW WERE STOPPED ........................................................... 119 13.4 LOWC FLOW MEDIUM AND SPILL ...................................................................... 121 13.5 WATER DEPTH WHEN LOWCS OCCURRED ......................................................... 125 13.6 WELL DEPTH WHEN LOWCS OCCURRED ........................................................... 127
13.7 LOWCS THAT COME FROM MAIN RESERVOIR .................................................... 128 13.8 WELL DEPTH WHEN KICK OCCURRED VS. TOTAL WELL DEPTH ......................... 129
LOWC CONSEQUENCES .......................................................................................... 131
14.1 OVERVIEW OF EXPERIENCED CONSEQUENCES .................................................... 131 14.2 SHALLOW ZONE DRILLING LOWCS .................................................................... 134 14.3 DEEP ZONE DRILLING LOWCS ........................................................................... 135 14.4 WORKOVER LOWCS........................................................................................... 137
14.5 COMPLETION LOWCS ......................................................................................... 139
14.6 PRODUCTION LOWCS ......................................................................................... 139 14.7 WIRELINE LOWCS.............................................................................................. 140

Loss of Well Control Occurrence and Size Estimators, Phase I and II
Page 4
14.8 ABANDONED WELLS LOWCS ............................................................................. 140
14.9 UNKNOWN PHASE LOWCS ................................................................................. 141
LOWC CAUSAL FACTORS ....................................................................................... 142
15.1 SHALLOW ZONE LOWC ...................................................................................... 142
15.1.1 Shallow Zone Kick Causes ............................................................................. 142 15.1.2 Handling of Shallow Zone LOWCs ................................................................ 143
15.2 DEEP ZONE DRILLING .......................................................................................... 144 15.2.1 Kick Observation ............................................................................................ 144 15.2.2 Causes for Secondary Barrier Failures ......................................................... 145
15.3 COMPLETION ....................................................................................................... 147
15.3.1 Causes for the Primary Barrier Failures ....................................................... 147 15.3.2 Causes for the Secondary Barrier Failures ................................................... 149
15.4 WORKOVER ......................................................................................................... 150 15.4.1 Causes for Primary Barrier Failures ............................................................. 150
15.4.2 Causes for Secondary Barrier Failures ......................................................... 152 15.5 PRODUCTION ....................................................................................................... 154
15.5.1 Causes for the Primary Barrier Failures ....................................................... 154
15.5.2 Causes for Secondary Barrier Failures ......................................................... 155 15.6 WIRELINE ............................................................................................................ 155
15.6.1 Causes for the Primary Barrier Failures ....................................................... 155 15.6.2 Causes for Secondary Barrier Failures ......................................................... 156
15.7 CAUSAL FACTORS SUMMARY .............................................................................. 157 15.8 VIOLATION OF RULES AND REGULATIONS........................................................... 158 15.9 TEST OF EQUIPMENT PRIOR TO LOWC ............................................................... 159
WELL KICK EXPERIENCE ...................................................................................... 160
16.1 KICK FREQUENCIES FROM VARIOUS AREAS ........................................................ 160
16.2 KICK STATISTICS FROM PREVIOUS STUDIES ........................................................ 160
16.3 RECENT ESTABLISHED KICK STATISTICS ............................................................ 162 16.3.1 UK Kick Frequencies ..................................................................................... 162 16.3.2 Norwegian Kick Frequencies ......................................................................... 163
16.4 COMPARISON OF KICK STATISTICS ...................................................................... 165 16.5 US GOM OCS KICK STATISTICS (FOR WELLS SPUDDED 2011-2015) .................. 167
16.5.1 About the Kick Data Collected ....................................................................... 167
16.5.2 LOWC and Kicks ............................................................................................ 168 16.5.3 Kick Frequencies and Well Depth .................................................................. 168
16.5.4 Kick Frequencies and Water Depth ............................................................... 169 16.5.5 Kick Frequencies and Well Depth when Kick Occurred ................................ 170 16.5.6 Kick Frequencies and BOP Type ................................................................... 171 16.5.7 Annualized Kick Frequencies ......................................................................... 172
16.6 COMPARISON OF US GOM KICK FREQUENCY VS. OTHER STATISTICS ................ 173
16.7 KICK CAUSES ...................................................................................................... 175 16.7.1 Kick Causes Discussion ................................................................................. 175
16.7.2 Kick and Deviated Wells ................................................................................ 176 16.7.3 Kick and Stuck Pipe ........................................................................................ 177
LOWC RISK ANALYSIS ............................................................................................. 179
17.1 EXPERIENCED RISK ............................................................................................. 179 17.1.1 US GoM OCS LOWC Frequencies vs. Regulated Areas................................ 179

Loss of Well Control Occurrence and Size Estimators, Phase I and II
Page 5
17.1.2 Deepwater vs. Shallow Water Drilling .......................................................... 182
17.1.3 Surface BOP vs. Subsea BOPs ....................................................................... 183 17.1.4 Probability of Large Oil Spills ....................................................................... 185
17.2 RISK MODEL FOR PREDICTION OF FUTURE RISK ................................................. 188
17.3 ESTIMATED RISK LEVEL IN US GOM OCS FOR A FIVE-YEAR PERIOD ................ 189 17.4 RISK MODEL VERIFICATION ................................................................................ 191 17.5 RISK MATRICES ................................................................................................... 192 17.6 LOWC RISK REDUCTION DISCUSSION ................................................................ 193
REFERENCES .............................................................................................................. 195
APPENDIX 1, RISK ANALYSES SPREADSHEETS ...................................................... 196

Loss of Well Control Occurrence and Size Estimators, Phase I and II
Page 6
GLOSSARY OF ACRONYMS AND DEFINITIONS ANP - Agência Nacional do Petróleo (Brazilian)
APD - Application for Permit to Drill
BHA - Bottom Hole Assembly
BOEM - Bureau of Ocean Energy Management
BOEMRE - Bureau of Ocean Energy Management, Regulation and Enforcement
BOP - Blowout Preventer
BSEE - Bureau of Safety and Environmental Enforcement
BSR - Blind-shear Ram
DP - Drill-pipe
EDS - Emergency Disconnect Situation
ESD - Emergency Shut Down
ESP - Electrical Submersible Pump
FIV - Formation Isolation Valve
FTC - Failed To Close
FTO - Failed To Open
GoM - Gulf of Mexico
HP - High Pressure
HPHT - High Pressure High Temperature
HSE - Health and Safety Executive (UK)
LCP - Leakage in Closed Position
LMRP - Lower Marine Riser Package
LOWC - Loss of Well Control
LPR - Lower Pipe Ram
LWD - Logging While Drilling
MD - Measured Depth
MMS - Mineral Management Service
MPR - Middle Pipe Ram
MSL - Mean Sea Level
MTBB - Mean Time Between Blowouts
MTTF - Mean Time To Failure
MTTR - Mean Time To Repair
NPD - Norwegian Petroleum Directorate
OCS - Outer Continental Shelf
PC - Premature Closure
PSA - Petroleum Safety Authority (Norway)
QA - Quality Assurance
ROV - Remotely Operated Vehicle
SCSSV - Surface Controlled Subsurface Safety Valve
TD - Total Depth
TVD - True Vertical Depth
UPR - Upper Pipe Ram
WP - Working Pressure
WR - Wireline Retrievable

Loss of Well Control Occurrence and Size Estimators, Phase I and II
Page 7
The following categories for the spill size have been used:
< 10 bbls = very small
10 - 50 bbls = small
50 - 500 bbls = medium
500 - 5,000 bbls = large
5,000 - 50,000 bbls = very large
> 50,000 bbls = gigantic
BSEE definition for Loss of Well Control:
Uncontrolled flow of formation or other fluids. The flow may be to an exposed
formation (an underground blowout) or at the surface (a surface blowout).
Flow through a diverter
Uncontrolled flow resulting from a failure of surface equipment or procedures
SINTEF Offshore Blowout Database definitions
Blowout definition: A blowout is an incident where formation fluid flows out of the well or
between formation layers after all the predefined technical well barriers or the activation of the
same have failed.
Well release definition: The reported incident is a well release if oil or gas flowed from the
well from some point were flow was not intended and the flow was stopped by use of the barrier
system that was available on the well at the time the incident started.
Shallow gas definition: Any gas zone penetrated before the BOP has been installed. Any zone
penetrated after the BOP is installed is not shallow gas (typical Norwegian definition of shallow
gas).
Categories and subcategories for LOWC incidents in the SINTEF Offshore Blowout
Database Main Category Sub category Comments/Example
Blowout and well release
Blowout (surface flow)
1. Totally uncontrolled flow, from a deep zone
Totally uncontrolled incidents with surface/subsea flow.
2. Totally uncontrolled flow, from a shallow zone
Typically the diverter system fails.
3. Shallow gas “controlled” subsea release only
Typical incident for e.g. riserless drilling is performed when the well starts to flow. The rig is pulled away.
Blowout (underground flow)
4. Underground flow only
5. Underground flow mainly, limited surface flow
The limited surface flow will be incidents where a minor flow has appeared, and typically the BOP has been activated to shut the surface flow.
Well release
6. Limited surface flow before the secondary barrier was activated
Typical incident will be with flow through the drill pipe and the shear ram is activated.
7. Tubing blown out of well, then the secondary barrier is activated
Typical incident occurring during completion or workover. Shear ram is used to close the well after the tubing has been blown out of the well.
Diverted well release
8. Shallow gas controlled flow (diverted)
All incidents where the diverter system functioned as intended.
Unknown Unknown Unknown may be selected for both the category and the subcategory.

Loss of Well Control Occurrence and Size Estimators, Phase I and II
Page 8
Deep and shallow zone LOWC events
Shallow zone LOWC event - A LOWC event that occurs before the BOP has been
installed on the wellhead
Deep zone LOWC – A LOWC event that occurs after the BOP has been landed on the
wellhead
Deepwater and shallow water definition
Deepwater – Water depth deeper than 600 meters
Shallow water – Water depth less than 600 meters
Deep well and normal well definition
Deep well - A well with a total depth deeper than 4,000 mTVD
Normal well - A well with a total depth less than 4,000 mTVD
HPHT well definitions
US definition
According to 30 CFR 250.807 HPHT means when one or more of the following well
conditions exist:
1) The completion of the well requires completion equipment or well control equipment
assigned a pressure rating greater than 15,000 psig or a temperature rating greater than 350
degrees Fahrenheit (°F);
2) The maximum anticipated surface pressure or shut-in tubing pressure is greater than
15,000 psig on the seafloor for a well with a subsea wellhead or at the surface for a well with
a surface wellhead; or
3) The flowing temperature is equal to or greater than 350 degrees Fahrenheit (°F) on the
seafloor for a well with a subsea wellhead or at the surface for a well with a surface wellhead.
HPHT definition is used in this report
HPHT well – A well with expected shut-in pressure exceeding 69 MPa (10,000 psi), or a
static bottom hole temperature higher than 150 °C (302 F)
Areas of operation
The following areas of operations are used in the report;
US GoM OCS
Regulated area include: UK, Norway, Netherlands, Canada East Coast, Australia, US Pacific
OCS, Denmark and Brazil
Rest of the world: All countries/areas not mentioned above

Loss of Well Control Occurrence and Size Estimators, Phase I and II
Page 9
EXECUTIVE SUMMARY
Overview
The Phase I objective was to update offshore loss of well control (LOWC) frequency
information for the period 2006-2014 for the US Gulf of Mexico and Pacific OCS, North Sea,
Canada, Brazil, and Australian offshore regions and other areas with a comparable regulatory
regime. When working with the Phase I the period was extended to 2000–2014 to get a more
comprehensive data set to evaluate.
The work with Phase II of the project was started in October 2016. The Phase II Objective has
been to update offshore loss of well control frequency information for the period 2015, and
merge the results with the Phase I results. Further, the LOWC incidents experienced during the
production phase and wireline operations for the period 2000 – 2015 have been added and
analyzed.
In Phase II of the project 39 new LOWC events were added to the LOWC experience, so the
total number of LOWCs increased from 117 to 156. They were; one shallow gas incident during
development drilling, one abandoned well incident, 26 production incidents, seven wireline
incidents, and four incidents where the operational phase is unknown.
This report includes all information from the previous Phase I report, in addition to the added
information. This report therefore overrides the previous Phase I report. This report is the
combined final report from Phase I and Phase II.
Loss of Well Control (LOWC) events reported in the SINTEF Offshore Blowout Database for
the period 2000–2015 are carefully studied in this report. The events are classified with respect
to the following operational phases:
Exploration drilling
Development drilling
Workover activities
Well completion activities
Production
Wireline
Abandoned wells
The drilling LOWC events have further been grouped in:
Shallow zone LOWC event - A LOWC event that occur before the BOP has been
installed on the wellhead
Deep zone LOWC – A LOWC event that occur after the BOP has been landed on the
wellhead
The descriptions of the individual LOWC events in the SINTEF database have been reviewed
in order to extract detailed information about the following issues:
Equipment failures

Loss of Well Control Occurrence and Size Estimators, Phase I and II
Page 10
Human errors
Testing of equipment prior to incident
Observations of well kicks
Violations of rules and regulations
The study is based on data from the SINTEF database, but is supplemented by other worldwide
sources of information, with special focus on the BSEE eWell system.
Well kicks in the US GOM OCS for the period 2011–2015 are identified through a systematic
review of the Well Activity Reports (WARs) in the BSEE eWell system.
A risk model has been developed for estimating the US GoM risk related to LOWC events.
The report describes, categorizes, and analyzes the observed LOWC events for the period
2000–2015, and compares the LOWC frequencies in the US GoM with other areas of the world.
In addition, the future LOWC risk in the US GOM is assessed.
The following areas of operations are used in the report;
US GoM OCS
Regulated area: UK, Norway, Netherlands, Canada East Coast, Australia, US Pacific OCS,
Denmark and Brazil
Rest of the world: All countries/areas not mentioned above
Table 1.1 shows an overview of the number of LOWC events for the various areas and the
operational phases for the period 2000–2015.
Table 1.1 Area-specific overview of the number of LOWC events that occurred during different operational phases (2000–2015).
Area Dev.
drilling Expl.
Drilling Unk.
Drilling Compl-etion
Work-over
Production Wire-line
Aband-oned well
Un-known
Total External cause*
No ext. cause*
US GOM OCS 16 24 3 21 5 7 3 3 82
19.5 % 29.3 % 3.7 % 25.6 % 6.1 % 8.5 % 3.7 % 3.7 %
Regu-lated areas
UK & Norwegian waters 4 3 5 5 3 4 1 1 26
15.4 % 11.5 % 19.2 % 19.2 % 11.5 % 15.4 % 3.8 % 3.8 %
Netherlands. Canada East Coast. Australia. US Pacific OCS. Denmark. Brazil
2 3 3 1 9
22.2 % 33.3 % 33.3 % 11.1 %
Rest of the world 9 5 4 2 4 7 4 2 2 39
23.1 % 12.8 % 10.3 % 5.1 % 10.3 % 17.9 % 10.3 % 5.1 % 5.1 %
Total 31 35 4 10 33 12 14 7 6 4 156
19.9 % 22.4 % 2.6 % 6.4 % 21.2 % 7.7 % 9.0 % 4.5 % 3.8 % 2.6 %
* External causes are typical; storm, military activity, ship collision, fire and earthquake.
More than 50% of the LOWC events come from the US GoM OCS, which is the most mature
area with the highest activity. Approximately 45% of the LOWC events occurred during
drilling and 21% during workovers, and 17% during production. Approximately 50% of the
drilling LOWC events were shallow events.
From a risk perspective, a blowout (surface flow) from a “deep” zone has the highest potential
for consequences. Table 1.2 presents an overview of the LOWC main categories for the
regulated areas, including the US GoM OCS 2000–2015.

Loss of Well Control Occurrence and Size Estimators, Phase I and II
Page 11
Table 1.2 Overview of LOWC main categories for the regulated areas including the US GoM OCS 2000–2015.
Main category 1 Deep zone LOWCs Shallow zone LOWCs
Regulated area
US GoM OCS
Total Regulated
area US GoM
OCS Total
Blowout (surface flow) 8 30 38 4 12 16
Blowout (underground flow) 1 3 4 Diverted well release 2 2 2 8 10
Well release 20 25 45 2 2
Total 29 60 89 6 22 28
Thirty-eight blowouts (surface flow) from a “deep” zone were identified.
Fatalities Related to LOWC Events
In total, 13 fatalities occurred in the regulated areas including the US GoM OCS for all
operations included. Table 1.3 shows the total number of LOWC events versus the number of
fatalities in regulated areas, including US GoM OCS 2000–2015.
Table 1.3 Total number of LOWC events versus the number of fatalities in regulated areas, including US GoM OCS 2000–2015.
Main Category
No. of LOWC events/Fatalities
Development drilling
Exploration drilling Com-
pletion Work-over
Prod-uction
Wire-line
Aband-oned well
Un-known
Total Deep zone
Shallow zone
Deep zone
Shallow zone
Blowout (surface flow) 3 / 0 10 / 0 10 / 12 6 / 0 2 / 0 11 / 0 8 / 0 1 / 0 2 / 0 1 / 0 54 / 12
Blowout (underground flow) 1 / 0 / 3 / 0 / / / / / / / 4 / 0
Diverted well release / 6 / 0 1 / 0 4 / 0 1 / 0 / / / / / 12 / 0
Well release 2 / 0 / 4 / 0 2 / 0 5 / 0 18 / 1 7 / 0 6 / 0 2 / 0 1 / 0 47 / 1
Total 6 / 0 16 / 0 18 / 12 12 / 0 8 / 0 29 / 1 15 / 0 7 / 0 4 / 0 2 / 0 117 / 13
One LOWC event caused 11 fatalities (Deepwater Horizon) and two LOWC events also
occurring in the US GoM OCS, caused one fatality. Twelve fatalities comes from blowout
(surface flow) incidents and one during a well release.
In the period 2000 -2015 there have been LOWC events in the rest of the world with several
fatalities. The two most serious ones occurred in Azerbaijan 2015, 32 fatalities and Mexico
2007, 23 fatalities. Both these events occurred in the production phase, and the personnel died
during evacuation. In addition there were three more LOWC events with a total of six fatalities.
In total there were 74 fatalities worldwide in the period 2000 – 2015 associated to LOWCs.
1 The LOWC events are classified into the following main categories:
Blowout (surface flow)
Blowout (underground flow)
Well release
Diverted well release

Loss of Well Control Occurrence and Size Estimators, Phase I and II
Page 12
In the period 1980–1999, 186 LOWC events occurred in the regulated areas including the US
GoM OCS during the same phases of operation. For this period 58 fatalities occurred. One
LOWC in Brazil (Enchova) in 1984 caused 37 fatalities. All died when a cable for the lifeboat
snapped during lowering. The remaining 21 died in eight different LOWC incidents
For the period 1980 – 1999 there were some LOWCs incidents with several fatalities. One in
China in 1980 during exploration drilling that caused 70 fatalities (rig Bohai 3). One in Saudi
Arabia in 1980 during exploration drilling that caused 19 fatalities due to inhaling H2S (rig Ron
Tappmaier). Further, in 1980, for one drilling incident in the Nigerian delta it was claimed that
180 civilians died due to the pollution (Rig Sedco 135C).
There were further, 10 more LOWC incidents in rest of the world that caused in total 33
fatalities for the period 1980 – 1999.
In total there were 360 fatalities worldwide in the period 1980 – 1999 associated to LOWCs.
Pollution from LOWC Events
Three of the deep zone drilling LOWC events that occurred in 2000–2015 in the US GoM OCS
and the regulated areas caused a major pollution. These accidents occurred in 2009, 2010, and
2011.
2009 – Australia, Montara: A total volume of 29,600 barrels 4,800 m3, or 66 m3 per day.
2010 – USA, Macondo: 8,000 m3 a day in 85 days, in total 680,000 m3, or 4,250,000 bbls
2011 – Brazil, Frade field: 600 bbls per day or 3,700 bbls in total.
The spill from the Macondo blowout was 140 times larger than the Montara blowout and 1,150
times larger than the Frade blowout in terms of amount of oil released. These incidents caused
large media attention, high direct costs, and loss of reputation for the involved parties.
In addition there is one event that occurred in 2004 and is still ongoing. A storm created an
underwater landslide that toppled the Mississippi Canyon 20A production platform. The daily
leak rate is limited to a few barrels, but the cumulative leak over 12 - 13 years caused this
LOWC to be categorized as very large. The total volume leaked over this period has been
estimated to be between 6,000 – 25,000 barrels.
In 2001 a spill occurred in Brazil. The total volume was estimated to 150 barrels. For this spill
the phase of operation was unknown. In 2002 a 350 bbls spill to the sea from a producing well
occurred in the US GoM OCS.
Further, one drilling LOWC event in 2000 caused a release of 150–200 barrels of crude oil
(Mississippi Canyon 584). Further, an abandoned well spilled 62 barrels before being
controlled in 2010.
For workovers and completions, some LOWC events were listed with minor pollution. These
spills were not severe. Typically, a few gallons of oil entered the water or a limited sheen was
reported. None of these incidents were regarded as important pollution events.

Loss of Well Control Occurrence and Size Estimators, Phase I and II
Page 13
In the period 1980–1999, none of the LOWC events in the US GoM OCS, Norway, or UK
caused any significant pollution incident.
Ignition
Table 1.4 shows the number of ignited LOWC events and the ignition time.
Table 1.4 Ignition of LOWC events in the regulated areas including the US GoM OCS 2000–2015.
Main category
Ignition time grouped Development
drilling Exploration
drilling Compl-etion
Work-over
Prod-uction
Wire-line
Abando-ned well
Unknown Total Distri-
bution % Deep Shallow Deep Shallow
Blowout (surface flow)
Immediate ignition 2 1 1 4 7.4 %
5 min - 1 hour 1 1 1.9 %
6 - 24 hours 1 1 1.9 %
More than 24 hours 1 1 2 3.7 %
No ignition 2 8 8 6 1 11 7 1 1 1 46 85.2 %
Total 3 10 10 6 2 11 8 1 2 1 54 100.0 %
Blowout (undergro-und flow)
No ignition 1 3 4 100.0 %
Total 1 3 4 100.0 %
Diverted well release
No ignition 6 1 4 1 12 100.0 %
Total 6 1 4 1 12 100.0 %
Well release
Immediate ignition 1 1 2 4.3 %
No ignition 2 3 2 5 17 7 6 2 1 45 95.7 %
Total 2 4 2 5 18 7 6 2 1 47 100.0 %
Total all 6 16 18 12 8 29 15 7 4 2 117
Eight (8.5%) of the 117 LOWC events ignited. Eight (14.8%) of the blowout (surface flow) and
two (4.3%) of the well releases ignited. Blowout (surface flow) may ignite immediately or
delayed, whereas well releases typically have a short duration and, if igniting, it ignites
immediately.
Material Losses to Rig Caused by LOWC Events
Table 1.5 gives an overview of the installation damage related to LOWC events in the regulated
areas including the US GoM OCS 2000–2015.

Loss of Well Control Occurrence and Size Estimators, Phase I and II
Page 14
Table 1.5 Installation damage of LOWC events in regulated areas including US GoM OCS 2000–2015.
Main category
Consequence Class
Development drilling
Exploration drilling
Comp-letion
Work-over
Prod-uction
Wire-line
Abando-ned well
Un-known
Total
Deep Shallow Deep Shallow
Blowout (surface flow)
Total loss 1 1 1 1 4
Severe 1 1 2
Damage 1 1 1 3
Small 1 2 1 4
No 1 8 6 5 1 10 5 1 1 1 39
Unknown 1 1 2
Total 3 10 10 6 2 11 8 1 2 1 54
Blowout (underground flow)
No 1 2 3
Unknown 1 1
Total 1 3 4
Diverted well release
No 6 1 4 1 12
Total 6 1 4 1 12
Well release
Severe 1 1
Damage 1 1
Small 3 3
No 2 3 2 5 13 7 5 2 1 40
Unknown 1 1 2
Total 2 4 2 5 18 7 6 2 1 47
Total all 6 16 18 12 8 29 15 7 4 2 117
Most LOWC events lead to minor consequences for the installations. Four of the 117 events in
Table 1.5 are categorized as total loss after the LOWC event, and three are listed with severe
damage.
LOWC Causes
Equipment failures and human errors are frequently involved in LOWC events. Table 1.6
shows a summary of the causal factors.

Loss of Well Control Occurrence and Size Estimators, Phase I and II
Page 15
Table 1.6 LOWC causal factors summary
Type of operation
Primary barrier failure Distri-bution
Well kick observation Distri-bution
Gas handling Distri-bution
Shallow gas bottom fixed installation
Unexpected high well pressure
42 % Diverted, no problem 44 %
While cement setting 27 % Diverter failed or not in place 30 %
Other 31 % Other/unknown 24 %
Shallow gas floating installation
Unexpected high well pressure
42 % Subsea release 75 %
While cement setting 27 % Other/unknown 25 %
Other 31 %
Deep zone drilling floating
Primary barrier failure Well kick observation Secondary barrier (Blowout (surface Flow))
Loss of hydrostatic control 100%
Late kick observation 38 % BOP failed 50 %
In time kick observation 38 % Formation broke down 25 %
Unknown 24 % Poor cement 25 %
Deep zone drilling fixed
Primary barrier failure Late kick observation 38 % Wellhead area leak 33 %
Loss of hydrostatic control 100%
In time kick observation 38 % BOP not in place 22 %
Unknown 24 % BOP failed after closure 11 % Casing failed 11 % Other 22 %
Workover, killed wells
Primary barrier failure Well kick observation Secondary barrier (Blowout (surface Flow))
Unexpected high well pressure/too low mud weight
28 % Late kick observation 78 % Casing leak 27 %
Trapped gas 22 % In time kick observation 11 % Casing and tubing leaked 18 %
Swabbing, losses, unknown 22 % Unknown 11 % Casing and X-mas tree leaked 9 %
Well plug failure 11 % Wellhead failed 18 %
Tubing parted 6 % Kelly valve not available 18 %
Unknown 6 % Failed to close BOP 9 %
Workover, live wells
Primary barrier failure Secondary barrier (Blowout (surface Flow))
SCSSV /storm choke failure 36 % Casing leak 27 %
Tubing leakage/parted 36 % Casing and tubing leaked 18 %
Snubbing equipment failure 18 % Casing and X-mas tree leaked 9 %
Tubing plug failure 9 % Wellhead failed 18 % Kelly valve not available 18 % Failed to close BOP 9 %
Completion
Primary barrier failure Well kick observation Secondary barrier (Blowout (surface Flow))
Loss of hydrostatic control 100% Late kick observation 87 % Failed to close BOP 100 %
Unknown 13 %
Production
Primary barrier failure Secondary barrier (Blowout (surface Flow))
SCSSV failed 75% X-mas tree failed, external load 40%
Tubing leak 25% X-mas tree failed, wear and tear
30%
Casing/cement/formation 30%
Wireline Primary barrier failure Secondary barrier (Blowout (surface Flow))
Stuffing box/lubricator failure 100% Wireline BOP failure 50%
X-mas tree failed 50%
Shallow zone incidents typically occur due to unexpected high well pressure or while the
cement is setting. For a bottom fixed installation, most incidents are diverted without problems.
In some cases the diverter is not in place, because it has been nippled down.
For the deep zone drilling incidents, the well may kick for various reasons. Approximately 50%
of the kicks were detected late. For floating drilling blowout (surface flow) LOWC events, the
BOP failed to close in 50% of the incidents, and the formation and/or the cement failed for the
remaining. For bottom fixed drilling, leaks developed below the BOP in one third of the
incidents, and the BOP was nippled down for installing casing seals in 22% of the incidents.

Loss of Well Control Occurrence and Size Estimators, Phase I and II
Page 16
For workovers in killed wells, the kicks were caused by unexpected high pressure or trapped
gas in 50% of the incidents. The majority of kicks were observed late. For the workover LOWC
events in live wells, the SCCSV or tubing failed in 72% of the incidents. For more than 50%
of the incidents that resulted in a blowout (surface flow), a casing leak was involved.
Workovers are frequently performed in old wells. Equipment failures are therefore more likely
in these operations than in other well operations.
Nearly all kicks during completion that led to a LOWC event were detected late. A BOP failure
is typical involved in completion blowout (surface flow) LOWC events.
For a blowout (surface flow) LOWC to occur in a producing well it will most likely occur as a
combination of a failure in the X-mas tree or wellhead area and a SCSSV failure. The X-mas
tree may have a degradation or being destroyed by storm or another external force.
For a blowout (surface flow) LOWC to occur during a wireline operation a leak in sthe
lubricator or the stuffing box in combination with a wireline BOP failure seems to be the most
likely cause.
Humans are important in the occurrence and development of LOWC events, and human errors
have contributed to many of the LOWC events. Personnel skills and proper procedures and
practices are always important.
Well Kicks
In killed wells, all LOWC events start with a well kick. During the study an investigation of
the US GoM OCS kick occurrences in wells spudded in the period 2011–2015 was performed.
In this period, the frequency of kicks in the US GoM OCS was high compared to other
comparable areas.
Figure 1.1 gives an overview of kick data from various data sources.

Loss of Well Control Occurrence and Size Estimators, Phase I and II
Page 17
Figure 1.1 Overview of kick frequencies.
By comparing the US GoM OCS 2011–2015 kick frequency with the most recent statistics
from Norway and the UK, the kick frequency is significantly higher in the US GoM OCS.
Compared with the Norwegian kick frequency for 1984–1997, however, the kick frequency in
the US GoM OCS for development wells is in the same order of magnitude.
It is not known why the observed kick frequency in the US GoM OCS is so much higher than
the most recent data from UK and Norway. There may be several reasons, including:
1. UK and Norwegian data is based on well kicks reported to the authorities. The operators
may not report all the well kicks to the authorities.
2. Many US GoM wells are extremely deep and takes a long time to drill. This increases
the probability of having a kick due to the increased exposure time.
3. US GoM OCS may be a more complicated area to drill due to different formations.
Narrow margins between pore pressure and fracture gradient constitute a typical
problem that causes many kicks.
4. Some of the shallow water drilling in the US GoM OCS may be drilled with less
advanced instrumentation.
5. There may be different requirements for drilling personnel qualifications in the US
GoM OCS as compared to Norway and the UK.
6. The well control policies with respect to mud weight and casing program may be
different.
Comparison of US GoM OCS LOWC Frequencies vs. Other Regulated Areas
Table 1.7 and Table 1.8 compare the drilling LOWC event frequencies in the regulated areas
and the US GoM OCS.
0 0,1 0,2 0,3 0,4 0,5 0,6 0,7
Total all kicks and wells
US GoM OCS (2011 – 2015)
Norwegian wells drilled 2009 -2014
UK wells (1999-2008)
Canadian Beaufort wells deep (1973 - 1991)
Norwegian wells drilled 1984 -1997
US GoM OCS deepwater Wells drilled 2007 – 2009
US GoM OCS deepwater Well drilled 1997 - 1998
Canadian East Coast (1970 - 1993)
No. of kicks per well drilled
Overview of kick frequencies from various countries
Development wells Exploration wells

Loss of Well Control Occurrence and Size Estimators, Phase I and II
Page 18
Table 1.7 Development Drilling LOWC event frequency comparison US GoM OCS and regulated areas, 2000–2015.
Deep or shallow zone
Main category
Regulated area US/GOM OCS US GoM OCS vs.
Regulated areas
No. of LOWCs
No. of wells
drilled
LOWC frequency per
1000 wells drilled
No. of LOWCs
No. of wells
drilled
LOWC frequency per
1000 wells drilled
Deep
Blowout (surface flow) 1
8,156
0.12 2
6,288
0.32 2.59
Blowout (underground flow) 1 0.16 -
Diverted well release -
Well release 1 0.12 1 0.16 1.30
Total 2 0.25 4 0.64 2.59
Shallow
Blowout (surface flow) 3 0.37 7 1.11 3.03
Diverted well release 1 0.12 5 0.80 6.49
Well release -
Total 3 0.37 12 1.91 5.19
Total 6 0.74 16 2.54 3.46
Table 1.8 Exploration Drilling LOWC event frequency comparison between the US GoM OCS and the regulated areas, 2000–2015.
Deep or shallow zone
Main category
Regulated area US GoM OCS US GoM OCS vs.
Regulated areas
No. of LOWCs
No. of wells
drilled
LOWC frequency per
1000 wells drilled
No. of LOWCs
No. of wells
drilled
LOWC frequency per
1000 wells drilled
Deep
Blowout (surface flow) 1
3,998
0.25 9
3,971
2.27 9.06
Blowout (underground flow) 1 0.25 2 0.50 2.01
Diverted well release 1 0.25 -
Well release 2 0.50 2 0.50 1.01
Total 4 1.00 14 3.53 3.52
Shallow
Blowout (surface flow) 1 0.25 5 1.26 5.03
Diverted well release 1 0.25 3 0.76 3.02
Well release 2 0.50 -
Total 2 0.50 10 2.52 5.03
Total 6 1.50 24 6.04 4.03
Table 1.7 and Table 1.8 show that the total LOWC event frequency in the US GoM OCS is
significantly higher than in the comparable regulated areas for both development and
exploration drilling.
The LOWC event type with the highest risk is the blowout (surface flow) type incident. Nine
such events occurred in the US GoM OCS exploration wells and only one in the regulated
areas. Approximately the same number of wells were drilled in the US GoM OCS and the
regulated areas.
Table 1.9 compares the workover LOWC event frequencies in the UK and Norway, and the US
GoM OCS.

Loss of Well Control Occurrence and Size Estimators, Phase I and II
Page 19
Table 1.9 Workover LOWC event frequency comparison between US GoM OCS and UK and Norway, 2000–2015.
Main category
UK & Norwegian waters US GoM OCS US GoM OCS vs. Norway and UK
No. of LOWCs
Number of well years in
service
LOWC frequency per 10,000 well years in service
No. of LOWCs
Number of well years in
service
LOWC frequency per 10,000 well years in service
Blowout (surface flow) 1
47,683
0.21 9
77,843
1.16 5.51
Well release 4 0.84 12 1.54 1.84
Total 5 1.05 21 2.70 2.57
The LOWC event frequency during workovers is significantly higher in the US GoM OCS than
in in the Norwegian and UK waters combined, when measuring by the number of well years in
service.
The frequency of well workovers may be higher in the US GoM OCS due to in average older
wells that require more frequent workovers. In addition, many of the US GoM workovers have
been carried out in wells with poor barriers due to aging. Many of the workover LOWC events
occurred in wells that have been temporary abandoned for long periods.
Table 1.10 compares the completion LOWC event frequencies in the UK and Norway and the
US GoM OCS.
Table 1.10 Completion LOWC event frequency comparison between US GoM OCS and UK and Norway, 2000–2015.
Main category
UK & Norwegian waters US GoM OCS US GoM OCS vs. Norway and UK
No. of LOWCs
Number of well
completions
Frequency per 1000 wells completed
No. of LOWCs
Number of well
completions
Frequency per 1000 wells completed
Blowout (surface flow) 1
5,305
0,19 1
5,004
0,20 1.05
Diverted well release 1 0,20 -
Well release 4 0,75 1 0,20 0.27
Total 5 0,94 3 0,60 0.64
The LOWC event frequency during completion is lower in the US GoM OCS than in the
Norwegian and UK waters combined, when measured by the number of well completions
carried out. It should here be noted that the total number of completion LOWC events is low
such that the statistical uncertainty of this conclusion is high.
Table 1.11 compares the production LOWC event frequencies in the UK and Norway and the
US GoM OCS.
Table 1.11 Production LOWC frequency comparison US GoM OCS and UK and Norway, 2000–2015
Main category
UK & Norwegian waters US/GOM OCS
US GoM OCS vs. Norway and UK
No. of LOWCs
Number of well years in service
LOWC frequency per 10,000 well years in service
No. of LOWCs Number of well years in service
LOWC frequency per 10,000 well years in service
No external
load No external load
No external
load
External load
No external
load
External load
Total
Blowout (surface flow) 47,683
3 5
77,843
0.39 0.64 1.03 -
Well release 3 0.63 4 0.51 0.00 0.51 0.82
Total 3 0.63 7 5 0.90 0.64 1.54 2.45

Loss of Well Control Occurrence and Size Estimators, Phase I and II
Page 20
The LOWC event frequency during production is significantly higher in the US GoM OCS
than in in the Norwegian and UK waters combined, when measuring by the number of well
years in service.
Many of the LOWC events in the US GoM OCS are caused by external causes as storm, and
collisions. These types of LOWCs are not observed in the Norwegian and UK waters. The
strong hurricanes and the small shallow water installations causes these types of events. If
disregarding these events the LOWC frequencies becomes more similar.
Table 1.12 compares the wireline LOWC event frequencies in the UK and Norway and the US
GoM OCS.
Table 1.12 Wireline LOWC frequency comparison US GoM OCS and UK and Norway, 2000–2015
Main category
UK & Norwegian waters US GoM OCS US GoM OCS vs. Norway and UK
No. of LOWCs
Number of well years in
service
LOWC frequency per 10,000 well years in service
No. of LOWCs
Number of well years in
service
LOWC frequency per 10,000 well years in service
Blowout (surface flow) 1
47,683
0.21
77,843
Well release 3 0.63 3 0.39 0.61
Total 4 0.84 3 0.39 0.46
The LOWC event frequency during wireline is lower in the US GoM OCS than in in the
Norwegian and UK waters combined, when measuring by the number of well years in service.
There are relatively few wireline LOWC events in the database..
LOWC Risk
Figure 1.2 shows a pie chart with the estimated contribution from the various phases of
operation to the large spill probability based on a 2015 activity level.

Loss of Well Control Occurrence and Size Estimators, Phase I and II
Page 21
Figure 1.2 The contributors to the large spill probability.
Should there be a large spill caused by a LOWC event, the risk analysis indicates that with
around a 40% probability, it will occur during exploration drilling from a floater. The
proportion from a producing well is close to 30%, and from a workover event is around 20%.
If there should occur a large spill during production it is likely to be caused by an external load
as a hurricane.
It can be expected that 3.5% of the LOWC events will result in a total loss of the installation.
With the estimated number of LOWC events for a five-year period in the US GoM OCS, there
is a 46% probability that a total loss incident shall occur in a five-year period. Most LOWC
events cause no or minor damages to the installation.
There are few LOWC events with fatalities. Occasionally a LOWC may cause several fatalities.
Based on the average numbers, one to two fatalities caused by LOWC events can be expected
in a five-year period in the US GoM OCS.
One LOWC event can be expected to ignite in a five-year period.
LOWC Risk Reduction Discussion
The main contributors to the risk are the blowout (surface flow) accidents. These incidents have
the largest accident potential with respect to fires, loss of lives, spill to the surroundings, and
damage to material assets.
In general, by reducing the kick frequency the LOWC event frequency will be reduced. The
kick frequencies in the US GoM OCS are high, as shown in Figure 1.1, page 17. A reduction
of the kick frequency will reduce the LOWC event frequency. If assuming that a kick frequency
reduction of 50% in drilling operations will reduce the LOWC event frequency in drilling with
50%, the total risk for the US GoM OCS will be reduced.
Table 1.13 shows the effect of reducing the drilling kick frequency with 50% when assuming
a five-year period with an annual activity levels as in 2015.
3%
41%
8%
20%
2%
29%
0%Contributors to large spill probability
Exploration drilling from bottom fixed installation
Exploration drilling from floating vessel
Development drilling floating or bottom fixed installation
Workover
Completion
Production
Wireline

Loss of Well Control Occurrence and Size Estimators, Phase I and II
Page 22
Table 1.13 Sensitivity analysis, effect of reducing of drilling kick frequency with 50%
Activity type
Risk results
No. of LOWCs to
expect
No. of ignited
events to expect
No. of fatalities to expect
Material damages Large spill probability
Total Loss
Severe Damage Small-/no
Exploration drilling from bottom fixed installation
0.075 0.007 0.011 0.0035 0.0018 0.0027 0.0665 0.0026
Exploration drilling from floating vessel
1.509 0.138 0.181 0.0559 0.0408 0.0547 1.3578 0.0367
Development drilling floating or bottom fixed installation
0.688 0.059 0.087 0.0287 0.0153 0.0224 0.6218 0.0070
Workover 4.559 0.401 0.490 0.1447 0.1278 0.1640 4.1227 0.0352
Completion 0.264 0.017 0.021 0.0065 0.0051 0.0068 0.2454 0.0040
Production 2.605 0.294 0.404 0.1287 0.0828 0.1150 2.2788 0.0521
Wireline 0.651 0.028 0.014 0.0000 0.0139 0.0139 0.6236 0.0000
Total risk with 50% reduced kick frequency drilling events
10.351 0.944 1.208 0.368 0.287 0.379 9.317 0.138
Result from Base Case Table 17.14
12.62 1.15 1.49 0.46 0.34 0.46 11.36 0.18
Risk reduction compared to base case
18.0 % 17.9 % 18.9 % 20.0 % 15.6 % 17.6 % 18.0 % 23.3 %
Table 1.13 shows that by reducing the drilling kick frequency the total LOWC risk in the US
GoM OCS risk will be reduced with around 20%.
Another important factor with respect to drilling LOWC events is the kick detection. For
approximately 50% of the deep zone drilling LOWC events, the kick was not observed before
the well was flowing to the surroundings. If these kicks had been observed in time, the LOWC
events would most likely not have occurred.
For most of the well completion kicks and the workover kicks in killed wells, late kick detection
is a common factor.
Efforts to improve the kick detection during drilling, completion, and workover activities will
in most cases give a corresponding reduction in the LOWC event frequency.
For workovers, it is especially important to be prepared that the barrier situation and the
pressures in the well that shall be worked over may be different than expected.
The highest risk contribution from producing wells stems from LOWC incidents caused by
hurricanes. When a hurricane damages the topside barriers, the quality of the downhole barriers
as tubing, packer, and SCSSV is important.
Wireline incidents have a small impact on the total risk because there were few events and the
events normally have small consequences..
The abandoned wells have not been included in the risk model, and the risk is difficult to
quantify. In the period 2000–2015, LOWC events from these well types did not cause any
significant damage. The number of temporary abandoned wells in the whole world is large.
Many of these wells have been temporary abandoned for many years. The risk related to LOWC
events from the temporary abandoned wells will increase unless a significant effort is put in to
permanently plug and abandon these wells.

Loss of Well Control Occurrence and Size Estimators, Phase I and II
Page 23
PREFACE The evaluation, analysis and calculations performed are based on a number of assumptions,
limitations, and definitions of system and environmental boundaries, all of which are stated
further in the report or in its references. ExproSoft will accept no liability for conclusions being
made by readers of the report. Caution should always be taken when using the results from this
report further, so that decisions are not made on an erroneous basis.

Loss of Well Control Occurrence and Size Estimators, Phase I and II
Page 24
INTRODUCTION
Based on BSEE Broad Agency Announcement (BAA) Number: E15PS00092, ExproSoft
submitted a White Paper with the Title “Loss of Well Control Occurrence and Size Estimators”.
In June 2015, ExproSoft received a request for proposal (E15PS00092), and in July 2015
Exprosoft submitted a proposal to BSEE.
Exprosoft was awarded the contract in September 2015, and the Phase I of the work was kicked
off on September 30, 2015
The Phase I objective was to update offshore loss of well control (LOWC) frequency
information for the period 2006-2014 for the US Gulf of Mexico and Pacific OCS, North Sea,
Canada, Brazil, and Australian offshore regions and other areas with a comparable regulatory
regime. When working with the Phase I the period was extended to 2000–2014 to get a more
comprehensive data set to evaluate.
The Project has had the following main activities:
Activity 1: Qualify loss of well control in accordance with 30 CFR 250.188(a) (3) definition
Activity 2: Group the loss of well control occurrences
Activity 3: Determine for each loss of well control if, when, and how the flow was stopped
Activity 4: Statistical analysis of the LOWC data categories
Activity 5: Causal analysis
Activity 6: Coherent risk evaluation methodology
Activity 7: Analysis and reporting
The work with Phase II of the project was started in October 2016. The Phase II objective has
been to update offshore loss of well control frequency information for the period 2015, and
merge the results with the Phase I results. Further, the LOWC incidents experienced during the
production phase and wireline operations for the period 2000 – 2015 have been added and
analyzed.
In Phase II of the project 39 new LOWC events were added to the LOWC experience, so the
total number of LOWCs increased from 117 to 156. They were; one shallow gas incident during
development drilling, one abandoned well incident, 26 production incidents, seven wireline
incidents, and four incidents where the operational phase is unknown.
This report includes all information from the previous Phase I report, in addition to the
information added in association with the Phase II work. This report therefore overrides the
previous Phase I report. This report is the combined final report from Phase I and Phase II.

Loss of Well Control Occurrence and Size Estimators, Phase I and II
Page 25
MAIN CHANGES FROM PHASE I REPORT
The main changes in this report vs. the Phase I report are:
Three new sections have been included:
Section 9, Production LOWC Events, page 94
Section 10, Wireline LOWC Events, page 108
Section 12, Unknown Phase LOWC Events, page 113
Further, the reference period from 2000 – 2014 to 2000 – 2015, so all the tables in Section 2
Exposure Data, page 33, has been changed.
Because the exposure data has been changed all tables and figures in the report where LOWC
frequencies are included has been updated.
Section 4, Overview of LOWC Data, page 41, has been updated to include the 39 added
LOWCs in this report.
Changes have been performed to reflect the 39 added LOWCs in the following sections:
Section 13, LOWC Characteristics, page 114
Section 14, LOWC Consequences, page 131
Section 15, LOWC Causal Factors, page 142
Section 16, Well kick experience, page 160, has been updated with the additional sub section
Annualized Kick Frequencies, page 172.
Section 17, LOWC Risk Analysis, page 179, has been updated with the new phases of
operations, updated frequencies for all phases of operation and the year 2015 have been used
as a reference for future activity level.
No major changes has been done in the following sections:
Section 5, Shallow Zone Drilling LOWC events, page 47
Section 6, Deep Zone drilling LOWC Events, page 55
Section 7, Workover LOWC Events, page 70
Section 8, Completion LOWC events, page 86
Section 11, Abandoned Well LOWC Events, page 111

Loss of Well Control Occurrence and Size Estimators, Phase I and II
Page 26
MAIN DATA SOURCE FOR LOWC DATA
The main data source for the LOWC data has been the SINTEF Offshore Blowout Database
[7]. The SINTEF Offshore Blowout Database was initiated in 1984.
By December 2016, the following companies were sponsoring the database:
1. Statoil
2. Aker BP ASA
3. Safetec Nordic A/S
4. Total E&P Norge AS
5. Lloyd's Register Consulting
6. Shell Global Solutions International
7. DNV GL AS
8. Lilleaker Consulting a.s.
9. Eni Norge AS
10. ConocoPhillips Norge
11. Acona Flow Technology AS
12. Proactima
13. Maersk Drilling
14. Akvaplan-niva as
1.1 DATABASE STRUCTURE
1.1.1 INCIDENT CATEGORY AND SUB-CATEGORY
The following main definitions have been utilized when categorizing the blowouts/well
releases in categories and sub-categories.
Blowout definition
NPD came up with a blowout definition in their proposal for the new regulations.
(“Aktivitetsforskriften, eksternt høringsutkast av 3.7.2000, høringsfrist 3.11.2000”);
A blowout is an incident where formation fluid flows out of the well or between formation
layers after all the predefined technical well barriers or the activation of the same have failed.
The definition has however not become a part of the final new NPD regulation, but remains the
database blowout definition.
Well release definition: The reported incident is a well release if oil or gas flowed from the
well from some point were flow was not intended and the flow was stopped by use of the barrier
system that was available on the well at the time the incident started.
The current BSEE definition for Loss of Well Control means [11]:
Uncontrolled flow of formation or other fluids. The flow may be to an exposed
formation (an underground blowout) or at the surface (a surface blowout).

Loss of Well Control Occurrence and Size Estimators, Phase I and II
Page 27
Flow through a diverter
Uncontrolled flow resulting from a failure of surface equipment or procedures
Shallow gas definition: Any gas zone penetrated before the BOP has been installed. Any zone
penetrated after the BOP is installed is not shallow gas (typical Norwegian definition of shallow
gas).
All shallow gas incidents in the database have at the extent possible been categorized according
to the typical Norwegian definition of shallow gas.
The IADC Lexicon [22] define shallow gas as; Gas pockets or entrapped gas below
impermeable layers at shallow depth.
For many of the incidents the description of the incident in the source is insufficient, and some
assumptions have to be made.
The categories and subcategories utilized when classifying the incidents in the SINTEF
Offshore Blowout Database are shown in Table 1.1.
The SINTEF database categorizes the incidents in blowouts and well releases. All the incidents
fall in the category LOWC that are used by BSEE.
Table 1.1 Main categories and subcategories for the LOWC incidents in the SINTEF Offshore Blowout database
Main Category Sub category Comments/Example
Blowout and well release
Blowout (surface flow)
1. Totally uncontrolled flow, from a deep zone
Totally uncontrolled incidents with surface/subsea flow.
2. Totally uncontrolled flow, from a shallow zone
Typically the diverter system fails
3. Shallow gas “controlled” subsea release only
Typical incident for e.g. riserless drilling is performed when the well starts to flow. The rig is pulled away
Blowout (underground flow)
4. Underground flow only
5. Underground flow mainly, limited surface flow
The limited surface flow will be incidents where a minor flow has appeared, and typically the BOP has been activated to shut the surface flow
Well release
6. Limited surface flow before the secondary barrier was activated
Typical incident will be with flow through the drill pipe and the shear ram is activated
7. Tubing blown out of well, then the secondary barrier is activated
Typical incident occurring during completion or workover. Shear ram is used to close the well after the tubing has been blown out of the well.
Diverted well release
8. Shallow gas controlled flow (diverted)
All incidents where the diverter system functioned as intended.
Unknown Unknown Unknown may be selected for both the category and the subcategory
1.1.2 BLOWOUT/WELL RELEASE DESCRIPTIONS
The database contains 51 different fields describing each blowout/well release. The various
fields are grouped in six different groups. They are:

Loss of Well Control Occurrence and Size Estimators, Phase I and II
Page 28
1. Category and location
2. Well description
3. Present operation
4. Blowout causes
5. Blowout Characteristics
6. Other
Category and location
Includes information related to the incident category (blowout vs. well release), offshore
installation such as location, operator, installation name and type, and water depth.
Well description
Includes well and casing depths, last casing size, mud weight, bottom hole- and shut in pressure,
GOR, formation age and rock type.
Present operation
Includes the phase (exploration drilling, development drilling, workover etc.), the operation
presently carried out (for example casing running) and the present activity (for example
cementing).
Blowout causes
Include external cause (stating if an external cause contributed to the incident), loss of the
primary barrier, loss of the secondary barrier (describing how primary and secondary barrier
were lost) and human error. It should be noted that the field regarding human error in general
holds low quality information. Human errors are frequently masked. A field named North Sea
requirements highlights if the development of the blowout could have been avoided if North
Sea type equipment had been used (for instance in other parts of the world a blind-shear ram is
not required in surface BOP stacks).
Blowout characteristics
Twelve fields are included comprising flow-path, flow medium, flow-rate (low quality), release
point, ignition type, time to ignition, lost production (low quality), duration, fatalities,
consequence class, material loss and pollution.
Other
In the Other group, five fields are included. They are control method, remarks (includes a
description of the incident), data quality (includes an evaluation of the source data quality), last
revision date, and references.
1.1.3 EXPOSURE DATA
The various areas represented with exposure data area shown in Table 1.2.

Loss of Well Control Occurrence and Size Estimators, Phase I and II
Page 29
Table 1.2 Overview of exposure data included in the database
Country Drilling exposure data Production exposure data
US GoM OCS Yes Yes
Norway Yes Yes
United Kingdom Yes Yes
The Netherlands Yes No
Canada East Coast Yes No
Australia Yes No
US Pacific Yes Yes
Denmark Yes No
The exposure data for drilling is number of wells drilled each year within the various categories.
Exposure data during production is presented as number of well years in service.
The format of the exposure data varies between the different areas because the various sources
present the exposure data differently.
1.2 PHASE OF OPERATION
Each of the blowout/well releases in the database is categorized in the phase of operation they
occurred. The various phases are selected to avoid comparing blowout causes, frequencies, and
consequences in which there are important differences. The distinction between various phases
is important when working with risk analyses and/or evaluating risk-reducing measures. One
of the main criteria for grouping blowouts according to main operational phases is the blowout
barriers present during the various phases. Other criteria are format of exposure data and
differences in frequencies experienced in the various phases. Table 1.3 shows the phases of
operation used in the database.
Table 1.3 Phase of operation
Description Remarks
Exploration drilling Exploration drilling, includes wildcats and appraisal wells
Development drilling Development drilling
Unknown drilling When it is not known whether it is development drilling or exploration drilling
Completion Activities associated to well completion activities
Production Production, injection, closed in wells
Workover Workover activities, not including wireline operations
Wireline Wireline operations in connection with a production/injection well, not wireline operations carried out as a part of well drilling, well completion or well workover
Abandoned well Wells that have been permanently or temporary abandoned or have been plugged for a long period
Unknown Unknown
Exploration drilling is drilling to find hydrocarbons or to determine the extent of a field. When
this drilling takes place the knowledge of the geology and formation is relatively low compared
with development drilling.
Development drilling is drilling of production or injection wells. The knowledge of the
formation is higher than for exploration drilling.
In principle, drilling a development well is identical to drilling an exploration well.
Nevertheless, mainly due to the increased reservoir knowledge, the historical blowout
Loss of Well Control Occurrence and Size Estimators, Phase I and II
Page 30
frequency for development drilling is lower than it is for exploration drilling. This is the main
reason for making a distinction between development and exploration drilling.
Shallow gas blowouts occur when drilling at shallow depths, and closing in the well with a
blowout preventer (BOP) is impossible due to inadequate formation strength, i.e., it is a single
barrier situation. The single barrier is the hydrostatic pressure from the mud column. “Deep”
blowouts obviously occur deeper than shallow gas blowouts. Normally the BOP, the casing,
and the formation are the secondary barriers, in addition to the hydrostatic pressure from the
mud column, which is the primary barrier.
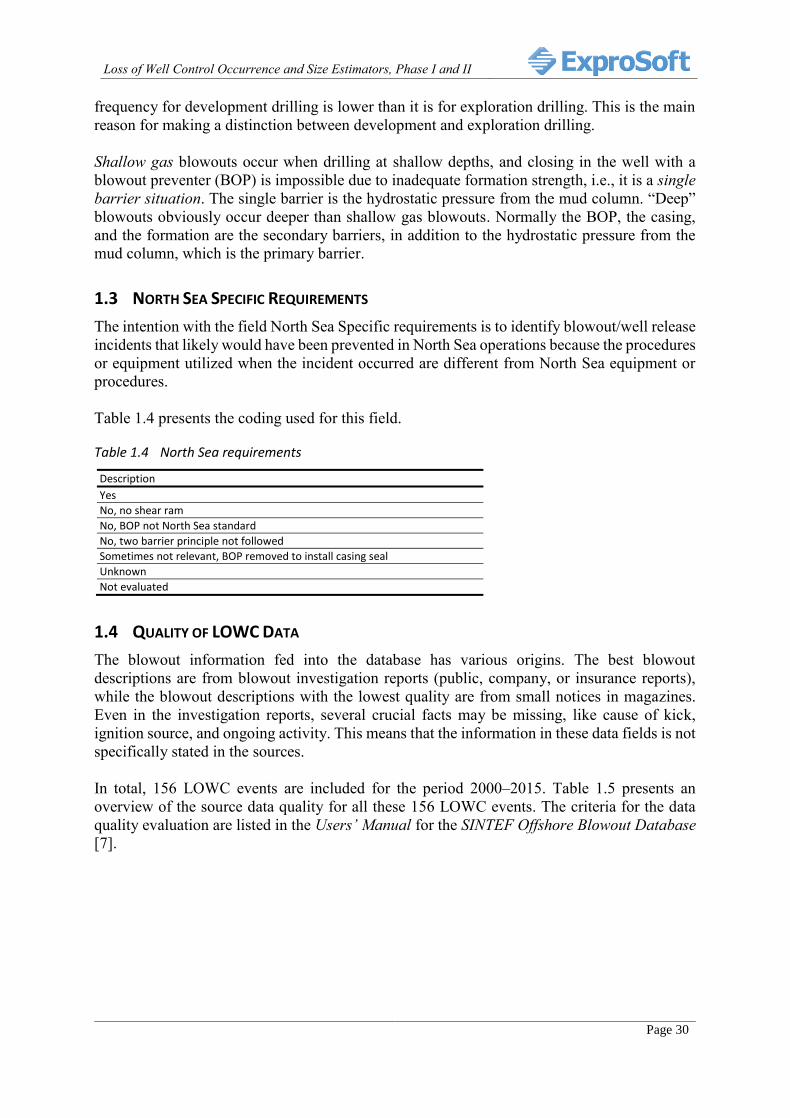
1.3 NORTH SEA SPECIFIC REQUIREMENTS
The intention with the field North Sea Specific requirements is to identify blowout/well release
incidents that likely would have been prevented in North Sea operations because the procedures
or equipment utilized when the incident occurred are different from North Sea equipment or
procedures.
Table 1.4 presents the coding used for this field.
Table 1.4 North Sea requirements
Description
Yes
No, no shear ram
No, BOP not North Sea standard
No, two barrier principle not followed
Sometimes not relevant, BOP removed to install casing seal
Unknown
Not evaluated
1.4 QUALITY OF LOWC DATA
The blowout information fed into the database has various origins. The best blowout
descriptions are from blowout investigation reports (public, company, or insurance reports),
while the blowout descriptions with the lowest quality are from small notices in magazines.
Even in the investigation reports, several crucial facts may be missing, like cause of kick,
ignition source, and ongoing activity. This means that the information in these data fields is not
specifically stated in the sources.
In total, 156 LOWC events are included for the period 2000–2015. Table 1.5 presents an
overview of the source data quality for all these 156 LOWC events. The criteria for the data
quality evaluation are listed in the Users’ Manual for the SINTEF Offshore Blowout Database
[7].

Loss of Well Control Occurrence and Size Estimators, Phase I and II
Page 31
Table 1.5 Quality of the source data in the SINTEF Offshore Blowout Database (2000–2015)
Area2 Data Quality Very good Good Fair Low Very low Total
US GoM OCS 27 18 20 11 6 82
32.9 % 22.0 % 24.4 % 13.4 % 7.3 %
Regulated area
UK & Norwegian waters 2 3 5 12 4 26
7.7 % 11.5 % 19.2 % 46.2 % 15.4 %
The Netherlands, Canada East Coast, Australia, US Pacific OCS, Denmark, and Brazil
3 1 1 3 1 9
33.3 % 11.1 % 11.1 % 33.3 % 11.1 %
Rest of the World 1 4 3 11 20 39
2.6 % 10.3 % 7.7 % 28.2 % 51.3 %
Total 33 26 29 37 31 156
21.2 % 16.7 % 18.6 % 23.7 % 19.9 %
Eighty-two LOWC events are reported in the US GoM OCS, 26 in the UK and Norway, nine
come from other regulated areas, and the remaining 39 from the rest of the world.
Table 1.5 shows that the best quality source information data comes from the US GoM OCS.
In general, the oil business would benefit if companies were more open about why blowouts
occurred. Identifying means to reduce the blowout probability would then be easier. However,
it is the author’s opinion that oil companies and drilling contractors dislike that their blowouts
become publicly known, because this leads to a bad reputation that may hurt the business.
Further, the people directly involved in the well operations when control was lost frequently
mask their own and their colleagues’ mistakes for various reasons. They may, for example, be
afraid of losing their jobs, reducing their further career prospects, or being prosecuted after the
incident. These are well-known phenomena from all types of accidents, and have negative
influences on future accident prevention.
In general, identifying LOWC events that have occurred in the US GoM OCS is easier than
identifying those in Norway and the UK. This is because in the US GoM OCS all offshore
incidents must be reported to BSEE (Former MMS). BSEE stores this information, and
provides access to the public. Furthermore, BSEE also releases public investigation reports
more often. Short descriptions of the incidents may be downloaded from the BSEE homepage.
LOWC events in Norway and UK are identified from information coming from HSE and PSA,
press releases, newspapers, magazine articles, etc. The key LOWC information cannot be found
in place. Most oil companies worldwide are reluctant to distribute internal documents regarding
the various blowouts.
The SINTEF Offshore Blowout Database covers most of the blowouts in the UK waters,
Norwegian waters, and the US GoM OCS, but several blowouts from other parts of the world
are believed to be missing. Blowouts not included from Norway, UK and the US GoM are
2 The following areas of operations are used in the report;
US GoM OCS
Regulated area include: UK, Norway, Netherlands, Canada East Coast, Australia, US Pacific
OCS, Denmark and Brazil Rest of the world: All countries/areas not mentioned above

Loss of Well Control Occurrence and Size Estimators, Phase I and II
Page 32
typically blowouts that have never been reported other than in internal company files. It is likely
that several underground blowouts have never been reported. Further, it is likely that some
shallow gas blowouts and other minor blowouts are not included, because they have not been
reported in any public sources.
When using the blowout database, it is always important to bear in mind that the quality of
blowout data is highly variable.

Loss of Well Control Occurrence and Size Estimators, Phase I and II
Page 33
EXPOSURE DATA
2.1 EXPOSURE DATA FOR US GOM OCS, UK AND NORWAY
Table 2.1 shows overall number of wells drilled, as listed in the SINTEF Offshore Blowout
Database, for the UK waters, Norwegian waters, and the US GoM OCS.
Table 2.1 Wells drilled in the US GoM OCS, UK and Norwegian waters (2000–2015)
Year US GoM OCS UK Norway Total
Exploration Development Exploration Development. Exploration Development. Exploration Development.
2000 441 940 61 225 27 188 529 1,353
2001 411 851 59 286 39 201 509 1,338
2002 309 634 45 260 22 168 376 1,062
2003 354 541 45 207 26 165 425 913
2004 363 553 64 167 17 139 444 859
2005 355 457 78 228 14 150 447 835
2006 413 359 70 202 28 149 511 710
2007 301 316 111 165 32 153 444 634
2008 267 299 105 170 56 138 428 607
2009 147 174 64 131 66 163 277 468
2010 80 174 62 130 46 127 188 431
2011 81 186 42 122 52 125 175 433
2012 123 236 53 122 43 130 219 488
2013 117 237 44 120 59 166 220 523
2014 107 223 32 126 57 162 196 511
2015 102 108 33 131 56 189 191 428
Total 3,971 6,288 968 2,792 640 2,513 5,579 11,593
Approximately 61% of the total number of wells drilled have been drilled in the US GoM OCS,
22% offshore UK, and the remaining 17% offshore Norway.
Figure 2.1 shows the annual drilling trend for US GoM OCS, UK, and Norway.
Figure 2.1 Drilling trend
0
200
400
600
800
1000
2000 2001 2002 2003 2004 2005 2006 2007 2008 2009 2010 2011 2012 2013 2014 2015
No
. of
wel
ls d
rille
d
Year
Drilling activity 2000 - 2015, US GoM OCS, UK, and NorwayUS GoM OCS Exploration
US GoM OCS Development
UK Exploration
UK Development.
Norway Exploration
Norway Development.

Loss of Well Control Occurrence and Size Estimators, Phase I and II
Page 34
There has been a decline in drilling during the period 2000–2015. The largest relative decline
is in the US GoM OCS, while in Norway the drilling activity has been fairly stable over the
period.
Table 2.2 shows completed wells, as listed in the SINTEF Offshore Blowout Database, for the
UK waters, Norwegian waters, and the US GoM OCS.
Table 2.2 Completed wells in the US GoM OCS, UK and Norwegian waters 2000–2015 [7]
Spud year US GoM OCS
UK Norway Total
2000 805 225 188 1218
2001 654 286 201 1141
2002 449 260 168 877
2003 423 207 165 795
2004 454 167 139 760
2005 360 228 150 738
2006 365 202 149 716
2007 288 165 153 606
2008 259 170 138 567
2009 145 131 163 439
2010 135 130 127 392
2011 136 122 125 383
2012 148 122 130 400
2013 132 120 166 418
2014 163 126 162 451
2015 88 131 189 408
Total 5,004 2,792 2,513 10,309
Approximately 49 % of the total number of completed wells is from the US GoM OCS, 27%
from UK and the remaining 23% from Norway.
Table 2.3 shows active production and injection wells, as listed in the SINTEF Offshore
Blowout Database, for the UK waters, Norwegian waters, and the US GoM OCS.

Loss of Well Control Occurrence and Size Estimators, Phase I and II
Page 35
Table 2.3 Active production and injection wells in the US GoM OCS, UK and Norwegian waters 2000–2015 [7]
Year
US GoM OCS United Kingdom Norway Total
Production wells Inje-ction wells
Production wells Inject-ion
wells
Production wells Inje-ction wells
Production wells Inject-ion
wells Oil
Gas/-cond
Total Oil Gas/- cond
Total Oil Gas/-cond
Total Oil Gas/-cond
Total
2000 3,313 3,308 6,621 291 1,027 784 1,769 382 787 110 897 259 5,127 4,160 9,287 932
2001 3,239 3,217 6,456 259 953 740 1,676 382 813 116 929 266 5,005 4,056 9,061 907
2002 3,109 2,993 6,102 234 943 618 1,649 382 820 133 953 257 4,872 3,832 8,704 873
2003 3,086 3,043 6,129 235 867 643 1,566 382 849 127 976 261 4,802 3,869 8,671 878
2004 2,599 2,804 5,403 234 777 586 1,432 382 848 129 977 264 4,224 3,589 7,812 880
2005 1,505 1,977 3,482 210 685 538 1,289 382 831 123 954 269 3,021 2,704 5,725 861
2006 2,323 2,457 4,780 216 622 453 1,170 382 863 133 996 278 3,808 3,138 6,946 876
2007 2,691 2,597 5,288 202 624 429 1,122 382 886 141 1027 282 4,201 3,235 7,437 866
2008 1,860 1,560 3,420 198 583 430 1,068 382 910 150 1,060 285 3,353 2,194 5,548 865
2009 2,429 2,005 4,434 173 556 346 964 382 1,078 165 1,243 317 4,063 2,577 6,641 872
2010 2,462 1,875 4,337 154 519 362 905 382 1,123 170 1,293 317 4,104 2,431 6,535 853
2011 2,560 1,614 4,174 121 433 279 743 382 1,099 178 1,277 346 4,092 2,102 6,194 849
2012 2,471 1,398 3,869 108 373 292 640 382 1,201 196 1,397 367 4,045 1,862 5,906 857
2013 2,466 1,154 3,620 97 336 273 583 382 1,302 215 1,517 389 4,104 1,616 5,720 868
2014 2,481 1,042 3,523 93 326 264 575 382 1,404 231 1,635 410 4,211 1,522 5,733 885
2015 2,454 835 3,289 91 388 257 645 382 1,485 173 1,658 419 4,327 1,265 5,592 892
Total 41,048 33,879 74,927 2,916 10,012 7,294 17,796 6,112 16,299 2,490 18,789 4,986 67,359 44,152 111,512 14,014
Approximately 68 % of the total number of active wells comes from the US GoM OCS, 16%
from UK and the remaining 16% from Norway.
2.2 DRILLING EXPOSURE DATA FROM VARIOUS COUNTRIES
The SINTEF Offshore Blowout Database [7] includes drilling exposure data from other areas.
These are offshore wells in the Netherlands, Canada East Coast, Australia, US Pacific OCS,
Denmark and Brazil.
Table 2.4 shows overall number of wells drilled, as listed in the SINTEF Offshore Blowout
Database, in the Netherlands, Canada East Coast, Australia, US Pacific OCS, Denmark, and
Brazil.

Loss of Well Control Occurrence and Size Estimators, Phase I and II
Page 36
Table 2.4 Wells drilled in the other regulated areas (Netherlands, Canada East Coast, Australia, US Pacific OCS, Denmark, and Brazil)
Year Dutch Canada E. Coast Australia US Pacific OCS Denmark Brazil Total
Expl. Dev. Expl. Dev. Expl. Dev. Expl. Dev. Expl. Dev. Expl. Dev. Expl. Dev.
2000 12 9 12 38 70 31 0 13 17 11 41 65 152 167
2001 19 12 6 20 60 32 0 16 17 26 99 77 201 183
2002 19 13 8 33 57 47 0 21 9 25 83 63 176 202
2003 11 13 9 31 79 39 0 18 11 23 92 56 202 180
2004 13 6 2 33 61 49 0 20 10 15 80 50 166 173
2005 5 8 7 33 80 52 0 23 4 11 53 59 149 186
2006 12 16 13 25 66 59 0 17 4 18 59 63 154 198
2007 7 12 4 14 72 63 0 12 4 15 58 58 145 174
2008 11 13 3 13 92 111 0 5 7 11 58 58 171 211
2009 10 11 2 15 83 75 0 7 2 14 61 75 158 197
2010 9 12 9 13 62 56 0 8 2 7 83 82 165 178
2011 9 15 8 8 46 26 0 3 3 5 110 76 176 133
2012 9 11 2 8 36 53 0 8 2 3 90 99 139 182
2013 6 10 5 12 23 43 0 5 3 5 45 107 82 182
2014 13 11 3 10 31 40 0 1 6 5 42 99 95 166
2015 12 11 7 3 13 46 0 1 1 12 26 66 59 139
Total 177 183 100 309 931 822 0 178 102 206 1,080 1,153 2,390 2,851
There are no production exposure data from these areas in the SINTEF Offshore Blowout
Database, except for US Pacific OCS.
2.3 WATER DEPTH RELATED DRILLING EXPOSURE US GOM OCS
Table 2.5 presents the water depth specific number of exploration and development wells
drilled in the US GoM OCS, 2000–2015.

Loss of Well Control Occurrence and Size Estimators, Phase I and II
Page 37
Table 2.5 Exploration and development wells drilled in the US GoM OCS vs. water depth 2000–2015
Well type Spud
year
Number of wells drilled within water depth range (m)
<50 50- 100
100- 200
200- 400
400- 600
600- 1,000
1,000-1,500
1,500- 2,000
2,000- 2,500
2,500- 3,000
>3,000 Total
Devel-opment wells
2000 446 302 48 42 8 24 60 9 1 940
2001 417 225 69 35 17 23 36 23 6 851
2002 303 146 22 35 9 24 76 11 9 635
2003 308 90 33 20 8 18 49 12 1 2 541
2004 329 105 33 15 8 15 13 16 19 553
2005 244 135 21 12 14 19 10 1 1 457
2006 202 73 17 9 8 6 36 6 2 359
2007 153 71 28 3 6 13 10 7 25 316
2008 154 73 41 3 10 15 3 299
2009 67 33 19 3 12 22 6 11 1 174
2010 88 52 8 5 1 7 6 3 2 2 174
2011 93 62 6 5 3 2 13 2 1 187
2012 113 67 4 3 14 21 9 4 1 236
2013 103 75 8 7 11 18 6 7 2 237
2014 92 70 5 5 8 14 19 7 2 1 223
2015 32 36 3 5 1 5 13 4 9 108
Total 3,144 1,615 365 191 107 217 417 122 99 13 6,290
Explor-ation wells
2000 215 91 18 9 12 34 34 9 17 2 441
2001 167 56 26 18 7 39 55 24 16 3 411
2002 149 48 8 7 12 23 25 17 17 3 309
2003 176 62 17 9 8 19 29 21 6 6 1 354
2004 174 45 18 19 8 22 27 21 17 12 363
2005 179 47 15 9 7 27 38 17 10 6 355
2006 217 47 15 11 11 30 40 22 19 1 413
2007 123 56 6 3 8 41 28 21 14 1 301
2008 120 26 12 5 2 23 37 22 16 3 2 268
2009 52 7 3 2 1 18 25 20 19 147
2010 33 7 2 1 9 12 6 9 1 80
2011 18 5 4 13 16 8 15 1 80
2012 19 12 1 3 28 13 29 16 2 123
2013 28 9 1 2 9 17 29 17 5 117
2014 19 8 1 1 2 2 27 31 9 7 107
2015 2 4 3 41 39 10 4 103
Total 1,689 528 147 96 85 340 464 336 227 57 3 3,972
Total all wells 4,833 2,143 512 287 192 557 881 458 326 70 3 10,262
2.4 DRILLING EXPOSURE SUBSEA VS. SURFACE BOPS US GOM OCS
Information about the type of drilling installation type used cannot be deduced from [8].
However, BSEE publish APDs (Application for Permit to Drill) as a part of their public eWell
reporting system [10]. In these APDs, the drilling installation types planned to be used and the
water depths are listed. Based on the drilling installation type the BOP type to be used for the
drilling can be deducted. This information has been combined with the BOEM Borehole file
[8] to establish an estimated overview of the number of wells drilled with surface and subsea
BOPs. The key field used is the water depth.
Table 2.6 shows the estimated number of wells drilled with surface and subsea BOPs vs. water
depth for exploration and development wells (US GoM OCS, 2000–2015).

Loss of Well Control Occurrence and Size Estimators, Phase I and II
Page 38
Table 2.6 Estimated number of wells drilled with subsea vs. surface BOPs, US GoM OCS 2000–2015
Type of drilling
BOP type
Water depth grouped (m)
< 50 50 - 100
100 - 200
200 - 400
400 - 600
600 - 1,000
1,000 - 1,500
1,500 - 2,000
2,000 - 2,500
2,500 - 3,000
>3,000 Total Distri-bution
Devel-opment
Subsea 8 0 10 24 46 113 265 107 99 13 0 684 10.9 %
Surface 3,136 1,615 355 167 61 104 152 15 0 0 0 5,606 89.1 %
Total 3,144 1,615 365 191 107 217 417 122 99 13 6,290 100.0 %
Explor-ation
Subsea 0 0 72 96 80 316 438 334 227 57 3 1,622 40.8 %
Surface 1,689 528 75 0 5 24 26 2 0 0 0 2,350 59.2 %
total 1,689 528 147 96 85 340 464 336 227 57 3 3,972 100.0 %
Total
Subsea 8 0 82 120 126 430 702 440 326 70 3 2,307 22.5 %
Surface 4,825 2,143 430 167 66 127 179 18 0 0 0 7,955 77.5 %
Total 4,833 2,143 512 287 192 557 881 458 326 70 3 10,262 100.0 %
Nearly 90% of all the development wells and 60% of the exploration wells are drilled with
surface BOPs. In total 22 % of the wells are drilled with subsea BOPs and 78% with surface
BOPs.

Loss of Well Control Occurrence and Size Estimators, Phase I and II
Page 39
LOWC BARRIERS
Maintaining well control is important during all well operational phases. Failure to maintain
well control will result in a LOWC event, which may cause severe damage to material assets,
the environment, and loss of human lives.
The Petroleum Safety Authority Norway (PSA) [20] has specific regulations related to well
barriers during drilling [21]. To fulfill the Norwegian barrier requirements the NORSOK
Standard D010r4 [19] is normally followed.
The Norwegian regulation is focusing on the two-barrier principle. In general, the two-barrier
principle is followed in both the UK and the US GoM OCS also, even though this is not
explicitly stated in their respective regulations. A well barrier is an item that, by itself, prevents
flow of well fluids from the well to the surroundings.
The two independent barriers are usually referred to as the primary and the secondary barrier
envelopes. The primary barrier is normally the barrier closest to the potential source of the flow
(a reservoir).
For operations in a killed well, the hydrostatic pressure from the drilling mud is regarded as
the primary barrier, and the BOP, wellhead, drill pipe, casing, etc. are regarded as the secondary
barrier envelope. In a production or injection well, the primary barrier envelope would typically
be the packer that seals off the annulus, the tubing below the SCSSV, and the SCSSV. The
secondary barrier envelope would then be the tubing above the SCSSV, the X-mas tree main
flow side, the casing/wellhead, and the annulus side of the X-mas tree.
For a completion or workover operation, the barriers will change during the operation. For
certain parts of the operation the barriers will be similar to the drilling barriers. For other parts
of the operation the barriers will be mechanical only, similar to the barriers that exist in the
production phase.
Strictly, when drilling the top-hole of the well before the BOP has been installed on the
wellhead there is a one-barrier situation. A mechanical device cannot close in the well. If the
well should start flowing in this situation, the well fluids would be diverted for a bottom fixed
installation and released on the seafloor for a floating operation.
Whenever the well is controlled by a hydrostatic pressure a LOWC event will always be
initiated by a well kick, i.e. the hydrostatic pressure becomes lower than the pore pressure for
some reason. When the kick occurs, the well control is regained by activating the secondary
barrier, and circulating the well with a higher density drilling mud.
If failing to activate the secondary barrier a LOWC event will occur. The time from when the
kick occurs until it is observed is an important factor. This will affect the size of the
hydrocarbon influx and the flow in the annulus of the well. The flow rate in the annulus is not
a design criterion for the BOP. The BOP will close if the flow rate is low, but may fail to close
if the flow rate is high. Therefore, an early kick detection will increase the success probability
with respect to closing in a well. A fast shut-in of the well will reduce the kick size and make
it less likely that subsurface leaks occur.

Loss of Well Control Occurrence and Size Estimators, Phase I and II
Page 40
Typical secondary barrier failures are (US GoM exploration drilling since 1980 – 2015):
BOP closes late for some reason causing limited release.
BOP fails to close or fails after closure.
Some dry BOPs lack blind shear ram and thereby cannot cut tubular and seal the well.
Wellheads where the BOP needs to be nippled down to energize the casing seals after
the casing has been cemented have caused flow when BOP is not present.
Jack-up type casing heads and casing spools with associated holding bolts and valves.
Inadequate casing program, underground flow, and flow outside casing.
Casing leaks due to not good enough casing design.
Table 3.1 presents the various barrier types. They are grouped according to their functions, how
they are operated, and how barrier failures are observed. The barriers listed in Table 3.1 are
only examples; several other barriers exist.
Table 3.1 Some Typical Well Barriers
Barrier type Description Example
Operational barrier A barrier that functions while the operation is carried out. A barrier failure will be observed when it occurs.
Drilling mud, stuffing box
Active barrier (Standby barriers)
An external action is required to activate the barrier. Barrier failures are normally observed during regular testing.
BOP, X-mas tree, SCSSV
Passive barrier A barrier in place that functions continuously without any external action.
Casing, tubing, kill fluid, well packer
Conditional barrier A barrier that is either not always in place or not always capable of functioning as a barrier.
Stabbing valve (WR-SCSSV)
Since oil and gas well drilling is an international business there are not too many differences
with respect to barriers in drilling in regulated areas.
Regarding testing of casing and BOPs, the US GoM OCS regulation and the Norwegian
regulations are similar.

Loss of Well Control Occurrence and Size Estimators, Phase I and II
Page 41
OVERVIEW OF LOWC DATA
4.1 WHEN AND WHERE DO LOWC EVENTS OCCUR?
This section presents an overview of the LOWC events that are included in the SINTEF
Offshore Blowout Database for the period 2000–2015.
The SINTEF Offshore Blowout Database includes 622 LOWC events worldwide (January
2016), and is constantly being updated. Offshore blowouts from as far back as 1957 are
included. Of these 643 LOWC events, 156 were experienced in the period from 2000–2015.
4.2 DURING WHAT OPERATIONAL PHASES DO LOWC EVENTS OCCUR?
Table 4.1 shows an overview of all the listed LOWC events in the database for the period 2000
- 2005 and 2006 - 2015 subdivided in operational phases (operational phases are explained in
Section 1.2, page 29).
Table 4.1 Number of LOWC events experienced during different operational phases (2000–2015)
Period Development
Drilling Exploration
drilling Unk.
drilling Compl-etion
Work-over Produ-ction
Wireline Aband-
oned well Un-
known Total
2000 - 2005 20 16 2 7 13 7 5 2 2 74
27.0 % 21.6 % 2.7 % 9.5 % 17.6 % 9.5 % 6.8 % 2.7 % 2.7 %
2006 - 2015 11 19 2 3 20 19 2 4 2 82
13.4 % 23.2 % 2.4 % 3.7 % 24.4 % 23.2 % 2.4 % 4.9 % 2.4 %
Total 31 35 4 10 33 26 7 6 4 156
19.9 % 22.4 % 2.6 % 6.4 % 21.2 % 16.7 % 4.5 % 3.8 % 2.6 %
The 2016 LOWC statistics is yet not completed, but some few incident have been identified.
They are:
Underground blowout during exploration drilling in May 2016 in 2009 meters (6590 ft)
of water, US GoM OCS,
Shallow water flow during exploration drilling in June 2016 in 1289 meters (4228 ft)
of water, US GoM OCS,
Blowout and fire during workover in September 2016, Gunashli well in the Caspian sea
in Azerbaijan
Well release during workover in October 2016 in the Norwegian Troll field. Down hole
barriers failed when pulling the tubing from the well.
Table 4.2 shows an overview of number of LOWC events for the various areas and the
operational phases for the period 2000–2015.

Loss of Well Control Occurrence and Size Estimators, Phase I and II
Page 42
Table 4.2 Area-specific overview of number of LOWC events that occurred during different operational phases (2000–2015)
Area3 Dev.
drilling Expl.
drilling Unk.
drilling Compl-etion
Work-over
Production Wire-line
Aband-oned well
Un-known
Total External cause*
No ext. cause*
US GOM OCS 16 24 3 21 5 7 3 3 82
19.5 % 29.3 % 0.0 % 3.7 % 25.6 % 6.1 % 8.5 % 3.7 % 3.7 %
UK & Norwegian waters 4 3 5 5 3 4 1 1 26
15.4 % 11.5 % 19.2 % 19.2 % 11.5 % 15.4 % 3.8 % 3.8 %
Netherlands, Canada East Coast, Australia, US Pacific OCS, Denmark, Brazil
2 3 3 1 9
22.2 % 33.3 % 33.3 % 11.1 %
Rest of the world 9 5 4 2 4 7 4 2 2 39
23.1 % 12.8 % 10.3 % 5.1 % 10.3 % 17.9 % 10.3 % 5.1 % 5.1 %
Total 31 35 4 10 33 12 14 7 6 4 156
19.9 % 22.4 % 2.6 % 6.4 % 21.2 % 7.7 % 9.0 % 4.5 % 3.8 % 2.6 %
* External causes are typical; storm, military activity, ship collision, fire and earthquake.
When reading Table 4.2 it is important to note that the data from rest of the world in general
has lower quality than the data from the other areas.
The relatively high number of well workover LOWC events in US GoM OCS area indicates
that the number of workovers in that area is high.
It should further be noted that external loads caused approximately 50% of the production
blowouts.
4.3 COUNTRIES REPRESENTED WITH LOWC EVENTS IN THE DATABASE
Table 4.3 shows the countries represented with LOWC events in the database for the period
2000–2015.
3 The following areas of operations are used in the report;
US GoM OCS
Regulated area: UK, Norway, Netherlands, Canada East Coast, Australia, US Pacific OCS,
Denmark and Brazil Rest of the world: All countries/areas not mentioned above

Loss of Well Control Occurrence and Size Estimators, Phase I and II
Page 43
Table 4.3 Countries represented with LOWC events in the SINTEF Offshore Blowout Database (2000–2015)
Country
Development drilling
Exploration drilling
Unknown drilling Comp-
letion Work-over
Prod-uction
Wireline Abandoned
well Un-
known Total
Deep Shallow Deep Shallow Deep Shallow
Australia 1 1 2
Azerbaijan 1 1 2 4
Brazil 2 1 3
Brunei 1 1
China 1 1 2
Egypt 1 1 1 3
India 1 1 2
Indonesia 3 1 1 1 6
Iran 1 1
Mexico 1 1 2
Netherlands 1 1
Nigeria 1 1 2
Norway 2 1 1 4
Saudi Arabia 1 1
Trinidad 1 1 2
UK 1 3 1 4 4 3 4 1 1 22
US GoM OCS 4 12 14 10 3 21 12 3 3 82
US Alaska State 1 1
US Pacific OCS 1 2 3
US GoM State 1 1 2 6 1 11
Venezuela 1 1
Total 13 18 21 14 2 2 10 33 26 7 6 4 156
For the period 2000–2015, 52% of the LOWC events come from the US GoM OCS. Further,
45% of the LOWC events occurred during drilling, 21% during workovers, and 17% during
production.
4.4 WELL CATEGORIES IN DRILLING
Most offshore LOWC events occurred during well drilling (see Section 4.1, page 41). Wells
are generally classified as:
Exploration
Development
In Norway, exploration wells are classified into two groups:
Wildcats (wells drilled in an unproved area)
Appraisal wells (wells drilled following a discovery to determine the extent of an oil or gas
field)
In the UK, only wildcats are regarded as exploration wells, while appraisal wells form a
separate category.
In the US, exploration wells include both wildcats and appraisal wells.

Loss of Well Control Occurrence and Size Estimators, Phase I and II
Page 44
This report classifies appraisal wells and wildcats as exploration wells (as per the US
classification).
A development well is a well drilled within a proven area of an oil or gas reservoir to a depth
of a stratigraphic horizon known to be productive.
Drilling blowouts may occur at nearly all well depths. In some wells, very shallow gas pockets
have been observed. In terms of well control, shallow gas blowouts are different from blowouts
stemming from deeper zones of the well. The drilling blowouts described in this report are
divided in two main types:
Shallow gas blowouts
“Deep” blowouts
All drilling blowouts that are not regarded as shallow gas blowouts are classified as “deep”
blowouts. The definition of shallow gas is shown on page 27.
4.5 NORTH SEA REQUIREMENTS
As explained in Section 1.1.1 on page 26 the incidents in the SINTEF Offshore Blowout
database have been categorized in blowouts and well releases. BSEE categorizes both blowouts
and well releases as LOWCs.
Table 4.4 shows an overview of the number of drilling blowouts/well releases, the associated
main category, sub category, and if there were any factors important for the incident that were
not according to “North Sea Requirements”.

Loss of Well Control Occurrence and Size Estimators, Phase I and II
Page 45
Table 4.4 Overview of the number of incidents main categories, sub categories, and accordance with North Sea Requirements for LOWC events in the period 2000–2015 worldwide
Main category (Table 1.1, p. 27)
Sub category (see Table 1.1, p. 27)
According to North Sea Requirements? (Table 1.4 p. 30)
Dev. drlg
Expl. drlg
Unk. drlg
Comp-letion
Work-over
Prod-uction
Wire-line
Aband-oned well
Un-known
Total
Blowout (surface flow)
Shallow gas "controlled" subsea release only
Yes 1 1
Totally uncontrolled flow, from a deep zone
No, no acoustic backup BOP control system
2 2
No, no shear ram 1 2 3
No, two barrier principle not followed
1 2 3
Not evaluated 4 4
Sometimes not relevant, BOP removed to install casing seal
2 1 3
Unknown 3 1 1 2 2 5 2 1 17
Yes 3 8 1 2 9 6 1 2 1 33
Totally uncontrolled flow, from a shallow zone
Sometimes not relevant, BOP removed to install casing seal
1 1 2
Unknown 1 2 3
Yes 10 4 2 16
Unknown Not evaluated 1 1 2
Total 21 21 4 4 13 18 1 4 3 89
Blowout (underground flow)
Underground flow only
Yes 1 3 4
Total 1 3 4
Diverted well release
Other Yes 1 1 2
Shallow gas controlled flow (diverted)
Yes 6 4 10
Total 6 5 1 12
Unknown Unknown Unknown 1 1
Total 1 1
Well release
Limited surface flow before the secondary barrier was activated
No, no shear ram 1 1
Unknown 1 1
Yes 2 4 5 15 8 6 1 41
Other Yes 1 2 3
Shallow gas "controlled" subsea release only
Yes 1 1
String blown out of well, then the secondary barrier
Yes 3 3
Total 3 6 5 19 8 6 2 1 50
Total 31 35 4 10 33 26 7 6 4 156
Three of the blowout (surface flow) incidents and one of the well releases may have been
avoided if the surface BOP stack had included a blind shear ram and not a blind ram only. In
the BSEE new final rule (Federal Register / Vol. 81, No. 83 / Friday, April 29, 2016 / Rules
and Regulations) paragraph 250.733 there is a requirement that all surface BOPs shall include
a blind shear ram. In the previous rule, there was only a requirement of a blind ram or a blind
shear ram. When looking back on LOWC events that occurred before the year 2000 the lack of
blind shear rams in surface BOPs caused LOWC events more often than in the present dataset.
It is believed that most surface BOPs in the US GoM OCS already have blind shear rams
installed.

Loss of Well Control Occurrence and Size Estimators, Phase I and II
Page 46
Five of the incidents occurred while the BOP was nippled down to energize a casing seal. These
are incidents where the surface BOP is removed from the wellhead after cementing of the
casing. The flow starts when the BOP is removed while the cement is setting.
For two of the incidents an acoustic subsea BOP backup system may have prevented the
incident from occurring, or reduced the consequences of the incident. The new BSEE regulation
has significantly more requirements related to subsea BOP emergency systems than before the
Deepwater Horizon accident. These systems, if installed, may have prevented these incidents.
For the production LOWC events some of the incidents categorized with unknown may seem
to be events where the wells have not had a SCSSV. These events typically stems from “non
regulated areas”.

Loss of Well Control Occurrence and Size Estimators, Phase I and II
Page 47
SHALLOW ZONE DRILLING LOWC EVENTS
When drilling the shallow section of the well (before the BOP is landed on the wellhead), there
is normally only one LOWC barrier, the drilling fluid. Diverter systems, which should lead the
gas away from the installation, are installed in most cases. Some bottom-supported drilling
platforms are not equipped with diverter systems, when shallow gas is not expected. The
definition used for shallow zone in this report is shown on page 27.
Floating vessels do normally drill the shallow sections of the well without a riser. This means
that the diverter systems are normally not used when drilling the shallow section of the well
from a floating vessel. The vessel will be moved away from the well in case a shallow gas
LOWC represents a danger for the vessel.
When drilling without a riser, the drilling fluid is usually seawater with a density of 1030 kg/m3
(8.6 lb./gallon). Mud, which has to be disposed on the seafloor, is usually not used. This limits
the hydrostatic pressure in the well, and thereby increases the LOWC probability.
The exact spud location is frequently based on experience from previous wells drilled nearby
and seismic surveys, which helps to avoid drilling into shallow gas pockets. Experience,
however, proves that the probability of failing to predict shallow gas pockets is high. This was
a larger problem in the 80’s, but the LOWC events experienced indicate that this is still a
problem.
5.1 SHALLOW ZONE LOWC EXPERIENCE
Shallow zone LOWC events occur during drilling. The shallow gas experience presented in
this section is based on worldwide incidents in the period 2000–2015. Thirty-four shallow gas
LOWC events have been recorded. Table 5.1 lists the various installation and well types.
Table 5.1 Shallow zone LOWC events experienced for various installation vs. main well type (2000–2015 worldwide)
Installation type Main incident category Sub Category Dev. drlg
Expl. drlg
Unk. drlg
Total
Jack-up
Blowout (surface flow) Totally uncontrolled flow, from a shallow zone 8 3 11
Diverted well release Shallow gas controlled flow (diverted) 4 4 8
Total 12 7 19
Semisubmersible Blowout (surface flow)
Shallow gas "controlled" subsea release only 1 1
Totally uncontrolled flow, from a shallow zone 2 2 2 6
Total 2 3 2 7
Drillship
Blowout (surface flow) Totally uncontrolled flow, from a shallow zone 1 1
Well release Other 1 1
Shallow gas "controlled" subsea release only 1 1
Total 3 3
Jacket
Blowout (surface flow) Totally uncontrolled flow, from a shallow zone 1 1 2
Diverted well release Shallow gas controlled flow (diverted) 2 2
Total 3 1 4
Barge Blowout (surface flow) Totally uncontrolled flow, from a shallow zone 1 1
Total 1 1
Total 18 14 2 34

Loss of Well Control Occurrence and Size Estimators, Phase I and II
Page 48
Shallow gas releases from LOWC events occurring when drilling with drillship and
semisubmersibles are normally released on the sea floor. The risk for the installation will
depend on the water depth and the gas flow rate. In deepwater the gas will pose limited danger
for an installation. Some gas will dissolve in the water and the gas that comes to the surface (if
any) will be released in a large area so an explosive mixture of gas and air will not be formed.
In shallow water shallow gas released on the seafloor can represent a danger.
For jacket and jack-ups, the shallow gas is typically lead back to the installation and diverted
overboard. As long as the shallow gas is diverted properly, the explosion risk is low. However,
experience shows that in some cases the large gas flow, which normally is mixed with sand,
erodes the diverter lines and causes them to leak. This was a larger problem in the 80’s and
90’s than to day. One of the jack-ups drilled the top-hole without a riser. The gas then came
back to the rig through the seawater and the rig could not move away.
Three of the shallow gas LOWC events ignited, two in the US GoM OCS and one in Indonesia.
All three occurred on a jack-up. One ignited immediately, one after half an hour and one after
26 hours. None caused fatalities.
These events do not cause severe pollution.
Figure 5.1 and Figure 5.2 show the annual LOWC frequency and the associated regression lines
for shallow zone LOWC events from 2000–2015 for development and exploration drilling in
the US GoM OCS, UK and Norway.
Figure 5.1 Annual frequency for shallow zone LOWC events during development drilling and the associated trend line
0,000
0,002
0,004
0,006
0,008
0,010
0,012
0,014
2000 2002 2004 2006 2008 2010 2012 2014
Freq
uen
cy p
r w
ell d
rille
d
Year
Shallow LOWC annual frequency, development drilling, US GoM, UK and Norway
5% conf limit Estimate 95% conf limit Linear (Estimate)

Loss of Well Control Occurrence and Size Estimators, Phase I and II
Page 49
Figure 5.2 Annual frequency for shallow zone LOWC events during exploration drilling and the associated trend line
The linear trend lines in Figure 5.1 and Figure 5.2 indicate a slight increase for shallow zone
LOWC frequency for exploration drilling, and no trend for development and drilling. The
statistical uncertainty is, however, large due to few occurrences, so it cannot be concluded that
there is any trend.
In the late 1980’s, the industry put major emphasis into shallow gas blowout risk reduction
means. These efforts mainly focused on diverter systems, riserless drilling, and handling
procedures. Earlier studies have shown that this focus has reduced the frequency and
consequences of shallow zone LOWC incidents.
Table 5.2 shows the operations and activities in progress when the shallow gas LOWC events
occurred.
0,000
0,005
0,010
0,015
0,020
0,025
0,030
2000 2002 2004 2006 2008 2010 2012 2014
Freq
uen
cy p
r w
ell d
rille
d
Year
Shallow LOWC annual frequency, exploration drilling, US GoM, UK and Norway
5% conf limit Estimate 95% conf limit Linear (Estimate)

Loss of Well Control Occurrence and Size Estimators, Phase I and II
Page 50
Table 5.2 Operations and activities in progress when the shallow gas LOWC events occurred (world-wide 2000–2015)
Operation Activity
Drilling activity
Casing running
Other/unknown operations.
Total
Actual drilling 11 11
Tripping out 2 2
Coring 1 1
Circulating 1 1
Casing running 1 1
Cementing casing 3 3
Wait on cement 7 7
Wait on weather 1 1
Unknown 4 3 7
Total 19 11 4 34
56% of the shallow zone LOWC events occurred during operation related to making new hole
(drilling activity), 29% occurred in association with casing running operations, and the
remaining incidents during other operations.
Most LOWC events occurred during actual drilling and waiting on cement to harden.
5.1.1 SHALLOW ZONE LOWC CAUSES
Table 5.3 lists the experienced causes for shallow zone LOWC events.
Table 5.3 Primary and “secondary barrier” failure listed in the database for the worldwide shallow zone LOWC events during drilling (2000–2015)
Loss of primary barrier
Loss of “secondary barrier”
Diverted - no
problem
Failed to operate diverter
Diverter failed after
closure
Drilling without
riser
Diverter not in place
Fracture at csg shoe
Casing leak & Poor
cement
Formation breakdown
Not relevant
Other/ Unknown
Total
Too low hydro-static head
Unexpected high well pressure/too low mud weight
6 5 1 1 2 15
Swabbing 1 1 2
Annular losses
2 1 3
While cement setting
1 1 2 1 2 1 1 9
Unknown why
1 1
Poor cement 1 1 2
Unknown 2 2
Total 10 1 4 8 2 1 1 1 2 4 34
As seen from Table 5.3, experience shows that the shallow zone LOWC events primary barrier
failures are related to too low hydrostatic head.

Loss of Well Control Occurrence and Size Estimators, Phase I and II
Page 51
Unexpected high well pressure / too low mud weight is the most common cause for losing the
hydrostatic control of the well. In many cases seismic results or experience from drilling
neighbor wells indicate that the risk of shallow gas is negligible, so shallow gas is not expected.
The shallow section of a well is frequently drilled with seawater as the drilling fluid, and
slightly over-pressured gas accumulations may initiate flow.
These incidents have typically been diverted with no problems (for bottom-supported rigs) or
released to the seafloor for floating drilling without a riser. Floating vessels may move away
from the location if the gas flow becomes too high.
One of these LOWC events occurred on a jack-up rig in UK waters where they were drilling
the shallow section of the well without a riser. The shallow geo-hazard assessment erroneously
defined the risk of shallow gas to be negligible. The water depth was 90 meters (295 ft.). A
significant disturbance of gas breaking out on sea surface was observed around the perimeter
of the rig to some 100m. In such cases, the gas cannot be diverted and the jack-up could not be
moved away. They pumped mud and managed to control the well.
Another frequent cause is flow after cementing. These LOWC events typically occur after the
casing has been run and cemented. The most vulnerable period for the cement is immediately
after placement and prior to its setting. It is during this time that cement, while developing gel
strength, becomes self-supporting and loses its hydrostatic pressure. This hydrostatic pressure
loss is responsible for the well reaching an underbalanced condition, which can lead to gas
invasion. Slurries must be designed with the goal of minimizing this vulnerable time when an
underbalanced condition exists.
So-called gas-tight cements were introduced in the late 80’s to reduce this problem. How
commonly gas-tight cements are used and the effect of this is not known to the author.
Important factors to focus on to reduce the possibility of such events are:
- Awareness of shallow gas
- Continuously monitoring the annulus for fluid level or fluid gain
- Waiting time for cement to cure
- Utilize lower fluid loss cement slurry to avoid flow after cementing
- Hold nominal pressure on annulus while waiting on cement to harden
The MMS issued three safety alerts concerning annular flow in association with cementing of
casing [12] in 2003 - 2005. The recommendations from these safety alerts are listed below:
Safety Alert No. 210 January 8, 2003
It has been concluded in part by the MMS investigation of this event that the well control
problem was probably caused by the regression of the cement density to a seawater gradient
and/or the formation of a channel because of the delay in pumping cement. MMS stresses the
importance of and recommends pumping cement as soon as possible after landing casing and
circulating at least one casing volume.
Safety Alert No. 216 October 22, 2003
1. For each well, the operators and contractors should conduct a review of the contingency
procedures to be followed in the event of annular flow after cementing. Before using
the diverter to hold back pressure after cementing, detailed planning is recommended,

Loss of Well Control Occurrence and Size Estimators, Phase I and II
Page 52
including identification of maximum pressure to be held, method of monitoring and
measuring pressure, and how that pressure will be diverted if necessary.
2. The operators and contractors should ensure the contingency procedures are clearly
disseminated to all rig supervisors and any personnel who could be involved in
emergency decision making.
3. The operators and drilling contractors should ensure all supervisory personnel are fully
trained in diverter operations specific to each rig, including pressure limits and control
mechanisms, under all circumstances.
4. The operators should review cementing practices and procedures for shallow casing
strings and adopt best cementing practices that provide the most protection from annular
flow after cementing.
Safety Alert No. 226 January 28, 2005 (comes from a “deep” blowout that occurred in 2004)
1. Close examination of all logs, especially prior to cementing, is recommended to ensure no
unexpected shallow zones are productive. Adjustment of the cementing program is
recommended if such zones are identified.
Three of the shallow gas drilling LOWC events were caused by annular losses. Annular losses
occur when the hydrostatic pressure from the mud column exceeds the formation fracture
gradient. This causes fluid to enter the formation, and possibly, the well to kick.
One LOWC event was caused by swabbing and two by poor cement.
5.1.2 EQUIPMENT FAILURES CONTRIBUTION TO SHALLOW ZONE LOWC RISK.
For non-floating installations, diverter systems are normally used to lead the gas overboard to
avoid damage and danger of an explosion or fire. In some occasions, shallow gas blowouts
have been closed in. Closing in shallow gas greatly increases the chances for a blowout to occur
outside the casing, and cratering, which again, in a worst case, may cause a bottom-supported
platform to tilt and capsize.
More alternatives are available for floating drilling structures than for bottom-supported
drilling installations. These are:
Diverter systems
Disconnecting riser and pull off
Drilling without riser
When drilling without a riser or disconnecting the riser, the hydrostatic pressure from the
seawater will reduce the flow. In the 80’s some few rigs used subsea diverters as well in
addition to the rig diverter system. By using subsea diverters the gas may be diverted subsea,
and thereby not be brought back to the rig. Subsea diverters were also used to some extent to
close in the wells for short periods.
Today bottom supported rigs typically use diverter systems, while floating rigs are drilling the
top hole without a riser.

Loss of Well Control Occurrence and Size Estimators, Phase I and II
Page 53
Table 5.3, page 50 shows that for 15 of the shallow zone LOWC events the diverter system was
in use, and for two it was nippled down to install casing seal and/or wellhead. For 10 of the
incidents the diverting functioned as intended, and for five the diverter system failed.
The five incidents where the diverter system did not function as intended were:
Diverter line eroded due to the flow of gas and sand.
Leaking of gas past the diverter flowline seals, probably over pressured because the diverter
was in test mode and could not be operated.
Diverter leak through in closed position.
Diverter leak through in closed position.
Failed to close the diverter because a 1.5” grout sting was running through the diverter.
Further:
For one incident a boat plug in the subsea wellhead port blew out (two other ports had shut
off valves).
For another incident the casing cement failed one month after the casing was set and
cemented.
For one incident listed with a failed casing, they cut a hole in the 30-inch casing to wash
cement from the 18 5/8-inch by 30-inch annulus. The well started to flow through the hole.
Seven LOWC events resulted in a “controlled” subsea release. These incidents occur when
drilling without a riser. For the experienced incidents the pump rate was typically increased to
kill the well dynamically, alternatively the rigs were winched off the location to avoid the gas
exposure.
For the formation breakdown LOWC the diverter was closed to control the pressure and allow
the cement to cure. After a while, gas came to surface around other wells.
For the Not relevant incident, the cement failed and the well flowed outside the casing.
5.2 HUMAN ERRORS IN SHALLOW ZONE LOWC EVENTS
The human role is considered important in the occurrence and development of LOWC events..
Human errors are believed to have contributed to many of the incidents without being explicitly
stated in the information source. The skill of the personnel and proper procedures and practices
will always be important.
The following human errors were found from the verbal description of the various LOWC
events:
Drilled with a jack-up without a riser (could not divert the shallow gas or move the rig
away from the well).
Personnel should be aware of that the diverter test mode could not be overridden from
the remote panel (could thereby not operate the diverter).
While drilling, gas slowly came up the drive pipe through the drill pipe annulus. They
decided to weight up the mud and drill ahead (should have controlled the well before
continuing drilling).
The operator did not inform properly about shallow gas hazard to involved parties.

Loss of Well Control Occurrence and Size Estimators, Phase I and II
Page 54
Cement program was not properly designed.
Otherwise, general observation from many of the incidents is that the geo-hazard
analyses did not foresee any shallow gas problem, but shallow gas was present anyway.
Shallow gas hazards from neighbor wells are from time to time not considered when
planning a well.
The drilling plans and the personnel should always be prepared for the possibility that shallow
gas may occur.

Loss of Well Control Occurrence and Size Estimators, Phase I and II
Page 55
DEEP ZONE DRILLING LOWC EVENTS
All drilling LOWC events not classified as shallow zone LOWC events are classified as “deep”
LOWC events (See Shallow gas definition, page 27).
6.1 WELL BARRIERS IN DEEP ZONE DRILLING
The main difference in LOWC barriers (when drilling the deeper part of the well compared to
the shallow part) is that two blowout barriers exist during “deep” drilling. The primary barrier
is the drilling mud, and the secondary barriers are the mechanical devices designed for closing
in the well annulus (a BOP) or the drill pipe (kelly valve or similar) in addition to the casing
and cement.
When a mechanical barrier is activated during a kick situation, the well pressurizes. This
requires that the formation fracture gradient is sufficiently high so that the pressure can be
confined until the hydrostatic control is regained. If the formation fracture gradient is too low,
an underground blowout or a blowout outside the casing may result.
A brief description of the secondary barriers during drilling is given below. Blowout barriers
in general are also briefly discussed in Section 3, page 39, along with several textbooks, among
them [17] and [18].
During normal drilling, the secondary barriers are the blowout preventers (BOPs), drill string,
formation, cement, wellhead and the casing. The BOPs are typically located subsea for floating
installations and topside for bottom-supported installations. BOPs are mainly used for closing
in the well annulus, but most BOPs also include a blind-shear ram used for shearing the drill
pipe and sealing the well. The annulus is usually sealed by closing an annular or a pipe ram
preventer. The blind-shear ram preventer, is regarded as an emergency device. Closing this
preventer will significantly complicate the operation required to regain the hydrostatic control
of the well.
If the well kicks through the drill pipe when the drill pipe is connected to the mud system (i.e.,
not when the pipe is disconnected for tripping or adding an extra stand or joint), the pressure
may be closed in by a valve located in the drill string flow path. For drilling rigs with a rotary
table, this will be a kelly valve. For drilling rigs with a topdrive, a remote controlled valve
inside the topdrive will close the drill string flow path. If the drill pipe is disconnected from the
topdrive when the well kicks, the kelly valve or the topdrive has to be stabbed in the pipe against
the well flow to be able to stop the flow. If this does not succeed, the blind-shear ram preventer
has to be activated.
Many drilling operators also use a check valve in the drill string near the drill bit (frequently
referred to as a float valve), which closes if the well flows through the drill string. Some
operators decide not to install such a valve from time to time for various reasons.
The drill string, formation, cement, wellhead and the casing are passive barriers that do not
have to be activated in a kick situation.

Loss of Well Control Occurrence and Size Estimators, Phase I and II
Page 56
One or more of the secondary barriers may not be available. This may be because the barrier
itself failed (e.g., leakage in a wellhead connector), failed to activate (e.g., failed to close the
BOP), or specific operations made the barriers unavailable (e.g., BOP nippled down to energize
the casing seals). If the secondary barriers are unavailable and a kick occurs, the kick may
develop to a LOWC event.
For other operations some of the barriers may be unavailable, e.g., when running drill collars
through the BOP, the blind-shear ram or pipe ram preventers cannot be used. When the drill
pipe is out of the hole, the blind-shear ram is normally used to stop the well flow. Annular
preventers may, however, also be used for this purpose, but only in an emergency.
The secondary barriers described above are the “normal” secondary barriers when drilling is in
progress. During some specific operations, different secondary barriers are used (i.e., when
performing a production test on an exploration well or when running a wireline through the
drill pipe).
After a kick is closed-in by the secondary barriers, the main goal is to re-establish hydrostatic
control of the well. Several different methods exist to re-establish the hydrostatic control. The
selection of method is related to the specific situation and the company’s well control policy.
The various methods applied, together with advantages and disadvantages, are described in
several textbooks, among them [17] and [18].
6.2 DEEP ZONE DRILLING LOWC EXPERIENCE
The experience presented in this section is based on the SINTEF Offshore Blowout Database
[7] for the period 2000–2015 worldwide. A total of 36 deep zone drilling LOWC events have
been recorded. Table 6.1 lists the various installation types, incident categories, and well types.

Loss of Well Control Occurrence and Size Estimators, Phase I and II
Page 57
Table 6.1 Deep zone drilling LOWC events experienced for various installation vs. main well type worldwide (2000–2015)
Installation type and main incident category
Sub category
Number of LOWCs
Dev. drlg
Expl. drlg
Unknown drlg
Total
JACK-UP
Blowout (surface flow) Totally uncontrolled flow, from a deep zone 3 8 1 12
Blowout (underground flow) Underground flow only 1 2 3
Well release Limited surface flow before the secondary barrier was activated 2 2
Total 6 10 1 17
SEMISUBMERSIBLE Blowout (surface flow) Totally uncontrolled flow, from a deep zone 3 1 4
Blowout (underground flow) Underground flow only 1 1
Well release Limited surface flow before the secondary barrier was activated 2 2
Total 6 1 7
DRILLSHIP Blowout (surface flow) Totally uncontrolled flow, from a deep zone 1 1
Diverted well release Other 1 1
Well release Limited surface flow before the secondary barrier was activated 2 2
Total 4 4
JACKET
Blowout (surface flow) Totally uncontrolled flow, from a deep zone 2 1 3
Well release Limited surface flow before the secondary barrier was activated 1 1
Total 3 1 4
BARGE
Blowout (surface flow) Totally uncontrolled flow, from a deep zone 4 4
Total 4 4
TOTAL ALL 13 21 2 36
As seen from Table 6.1, 21 of the LOWC events occurred in exploration drilling and 13 in
development drilling. For the two last incidents, it was not possible to identify in what type of
well the LOWC event occurred.
Approximately 48% of the “deep” LOWC events occurred on jack-ups, while 19% occurred
on semisubmersibles. The remaining 33 % occurred on drillships, barges and jackets.
Figure 6.1 and Figure 6.2 shows the annual LOWC frequency and the associated regression
lines for deep zone LOWC events from 2000–2015 for development and exploration drilling
in US GoM OCS, Norway, and UK.

Loss of Well Control Occurrence and Size Estimators, Phase I and II
Page 58
Figure 6.1 Annual frequency for deep zone LOWC events during development drilling and the associated trend line
Figure 6.2 Annual frequency for deep zone LOWC events during exploration drilling and the associated trend line
Figure 6.1 and Figure 6.2 show that the statistical uncertainty is largely due to few occurrences.
It cannot be concluded that there is any statistical significant trend. The statistical uncertainties
increases during the period due to reduced drilling.
0,000
0,001
0,002
0,003
0,004
0,005
0,006
0,007
0,008
2000 2002 2004 2006 2008 2010 2012 2014
Freq
uen
cy p
r w
ell d
rille
d
Year
Deep LOWC annual frequency, development drilling, US GoM, UK and Norway
5% conf limit Estimate 95% conf limit Linear (Estimate)
0,000
0,005
0,010
0,015
0,020
0,025
0,030
2000 2002 2004 2006 2008 2010 2012 2014
Freq
uen
cy p
r w
ell d
rille
d
Year
Deep LOWC annual frequency, exploration drilling, US GoM, UK and Norway
5% conf limit Estimate 95% conf limit Linear (Estimate)

Loss of Well Control Occurrence and Size Estimators, Phase I and II
Page 59
Table 6.2 shows the countries and the years the various deep zone drilling LOWC events
occurred.
Table 6.2 Countries where deep zone drilling LOWC events were experienced vs. main well type worldwide (2000–2015)
Year Country Development drilling
Exploration drilling
Unknown drilling
Total
2000 US GoM OCS 1 4 5
2001
Trinidad 1 1
UK 1 1
US GoM OCS 1 1 2
2002
Indonesia 1 1
Trinidad 1 1
US GoM OCS 1 1
2003
Indonesia 1 1
US GoM State water 1 1
Venezuela 1 1
2004 Egypt 1 1 2
US GoM OCS 2 1 3
2005 US GoM OCS 1 1
2006 US GoM OCS 1 1
2007
Brazil 1 1
Indonesia 1 1
UK 1 1
2008 US GoM OCS 1 1
2009 Australia 1 1
US GoM OCS 1 1
2010 Australia 1 1
US GoM OCS 1 1
2011 Brazil 1 1
China 1 1
2012 Nigeria 1 1
2013 Azerbaijan 1 1
US GoM OCS 1 1
2014 US GoM OCS 1 1
Total 13 21 2 36
Table 6.2 shows that 50 % (18) of the observed deep zone drilling LOWC events occurred in
the US GoM OCS, and the remaining 18 in the rest of the world. Table 2.1 and Table 2.4, page
36 shows the areas of the world where there exist public drilling statistics. These areas are
regulated areas where the operations are carried out similarly to the US GoM OCS operations.
The regulated areas includes Norway, UK, the Netherlands, Canada East Coast, Australia, US
Pacific OCS, Denmark, and Brazil. For the remaining countries, there are no known drilling
statistics, and LOWC frequencies cannot be established.
The total number of wells drilled in the regulated areas are in the same order of magnitude as
for the US GoM OCS, but only six deep zone LOWC events have been observed in these areas.
The average frequency for drilling LOWC events in the regulated areas was 60 % of the US
GoM OCS frequency for development wells and 25% for exploration wells. Poorer reporting,
different well control philosophy, different equipment, different formations and/or statistical
uncertainty may cause this difference.
Table 6.3 presents the operations and activities in progress when the blowouts occurred for
exploration and development drilling.

Loss of Well Control Occurrence and Size Estimators, Phase I and II
Page 60
Table 6.3 Operations and activities in progress when the deep zone drilling LOWC events occurred
Area Main category Operation
Drilling activity
Casing Running
Other operations
Unknown
Total Activity Dev.
drlg Expl. drlg
Dev. drlg
Expl. drlg
Dev. drlg
Expl. drlg
Dev. drlg
Expl. drlg
Unk. drlg
US GoM OCS
Blowout (surface flow)
Actual drilling 3 3
Circulating 1 1 2
Casing running 1 1
Cementing casing 1 1
Wait on cement 1 1
Cement squeeze 1 1
Install BOP 1 1
Nipple down BOP 1 1
Total 3 2 4 2 11
Blowout (under-ground flow)
Actual drilling 2 2
Logging 1 1
Total 1 2 3
Diverted well release
Circulating 1 1
Total 1 1
Well release
Actual drilling 1 1
Circulating 1 1 2
Total 1 1 2
Total 2 7 2 4 3 18
Regula-ted area
Blowout (surface flow)
Actual drilling 1 1
Well suspended 1 1
Total 1 1 2
Blowout (under-ground flow)
Actual drilling 1 1
Total 1 1
Well release
Circulating 1 1 2
Pull/drill out well plugs 1 1
Total 1 1 1 3
Total 1 3 1 1 6
Remain-ing countries
Blowout (surface flow)
Actual drilling 1 1
Wait on cement 1 1
Killing 1 1
Unknown 4 2 2 8
Total 1 1 4 3 2 11
Well release
Unknown 1 1
Total 1 1
Total 1 1 5 3 2 12
Total 4 10 3 4 1 4 5 3 2 36
From Table 6.3, it can be seen that for the US GoM OCS and the regulated areas approximately
50% of the deep zone drilling LOWC events occurred when making a new hole, and
approximately 25% in association with running casing and cement. For the remaining
countries, there are many unknowns with respect to the ongoing operations when the LOWC
events occurred.
For the US GoM OCS and the regulated areas, 13 of the 24 LOWC events were categorized as
blowout (surface flow). The remaining 11 were categorized as either a blowout (underground
flow) or a well release. For the remaining countries, 11 out 12 LOWC events were categorized
as blowout (surface flow).

Loss of Well Control Occurrence and Size Estimators, Phase I and II
Page 61
6.3 DEEP ZONE DRILLING LOWC CAUSES
This section focuses on the causes of “deep” drilling LOWC events. Since two barriers
normally should be present while drilling, this section is focused on the causes of losing the
primary barrier, mainly the hydrostatic control of the well, and the secondary barriers, mainly
the wellhead located barriers, the casing, the formation and drill string.
6.3.1 LOSS OF THE PRIMARY AND SECONDARY BARRIERS
When the primary barrier is lost during drilling, a well kick results. In terms of well control, it
is important to detect the well kick as soon as possible in order to close in the well with a
minimum influx. Small influxes are easier to handle than large influxes.
The ability to detect kicks has gradually improved since the 1980’s, but still kicks are observed
late. The control of the flow and pit volumes are the most important kick detection parameters.
Computers are used for real time analysis of drilling data to improve the early kick detection.
One problem may be that when drilling, the personnel sometimes believe too much in the well
drilling plan and sophisticated computer systems and do not read the signals from the well.
If the secondary barrier fails to activate or activates late a LOWC event will occur.
Table 6.4 lists the experienced primary and secondary barrier failure causes for the kicks
resulting in “deep” drilling LOWC events for US GoM OCS and regulated areas (Norway, UK,
the Netherlands, Canada East Coast, Australia, US Pacific OCS, Denmark, and Brazil).

Loss of Well Control Occurrence and Size Estimators, Phase I and II
Page 62
Table 6.4 Primary and secondary barrier failure causes for “deep” drilling LOWC events in the US GoM OCS and the regulated areas (2000–2015).
Primary barrier failure Secondary barrier failure LOWC Id Rig type Dev. drlg
Expl. drlg
Total
Blowout (surface flow)
Too low hydrostatic head
Too low mud weight Casing head failed 459 Jack-up 1 1
Gas cut mud Poor cement 516 Semisub 1 1
Improper fill up, annular losses, packer leakage
Wellhead failed 564 Jack-up 1 1
Disconnected riser Failed to close BOP 464 Semisub 1 1
Unexpected high well pressure
Formation breakdown 619 Drillship 1 1
Reservoir depth uncertainty
String safety valve failed 481 Jack-up 1 1
Inner casing failed 524 Jacket 1 1
While cement setting
BOP failed after closure 463 Jack-up 1 1
BOP/diverter not in place 460 Jack-up 1 1
465 Jack-up 1 1
Wellhead failed 550 Jack-up 1 1
Casing plug failure
Failed to close BOP 611 Semisub 1 1
Not relevant (only one barrier)
590 Jack-up 1 1
Total 3 10 13
Blowout (underground flow)
Too low hydrostatic head
Unexpected high well pressure
Poor cement, casing leakage 629 Jack-up 1 1
Formation breakdown 605 Jack-up 1 1
622 Semisub 1 1
Unknown why Formation breakdown 580 Jack-up 1 1
Total 1 3 4
Diverted well release
Too low hyd. Head - unknown why Failed to close BOP 608 Drillship 1 1
Total 1 1
Well release
Too low hydrostatic head
Too low mud weight Failed to close BOP
595 Jack-up 1 1
Trapped gas 583 Drillship 1 1
Unknown why Diverted - no problem 538 Semisub 1 1
Unexpected high well pressure
Not sufficient frictional backpressure
532 Semisub 1 1
Failed to close BOP 645 Drillship 1 1
Unknown 502 Jacket 1 1
Total 2 4 6
Total all 6 18 24
The individual LOWC events are commented a bit further down. Here some overall findings
are discussed.
It should be noted that well kicks are fairly normal. They are normally detected in a timely
manner and handled properly so an LOWC event will not be the outcome.
The frequency of well kicks varies highly depending on many factors. Kicks are discussed in
Section 15.8, page 158.
Loss of the primary barrier
For one LOWC event a spurious disconnect of the riser caused the event. The well was in 678
meters (2,223 ft.) of water and did not have a riser margin. The well kicked because the riser
was disconnected. When disconnecting the riser the main BOP control was also lost (loss of

Loss of Well Control Occurrence and Size Estimators, Phase I and II
Page 63
secondary barrier). With the actual BOP setup the primary and the secondary barriers were not
independent. Today all US subsea BOPs have emergency functions and/or alternative control
systems so the occurrence of such an event is far less likely.
Further, four LOWC events occurred while the cement was setting after running casing. These
LOWC events typically occur after the casing has been run and cemented. The most vulnerable
period for the cement is immediately after placement and prior to its setting. It is during this
time that cement, while developing gel strength, becomes self-supporting and loses its
hydrostatic pressure. This hydrostatic pressure loss is responsible for the well reaching an
underbalanced condition, which can lead to gas invasion. This type of primary barrier failures
are common for the shallow events as well. The blowout database shows that this has been a
problem in the 80’s and 90’s as well.
For the Unexpected high well pressure, the reservoir was over-pressurized due to water
injection. Assumed reservoir pressure was 3,700 psi, actual pressure was between 4,003 psi
and 4,176 psi.
The two incidents categorized with casing plug failure as cause for loss of the primary barrier
are the well-known Deepwater Horizon and the Montara blowouts. In both cases the wells were
cemented and assumed safe. For the Montara blowout this was the only barrier in the well,
while for the Deepwater Horizon blowout a series of human and technical failures caused the
well to blow out.
Further, one well release was caused by trapped gas. Gas was trapped below the annular BOPs
after an EDS situation. While circulating gas out, a leak occurred at the shale shakers, causing
an accumulation of gas below the rig floor area, which was followed by an explosion and fire.
Of the secondary barrier failures for the drilling LOWC events Failed to close BOP occurred
six times. Two events were categorized as blowout (surface flow), the Deepwater Horizon (ID
611) where the BOP did not close is one. The other was an incident where the LMRP (Lower
Marine Riser Package) spuriously disconnected, and thereby was unable to operate the BOP
(ID 464). For a diverted well release the BOP was closed late, after gas had reached the riser.
For the three well releases also the BOP was closed late allowing a limited release of
hydrocarbons.
For one blowout (surface flow), the BOP developed a leak in the annular preventer during well
control operations.
For two blowout (surface flow), the BOP was not in place. It was removed to install a casing
seal.
For one incident, they failed to close the drill string safety valve (kelly valve) and the BOP did
not have a blind shear ram.
Otherwise, wellhead and casing head failed for three blowout (surface flow) LOWC events.
This equipment is below the BOP, so when this equipment fails the well cannot be closed in by
the BOP.
In addition poor cement, inner casing failed, and formation breakdown have been listed as
secondary barrier for blowout (surface flow) LOWC events.
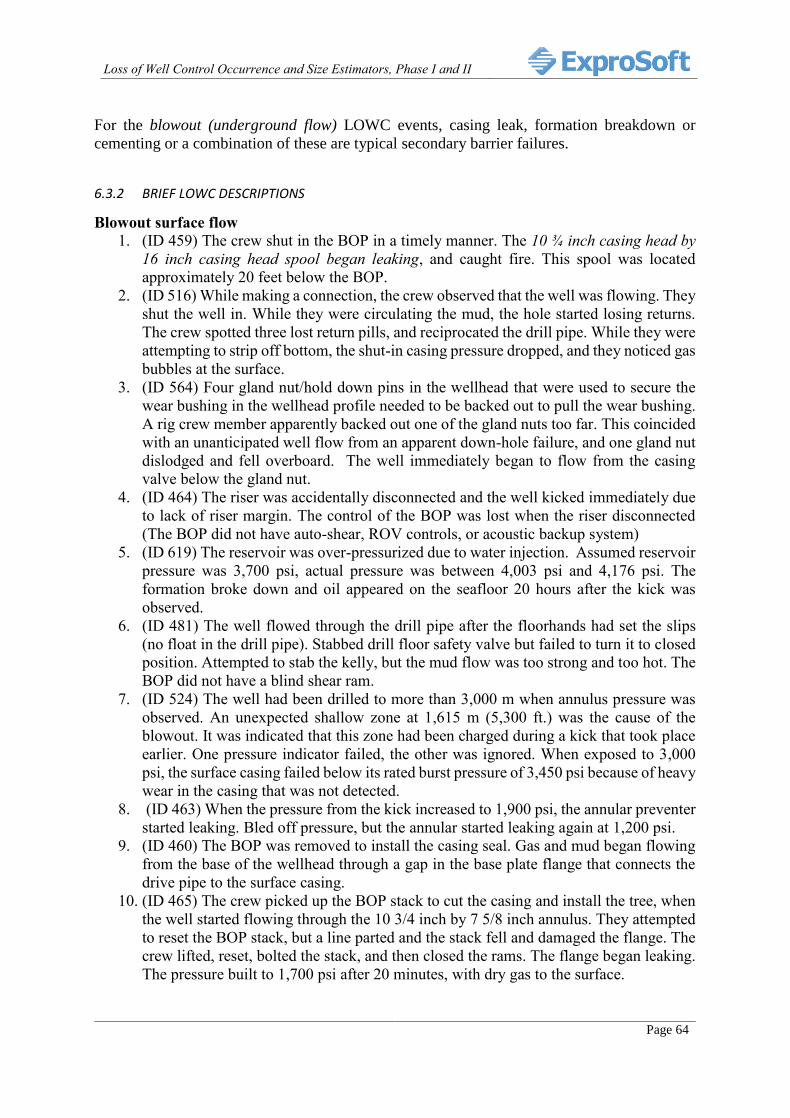
Loss of Well Control Occurrence and Size Estimators, Phase I and II
Page 64
For the blowout (underground flow) LOWC events, casing leak, formation breakdown or
cementing or a combination of these are typical secondary barrier failures.
6.3.2 BRIEF LOWC DESCRIPTIONS
Blowout surface flow
1. (ID 459) The crew shut in the BOP in a timely manner. The 10 ¾ inch casing head by
16 inch casing head spool began leaking, and caught fire. This spool was located
approximately 20 feet below the BOP.
2. (ID 516) While making a connection, the crew observed that the well was flowing. They
shut the well in. While they were circulating the mud, the hole started losing returns.
The crew spotted three lost return pills, and reciprocated the drill pipe. While they were
attempting to strip off bottom, the shut-in casing pressure dropped, and they noticed gas
bubbles at the surface.
3. (ID 564) Four gland nut/hold down pins in the wellhead that were used to secure the
wear bushing in the wellhead profile needed to be backed out to pull the wear bushing.
A rig crew member apparently backed out one of the gland nuts too far. This coincided
with an unanticipated well flow from an apparent down-hole failure, and one gland nut
dislodged and fell overboard. The well immediately began to flow from the casing
valve below the gland nut.
4. (ID 464) The riser was accidentally disconnected and the well kicked immediately due
to lack of riser margin. The control of the BOP was lost when the riser disconnected
(The BOP did not have auto-shear, ROV controls, or acoustic backup system)
5. (ID 619) The reservoir was over-pressurized due to water injection. Assumed reservoir
pressure was 3,700 psi, actual pressure was between 4,003 psi and 4,176 psi. The
formation broke down and oil appeared on the seafloor 20 hours after the kick was
observed.
6. (ID 481) The well flowed through the drill pipe after the floorhands had set the slips
(no float in the drill pipe). Stabbed drill floor safety valve but failed to turn it to closed
position. Attempted to stab the kelly, but the mud flow was too strong and too hot. The
BOP did not have a blind shear ram.
7. (ID 524) The well had been drilled to more than 3,000 m when annulus pressure was
observed. An unexpected shallow zone at 1,615 m (5,300 ft.) was the cause of the
blowout. It was indicated that this zone had been charged during a kick that took place
earlier. One pressure indicator failed, the other was ignored. When exposed to 3,000
psi, the surface casing failed below its rated burst pressure of 3,450 psi because of heavy
wear in the casing that was not detected.
8. (ID 463) When the pressure from the kick increased to 1,900 psi, the annular preventer
started leaking. Bled off pressure, but the annular started leaking again at 1,200 psi.
9. (ID 460) The BOP was removed to install the casing seal. Gas and mud began flowing
from the base of the wellhead through a gap in the base plate flange that connects the
drive pipe to the surface casing.
10. (ID 465) The crew picked up the BOP stack to cut the casing and install the tree, when
the well started flowing through the 10 3/4 inch by 7 5/8 inch annulus. They attempted
to reset the BOP stack, but a line parted and the stack fell and damaged the flange. The
crew lifted, reset, bolted the stack, and then closed the rams. The flange began leaking.
The pressure built to 1,700 psi after 20 minutes, with dry gas to the surface.

Loss of Well Control Occurrence and Size Estimators, Phase I and II
Page 65
11. (ID 550) The casing hanger lock down dogs blew out of the port/forward quadrant of
the 16" wellhead, giving an uncontrolled release of mud, water, and cement through a
1 1/4" threaded port to a distance of 50-75' out away from the rig.
12. (ID 611) There was a bad cement job and a failure of the shoe track barrier at the bottom
of the well, which let hydrocarbons from the reservoir into the production casing. There
were failures in well control procedures and in the blowout preventer so the BOP failed
to close. The kick was not detected before the well flowed to the drill floor.
13. (ID 590) The H1 Well was left in an unprotected state (and relying on an untested
primary barrier) while the rig proceeded to complete other planned activities as part of
batch drilling operations at the Montara wellhead platform. When the downhole barrier
failed, the well started to flow.
Underground blowout
14. (ID 629) Five days after a kick was experienced an underground flow was observed.
The 18" liner seal failed and the cement between the surface liner and conductor failed.
Diagnostic procedures indicated an underground migration from the bottom of the well
(8,261 feet) to another sand formation at approximately 1,100 feet. Only gas flowed.
15. (ID 605) This is an incident with very limited information. It was reported by MMS in
2008.
16. (ID 622) Production casing shoe set at 2,829 m. Drilled into gas bearing formation and
a gas kick was recorded at 4,602 m. Well was shut in and the formation 100 m below
the shoe broke down - underground blow out. Well control operations were complicated
by hydrate blockage in the choke and kill lines and drill pipe. The well was P&A after
38 days.
17. (ID 580) They were logging while drilling (LWD) when an underground gas flow
occurred in the well. Well depth 19,820 ft. TVD
Diverted well release
18. (ID 608) The kick was not detected before the gas was in the riser. The BOP was
therefore closed late. The diverter was closed and the riser gas with some mud was
diverted overboard.
Well release
19. (ID 595) They were circulating out a kick and seemed to have control. Observed the
well through choke, well static, annular was opened and a 2nd bottoms up was
circulated, an increase in flow was observed as bottoms up came up. The BOP was
closed too late and the gas expansion at surface dislodged the hole cover.
20. (ID583) An emergency disconnect due to a blackout caused the loss of station keeping.
Upon returning to the well, it was confirmed that gas was trapped below the BOP. While
circulating gas out, a leak occurred at the shale shakers, causing an accumulation of gas
below the rig floor area, which was followed by an explosion and fire. Personnel
ignored the gas alarms in the shale shaker area.
21. (ID 538) While drilling a kick was detected. When the well was considered stabilized
the annular was opened and circulating a gas bubble entered the riser and it was
necessary to put the well on the diverter. This resulted in the discharge of approximately
160 barrels (bbl.) of drilling fluid into offshore waters. Of the 160 bbl. discharged, it is
estimated that approximately 11 bbl. was entrained crude oil.
22. (ID 532) When drilling out cement plug that was set between 180 and 300 meters inside
the 10 3/4" casing. The bit depth at the time of the incident was 214 m. During the above

Loss of Well Control Occurrence and Size Estimators, Phase I and II
Page 66
operation using a 9 ½" bit, and after having just made a connection, the driller was about
to continue with drilling out the cement, when the drill string was hydraulically forced
out of the hole. This resulted in the drill pipe being buckled in the derrick between the
top drive and the rotary table.
23. (ID 645) The rig had been drilling at a depth of 15,902 feet and increasing the weight
of the mud in the well from 11.8 ppg. to 12.0 ppg. when the incident occurred. The crew
first recognized the gas influx when the flow out of the well increased by 41%. The kick
was already in the riser. An influx of approximately 238 barrels was detected within
two minutes. The drill crew spaced out the drill pipe and shut the well in utilizing the
Upper Annular. During the kick, it was estimated that a total of 55 barrels of mud had
been discharged onto the rig floor.
24. (ID 502) The drill string penetrated a salt body, which caused a kick. During kill
operations a sudden discharge of drilling fluid occurred, resulting in synthetic fluid
being discharged into the water.
6.4 HUMAN ERRORS IN DEEP ZONE DRILLING LOWC EVENTS
The human role is considered important in the occurrence and development of LOWC events..
Human errors are believed to have contributed to many of the incidents without being explicitly
stated in the information source. The skill of the personnel and proper procedures and practices
will always be important.
Of the 24 “deep” LOWC events in the US GoM OCS and the regulated areas human errors
involved have been investigated. Table 6.5 shows the human errors involved in deep well
drilling LOWC events, alongside the time from the kick is observed until the fluids are flowing
from the well.

Loss of Well Control Occurrence and Size Estimators, Phase I and II
Page 67
Table 6.5 Human errors in deep zone drilling LOWC events (2000–2015, US GoM OCS and the regulated areas)
LOWC ID Time from kick to event Human Error
459 Unknown Unknown
463 > 6 hrs.
The casing was not centralized, and could not be worked during cementing because the brakes on the draw works overheated while running the casing. After the cementing job was complete, the crew's calculations indicated channeling.
460 Unknown Unknown
465 0 No obvious
550 0 No obvious
516 1 day Unknown
564 0 Yes removed gland nut/hold down pin from the wellhead flange
464 0 A modification on BOP controls were carried out when the reservoir was exposed. No risk evaluation was carried out. The maintenance personnel accidentally activated the LMRP disconnect
619
20 hours from kick observed until oil was observed on the sea
surface.
No direct, but not following regulations and internal procedures, used too low kick tolerance
481 0 Failure of the driller to recognize the indications that the well was flowing when the kelly was broken from the drill string. The string safety valve (TIW) was not tested regular and could not be closed
524 5 Did not properly evaluate ditch magnet recovery of metal, probable rig misalignment
611 0 Accepted cement job that should have been rejected. Failed to observe kick before well was flowing
590 0
When the rig had departed from the well to undertake other work, not one well control barrier in the well had been satisfactorily tested and verified, and one barrier that should have been installed was missing. In other words, the well was suspended without regard to the company’s own Well Construction Standards or sensible oilfield practice.
629 5 days No obvious
605 Unknown Unknown
622 Unknown Unknown
580 Unknown Unknown
608 0 Failed to observe kick before it was in the riser
595 5 hours (assumed) Likely observed kick late, BOP closed late
583 0 Yes, seems the crew did not pay attention to gas alarm in the shale shaker area and gas was allowed to accumulate before it exploded
538 2.5 days Yes according to MMS, did not sweep stack sufficiently after kick before opening annular
532 0 Likely, seems not to have anticipated gas when drilling out shallow cement plug
645 0 Observed kick late, 55 bbl. of mud on the drill floor before the BOP was closed
502 Some hours Unknown
For 11 of the 24 drilling LOWC events the kick was not observed before fluid was flowing out
of the well. For nine LOWC events, the kick was observed in time to close in the well, and for
four it is unknown.
Many of these late observations are related to lack of attention, but some are also related to the
procedures followed. One typical example is that after the casing has been cemented and the
preset time for the cement to set has ended, the surface BOP is nippled down to cut
casing/energize casing seals. In the period the BOP is disconnected, the well starts to flow.
For some incidents the personnel have jeopardized the secondary barrier by mistake.

Loss of Well Control Occurrence and Size Estimators, Phase I and II
Page 68
For some, several human errors and poor procedures result in the LOWC event.
More human errors than those listed above have probably been present, but they have not been
reported in the source material for the LOWC events.
6.5 EQUIPMENT FAILURES IN DEEP ZONE DRILLING LOWC EVENTS
Equipment failures are frequently involved in deep zone drilling LOWC events. Table 6.6
shows the equipment failures in deep zone drilling LOWC events.
Table 6.6 Equipment failures in deep zone drilling LOWC events (2000–2015, US GoM OCS and the regulated areas)
LOWC main category
LOWC ID
Rig type Secondary barrier failure Equipment failure
Blowout (surface flow)
459 Jack-up Casing head failed The 10 ¾ inch casing head by 16 inch casing head spool began leaking
516 Semisub Poor cement Cement/casing
564 Jack-up Wellhead failed Liner hanger packer, wellhead flange
464 Semisub Failed to close BOP No (Controls disconnected by human error)
619 Drillship Formation breakdown No
481 Jack-up String safety valve failed Failed to close TIW valve, three men was not able to apply enough torque (There were no blind shear ram in the BOP, this was not a requirement)
524 Jacket Inner casing failed
The two primary gauges failed simultaneously and returned a false reading of pressure decline. Casing bursted below its rated burst pressure of 3,450 psi because of heavy wear in the casing that was not detected.
463 Jack-up BOP failed after closure The pressure increased to 1,900 psi, and the annular preventer began leaking gas
460 Jack-up BOP/diverter not in place Gas and mud began flowing from the base of the wellhead through a gap in the base plate flange that connects the drive pipe to the surface casing.
465 Jack-up BOP/diverter not in place The wellhead flange began leaking after reattaching the BOP because it was damaged during the reattach operation
550 Jack-up Wellhead failed
Casing hanger lock down dogs blew out of the port/forward quadrant of the 16" wellhead, giving an uncontrolled release of mud, water, and cement through a 1 1/4" threaded port to a distance of 50-75' out away from the rig,
611 Semisub Failed to close BOP BOP failed to shear and close, LMRP failed to disconnect
590 Jack-up Not relevant, one barrier only
Cemented casing shoe failed
Blowout (under-ground flow)
629 Jack-up Poor cement, casing leakage
18" liner seal failed, cement between the surface liner and conductor failed
605 Jack-up Formation breakdown No
622 Semisub Formation breakdown No
580 Jack-up Formation breakdown No
Diverted well release
608 Drillship Failed to close BOP No (closed late)
Well release
595 Jack-up Failed to close BOP No (closed late)
583 Drillship Failed to close BOP No (closed late)
538 Semisub Diverted - no problem No
532 Semisub Not sufficient frictional backpressure
No
645 Drillship Failed to close BOP No (closed late)
502 Jacket Unknown No

Loss of Well Control Occurrence and Size Estimators, Phase I and II
Page 69
As seen from Table 6.6 equipment failures are mostly involved in the LOWC events
categorized as blowout (surface flow). There is a large variety of equipment failures that have
been observed. The failures that occur in the wellhead or in the equipment as spools etc. below
the BOP are difficult to handle. There will be no mechanical way to close the leak in.
In less serious LOWC events, there are few equipment failures involved in deep zone drilling.

Loss of Well Control Occurrence and Size Estimators, Phase I and II
Page 70
WORKOVER LOWC EVENTS
Although most offshore blowouts occur during drilling, if disregarding the shallow drilling
incidents, approximately the same number of LOWC events occur during workovers as during
drilling (Table 4.3, page 43).
The US GoM OCS and the North Sea (UK and Norway) are mature areas. There are many
producing wells with a long history of production. These wells will from time to time need to
be worked over.
Workover blowouts typically occur in wells that are cased down to the productive zone, and
may cause severe pollution if the well control is lost. If the well blows out, the content of the
flow seen topside is dependent on whether the well is perforated in an oil, condensate, or gas
zone.
A well workover is a well overhaul/repair operation that normally involves complete or partial
pulling of the production tubing. Snubbing, coiled tubing and wireline operations are frequently
carried out as a part of the workover operation.
The primary barrier in workover operations may be the hydrostatic control of the well (killed
well), as for drilling, alternatively a mechanical barrier (live well), depending on how the
workover is carried out and the progress of the workover operation.
During workovers, a productive zone is exposed nearly all the time (i.e., a flow is possible).
For drilling, a productive zone is exposed only for a short duration of the total drilling period.
Solids-free workover fluids are usually used during workovers. A mud filter cake, which
during drilling acts as a seal against the formation, will not be created. This means that during
workovers there are normally continuous losses to the formation.
In a workover, the well can be closed in with higher pressures than during drilling because
formation breakdowns on shallow casing shoes are less likely to occur.
Bullheading is a kill method that has a high success probability for workover kicks, compared
to drilling kicks.
In workovers, there is less knowledge about the casing condition, because the casing strings
have been in the well for a period, and may have deteriorated.
Normally a change in fluid density is not required to circulate out workover kicks as opposed
to drilling kicks.
7.1 WORKOVER LOWC EXPERIENCE
The experience presented in this section is based on the SINTEF Offshore Blowout Database
[7] for the period 2000–2015 worldwide. A total of 33 workover LOWC events have been
recorded. Table 7.1 lists the various installation types and incident categories where LOWC
events have been experienced.

Loss of Well Control Occurrence and Size Estimators, Phase I and II
Page 71
Table 7.1 Workover LOWC events experienced for various installation vs. main well type worldwide (2000–2015)
Installation type and main incident category
Sub category Number of LOWCs
JACKET Blowout (surface flow) Totally uncontrolled flow, from a deep zone 11
Well release Limited surface flow before the secondary barrier was activated 10
String blown out of well, then the secondary barrier 1
Total 22
JACK-UP Blowout (surface flow) Totally uncontrolled flow, from a deep zone 1
Well release Limited surface flow before the secondary barrier was activated 2
String blown out of well, then the secondary barrier 2
Total 5
SEMISUBMERSIBLE Well release Limited surface flow before the secondary barrier was activated 1
Total 1
TENSION LEG Blowout (surface flow) Totally uncontrolled flow, from a deep zone 1
Total 1
BARGE Well release Limited surface flow before the secondary barrier was activated 2
Total 2
UNKNOWN Well release Limited surface flow before the secondary barrier was activated 1
Unknown Unknown 1
Total 2
TOTAL ALL 33
Table 7.1 shows that 67% of the workover LOWC events occurred on jackets, while 15%
occurred on jack-ups. The remaining 18% occurred on semisubmersibles, tension leg, barges
and unknown.
Of the 33 workover LOWC events, 13 were classified as blowout (surface flow).
Table 7.2 shows the countries and the years the various workover LOWC events occurred.

Loss of Well Control Occurrence and Size Estimators, Phase I and II
Page 72
Table 7.2 Countries where workover LOWC events were experienced world-wide (2000–2015)
Year Country Number of LOWCs
2000 US California OCS 1
2001
Brunei 1
UK 1
US GoM OCS 3
2002 US Alaska State 1
US GoM OCS 1
2003 US GoM OCS 1
2004
Norway 1
UK 1
US California OCS 1
US GoM OCS 1
2006 US GoM OCS 1
2007 UK 2
US GoM OCS 3
2008 US GOM State Waters 1
US GoM OCS 3
2009 US GoM OCS 1
2010 Netherlands 1
US GOM State Waters 1
2011 US GoM OCS 2
2012 US GoM OCS 3
2013 US GoM OCS 1
2014 US GoM OCS 1
Total 33
Table 7.2 shows that 64 % (21) of the workover LOWC events occurred in the US GoM OCS,
and the remaining 12 in the rest of the world.
Figure 7.1 shows the annual workover LOWC frequency per well year in service (injectors and
producers) and the associated regression lines for workover LOWC events from 2000–2015.

Loss of Well Control Occurrence and Size Estimators, Phase I and II
Page 73
Figure 7.1 Annual frequency for workover LOWC events and the associated regression line
Figure 7.1 shows that there is a large variation from year to year. It cannot be concluded that
there is any statistical significant trend. The trend line indicates that there is no trend. The
statistical uncertainties increases during the period due to a reduction in active wells.
Table 7.3 presents the operations and activities in progress when the workover LOWC events
occurred.
0,0000
0,0002
0,0004
0,0006
0,0008
0,0010
0,0012
0,0014
0,0016
2000 2002 2004 2006 2008 2010 2012 2014
Freq
uen
cy p
r w
ell y
ear
in s
ervi
ce
Year
Workover LOWC annual frequency, per well year in service (producers and injectors), US GoM OCS, UK and Norway
5% conf limit Estimate 95% conf limit Linear (Estimate)

Loss of Well Control Occurrence and Size Estimators, Phase I and II
Page 74
Table 7.3 Operations and activities in progress when the workover LOWC events occurred (2000–2015 worldwide)
Area Main category
Operation Pull well
equip.
Aband-on well
Coil tub-ing
Install equip.
Circu-lating
Perfor-ating
Snub-bing
Run cas-ing
Temp. plug-ged
Wire-line
Unk-nown Total Activity
US GoM OCS
Blowout (surface flow)
Pull tubing 2 2
Cleaning well 1 1 2
Pull coiled tubing 1 1
Coiled tubing operations 1 1
Other 2 2
Unknown 1 1
Total 2 4 2 1 9
Well release
Actual drilling 1 1
Circulating 1 1
Install BOP 1 1
Pull/drill out well plugs 2 1 3
Pull tubing 1 2 3
Cleaning well 1 1
Run wireline 1 1
Run coiled tubing 1 1
Total 3 4 2 1 2 12
Total 5 8 4 1 1 2 21
UK & Norw-egian waters
Blowout (surface flow)
Pulling casing 1 1
Total 1 1
Well release
Pulling casing 1 1
Pull/drill out well plugs 1 1
Pull tubing 2 2
Total 3 1 4
Total 4 1 5
Rest of the world
Blowout (surface flow)
Tripping out 1 1
Circulating 1 1
Maintenance surface equipment
1 1
Total 1 1 1 3
Unk-nown
Stimulating 1 1
Total 1 1
Well release
Pull/drill out well plugs 1 1
Snubbing in 1 1
Maintenance surface equipment
1 1
Total 1 1 1 3
Total 2 2 1 1 1 7
Total 11 8 4 2 1 1 1 1 1 2 1 33
From Table 7.3, it can be seen for 11 of the workover LOWC events the operation was pulling
well equipment. Eight of the LOWC events were related to abandoning the well and four related
to coil tubing operations. Also for at least three of the incidents, where the operations were
abandon well or coil tubing, they were actually pulling equipment from the well when the
incident occurred. Several of the incidents, where the operation was abandon well, occurred in
old wells that had been temporary abandoned or plugged for longer periods.
For the US GoM OCS nine of the 21 LOWC events were categorized as blowout (surface flow).
The remaining 12 were categorized as a well release. For Norway and UK one of the workover
LOWC events was categorized as a blowout (surface flow). The remaining 11 were categorized

Loss of Well Control Occurrence and Size Estimators, Phase I and II
Page 75
as a well release. For the rest of the world three were categorized as blowout (surface flow),
three as a well release, and one was categorized as unknown.
7.2 WORKOVER LOWC CAUSES
This section focuses on the causes of the workover LOWC events. Since two barriers normally
should be present during workover, this section is focused on the causes of losing the primary
barrier and the secondary barriers. The primary barrier in workover operations may be the
hydrostatic control of the well (killed well) or a mechanical barrier (live well), depending on
how the workover is carried out and the progress of the workover operation.
7.2.1 LOSS OF THE PRIMARY AND SECONDARY BARRIERS
When the well is controlled by the hydrostatic pressure, the loss of the primary barrier is a well
kick. As for drilling incidents, it is important to detect the well kick as soon as possible in order
to close in the well with a minimum influx. If the secondary barrier fails to activate, or activates
late, a workover LOWC event will occur.
Table 7.4 lists the experienced primary and secondary barrier failure causes for the workover
LOWC events in the US GoM OCS and the regulated areas (Norway, UK, the Netherlands,
Canada East Coast, Australia, US Pacific OCS, Denmark, and Brazil).

Loss of Well Control Occurrence and Size Estimators, Phase I and II
Page 76
Table 7.4 Primary and secondary barrier failure causes for workover LOWC events in the US GoM OCS and the regulated areas.
Primary barrier failure Secondary barrier failure LOWC
Id Well
Status
Install-ation type
No. of LOWCs
Blowout (surface flow)
Too low hyd. head
Too low mud weight String safety valve not available 621 Killed Jacket 1
Tubing leak and casing leak 591 Killed Jacket 1
Annular losses Wellhead failed 539 Killed Jacket 1
Unknown why String safety valve not available 480 Killed Jacket 1
Swabbing Casing leakage 542 Killed Tension leg 1
Unexpected high well pressure
Failed to close BOP 520 Killed Jacket 1
Tubing to annulus leakage Wellhead failed 525 Live Jacket 1
Outer casing an inner casing failed 631 Live Jacket 1
SCSSV/storm choke failure X-mas tree failed and casing leakage 606 Live Jacket 1
Tubing to annulus leak and casing leak 593 Live Jacket 1
Unknown Casing leakage 613 Killed Jacket 1
Total 11
Well release
Too low hyd. head
Trapped gas Failed to close BOP
571 Killed Semisub 1
576 Killed Barge 1
627 Killed Jacket 1
477 Killed Jack-up 1
Unknown why BOP failed after closure (coil tubing) 623 Killed Jacket 1
Swabbing Unknown 597 Killed Jacket 1
SCSSV/storm choke failed X-mas tree failed 643 Live Jacket 1
Unexpected high well pressure Failed to close BOP 598 Killed Jacket 1
620 Killed Jack-up 1
Tubing plug failure Wireline BOP/ lubricator failed 585 Live Jacket 1
Failed to close BOP 475 Killed Jacket 1
Snubbing equipment failure Failed to close BOP 618 Live Unknown 1
Packer plug failure Failed to close BOP 531 Killed Jacket 1
Tubing parted Failed to close BOP 558 Live Jacket 1
574 Killed Jack-up 1
Tubing to annulus leakage Failed to close BOP 584 Live Jack-up 1
SCSSV/storm choke failure X-mas tree failed 478 Live Jacket 1
Snubbing equipment failure Outer casing failed 506 Live Jacket 1
Total 18
Total all 29
The individual LOWC events are commented a bit further down. Here are some overall findings
discussed.
Blowout (surface flow)
Loss of the primary barrier
For six of the 11 blowout (surface flow) LOWC incidents the hydrostatic pressure became too
low.
Four of the blowout (surface flow) LOWC incidents occurred in live wells being worked over.
For two of them the tubing leaked and for two the SCSSV leaked. The last incident occurred
in a temporary abandoned well that they were working over to permanently plug. The cause of
the primary barrier failure is unknown.
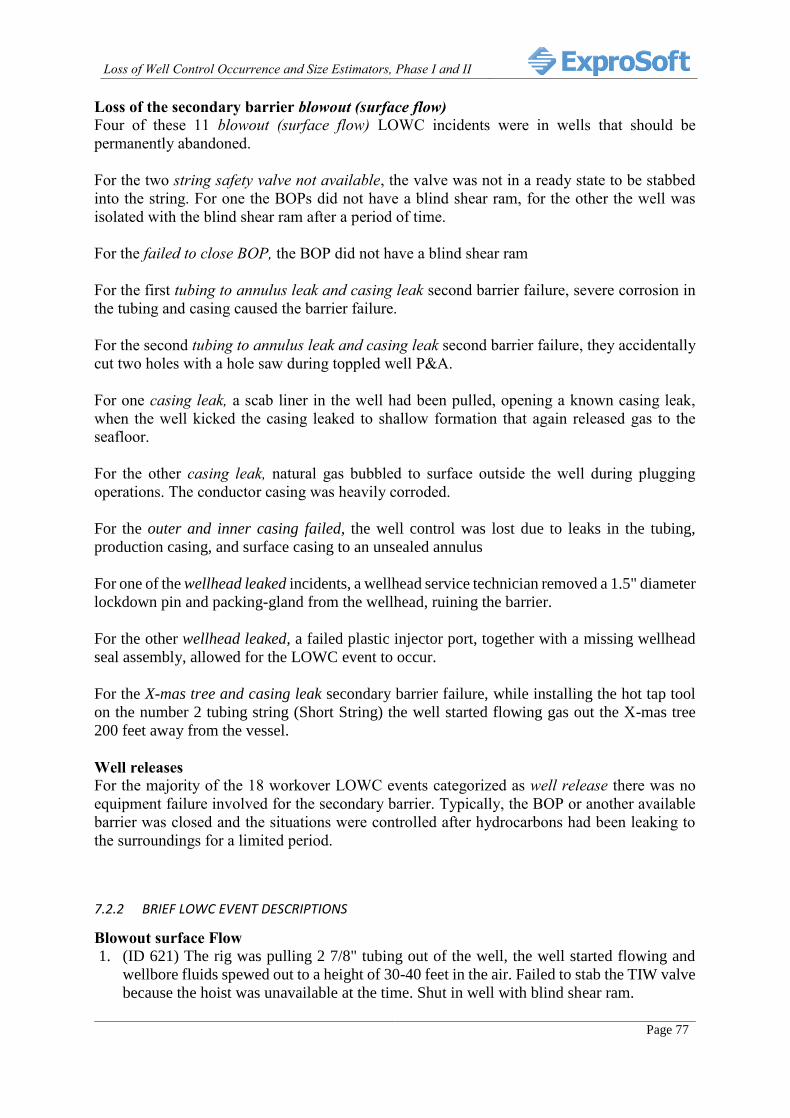
Loss of Well Control Occurrence and Size Estimators, Phase I and II
Page 77
Loss of the secondary barrier blowout (surface flow)
Four of these 11 blowout (surface flow) LOWC incidents were in wells that should be
permanently abandoned.
For the two string safety valve not available, the valve was not in a ready state to be stabbed
into the string. For one the BOPs did not have a blind shear ram, for the other the well was
isolated with the blind shear ram after a period of time.
For the failed to close BOP, the BOP did not have a blind shear ram
For the first tubing to annulus leak and casing leak second barrier failure, severe corrosion in
the tubing and casing caused the barrier failure.
For the second tubing to annulus leak and casing leak second barrier failure, they accidentally
cut two holes with a hole saw during toppled well P&A.
For one casing leak, a scab liner in the well had been pulled, opening a known casing leak,
when the well kicked the casing leaked to shallow formation that again released gas to the
seafloor.
For the other casing leak, natural gas bubbled to surface outside the well during plugging
operations. The conductor casing was heavily corroded.
For the outer and inner casing failed, the well control was lost due to leaks in the tubing,
production casing, and surface casing to an unsealed annulus
For one of the wellhead leaked incidents, a wellhead service technician removed a 1.5" diameter
lockdown pin and packing-gland from the wellhead, ruining the barrier.
For the other wellhead leaked, a failed plastic injector port, together with a missing wellhead
seal assembly, allowed for the LOWC event to occur.
For the X-mas tree and casing leak secondary barrier failure, while installing the hot tap tool
on the number 2 tubing string (Short String) the well started flowing gas out the X-mas tree
200 feet away from the vessel.
Well releases
For the majority of the 18 workover LOWC events categorized as well release there was no
equipment failure involved for the secondary barrier. Typically, the BOP or another available
barrier was closed and the situations were controlled after hydrocarbons had been leaking to
the surroundings for a limited period.
7.2.2 BRIEF LOWC EVENT DESCRIPTIONS
Blowout surface Flow
1. (ID 621) The rig was pulling 2 7/8" tubing out of the well, the well started flowing and
wellbore fluids spewed out to a height of 30-40 feet in the air. Failed to stab the TIW valve
because the hoist was unavailable at the time. Shut in well with blind shear ram.

Loss of Well Control Occurrence and Size Estimators, Phase I and II
Page 78
2. (ID 591) While conducting P/A operations the well kicked when washing the perforations.
Holes in the tubing and all of the casing strings had developed from corrosion, which in
turn exposed the gas with oil to open atmosphere. The weight of the system was overrated
for the patch job and the patch failed.
3. (ID 539) A wellhead service technician removed a 1.5" diameter lockdown pin and
packing-gland from the wellhead. Removal of this pin circumvented the blowout
prevention system (BOP) and provided an exit point for wellbore fluids. While doing so
they stopped pumping seawater for a 20 - 40 minutes period. Losses caused the well to
kick. Gas and oil were released. Seawater was pumped into the well at a high rate through
the kill line. After approximately 2.5 hours, the rate of leakage subsided enough to allow
the installation of a valve assembly into the 1.5" opening.
4. (ID 480) While washing over a gravel pack assembly using a 2-7/8 inch work string, the
rig crew experienced a kick. Well control operations were initiated by bullheading into the
well. Pressure rose to 4,200 psig. The pressure safety valve (PSV) located on the mud
pump relieved, allowing a mixture of formation sand, gas, oil, and completion fluid to
escape. The PSV should relieve at 5,000 psi, but relieved prematurely. The BOP did not
have a blind shear ram.
5. (ID 542) During a sidetrack in 1995, a scab liner was set due to severe casing wear and
holes in the 9 5/8" casing at 1,400m TVD. The well was worked over in 2004 due to a
tubing to annulus communication. After cutting the scab liner, they started to pull it. The
well was flow-checked several times and the well seemed static. Then they observed flow
and closed the annular preventer. The pressure increased for a short while before it fell.
They then observed losses and opened the annular preventer and pumped mud. The
pressure increased again and the BOP was closed. Gas was observed visually and by
detectors coming up from the sea. The sea surface "boiled”. After the incident, it was
estimated that the gas flow rate was 20-30 kg/s. Craters of some meters in diameter were
observed at the sea floor. They had limited amount of mud on the platform and mud supply
was impossible due to the gas flowing through the sea surface. After having mixed mud
from the available well fluid chemicals, this was pumped into the well, and the well was
stabilized.
6. (ID 520) The objective of the workover was to replace parted tubing and return the well to
production of gas from the "P" sand. The "P" sand had been pressure depleted and the
workover employed light-weight fluid. When preparations to begin recovering the tubing
down to a suspected break or part at about 1,900 ft. were initiated, high pressure was then
unexpectedly observed to be abruptly rising on the tubing and production casing annulus.
When the pressure reached approximately 6,150 psi, the tubing hanger and approximately
600 feet of tubing were suddenly ejected from the well through the BOP's. Subsequently,
the well flowed out of control through the BOP stack. Attempts to control the well with
the BOP's were unsuccessful because of the tubing lodged across the BOP stack. The BOP
stack was not equipped with blind shear rams. The flow ceased and the Well bridged over
after some hours.
7. (ID 525) The well that had been shut-in for approximately 10 year prior to the incident.
The intention was to work over the well to re-start the production from the well. Coiled
tubing equipment was rigged-up and run in hole. Nitrogen was injected down the tubing
to wash and clean out the sand. As the intended target depth was neared, the well started
to flow. Wellhead pressure rapidly rose to 2,300 psi after the choke manifold was closed.
Thereafter nitrogen was observed leaking from around the wellhead, below the BOP stack.
The injection fitting port on the wellhead that is used to inject a plastic energizer for the
wellhead seal assembly failed. The failed port, together with a missing wellhead seal
assembly, allowed for the LOWC event.

Loss of Well Control Occurrence and Size Estimators, Phase I and II
Page 79
8. (ID 631) During a Temporary Abandonment (TA) procedure in 2013, while attempting to
pull a tubing plug, unexpected pressure was encountered. Well control was lost due to leaks
in the tubing, production casing, and surface casing to an unsealed annulus. Light sheens
were observed before the well was killed. The well was drilled in 1970. The last production
from the well was in 1999. The well has since been plugged.
9. (ID 606) P&A operations were being conducted. The number 1 tubing string (Long String)
had been tapped and it was shut-in with 1,800 psi. While installing the hot tap tool on the
number 2 tubing string (Short String) the well started flowing gas out the X-mas tree 200
feet away from vessel. Gas was coming up out of the #1 tubing string (long string) up the
various casing strings and out the casing valves. The flow was strictly gas and no sheen.
After the gas flow ceased, the well was killed.
10. (ID 593) The wellbore was bent over near the mud line and the wellhead was inaccessible
in the structure's debris field. The casing strings and production tubing string should be hot
tapped approximately 7-10 feet below the mudline in an excavation surrounding the well.
Successfully installed the 4-inch hole-saw and began to saw a 4-inch hole in the 7 5/8 inch
casing. By accident, he cut into the 2 7/8 inch production tubing. He then observed
uncontrolled gas bubbling from the hole-saw apparatus. This created a gas plume
approximately 30 feet in diameter at the surface. Hot tapped the 2 7/8 inch production
tubing and pumped 8.6 ppg. seawater into the production tubing until the well was killed.
11. (ID 613) Conductor casing corroded. Well had not been in production for 21 years when
the operator was in the process of permanently plugging its associated non-producing
natural gas wells when workers spotted what appeared to be natural gas bubbling to the
surface near the platform. Bubbling and discolored water near the platform was observed,
possibly a mixture of sediment from the ocean floor, gas, and formation water. Oil was not
believed to be present other than in small amounts of condensate. Well control procedures
from the platform were successful in stopping the flow of natural gas from the well.
Well release
12. (ID 571) Whilst pumping up, at 400 psi, the seal assembly prematurely released and
unexpected gas behind the seal assembly evacuated the seawater in the riser on to the drill
floor. There was a fire at the riser/rotary table interface, which lasted for between 2 and 5
minutes. The well was shut in and the rig floor deluge was activated.
13. (ID 576) When retrieving an RTTS packer a gas bubble had formed below the packer,
which was set at 500 ft. measured depth. When the packer was released, the trapped gas
was released, pushing the 9.1 ppg. workover fluid above it through the rotary. Closed the
annular preventer.
14. (ID 627) Cut the tubing string above the DX plug. Ran an overshot. Several attempts were
made to open the equalizing port on the DX plug using wireline tools. Reports indicated,
in error, that the equalizing ports had opened and pressure was equalized above and below
the plug. They then failed to pull plug free from the profile. An external cutter was run to
cut the tubing below the DX plug. After approximately 4 minutes of cutting, the tubing
parted and the well began to flow resulting in the work string being ejected from the well.
The annular and pipe rams were closed in order to bring the well under control.
Approximately 809 feet of work string had been ejected before the blind shear rams were
closed and the work string sheared.
15. (ID 477) The driller began pulling on the tubing and working the pipe up and down.
Eventually the tubing parted, and 500 feet of tubing and the master bushing from the rotary
table were blown from the hole into the derrick. The crew evacuated the rig floor, and
activated the BOP from a remote location. The well was shut-in by closing the blind rams.

Loss of Well Control Occurrence and Size Estimators, Phase I and II
Page 80
The crew commenced well control operations. The BOP had no shear ram, but that did not
affect the result of the incident.
16. (ID 623) During Coil tubing (CT) operations the well started venting gas near the bottom
of the CT injector allowing the 6,850 psi of well pressure to escape around the CT pipe
without restriction. BOP was closed to seal off the well. When picking the pipe up to clear
stripper, the stripper rubber was coming out in pieces with it, indicating that the stripper
had lost seal integrity and become gas cut leading to the unwanted release of well pressure.
17. (ID 597) While pulled out of hole with 5 ½" completion with 9 5/8" packer the packer
pulled tight and began swabbing fluid. Oil was noticed on top of the header box and trip
tank. The trip tank level was kept down to contain the slight amount of oil. Pumped down
5 ½" tubing 5 bpm, 0 psi. Shut down pumping operation, continued to pull 5 ½ " tubing.
A quantity of gas and approximately 5 bbl. water/oil mixture, (estimated approximately
10% oil) released onto BOP deck area.
18. (ID 643) A dynamic positioned offshore supply vessel had a cement pump staged on board
that was connected to the well production tree with rigid high pressure lines. The vessel
lost station keeping while conducting well operations. There were no emergency
disconnect coupling within the piping from the vessel to the well that would allow a quick
disconnect. As the vessel moved off location, the well production tree was severed at the
wellhead flange and fell overboard. The well was secured by closing the downhole safety
valve and by installing a temporary flange cap on the tubing head. An estimated area of
300 ft. by 50 ft. of oil was spilled into the offshore waters.
19. (ID 598) While milling out a bridge plug on a well, without warning, the drill pipe
instantaneously and uncontrollably ascended out from the well. A section of drill pipe
parted. The two sections of drill pipe were locked in place with one section being attached
to the top drive and the other remaining on the hole. It was estimated that 18 meters pipe
was forced up the hole. As this well was a plugged and cemented previous water injector
well, there was no release of hydrocarbons. The BOP was closed after some pipe had blown
out of the well.
20. (ID 620) The well had been temporarily abandoned (TA) in two years prior to the re-entry
to begin P&A operations. All existing plugs, including the surface plug, were successfully
tested. During the P&A operations, pressure encountered below the bridge plug, ejected
385 feet of work string and the bottom-hole assembly out of the wellbore before the blind
shear rams of the BOP sealed the well.
21. (ID 585) A wireline BOP and lubricator were ejected from the wellhead into the Gulf of
Mexico during an attempt to retrieve a wireline DX plug from the production tubing. The
accident resulted in severe facial injuries to the wireline operator. The plug was set at 505
ft.
22. (ID 475) The crew experienced an uncontrolled flow from the well after releasing a bridge
plug during a well workover operation. The flow lasted about 20 seconds, and consisted of
approximately 10 barrels of water and 15 barrels of oil. About one gallon of oil sprayed
overboard. The BOP was used to shut-in the well.
23. (ID 618) During snubbing operations of a velocity string into a live well, the string was
ejected from the well and landed vertically 4 m from the hydraulic workover tower. The
pipe penetrated the helideck side netting, passed through two grating decks, struck a
structural member and main deck plating and then ruptured a methanol injection flange
outlet on the gas export pipeline, which resulted in an uncontrolled gas release.
24. (ID 531) Tubing was cut @ 17,130 ft. when pulling tubing freed and picked up 18 ft. when
fluid influx commenced. The annular BOP was closed, but fluids escaped to drill floor with
delay in activating internal top drive BOP. The internal BOP was closed and well made

Loss of Well Control Occurrence and Size Estimators, Phase I and II
Page 81
safe. It appear that the tubing was not completely cut and during the pulling process, a
packer was pulled. This resulted in brine release into the derrick.
25. (ID 558) The tubing was being stripped out of the hole by using a hydraulic rig (casing
jacks) when the tubing became stuck. An attempt was made by the operator representative
to pull the tubing when the tubing parted. The parted tubing was forced upward, causing
the top slips to be ejected from the top bowl of the casing jacks. The ejected slips fatally
struck the operator representative as he attempted to evacuate the immediate area. The well
was then secured by closing the BOP's from the accumulator control unit.
26. (ID 574) Began operations of pulling on the production tubing in an attempt to pull the
seals from the production packer located at 10,830 feet. The hanger pulled free of the
wellhead with 54 kips. Pulling continued to 80 kips (string weight) and stopped. Pulling
continued at 10 kips increments up to 110 kips and stopped. The seals were anticipated to
release between 83 to 85 kips. When the seals failed to release the operator began working
the pipe from 60 kips to 110 kips with no success. When the operator pulled 120 kips and
stopped, the tubing parted at a depth of approximately 4,300 feet. Because the tubing parted
at 4,300 feet, there was not enough hydrostatic head to contain the well bore pressure. The
4,300 feet of tubing was being ejected when the BOP was activated, closing the pipe rams
and the annular preventers, thus stopping the ejection of tubing and containing the pressure
in the annulus. The BOP did not have a blind shear ram.
27. (ID 584) Immediately after perforating the long string tubing well began to flow through
the BOPs. Flow could not be controlled through dual rams. Decision was made to close
blind shear rams to shut in the well. Sheared off 2 strings of 2 3/8-inch 4.7lbs tubing;
electric line and perforation gun left in long string. Rams could not seal around dual string
due to SCSSV control lines.
28. (ID 478) The subsurface safety valve was leaking when testing the valve. Thinking that
the valve had trash in it, the crew pumped five barrels of water downhole to clean the valve.
The supervisor instructed the crew to cycle the valve three times and close it. At this time,
the valve appeared to hold. When the coil tubing bottom hole assembly (BHA) was
lowered into the well, the BHA tagged the closed surface safety valve, which was closed
by mistake. When the surface safety valve was opened, the BHA was blown out of the
lubricator and into the water. It was later determined that the surface safety valve was
cycled three times and then closed instead of the subsurface safety valve. This led the
supervisor to believe that the subsurface safety valve was holding. After the incident, the
operators discovered that the needle valve on the subsurface safety valve was closed. The
control line had pressure on it, so this caused the downhole valve to be blocked open.
29. (ID 506) The crew was rigging up a snubbing unit on a dual completion wellhead in
preparation to plug and abandon the well when the surface casing failed to support the
weight of the BOP stack and collapsed. This resulted in the wellhead shifting downward
10 to 16 inches causing the dual crossover offset spool to crack at the weld. One of the
completions was blinded off prior to nippling up the BOP stack, but the other was open.
Because of the crack in the spool, there was a release of less than one gallon of fluid lasting
approximately 30 seconds. The crew secured the well by closing the secondary lower
master valve. Investigation showed that the surface casing failed due to corrosion.
7.3 HUMAN ERRORS IN WORKOVER LOWC EVENTS
The human role is considered important in the occurrence and development of LOWC events.
Human errors are believed to have contributed to many of the incidents without being explicitly
stated in the information source. The skill of the personnel and proper procedures and practices
will always be important.

Loss of Well Control Occurrence and Size Estimators, Phase I and II
Page 82
Of the 29 workover LOWC events in the US GoM OCS and the regulated areas, human errors
have been investigated. Table 7.5 shows the human errors involved in workover LOWC events,
alongside the time from the kick is observed until the fluids are flowing from the well. It has
also been noted if the well was controlled by a hydrostatic pressure (killed) or if the well was
live when the LOWC events occurred.
Table 7.5 Human errors in workover LOWC events (2000–2015, US GoM OCS and the regulated areas)
LOWC ID
Well Status
Time from kick to event
Human Error
Blowout (surface flow)
621 Killed 0
Failed to maintain the proper mud weight of 9 ppg. to control the well. (Mud Engineer noticed condensate or oil mixed with the returns in the trip-tank but failed to stop the operation or re-weigh the mud entering the well as 2 7/8" tubing was being pulled.) The TIW valve was not in the ready state to be stabbed due to the unavailability of the hoist
591 Killed Unknown No obvious
539 Killed 0 Removed tubing hanger lock down pins (jeopardized the secondary barrier, and stopped pumping seawater (caused the kick).
480 Killed 8 hours The TIW valve was not ready to be stabbed
542 Killed 6 hours
The non-conformities relate to failure on the part of both individuals and groups in company and with the drilling contractor. The non-conformities occurred at several levels in the organization on land and on the facility. A scab-liner had sealed the leak in the casing. When pulling the scab-liner the leak was re-opened (secondary barrier).
520 Killed 0 No obvious
525 Live a short
while, not immediately
(1) failure to inspect and maintain equipment, (2) failure to conduct a Job Safety Analysis (JSA) for workover activities, (3) failure to provide clear and specific instructions to contracted personnel, and (4) failure to communicate with the contracted operator of the lease.
631 Live 0
Failure to research all wellbore and well production records to determine wellbore conditions before permitting the abandonment work. A site specific hazard analysis could have prevented this incident
Failure to confirm pressure integrity of production casing before pulling the plug. Held 300 psi external on June 27, 2013.
Lack of communication between all parties involved including contractor to contractor, contractors and company men, company men and ERT staff, ERT and BSEE.
Lack of clear supervisory authority
606 Killed 0 No obvious
593 Live 0 Should have stopped work due to uncertainty related to hole saw cutting depth
613 Killed 0 No obvious
Well releases
571 Killed 0 No obvious
576 Killed 0 Yes, should have closed annular preventer prior to releasing the RTTS packer
627 Killed 0 Yes, failed to realize the pressure over the DX plug was not equalized
477 Killed 0 Torn off tubing
623 Killed 0 No obvious
597 Killed Unknown Unknown
643 Live 0 No obvious
598 Killed 0 Unknown
620 Killed 0 The Operator did not take additional precautions, such as, conducting a hazard analysis for potential pressure below the plug
585 Live 0 Yes, did not equalize over plug (used wrong tool), did not test wireline BOP,
475 Killed 0 Seems they have not considered the possibility that there may be pressure below a tubing plug
618 Live 0 The investigation identified systemic failures in the management of HWO snubbing units by contractor. Major gaps were identified in equipment maintenance, operating procedures,

Loss of Well Control Occurrence and Size Estimators, Phase I and II
Page 83
LOWC ID
Well Status
Time from kick to event
Human Error
competence assurance and supervision.
531 Killed 0 Unknown
558 Live 0
The operator exceeded the yield strength of the tubing causing it to part and (calculation was wrong).
Since there were pressure in the well, a snubbing unit should have been used and not casing jacks.
The operator made operational decisions on the platform without consulting offsite managers. His decisions and actions placed the platform, personnel, and environment in constant threat from a potential loss of well control, and resulted in a brief loss of well control, pollution, and a fatal accident.
The investigation report also blames the management for lack of control
574 Killed 0 No obvious
584 Live 0 No obvious
478 Live 0
Closed wrong valve. The surface safety valve was cycled three times and then closed instead of the subsurface safety valve. This led the supervisor to believe that the subsurface safety valve was holding. The operators discovered that the needle valve on the subsurface safety valve was closed. The control line had pressure on it, so this caused the downhole valve to be blocked open
506 Live 0 No obvious
For wells that are live there will not be a kick warning. When equipment fails, well fluids are
flowing out immediately. A secondary barrier is then normally activated to end the flow to
surroundings. When the activation of the secondary barrier is successful, the LOWC event has
a short duration and it is categorized as a well release and not a blowout. Eight of the well
releases and three of the blowout (surface flow) occurred in live wells, while the remaining
occurred in killed wells.
For 14 of the 18 workover LOWC events that had the well status killed the kick was not
observed before the well was flowing out to the surroundings. For two of the remaining they
failed to control the kick after some hours of kick killing operations. For two the time from
kick to the LOWC event was unknown.
Human errors were identified in 15 of the 29 workover LOWC events. It is likely that there
have been more human errors as well but they cannot be identified from the LOWC descriptions
and data sources.
Some of the human errors are related to poor planning of the operations. The possible risks
have not been properly considered. Others are related to equipment that did not function due to
lack of maintenance or that was not accessible.
Some are also related to faulty operations, as jeopardizing a barrier by mistake, closing or
opening the wrong valve, tearing off the tubing by using too much force, not performing
operations in a safe manner. These types of events can be caused by poor planning or by
procedures not being followed.
7.4 EQUIPMENT FAILURES IN WORKOVER LOWC EVENTS
Equipment failures are frequently involved in workover LOWC events. Table 7.6 shows the
equipment failures in workover LOWC events.
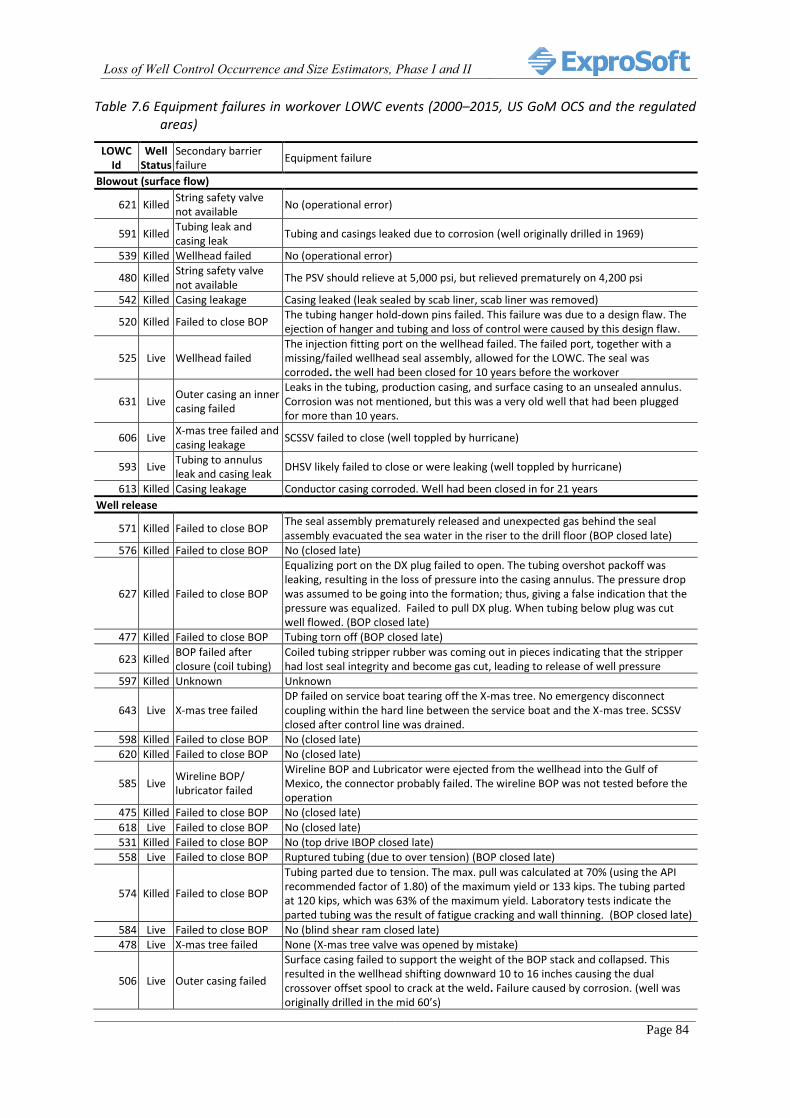
Loss of Well Control Occurrence and Size Estimators, Phase I and II
Page 84
Table 7.6 Equipment failures in workover LOWC events (2000–2015, US GoM OCS and the regulated areas)
LOWC Id
Well Status
Secondary barrier failure
Equipment failure
Blowout (surface flow)
621 Killed String safety valve not available
No (operational error)
591 Killed Tubing leak and casing leak
Tubing and casings leaked due to corrosion (well originally drilled in 1969)
539 Killed Wellhead failed No (operational error)
480 Killed String safety valve not available
The PSV should relieve at 5,000 psi, but relieved prematurely on 4,200 psi
542 Killed Casing leakage Casing leaked (leak sealed by scab liner, scab liner was removed)
520 Killed Failed to close BOP The tubing hanger hold-down pins failed. This failure was due to a design flaw. The ejection of hanger and tubing and loss of control were caused by this design flaw.
525 Live Wellhead failed The injection fitting port on the wellhead failed. The failed port, together with a missing/failed wellhead seal assembly, allowed for the LOWC. The seal was corroded. the well had been closed for 10 years before the workover
631 Live Outer casing an inner casing failed
Leaks in the tubing, production casing, and surface casing to an unsealed annulus. Corrosion was not mentioned, but this was a very old well that had been plugged for more than 10 years.
606 Live X-mas tree failed and casing leakage
SCSSV failed to close (well toppled by hurricane)
593 Live Tubing to annulus leak and casing leak
DHSV likely failed to close or were leaking (well toppled by hurricane)
613 Killed Casing leakage Conductor casing corroded. Well had been closed in for 21 years
Well release
571 Killed Failed to close BOP The seal assembly prematurely released and unexpected gas behind the seal assembly evacuated the sea water in the riser to the drill floor (BOP closed late)
576 Killed Failed to close BOP No (closed late)
627 Killed Failed to close BOP
Equalizing port on the DX plug failed to open. The tubing overshot packoff was leaking, resulting in the loss of pressure into the casing annulus. The pressure drop was assumed to be going into the formation; thus, giving a false indication that the pressure was equalized. Failed to pull DX plug. When tubing below plug was cut well flowed. (BOP closed late)
477 Killed Failed to close BOP Tubing torn off (BOP closed late)
623 Killed BOP failed after closure (coil tubing)
Coiled tubing stripper rubber was coming out in pieces indicating that the stripper had lost seal integrity and become gas cut, leading to release of well pressure
597 Killed Unknown Unknown
643 Live X-mas tree failed DP failed on service boat tearing off the X-mas tree. No emergency disconnect coupling within the hard line between the service boat and the X-mas tree. SCSSV closed after control line was drained.
598 Killed Failed to close BOP No (closed late) 620 Killed Failed to close BOP No (closed late)
585 Live Wireline BOP/ lubricator failed
Wireline BOP and Lubricator were ejected from the wellhead into the Gulf of Mexico, the connector probably failed. The wireline BOP was not tested before the operation
475 Killed Failed to close BOP No (closed late)
618 Live Failed to close BOP No (closed late) 531 Killed Failed to close BOP No (top drive IBOP closed late) 558 Live Failed to close BOP Ruptured tubing (due to over tension) (BOP closed late)
574 Killed Failed to close BOP
Tubing parted due to tension. The max. pull was calculated at 70% (using the API recommended factor of 1.80) of the maximum yield or 133 kips. The tubing parted at 120 kips, which was 63% of the maximum yield. Laboratory tests indicate the parted tubing was the result of fatigue cracking and wall thinning. (BOP closed late)
584 Live Failed to close BOP No (blind shear ram closed late) 478 Live X-mas tree failed None (X-mas tree valve was opened by mistake)
506 Live Outer casing failed
Surface casing failed to support the weight of the BOP stack and collapsed. This resulted in the wellhead shifting downward 10 to 16 inches causing the dual crossover offset spool to crack at the weld. Failure caused by corrosion. (well was originally drilled in the mid 60’s)

Loss of Well Control Occurrence and Size Estimators, Phase I and II
Page 85
For many of the incidents there have been equipment failures. For six of the workover LOWC
events corrosion was mentioned as the direct cause for the equipment failure. There are
probably more of the incidents where corrosion plays a role.
Some of the equipment failures are caused by human errors, as for instance over-tensioning the
tubing.
For most of the blowout (surface flow) incidents, there were equipment failures involved.
Four of the blowout (surface flow) incidents occurred in wells that they were performing plug
and abandon operations in. (LOWC Id 591, 593, 606, and 613). One well was drilled in 1969
(Id 591), two were in wells toppled by hurricane (Id 593 and 606), and one was in a well that
had been closed in for 21 years (Id 613). These are wells where the well barrier situation is
uncertain.
For Id 525 the well had been closed for 10 years before the workover, and for ID 631 the well
had been plugged for 10 years. These are also wells where the well barrier situation is uncertain.
The equipment failures experienced in workovers are to a large degree caused by aging,
especially equipment in the wells. A proper verification of the status of the well prior to the
workover, with respect to the barriers in the well, the surface barriers, in addition to an
evaluation of potential pressures in the well will always be important in workovers.

Loss of Well Control Occurrence and Size Estimators, Phase I and II
Page 86
COMPLETION LOWC EVENTS
Completion blowouts occur during well completion activities. Well completion activities
involve installing equipment or undertaking operations required to produce a well after the
drilling is completed. This usually includes preparation for and running of the production
tubing, and installation of the X-mas tree. If the wells, for instance, are gravel-packed, or are in
any other ways prepared before running the tubing, this is regarded as a part of the completion
activities.
The complexity of a well completion varies significantly; some are simple, while others are
complex. The complexity will vary from field to field and from operator to operator. Complexity
is mainly dependent on the reservoir, the oil company’s preferences and requirements, and the
government requirements.
The complexity depends on whether there are:
gravel-pack, sand screens
dual or single completions
artificial lift (now or later)
non-corrosive equipment
equipment for downhole chemical injection
dual/single downhole safety valve
annulus safety valve
multi zones
smart wells
horizontal or highly deviated wells
etc.
In this report, no distinctions have been made regarding the equipment included in the various
well completions. This is because the information required to make such distinctions is not
available and the total number of completion blowouts is low.
8.1 COMPLETION LOWC EXPERIENCE
The experience presented in this section is based on the SINTEF Offshore Blowout Database
[7] for the period 2000–2015 worldwide. Ten completion LOWC events have been identified.
Table 8.1 lists the various installation types and incident categories where LOWC events have
been experienced.

Loss of Well Control Occurrence and Size Estimators, Phase I and II
Page 87
Table 8.1 Completion LOWC events experienced for various installation vs. main well type worldwide (2000–2015)
Installation type and main incident category
Sub category Number of LOWCs
JACKET Blowout (surface flow) Totally uncontrolled flow, from a deep zone 1
Well release Limited surface flow before the secondary barrier was activated 1
Total 2
JACK-UP
Blowout (surface flow) Totally uncontrolled flow, from a deep zone 2
Total 2
SEMISUBMERSIBLE
Diverted well release Other 1
Well release Limited surface flow before the secondary barrier was activated 2
Total 3
TENSION LEG
Well release Limited surface flow before the secondary barrier was activated 2
Total 2
BARGE
Blowout (surface flow) Totally uncontrolled flow, from a deep zone 1
Total 1
TOTAL ALL 10
Table 8.1 shows that completion blowouts occur on all type of installations.
Of the 10 completion LOWC events, four were classified as blowout (surface flow), while the
remaining were classified as a well release or a diverted well release.
Table 8.2 shows the countries and the years the various completion LOWC events occurred.
Table 8.2 Countries where completion LOWC events were experienced world-wide (2000–2015)
Year Country Number of
LOWCs
2000 Mexico 1
Norway 1
2001 UK 1
US GoM OCS 1
2002 UK 1
2003 UK 1
US GoM State waters 1
2009 UK 1
US GoM OCS 1
2013 US GoM OCS 1
Total 10
Table 8.2 shows that 30 % (3) of the workover LOWC events occurred in the US GoM OCS,
40% (4) in the UK and 10% (1) in Norway. The remaining two were observed in US GoM State
waters and in Mexico.
Figure 8.1 shows the annual completion LOWC frequency per well year in service (injectors
and producers) and the associated regression lines for completion LOWC events from 2000–
2015.

Loss of Well Control Occurrence and Size Estimators, Phase I and II
Page 88
Figure 8.1 Annual frequency for completion LOWC events and the trend line
Figure 8.1 shows that there is a large variation from year to year. It cannot be concluded that
there is any statistical significant trend. The trend line indicates no trend. The statistical
uncertainties increases during the period due to a reduction in number of completions.
Table 8.3 presents the operations and activities in progress when the completion LOWC events
occurred.
Table 8.3 Operations and activities in progress when the completion LOWC events occurred (2000–2015 worldwide)
Area Main category Operation Activity
Pull well equip-ment
Run well equip-ment
Install equip-ment
Perfor-ating
Drilling activity
Circulat-ing
Un-known
Total
US GoM OCS
Blowout (surface flow) Tripping out 1 1
Diverted well release Circulating 1 1
Well release Tripping in 1 1
Total 3 3
UK and Norway
Blowout (surface flow) Cleaning well 1 1
Well release
Pull tubing 1 1
Gravel pack 1 1
Cleaning well 1 1
Maintenance well equipment
1 1
Total 1 1 2 1 5
Rest of the world
Blowout (surface flow) Actual drilling 1 1
Unknown 1 1
Total 1 1 2
Total all 1 1 2 3 1 1 1 10
0,0000
0,0020
0,0040
0,0060
0,0080
0,0100
0,0120
0,0140
0,0160
2000 2002 2004 2006 2008 2010 2012 2014
Freq
uen
cy p
r w
ell c
om
ple
ted
Year
Completion LOWC frequency, per well completed, US GoM OCS, UK and Norway
5% conf limit Estimate 95% conf limit Linear (Estimate)

Loss of Well Control Occurrence and Size Estimators, Phase I and II
Page 89
From Table 8.3, it can be seen that for the three completion LOWC events occurring in the US
GoM OCS, they were in the process of perforating the well when the incident occurred. Two
of them resulted in a well release and the third in a blowout (surface flow). This third one was
the Walter Oil & Gas blowout on Hercules 265 that occurred in 2013.
For the five UK and Norwegian incidents a variety of operations were going on.
8.2 COMPLETION LOWC CAUSES
This section focuses on the causes of the workover LOWC events. Since two barriers normally
should be present during completion activities, this section is focused on the causes of losing
the primary barrier and the secondary barriers. The primary barrier in completion operations is
normally the hydrostatic control of the well. It may in some cases be a mechanical barrier,
depending on how the completion is carried out and the progress of the completion operation.
For all the completion LOWC events observed from 2000 to 2015, the primary barrier was the
hydrostatic control of the well.
8.2.1 LOSS OF THE PRIMARY AND SECONDARY BARRIERS
When the primary barrier is lost during completion, a well kick results. As for drilling incidents,
it is important to detect the well kick as soon as possible in order to close in the well with a
minimum influx. If the secondary barrier fails to activate, or activates late, a completion LOWC
event will occur.
Table 8.4 lists the experienced primary and secondary barrier failure causes for the kicks
resulting in LOWC events for US GoM OCS and regulated areas (Norway, UK, the
Netherlands, Canada East Coast, Australia, US Pacific OCS, Denmark, and Brazil).
Table 8.4 Primary and secondary barrier failure causes for completion LOWC events in the US GoM OCS and the regulated areas.
Primary barrier failure Secondary barrier failure LOWC
Id No. of LOWCs
Blowout (surface flow)
Too low hyd. head
Too low mud weight Failed to close BOP
632 1
Unknown why 569 1
Total 2
Diverted well release
Too low hyd. head - trapped gas Failed to close BOP 607 1
Total 1
Well release
Too low hyd. head
Annular losses Failed to stab Kelly valve 573 1
Unknown why Failed to close BOP 568 1
Swabbing String safety valve failed 470 1
Failed to close BOP 501 1
Packer plug failure Failed to close BOP 614 1
Total 5
Total all 8
The individual LOWC events are commented a bit further down. Here some overall findings
are discussed.

Loss of Well Control Occurrence and Size Estimators, Phase I and II
Page 90
Two blowout (surface flow) incidents were observed during completions. One occurred in the
UK (ID 569) while the other was the Walter Oil & Gas blowout on Hercules 265 in 2013 (ID
632). For both these events, the BOP failed to close. For the Walter incident, the flow through
the BOP became too high before the BOP was activated. The BOP would not close against the
flow. For the UK incident, the drill pipe was pushed out of the hole by well pressure, causing
it to buckle and split above the drill floor. Drilling fluid was released from the split drill pipe.
The driller then activated the shear rams but they failed to shear the pipe and the flow from the
drill pipe, although reduced, continued.
For the diverted well release, the BOP was closed late and gas entered the riser. The riser was
then diverted.
For three of the well release incidents, they observed the kick late. One kicked through the drill
pipe and they failed to stab the kelly valve before they closed the blind ram. For two incidents
the BOP was closed late due to the late kick observation.
For one well release, the screens were across the BOP when the well kicked. It took some time
until they had dropped the screens and could close the BOP. For the last well release, the kelly
was opened with pressure below it. Some gas was released before the well was closed in.
8.2.2 BRIEF LOWC DESCRIPTIONS
Blowout (surface flow)
1. (ID 632) The well had recently been perforated. After tripping out of the hole for
approximately 4.5 hours, the well suddenly began flowing. The pressure built up rapidly and
because mud discharge at the end of the work string, and high flowing pressure, the safety
valve could not set. Attempts to control the well by closing the BOP annular from the rig-
floor failed due to the annular flow. Minutes later, attempts to activate the BOP pipe rams
and blind shear rams from a remote station failed as well. As a result, the well flowed
uncontrolled at rates estimated to be up to 400 million cubic feet of natural gas per day for
three days before bridging. The flow of gas ignited after 13 hours and the fire destroyed the
platform and production equipment, and damaged the MODU. The uncontrolled well
required the drilling of a depletion-relief well to regain complete control.
2. (ID 569) During completion operations, the lower completion sand screens had been run
and set. Cleaning of the subsea wellhead was in progress when the driller noticed a large
increase in flow from the well and closed the BOP pipe rams. Drill pipe was pushed out of
the hole by well pressure and causing it to buckle and split above the drill floor. Drilling
fluid was released from the split drill pipe. The driller then activated the shear rams but the
pipe failed to shear and the flow from the drill pipe, although reduced, continued.
Diverted well release
3. (ID 607) For the diverted well release, they had just perforated and reverse circulated the
well. They then observed a 10 barrel kick in the pits. The subsea BOP was closed too late
and the well continued to flow after the BOP was closed due to gas in the riser. The master
rotary bushing was blown out of the rotary table onto its side on the rig floor. The well was
then put on the diverter. They failed to observe kick before it was in the riser.

Loss of Well Control Occurrence and Size Estimators, Phase I and II
Page 91
Well releases.
4. (ID 573) The well was an ESP (Electrical Submersible Pump) Producer. Completion tubular
were being pulled from the well, with 300 ft. remaining. The well was losing approximately
20 bbls per hour of 10.5 ppg. brine. Having laid down a joint, flow of crude/calcium chloride
brine started from the tubing and an attempt to stab a safety valve by the rig crew was made
but increasing flow prevented this. The BOP blind/shear rams were then closed to secure
the well.
5. (ID 568) The kick was observed late. They were in the process of running a dual string. They
used time to drop the string before closing the blind shear ram. In this period, gas was
released at the surface.
6. (ID 470) The kelly valve was opened without any evaluation of the situation. Total estimated
volume of gas released was 10 to 20 Sm3 before the well was closed in again.
7. (ID 501) Screens were across the BOPs when the kick was observed. BOPs were closed
after the screens were dropped in the well and the flow stopped.
8. (ID 614) The formation isolation valve was set and tested. Thereafter the well was displaced
and the mud returns were pumped directly to the reserve pits where they could not be
measured. When reducing the pump rate the well started to unload mud to the drill floor. At
this point, the well was closed with the BOP. This incident has similarities with the
Deepwater Horizon accident, but here they managed to close the BOP after some release.
8.3 HUMAN ERRORS IN COMPLETION LOWC EVENTS
The human role is considered important in the occurrence and development of LOWC events.
Human errors are believed to have contributed to many of the incidents without being explicitly
stated in the information source. The skill of the personnel and proper procedures and practices
will always be important.
Of the eight completion LOWC events in the US GoM OCS and the regulated areas, human
errors have been investigated. Table 8.5 shows the human errors involved in completion LOWC
events, alongside the time from the kick is observed until the fluids are flowing from the well.
It has also been noted if the well was controlled by a hydrostatic pressure (killed), or if the well
was live when the LOWC events occurred.

Loss of Well Control Occurrence and Size Estimators, Phase I and II
Page 92
Table 8.5 Human errors in completion LOWC events (2000–2015, US GoM OCS and the regulated areas)
LOWC ID
Well Status
Time from kick to event
Human Error
Blowout (surface flow)
632 Killed 0 1. Observed kick late. 2. Did not consider heating effect of water based mud, reducing density and causing kick.
569 Killed 0 Drilling fluid was pumped overboard from the well bypassing on board fluid level monitoring equipment while the well was open to the reservoir. Therefore the kick was observed late
Diverted well release
607 Killed 0 Failed to observe kick before it was in the riser
Well release
573 Killed 0 Observed kick late.
568 Killed Short/zero Realized late that the well was flowing
470 Killed 0 The kelly cock was opened without any evaluation of the situation. Indirect causes: Wrong interpretation of signals from the well. Forgot to open the kelly cock. Not a proper handover during crew change
501 Killed Unknown Unknown
614 Killed 0
During the cleanup and displacement, mud returns were routed to the reserve pits. As a result, volumes could not be monitored on the active pit system. There were indications of an increase in flow out in the rate of mud returns to the pit room during displacement, but this was expected due to the increased pump rate. After ten minutes at a higher pump rate, the rate was reduced to allow the pit room to resolve the increasing flow issues. At this point, the well began to flow, unloading mud onto the drill floor.
All the completion LOWC events occurred in killed wells. For the majority of these LOWC
events the kicks were not observed before the well was flowing to the surroundings.
Human errors were identified in seven of the eight completion LOWC events.
Typically, the human errors were related to poor planning of the operations, lack of attention,
or that the possible risks had not been properly considered.
Keeping control of the fluid coming out of the well vs. the fluid pumped in is utmost important
in kick detection. For ID 569 and ID 614 they had no ability to control of the volume coming
out of the well, similar to the Deepwater Horizon incident.
8.4 EQUIPMENT FAILURES IN COMPLETION LOWC EVENTS
Table 8.6 shows the equipment failures in completion LOWC events.

Loss of Well Control Occurrence and Size Estimators, Phase I and II
Page 93
Table 8.6 Equipment failures in completion LOWC events (2000–2015, US GoM OCS and the regulated areas)
LOWC Id Well
Status Secondary barrier failure Equipment failure
Blowout (surface flow)
632 Killed Failed to close BOP No (BOPs are not designed to close when the well is flowing)
569 Killed Failed to close BOP Blind shear ram failed to shear pipe
Diverted well release
607 Killed Failed to close BOP No (closed late)
Well release
573 Killed Failed to stab Kelly valve No
568 Killed Failed to close BOP No (closed late)
470 Killed String safety valve failed No (opened valve with pressure below)
501 Killed Failed to close BOP No (screen were across the BOP, had to be dropped before closing BOP)
614 Killed Failed to close BOP BOP closed late, downhole isolation packer and formation isolation valve (FIV) failed, causing the kick
There are few equipment failures observed in completion activities. This is likely because the
equipment in the wells during completions is new equipment. The failure of the secondary
barrier is typically caused by late detection and not the equipment that is failing. The exceptions
are the blind shear ram that failed to shear the tubing (Id 569) and the incident where the
formation isolation valve failed. This valve was inflow tested just before the incident.

Loss of Well Control Occurrence and Size Estimators, Phase I and II
Page 94
PRODUCTION LOWC EVENTS
Production blowouts occur from production or injection wells, which may be in service
(producing/injecting) or closed in by mechanical well barriers.
For a blowout to occur in a production well, at least one primary and one secondary barrier have
to fail. During production both the primary and secondary barriers are mechanical barriers. In
a flowing well, the barriers closest to the reservoir are usually regarded as the primary barrier.
This would typically be the packer that seals off the annulus, the tubing below the SCSSV, and
the SCSSV. The secondary barriers would then be the tubing above the SCSSV, the Xmas tree
main flow side, the casing/wellhead, and the annulus side of the Xmas tree.
9.1 PRODUCTION LOWC EXPERIENCE
The SINTEF Offshore Blowout Database includes 26 LOWC incidents from 2000 - 2015 during
the production phase. Twelve of these stems from the US GoM OCS and three from UK.
Further, six of the events stems from the US GoM state water.
Out of these 26 LOWC incidents, external load “caused” 12. The most typical external loads
are storm, fires and ship collisions.
External loads did not cause blowouts for the other operational phases (drilling, completion,
workover, and wireline) in the US GoM OCS and the North Sea for the stated period. The
remaining 14 production blowouts originated from “normal” causes.
Table 9.1 shows an overview of when and where the production blowouts have been
experienced in the period 2000 – 2015.

Loss of Well Control Occurrence and Size Estimators, Phase I and II
Page 95
Table 9.1 When and where the production blowouts have been experienced (2000–2015)
Incident year Country No external cause External cause Total
2000 US GoM state waters 1 1 2
2002 Saudi Arabia 1 1
US GoM OCS 1 1 2
2003 US GoM OCS 1 1
2004 US GoM OCS 1 1
2007
Mexico 1 1
Uk 1 1
US GoM state waters 1 1
US GoM OCS 1 1
2008
Azerbaijan 1 1
Uk 1 1
US GoM state waters 1 1
US GoM OCS 1 1 2
2009 US GoM OCS 1 1
2010 US GoM state waters 1 1
US GoM OCS 1 1
2011 China 1 1
US GoM OCS 1 1
2013 Uk 1 1
2015
Azerbaijan 1 1
US GoM state waters 1 1
US GoM OCS 1 1 2
Total 14 12 26
9.1.1 PRODUCTION LOWCS WITH EXTERNAL CAUSES
An external cause normally only damages the topside barrier. For a blowout (surface flow) to
occur, the downhole barrier also has to fail. Consequently, an external cause will not be the
single blowout cause, except for wells that are not equipped with a downhole safety valve.
Typically, the external force damages the wellhead/X-mas tree barriers of an active well, and
the downhole barrier fails to activate, leaks, or are not installed in the first place, causing the
blowout.
Table 9.2 shows the installation type and external cause for world-wide production LOWC
events (2000–2015).
Table 9.2 Installation type and external cause for production LOWC events experienced world-wide (2000–2015)
Main Category Installation type External object
Fire/- explosion
Ship collision
Storm Total
Blowout (surface flow)
Jacket 2 1 1 4 8
Satellite 3 3
Unknown 1 1
Total 2 1 5 4 12
All the 12 LOWCs that were caused by an external cause resulted in a blowout (surface flow).
The incidents caused by a ship collision normally occur in shallow waters.
Table 9.3 shows a brief overview of production LOWCs caused by an external force.

Loss of Well Control Occurrence and Size Estimators, Phase I and II
Page 96
Table 9.3 Overview of production blowouts caused by external force worldwide (2000 – 2015).
LOWC id
Year Country Water Depth (m)
External Cause
Description Poll-ution
Spill volume Duration Fatalitie
563 2000 US GoM State waters
<50 Ship collision
Unidentified vessel struck well
Small Totally around 20 bbls were spilled. Small amount on sea surface. Not recoverable
6 hours 0
517 2002 US GoM OCS
<50 Storm Hurricane damage bent wellhead 15 degrees
Medium
An estimated 350 barrels of crude oil was released, creating a dark brown slick 6 miles long by 50 yards wide. Recovered 145 barrels of the crude oil spilled. The estimated unrecovered oil released was 205 barrels.
2 days 0
511 2002 Saudi Arabia
<50 External object
Jack-up rig leg collapsed and fell over a well
Large Massive oil spill reported Un-known
3
646 2004 US GoM OCS
100 - 200
Storm/-mudslide
Platform destroyed by an underwater mudslide triggered by Hurricane Ivan and toppled the platform.
Large
In 2014 the daily volume of oil discharging fluctuated between a low of less than one barrel of oil to a high of 55 barrels. Average daily oil volume on the sea surface over seven months were over 2 barrels
More than 10 years still ongoing
0
561 2007 US GoM State waters
<50 Ship collision
Unidentified vessel struck well
Large More than 7000 bbls of waxy condensate crude oil with an API of 35
4 days 0
567 2007 Mexico <50 External object
Storm caused oscillating movements in the jack-up. The cantilever of the unit damaged part of well assembly on the fixed platform. The X-mas tree was torn off the wellhead.
Large 69 m3 a/day for 54 days = 3700 m3 (24 000 bbls)
54 days
23 died, life craft being capsized by
adverse weather
588 2008 US GoM State waters
<50 Ship collision
Unidentified vessel struck well
Medium 3000 gallons of oil, plus gas 28 days 0
592 2008 US GoM OCS
<50 Storm Damaged by Hurricane Ike in September 2008
No Gas leak 12 hours 0
594 2009 US GoM OCS
50 - 100
Storm Failed during Hurricane Ike in September 2008
No
2.44 bbl. of condensate over a 7 days’ period. 50 feet diameter plume of bubbling gas at the surface of the water
6 days 0
615 2010 US GoM State waters
<50 Ship collision
Struck by a tug boat Medium
At a 33 bbl./day rate, nearly 100 bbl. of oil would have been released into the environment after three days. Field observers suggest such a volume is consistent with the oil seen during overflights.
6 days 0
648 2015 US GoM OCS
<50 Ship collision
Platform hit by ship Small Minor sheening and gas bubbling. 50 days 0
669 2015 Azer-baijan
50 - 100
Fire/-explosion
Platform was damaged due a fire caused by a damaged subsea gas pipeline
Un-known
Oil and gas was blowing initially. The oil seems to have burned up. Only gas was flowing after the fire was put out
70 days
32, life boat fell from
platform to the sea.
Damaged after hitting piles of the
platform
Four of the five incidents that occurred in the US GoM OCS were caused by damages from
hurricanes. The last one, that occurred in 15 meters of water, were caused by a boat collision.
One US GoM OCS incident from 2004 is still not under control. The hurricane is believed to
cause an underwater land slide that toppled the platform, and broke all the conductors. It is
unknown how many of the 24 wells that developed a leak. The cumulative amount of oil

Loss of Well Control Occurrence and Size Estimators, Phase I and II
Page 97
released is high, even if the daily rate in 2014 was claimed to be only 2 barrels in average.
Some sources claim that more than a million gallons (24,000 barrels) of oil has been released
over a 12-year period. For another US GoM OCS incident, 350 barrels of oil was released
during a two-day blowout. For the remaining three US GoM OCS incidents the oil spills were
limited.
Four external cause LOWC incidents occurred in the US GoM State waters. All incidents were
caused by a boat collision. For three of them the boats were not been identified. Typical for
these incidents are that the wells are close to land and marshlands. Relatively small amounts of
oil will cause damage to the environment and wild life. For one of these incident 7,000 barrels
of oil was spilled. Two of the spills were around 100 barrels, and one was reported with minor
sheening and gas bubbles. It is suspected that for some of these wells the well did not include
a DHSV, i.e. a single barrier situation.
The three remaining incidents occurred in Saudi Arabia in 2002, Mexico in 2007, and in
Azerbaijan in 2015. The Saudi Arabian incident occurred when a jack-up collapsed and the
jack-up fell over a well and damaged the X-mas tree. The Mexican incident occurred during a
severe storm. The storm caused a jack-up rig to oscillate when drilling a development well. The
movement of the jack-up rig caused that the X-mas tree of the neighbor well was stricken and
damaged, and started to leak. For the Azerbaijan incident, a gas pipeline developed a leak just
below an installation due to a storm. The gas ignited and the fire destroyed the integrity of the
platform located X-mas trees. Multiple wells were blowing out.
All these three incidents caused multiple fatalities. For the Mexico and Azerbaijan LOWC
event in total 55 persons died. For both these accidents the personnel died in association with
the evacuation. For the Saudi Arabian LOWC event three persons died for unknown reasons.
All these incidents released oil. For the Azerbaijan incident, it seems that the majority of oil
burned initially, what happened later with respect to oil spill is not reported. For the Saudi
Arabian incident, a massive oil spill was reported. The Mexican well spilled 69 m3 a/day for
54 days, in total 3700 m3 or 24 000 bbls. The oil was reported to pollute beaches.
It is suspected that a DHSV was not installed in any of these three LOWC.
9.1.2 PRODUCTION LOWCS WITH “NORMAL” CAUSES
Table 9.4 shows the main category and the installation type for the 14 worldwide production
LOWC events not caused by an external force world-wide (2000–2015).
Table 9.4 Installation type and external cause for production LOWC events experienced world-wide (2000–2015)
Main Category Installation type No external cause
Blowout (surface flow) Jacket 5
Unknown 2
Well release Jacket 5
Subsea prod 2
Total 14
Table 9.5 shows a brief overview of production LOWCs not caused by an external force.

Loss of Well Control Occurrence and Size Estimators, Phase I and II
Page 98
Table 9.5 Production LOWC events experienced for various installation vs. main well type worldwide (2000–2015)
Id Year Country Main
category Water depth grouped (m)
Loss of primary barrier
Loss of secondary
barrier
Poll-ution
Spill volume Duration
560 2000 US GoM
state water
Blowout (surface flow)
Unknown Unknown Unknown
Large (because close to shore)
Oil and sheen east of the facility, approx. 70 bbl were observed on the sea surface. Marshes near the blow-out
site were impacted to a much greater extent. An estimated 100 x 150 yds. of marsh were
heavily oiled.
Unknown
519 2002 US GoM
OCS Blowout
(surface flow) 1) <50
SCSSV/storm choke failure (ESD failed to
activate)
X-mas tree failure
Small Approximately 21 gallons of condensate. A barely visible
sheen on the water. 12 hours
521 2003 US GoM
OCS Well release 2) 50 - 100
SCSSV/storm choke failure (closed late)
X-mas tree failure
Small Approximately one gallon of condensate. Mostly gas was
released 6 hours
577 2007 US GoM
OCS Blowout
(surface flow) 1) <50
Tubing leakage
Inner casing failed, fracture
at csg shoe Small Only gas 79 days
596 2007 Uk Well release 1) <50 SCSSV/storm choke failure (closed late)
Unknown No Gas Unknown
578 2008 US GoM
OCS Blowout
(surface flow) 1) <50
SCSSV/storm choke failure
X-mas tree failure
No Gas 3 days
617 2008 Azerbaijan Blowout
(surface flow) 3) 100 - 200 Poor cement
Flow outside casing
No Gas 20 days
653 2008 Uk Well release 3) 100 - 200 Unknown Wellhead
failed Small
Only some oil went to sea, of the 20 tons released (140
barrels) 10 hours
612 2010 US GoM
OCS Well release 2) 50 - 100
SCSSV/storm choke failure
X-mas tree failure
No Gas only, unknown rate 6 mins
624 2011 US GoM
OCS Well release 4) 200 - 400
SCSSV/storm choke failure
X-mas tree failure
Small
Leakage lasted likely 4-6 days. Sheen approx. 1/2 mile long
by 100 yards. Spill amount calculated as 1
gallon
Unknown
649 2011 China Blowout
(surface flow) 1) <50
Formation breakdown
Formation breakdown
Medium Event resulted in the release of approximately 113 barrels (18cubic meters) of crude oil.
17 days
652 2013 Uk Well release 1) <50
SCSSV failure (closed late
when observed
leak)
X-mas tree failed
No Only gas, leaked for one hour
and 18 minutes 1.3 hours
647 2015 US GoM
state water
Blowout (surface flow)
Unknown Unknown Casing leakage Small 37 gallons Unknown
672 2015 US GoM
OCS Well release 2) 50 - 100
Tubing plug and tubing
leakage
Inner and outer casing
failed Small
Estimated 0.67 gallons of oil leaked into the waters
Unknown
Seven of the 12 LOWC events have been categorized as a blowout (surface flow), while the
remaining five have been categorized as a well release.
Seven of the incidents (three blowout (surface flow) and four well releases) stems from the US
GoM OCS. Three well releases stems from the UK, two blowout (surface flow) stems from US
GoM state waters, one from China, and one from Azerbaijan.

Loss of Well Control Occurrence and Size Estimators, Phase I and II
Page 99
For the majority of LOWCs firstly there is a surface leak in the X-mas tree, and then the SCSSV
fails to close. For others, tubing leaks, casing leaks, multiple casing leaks, and formation
breakdown were observed.
None of these incidents caused fatalities and none of them ignited. Some of the incidents caused
release of oil to the sea. The worst one seems to have been an incident in US GoM State waters
in 2000, where the Marshes near the blow-out site were impacted. There were also a couple of
other LOWC incidents where 100 - 200 barrels were released to the sea.
9.1.3 PRODUCTION LOWC TRENDS
Figure 9.1 shows the annual production LOWC frequency per well year in service (injectors
and producers) and the associated regression lines for production LOWC events from 2000–
2015, when including the external cause LOWCs.
Figure 9.1 Annual frequency for production LOWC events and the trend line, US GoM OCS, UK and Norway, 2000 – 2015, including the external causes LOWCs
Figure 9.2 shows the annual production LOWC frequency per well year in service (injectors
and producers) and the associated regression lines for production LOWC events from 2000–
2015, when not including the external causes LOWCs.
0,0000
0,0002
0,0004
0,0006
0,0008
0,0010
0,0012
0,0014
0,0016
2000 2002 2004 2006 2008 2010 2012 2014
Freq
uen
cy p
r w
ell y
ear
in s
ervi
ce
Year
Production LOWC annual frequency (including external cause LOWCs), per well year in service (producers and injectors), US
GoM OCS, UK and Norway
5% conf limit Estimate 95% conf limit Linear (Estimate)

Loss of Well Control Occurrence and Size Estimators, Phase I and II
Page 100
Figure 9.2 Annual frequency for production LOWC events and the trend line, US GoM OCS, UK and Norway, 2000 – 2015, including the external causes LOWCs
Figure 9.1 and Figure 9.2 shows that there are variations from year to year. The trend lines
indicate an increasing LOWC incident frequency for both the figures, but it cannot be
concluded that there is any statistical significant trend.
9.1.4 BRIEF LOWC DESCRIPTIONS
LOWC events with external causes Blowout (surface flow)
1. (ID 563) An unknown vessel collided with a production platform. One of the platform's
wells was damaged when it flowed oil, water, and gas into the Gulf of Mexico. Primary
indications were that a shipping vessel damaged the well X-mas tree (producing 35 b/d),
causing a flow of fluid to flow into the sea. Oil was free flowing as a 20' gusher. The well
bridged over after six hours and was later capped and brought under control. The
remainder of the field was unaffected. Damage to the wellhead was minimal. Throughout
the day, overflights reported seeing mostly sheens. Light sheens were reported to make
land-fall in marshes. Several patches of recoverable oil were identified south of the release
in a convergence area; skimmers were directed to this area. Total recoverable oil as
reported by USCG observers was only 60 gallons.
0,0000
0,0002
0,0004
0,0006
0,0008
0,0010
0,0012
0,0014
0,0016
2000 2002 2004 2006 2008 2010 2012 2014
Freq
uen
cy p
r w
ell y
ear
in s
ervi
ce
Year
Production LOWC annual frequency (not including external cause LOWCs), per well year in service (producers and
injectors), US GoM OCS, UK and Norway
5% conf limit Estimate 95% conf limit Linear (Estimate)

Loss of Well Control Occurrence and Size Estimators, Phase I and II
Page 101
2. (ID 517) The uncontrolled flow from Well No. 14 was caused by hurricane damage that
decapitated the well and bent the wellhead at 15 degrees. The loss of the wellhead caused
differential flow across the storm choke. The storm choke failed to contain the pressure
over time and was at some point released from its settings and ejected from the wellhead.
While the mechanism that caused the choke to fail is not known, the most likely
explanation is that the slips of the choke were cut by grit carried by seepage around the
choke body, ultimately releasing the choke and allowing the well to flow uncontrolled. An
estimated 350 barrels of crude oil was released, creating a dark brown slick 6 miles long
by 50 yards wide. A Fast Response Unit was dispatched which recovered approximately
145 barrels of the crude oil spilled. The estimated volume of unrecovered oil released is
205 barrels.
3. (ID 511) Arabian Drilling Company's independent leg jack-up rig Arabdrill 19, collapsed
and sank offshore Saudi Arabia following an accident that occurred as the rig was being
positioned over a Khafji field producing well. Sources at the scene said "the rig fell when
one leg buckled". When the rig collapsed the production tree was sheared, resulting in a
blowout that ultimately sank the rig. The operator mobilized the Arabdrill 17 to drill a
relief. Several crewmen were injured but there were no fatalities. Another source reports
that the accident caused 3 fatalities and several injuries (unknown how many). Extensive
efforts were initiated to contain the massive oil spill and prevent a huge ecological disaster
in the region, since the damaged well heads were leaking oil, gas and H2S.
4. (ID 646) It seems Hurricane Ivan created waves that triggered an underwater mudslide and
toppled Taylor's platform. The rig stood roughly 10 miles off Louisiana's coast in
approximately 475 feet of water, and buried its cluster of 28 wells under mounds of
sediment. It may seem that the leak rate has gradually increased since 2004. The multi-
agency effort has worked continuously to prevent and control the discharge, improve the
effectiveness of containment around the leaking oil, and mitigate environmental impacts.
Platform deck and subsea debris has been removed. Nine of the 25 impacted wells have
been intervened. In 2014 the daily volume of oil discharging from the MC-20 site has
fluctuated between a low of less than one barrel of oil to a high of 55 barrels. The average
reported daily oil volume on the sea surface over the past seven months has been over 2
barrels.
5. (ID 561) An unidentified vessel hit a wellhead of a newly completes well and damaged it.
The well was yet not in production. Crude oil leaked out in the Bayou Perot. More than
7,000 bbls of waxy condensate crude oil with an API of 35 was released. 3,200 feet of oil
containment boom was deployed to prevent the oil from spreading. The winds pushed the
oil along the western shore of Bayou Perot into the bayou, creating large areas of silver to
rainbow sheens and areas of yellow oil that have escaped the containment boom placed
along the shoreline. Most of the oil stranded on mudflats and in shallow canals with little
or no water. It seems likely that the well was completed without a SCSSV.
6. (ID 567) The incident occurred on a 3 well jacket. Well Kab 101 and Kab 121 were
producing while well Kab 103 were being perforated by the jack-up rig Usumacinta.
Around noon adverse meteorological conditions with gusts of wind up to 130 km/hr and
waves of 6 to 8 meters, which caused oscillating movements in the Usumacinta jack-up
drilling rig that resulted in the cantilever of the unit striking part of well assembly on the
fixed platform Kab 101, resulting in an escape of oil and gas from the well Kab 123. The
X-mas tree was torn off the wellhead. Evacuation procedures activated, involving life rafts
and support of the stand-by vessel the Morrison Tide. The extremely adverse weather
prevented the crews being rescued from life craft and the use of helicopters. In total 23

Loss of Well Control Occurrence and Size Estimators, Phase I and II
Page 102
persons died because a life craft being capsized by adverse weather. The flow was mainly
gas and approximately 430 bbls of oil per day. In none of the articles and Pemex press
release reviewed has a Down hole safety valve been mentioned. This may indicate that the
well did not have a DHSV. The blowout ignited 22 days after it occurred, probably from a
spark generated by the well control operation. The fire was extinguished the day after. The
blowout reignited 10 days later. They removed some the drillfloor and derrick on the jack-
up to get better access for well control and then they also were able to control the fire. The
well was finally capped after 54 days. Oil had polluted the beaches.
7. (ID 588) An unidentified vessel struck and oil well. After the incident, the well's guard
structure was missing, and the wellhead was submerged below the waterline. The Coast
Guard reported that "initial investigators observed oil and natural gas bubbling 10 feet into
the air, and nearly 3,000 gallons of crude oil flowed into the Grand Bayou Blue, which
feeds into the Bayou Lafourche.
The Louisiana Department of Natural Resources inspected the well the day after the
incident and found that the well was deficient, noting that the "well had no storm choke"
and "no nav-aid lights."
There was used more than 3,300-feet of containment boom. Cleanup costs totaled $ 2.5
million.
Well was plugged with three cement plugs after 28 days.
8. (ID 592) The platform had been shut down because of hurricane Ike. The platform was in
the process of returning to production. Upon opening the SCSSVs, gas leaks were detected
from Wells G-1, G-3 and G-4. The leaks occurred from two locations on the wellheads,
including: the flange connection located immediately above the tubing head and the flange
connection just above the wellhead spacer piece.
The operator closed the SCSSVs to control the gas leaks. Well G-4's SCSSV would not
fully close/seal. Thus, gas leaked uncontrolled from Well G-4's tree flange connection
located immediately above the tubing head bonnet that was damaged by the hurricane.
Gas flowed/escaped through the loose mating surfaces of the ring gaskets and grooves.
Well G-4 was then opened to the flare to minimize the gas leakage. The tubing pressure
dropped to about 50 psi. After several hours of flowing the G-4 well to the flare, it’s SCSSV
fully closed/sealed.
On the following day, successful repair procedures were initiated on the wellheads.
Hurricane Ike forces acted on the wellhead flange studs, causing the studs to stretch beyond
their elastic limit. This resulted in loss of seal integrity of the tree flange connections. All
leaks were repaired by changing out the studs, nuts, and ring gaskets on wells G-1, G-3,
and G-4.
9. (ID 594) The C platform had been toppled during hurricane Ike. The wells were found to
be bent over or "kinked" at approximately 30' above the seafloor.
A 50' diameter plume of bubbling gas was observed at the surface of the water above the
toppled platform. Some condensate was also released. The wells' conductors bend
downward from horizontal at an angle of about 20 degrees and the well heads were found
in an accessible location about 10' - 15' above the seafloor.
The wellheads of C-9 was found to be sheared off in the bodies of the master valves
immediately above the tubing head flange where the release of condensate and gas

Loss of Well Control Occurrence and Size Estimators, Phase I and II
Page 103
occurred from. The SCSSV that was successfully tested with a report of zero leakage in 3
months earlier.
One theory was that the control line had been squeezed and opened the SCSSV.
The well was secured after six days by removing the sheared off master valve and then
replacing the broken valve with a new valve assembly.
10. (ID 615) A tug boat struck the wellhead. Escaping oil and gas in the form of an orange and
brown mist was reaching up to 100 feet in the air. This well was close to important marshes
in the Barataria Bay area,
Heavy drilling fluids was pumped into the wellbore to stop the flow of hydrocarbons from
the well. Then a new valve was installed on top of the wellhead to permanently seal it. The
blowout lasted for 6 days.
60,200 feet of containment boom and 14,080 feet of sorbent boom was used in an effort to
corral the oil spill. Additionally, 213 personnel and 47 oil skimmers, boats and barges were
also used.
11. (ID 648) An offshore supply vessel struck an unmanned production platform located at
South Timbalier 27 IA. Ninety percent of the structure was destroyed because of the
collision and subsequent fire.
Three vessels in the area responded and assisted in extinguishing the fire. Prior to the
accident there were three producing gas lift wells on the structure, with an average total
daily production of 92 barrels of oil, 93 barrels of water, and 115 million cubic feet of gas
per day.
During the first 1-2 weeks, immediately following the accident, inspectors routinely flew
over the site to monitor minor sheening and gas bubbling. The wells were secured after 50
days.
12. (ID 669) A fire broke out in the northern part of platform No. 10 at the western section of
the Gunashli oilfield in Azerbaijan, operated by SOCAR. The fire started when a high-
pressure subsea gas pipeline was damaged in a heavy storm. Because of the fire, the
platform, which had been in service since 1984, partially collapsed. Fire spread to several
oil and gas wells. Production at all 28 wells (24 oil wells and 4 gas wells) connected to the
platform was suspended, pipelines connecting the platform to the shore were closed, and
electricity to the platform was cut off. Before the accident, the platform produced 920 tons
(6,000- 7,000 barrels) of oil and 1.08 million cubic meters (38 million cubic feet) of gas
per day. About 60% of the oil produced by SOCAR was transported through this platform.
At the time of the accident, 63 workers were on the platform.
People went missing when a life boat with 34 people on board fell from the platform into
the sea and was damaged after hitting piles of the platform. The oil fires at the well were
put out after 14 days, but the gas wells continue to burn. The fire ceased in mid-February
2016. The platform was a total loss. The platform was renovated and production restarted
in July 2016.
LOWC events with no external causes
Blowout (surface flow)
1. (ID 560) A fisherman reported a 20' gusher of oil from the Bay DeChene Oil and Gas Field.
The USCG was notified and NOAA was asked to provide technical support. At first light,

Loss of Well Control Occurrence and Size Estimators, Phase I and II
Page 104
A USCG overflight observed oil and sheen east of the facility and estimated that
approximately 70 bbl. were observed (much less than initially predicted). The facility was
shut in by the operator. Most of the oiling was reported as sheens, but marshes near the
blow-out site, were impacted to a much greater extent.
2. (ID 519) A Platform Operator was flying to Ship Shoal Block 239, Platform A, when he
spotted a watery spray blowing up from the platform. They then flew to Ship Shoal Block
233. He then took a boat to Ship Shoal Block 239, Platform A. When arriving, he activated
the ESD station. and thereby closed the SCSSV in Well A-12. Then he closed the manual
master valve. The well had produced approximately 12 hours open to the atmosphere.
Approximately 21 gallons of condensate were released during the incident which produced
a barely visible sheen on the water. The ESD control system was later tested. It was found
that the needle valve for the flowline sensing line was stopped up with sand and a small
piece of metal. It was also found that the final relay in the TSE logic in the panel was stuck.
This malfunctioning relay is what caused the TSE loop to not close the SCSSV.
3. (ID 577) An operator representative reported gas leaking at the mud line at Main Pass,
Block 91, Platform A (MP 91A). No pollution was visible. It was determined the source
of the gas was Well A-1. The well had a leak in the tubing for a long period. The annulus
pressure was 23% of the minimum internal yield pressure of the 9 5/8-inch production
casing. The casing pressure breached the production casing, the pressure was more than
sufficient to break down the shoe of the 16-inch surface casing. It is not known how, where
or why the failure occurred in the 9 5/8-inch production casing.
Numerous attempts were made to kill the well without success. Before they had managed
to kill the well a storm came and the platform was evacuated. The platform structure was
found toppled/sunk while returning from storm evacuation.
Then a relief well was drilled intersecting the well bore. The well was killed with 525 bbls
of mud and abandoned with 203 bbls of cement 79 days after the blowout occurred.
The evidence does not provide the necessary information to indicate definitely how or why
failure occurred, however, had the casing pressure been reported as necessary, timely
intervention measures may have prevented the loss of well control.
4. (ID 578) A contract wireline company was performing routine scaling operations on the
well to repair a leaking surface controlled subsurface safety valve (SCSSV). The operator
decided to perform an acid job to reduce the amount of scale around the SCSSV after
several attempts to remove the scale with a wireline unit were not successful. The
personnel pumped approximately 100 gallons of 1 percent hydrochloric acid (HCL) into
the well and allowed it to soak overnight. The day after the acid job the personnel re-
entered the well to perform more scraping. A seal ring on the bottom flange below the
master valve began to leak and dry gas was released into the atmosphere.
Since the SCSSV was not operable and the leak was below the master valve, the operator
was not able to prevent the escape of natural gas. The platform was evacuated shortly after
the event. The well was secured three days later by installing a back-pressure valve in the
tree and replacing the ring gasket.
The incident was caused by a leaking SCSSV, severely corroded ring gasket, and the
performance of an acid job possibly accelerating the failure of the ring gasket.
5. (ID 617) This is an incident that has been reported as a blowout through WikiLeaks
information. As far as we can see the operator has not referred to this as a blowout, but the

Loss of Well Control Occurrence and Size Estimators, Phase I and II
Page 105
Operator’s Annual Report 2008 states the following from the incident; On 17 September
2008, a subsurface gas release occurred below the Central Azeri platform in Azerbaijan.
As a precautionary measure, all personnel (211 workers) on the platform were safely
transferred onshore. Another WikiLeaks document said the operator believed the gas leak
was linked to a bad cementing job.
6. (ID 649) Oil was observed on the surface of the water near PL19 3 Wellhead Platform B
in China. The source of the seep was identified to be an existing geological fault that
opened slightly due to pressure from water injection into a subsurface reservoir during
production activities. The operator discontinued the water injection and began de-
pressuring the reservoir. 17 days after the incident was observed the reservoir pressure was
reduced to a point that the fault closed, isolating the reservoir from the surface and stopping
the seepage.
7. (ID 647) The source of the discharge was a leak that developed on the surface casing of a
saltwater injection well. Initial sheen was estimated to 37 gallons based on sheen
calculations from an overflight.
Well release
8. (ID 521) The lead operator recorded the tubing pressure from a gauge located in the tree
cap of Well A-2. He then left the platform without removing the pressure gauge or
installing a plug in the needle valve. The lead operator also left the crown valve (swab
valve) open. The O-ring in the tree cap failed while the platform was unattended, allowing
gas and condensate to be vented into the atmosphere. While conducting a morning check,
an operator observed the well blowing natural gas out of the well cap. Personnel from a
nearby platform were sent by boat to the facility, and they activated the boat dock ESD.
The well stopped flowing approximately 30 seconds after the ESD was activated. The
master, wing and crown valves were then closed. An investigation revealed that Well A-2
was blowing out at the hammer type cap located on top of the wellhead. The gas was
coming from a bleed-off hole (weep hole) on the hammer type cap. The cap gasket was
pinched, allowing gas to flow. Approximately one gallon of condensate was spilled into
the Gulf.
9. (ID 596) The wells incident was reported by field standby vessel. Bubbles coming to
surface with a 10m dispersion radius at the location of a subsea wellhead structure. After
identifying the well that leaked, the well was shut in and the gas release stopped.
10. (ID 653) Fractured wellhead weld point. The leak was controlled by applying a hose to the
opposite side of the wellhead from the crack to reduce the pressure and divert the oil back
into production.
This successfully reduced the pressure to such an extent that the leak from the crack
stopped at around after 10 hours. The majority of leak went to the bund in the module with
some going to sea. A VR plug was inserted and the wellhead made safe. The bund was
pumped out and the module cleaned. One source stated that 320 kg was released. A news
article stated that 20 tons of oil leaked. It is not stated in the source, but it seems the leak
was fed by the annulus.
11. (ID 612) When looking outside the living quarters, the operator heard a gas leak and
observed a large gas cloud in the area where the test separator was located. The operator
headed to the well bay to insure all wells had been shut-in. He noticed that all wells shut-
in except for A-15.

Loss of Well Control Occurrence and Size Estimators, Phase I and II
Page 106
The Operator then manually closed the wing valve and the gas leak stopped. Large amounts
of sand were observed in the area around damaged piping.
A range charts showed that the well flow had begun to increase. It is believed the choke
was once again "cut out". The PSV began to relieve at some point as flow increased. The
source of the leak was found to be the A-15 flowline PSV discharge piping as it was cut
out at two 90 degree "elbow" sections.
The PSH and PSL located on the flowline were found to have sensing lines plugged with
sand and therefore did not function. A report stated the SSV of the A-15 well was found
to have large amounts of sand, which was believed to be responsible for the A-15 SSV
failing to actuate to the closed position.
12. (ID 624) Re-manning the facility following the T.S. Lee evacuation. The crew exited the
aircraft and was walking down the stairway to the quarters when they noticed a sheen
approx. 1/2-mile-long by 100 yards coming from the facility. The crew then noticed that
liquids were coming out the Flare Boom. They proceeded downstairs to investigate and
found two wells had failed to ESD.
The wells were manually shut in and the source was contained. The spill estimate released
to the water was based on sheen size present in the water was calculated as 1 gallon. Several
additional gallons were also released and covering significant portions of the platform and
rig. Several cleaning crews were brought out to clean the facility. The facility remained
shut in until the cleaning crew was finished.
13. (ID 652) A supply boat observed an area of 150 to 200m wide showing signs of
disturbances. Bubbling water could be observed on the center of this area. Production tree
upper flow spool was replaced by divers. It was estimated that 1571 kg gas released.
14. (ID 672) A production operator was making his morning rounds and found gas and oil
leaking from a well. The gas and oil was leaking through a hole in the 20-inch drive pipe
at the +10-bell guide and from the 20 inch x 10 ¾ inch annulus from below the well head
base plate. The operator reported an estimated 0.67 gallons of oil leaked into the waters of
the Gulf of Mexico.
The well was a dual completion with a long string and the short string. The short string
was plugged in 2014 at the packer level because the short string tubing was leaking to the
annulus.
The well was closed in before the incident because of some surface equipment failure. This
increased the reservoir pressure. The buildup of reservoir shut-in pressure caused the pump
through plugs in short string to fail allowing reservoir shut-in pressure/gas and oil to enter
the deteriorated short string that again leaked to the well annulus. A leak in the 7 5/8-inch
production casing allowed reservoir shut-in pressure/gas and oil to build in the 7 5/8-inch
and 10 ¾ inch annulus. A leak in the 10 ¾ inch surface casing +-10ft below the well head
allowed reservoir gas and oil to enter the non-pressure holding 20-inch casing finding open
leak paths to the atmosphere
9.2 HUMAN ERRORS IN PRODUCTION LOWC EVENTS
The human role is considered important in the occurrence and development of LOWC events.
Human errors are believed to have contributed to many of the incidents without being explicitly
stated in the information source. The skill of the personnel and proper procedures and practices
will always be important.

Loss of Well Control Occurrence and Size Estimators, Phase I and II
Page 107
9.2.1 LOWC EVENTS WITH EXTERNAL CAUSES
For five of the 12 LOWC events with external causes a ship or a boat collided with the wellhead.
This will in many cases be regarded as a human error, although it will mainly be the ship
personnel. It has however been mentioned that that lightening has been missing on the
structures, making them difficult to see when it is dark. These types of small unmanned
structures in shallow water should be enlightened. Such structures should also clearly be
marked on all maps and navigation devices.
Some of these wells have not been equipped with and SCSSV. All wells that may be exposed
to external forces should have an SCSSV.
Otherwise it cannot be identified what role human errors have had for the development of the
rest of the LOWC events caused by external forces.
9.2.2 LOWC EVENTS WITHOUT EXTERNAL CAUSES
For nine of the 14 LOWCs without external causes a direct human error that had impact on the
event could not be identified. For the remaining five, human errors may seem to have been
contributed to the occurrence of the incidents.
For one blowout (surface flow) (ID 577) the well had had a leak in the tubing for a long period.
The annulus pressure was 23% of the minimum internal yield pressure of the 9 5/8-inch
production casing. The casing pressure was not reported as necessary, timely intervention
measures may have prevented the loss of well control.
For another blowout (surface flow) (ID 649) the source of the seep was an existing geological
fault that opened slightly due to pressure from water injection into a subsurface reservoir during
production activities. 17 days after the incident was observed the reservoir pressure was
reduced to a point that the fault closed.
For a well release (ID 521), after a tubing pressure measurement the operator left the platform
without removing the pressure gauge or installing a plug in the needle valve and left the crown
valve (swab valve) open. The O-ring in the tree cap failed while the platform was unattended,
allowing gas and condensate to be vented into the atmosphere.
For another well release (ID 653) it seems that the well had been allowed to have an annulus
pressure due to a down hole leak. When a fracture in the wellhead weld point occurred, the
annulus started to leak oil to the surroundings. A source states that 20 tons of oil leaked, another
states 320 kg.
For a third well release (ID 624) two wells had failed to ESD prior to evacuating the platform
due to a storm warning. This was not observed before re-manning the platform some days later.
It seems that the personnel did not verify that all wells were properly isolated prior to
evacuating the platform

Loss of Well Control Occurrence and Size Estimators, Phase I and II
Page 108
WIRELINE LOWC EVENTS
Wireline LOWC events occur during wireline operations in production or injection wells.
Wireline operations are also frequently performed during well workovers, well drilling or well
completions. Blowouts that occur during these operations are not regarded as wireline blowouts.
During wireline operations, a stuffing box/lubricator and/or a wireline BOP located on top of
the X-mas tree is normally the primary barrier. If the well cannot be controlled by those means,
the wireline is dropped or cut before the X-mas tree is closed to control the well.
10.1 WIRELINE LOWC EXPERIENCE
The experience presented in this section is based on the SINTEF Offshore Blowout Database
[7] for the period 2000–2015 worldwide. The database includes seven LOWC incidents from
2000 - 2015 during the wireline phase. Three of these stem from the US GoM OCS and four
from the UK. This type of LOWC events have not be identified in any other areas. It is likely
that such events have occurred in other areas as well but they have not reached the public domain
due to lack of reporting and low consequences. Table 10.1 shows some key parameters for the
wireline LOCW incidents.
Table 10.1 Wireline LOWC Incidents, some key parameters
ID Year Sub Category
Country Water Depth
Installation type
Well status
Poll-ution
Spill volume Duration Fatali-ties
Ignition
Blowout (surface flow)
530 2000
Totally uncontrolled flow, from a deep zone
UK 3) 100 -
200
Light intervention vessel
Alive No Gas 4 hrs 45 min
0 No
Well release
515 2001
Limited surface flow before the secondary barrier was activated
US GoM OCS 1) <50 Jacket Alive No Gas 5 mins 0 No
552 2003 US GoM OCS 1) <50 Satellite Alive No Gas with H2S 5 mins 0 No
572 2001 UK 2) 50 -
100 Jacket Alive
No Only gas 5 mins 0 No
642 2014 US GoM OCS 2) 50 -
100 Jacket Alive
No Gas, very small
1 min 0 No
651 2014 UK 3) 100 -
200 Jacket Alive
No Estimated oil release 900 - 950kg (Not to sea).
1 min 0 No
656 2000 UK 3) 100 -
200 Jacket Alive
No 3350 kg gas in 2 minutes
2 mins 0 No
None of the wireline LOWC incidents caused any severe accidents, no fatalities, no ignition,
and no pollution of the sea. Most of the incidents were categorized as well releases, that typically
have a short duration. One incident was categorized as a blowout (surface flow). For this case
the wireline BOP failed to stop the flow.
Below a brief description of the various LOWC events is given.
1. (ID 530) A leak occurred on a wireline lubricator at the stuffing box during the setting of an
electric line bridge plug. Wireline BOP's were closed but failed to stop the leak. The leak
continued for nearly 5 hrs. when the BOP's eventually sealed.

Loss of Well Control Occurrence and Size Estimators, Phase I and II
Page 109
2. (ID 515) The crew had run in the hole with a tool string to begin logging when a leak
developed in a connection between the wireline pump-in sub and a 2-inch molded "Y". The
leak could not be isolated from the wellbore without shutting in the gate valve on the tree.
All non-essential personnel were evacuated from the jack-up boat and the platform, and the
electrical wireline was retrieved. After the tools were above the SCSSV, the pressure was
bled to 0 psi into the production system. When the BOP’s and the pump-in sub were
dismantled, the crew found that a seal was cut out.
3. (ID 552) It seems that they prepared for wireline job to install a plug in the well. The needle
valve which accessed the downhole chemical injection line, had a check valve installed at
the end. When the construction personnel attempted to back out the check valve, the
autoclave needle valve came off the seat. This resulted in gas from the wellbore being
released into the atmosphere. Cudd Pressure Control personnel tightened the autoclave
connection eliminating the leak. No H2S detected in escaping gas at wellhead.
The probable causes of the incident were the following: 1) the failure of the construction
operator to properly remove the plug from the autoclave valve, 2) a lack of company
supervision during the operation, and 3) a failure of the operator to implement the H2S
contingency plan. Damage is estimated at $400.
4. (ID 572) The wireline riser was installed onto the well swab valve with the BOPs and
lubricator positioned above on the top deck. When retrieving a tool during wireline
operations for inspection/redress the operator encountered a sudden overpull when the
odometer indicated the tool was still registering 153 ft below the swab valve. Simultaneously
the wire parted at surface and exited out of the lubricator stuffing box and the tool string plus
wire fell back down the well. Gas then started to escape to the open atmosphere from the
1/8" orifice on stuffing box left by the wire when the stuffing box BOP also failed to operate.
The pressure in the well at the time was 697 psi. Wind conditions at the time was 12 knots
from a direction of 200 deg. The Schlumberger operator took immediate action and the blow
out preventers closed within 30sec.
5. (ID 642) While preparing to drop a wireline cutter, the wireline BOP that was closed around
the wire failed and gas was briefly discharged to atmosphere for +/- 10 seconds. The gate
valve beneath the lubricator was closed to cut the wire and secure the well. There were no
injuries, fires or pollution.
6. (ID 651) Initial detection visual by driller. Further fixed system detection identified
dispersion. Activation of BOP well control was manual. Full platform shutdown was initiated
manually. The operator estimated the amount of oil released to be between 900 - 950kg.
Several unknown factors mean that the size of the release cannot be accurately determined.
Release drained down from Rig Floor to BOP Deck, then into Eggboxes/Well Bay
7. (ID 656) During rig-up slick line, system was about to be flushed through to pressure test
BOP's. At this point the wireline BOP's were open, with no lubricator fitted. The well was
isolated on the swab valve and upper master valve. The swab valve on the Xmas tree was
opened to fill the system with water. The operator on the drill floor noticed what is assumed
to be some trapped pressure between the swab valve and the upper master valve being vented
on the drill floor.
He should then function the BOP's to closed position, but inadvertently opened the upper
master valve to the open position instead. As the swab valve was open, this allowed well
pressure to vent up the riser onto the drill floor.

Loss of Well Control Occurrence and Size Estimators, Phase I and II
Page 110
The platform GPA was triggered by a gas release on the drill floor at this point. The personnel
at the Xmas tree closed in the swab valve immediately to isolate the well. The operator on
the drill floor contacted the personnel in the wellheads and returned to the control panel. He
realized his error and dumped the opening pressure to the upper master valve, and functioned
the BOP's to the closed position.
10.2 HUMAN ERRORS IN WIRELINE LOWC EVENTS
The human role is considered important in the occurrence and development of LOWC events.
Human errors are believed to have contributed to many of the incidents without being explicitly
stated in the information source. The skill of the personnel and proper procedures and practices
will always be important.
For two of the seven wireline LOWC events human errors were identified.
For the ID 552, when preparing for a wireline job, the construction operator di not properly
remove the plug from the autoclave valve, casing a leak from the chemical injection line to the
surroundings.
For ID 656, when preparing for a slick line operation, the operator by mistake opened the upper
master valve (the swab valve was also open), when he should have closed the wireline BOP.
Human errors may have been involved in other of the incidents as well, but they have not been
mentioned in the source material.
10.3 EQUIPMENT FAILURES IN WIRELINE LOWC EVENTS
For four of the LOWC incidents equipment failures occurred, for one it is unclear, and for the
two last incidents it seems that human errors caused the incidents.
For ID 530 a leak occurred on a wireline lubricator at the stuffing box during the setting of a
Schlumberger electric line bridge plug. The wireline BOP's were then closed but failed to stop
the leak.
For ID 515 a leak developed in a connection between the wireline pump-in sub and a 2-inch
molded "Y". Closed X-mas tree gate valve to isolate the leak. After dismantling the crew found
that a seal was cut
For ID 572 the wire parted at surface and exited out of the lubricator stuffing box and the tool
string plus wire fell back down the well. Then the stuffing box BOP also failed. X-mas tree
valves were then closed
For ID 642 the wireline BOP failed to seal around the wireline. Cut the wire and secured the
well with X-mas tree valves

Loss of Well Control Occurrence and Size Estimators, Phase I and II
Page 111
ABANDONED WELL LOWC EVENTS
There are five LOWC events in the database for the period 2000–2015 from wells categorized
as abandoned wells. Wells that are temporary abandoned, permanently abandoned, and long-
time plugged wells are regarded as abandoned wells.
Table 11.1 shows an overview of the abandoned wells LOWC events.
Table 11.1 Overview of LOWC events in abandoned wells 2000–2015
LOWC ID
Year Country Water
depth (m) When abandoned Description
484 2000 US GoM OCS 15 Temporary abandoned
The cement job on well No. D-5 annuli failed and allowed gas to migrate up through the cement into the annular void of the well and into the atmosphere, when working on the neighbor well. Hot slag from welding operations on the adjacent D-6 well caisson fell down into the annulus D-5 annuli and ignited. The fire lasted for 27 hours
513 2002 Indonesia 1,676 Well was recently plugged and abandoned
A thin hydrocarbon sheen near a deepwater well site was observed. Unknown duration
609 2009 US GoM OCS 1,884 Well was P&A in 2008
The well was temporary abandoned in 2006 and permanently abandoned in June 2008. Estimated the flow to 5.6 barrels a day. During killing operations, it was found that the flow was through the casing. The flow from the well lasted for more than a month. Total release estimated to 62 barrels by the operator
610 2007 US GoM OCS 16.5 Permanent plugged and abandoned in 1997
In November 2007, it was discovered that the well was bubbling. Well was dead when the initial bubble appeared. While investigating the source of the bubble the old plugged and abandoned well bridged off and stopped flowing.
626 2012 UK 46.3 Reservoir had been plugged for a year
This was the UK Elgin blowout. The well main reservoir had been plugged for a year. The gas and condensate were believed to originate from a rock formation located above the reservoir that contained gas and condensate that may have migrated. The casing fractured at a pressure below the design pressure. Casing was corroded. Flow was stopped after 53 days Production resumed 9 months later. The flow was condensate and gas. Pollution was negligible. Gas and condensate dispersed or evaporated.
633 2012 India 260
Well had been temporary abandoned for 10 years
The well was temporarily abandoned with two bridge plugs and a horizontal subsea X-mas tree. It is not known if the X-mas tree had any crown plugs or if it was left with only a debris cap. One source states that there were some condensate on the sea surface, all others refer to this as a gas blowout. A capping stack was made for the purpose and used for ending the flow. The blowout lasted for 84 days.
LOWC events in abandoned wells do occur. There is reason to believe that more of these
types of events will be seen in the future. There are many wells in the North Sea and in the
US GoM OCS that are temporary abandoned and longtime shut in. In regulated areas in the
rest of the world the number of such wells is assumingly on the same level. In other areas
with less regulation the relative number of such wells may be even higher.

Loss of Well Control Occurrence and Size Estimators, Phase I and II
Page 112
As the workover section shows, Section 7, page 70 many LOWC events occur during
abandoning operations. Further, many of these comes from wells that have been temporary
abandoned or shut in for a long period. Entering these wells is difficult due to the
uncertainties related to the conditions of the barriers and unanticipated well pressures.
The BOMR 5010 borehole list [8] includes a status field and a status date field for the
individual wells. Permanently Abandoned and Temporarily Abandoned are among the status
categories that can be selected. A version of this file from June 26, 2016 has been downloaded.
From this file, Table 11.2 has been generated.
Table 11.2 Permanently Abandoned and Temporarily Abandoned wells in the US GoM OCS (based on
5010 borehole file [8] downloaded June 2016 including all wells drilled in all times)
Latest well status
reported (period/year)
Development wells Exploration well Cumulative exploration and
development wells
Permanently Abandoned
Temporarily Abandoned
Permanently Abandoned
Temporarily Abandoned
Permanently Abandoned
Temporarily Abandoned
1948 - 1979 1,817 76 4,249 7 6,066 83
1980 - 1989 1,932 119 2,649 29 10,647 231
1990 - 1999 2,897 311 2,295 70 15,839 612
2000 - 2009 4,007 896 1,921 162 21,767 1,670
2010 787 228 188 24 22,742 1,922
2011 800 242 198 20 23,740 2,184
2012 615 330 182 43 24,537 2,557
2013 377 493 205 49 25,119 3,099
2014 439 413 187 50 25,745 3,562
2015 322 263 137 76 26,204 3,901
2016 101 58 45 16 26,350 3,975
Total 14,094 3,429 12,256 546
The accuracy of the status data in the borehole list is unknown, but Table 11.2 indicates that
many wells have been temporarily abandoned for many years. The table indicates that 83 wells
have been temporarily abandoned since before 1980, and that 612 have been temporary
abandoned before the year 2000. The past six years the number of temporary abandoned wells
has increased with around 1,000. As per June 2016, nearly 4,000 wells are temporary
abandoned in the US GoM OCS.
In addition to these temporary abandoned wells, many producing wells are closed in or plugged
for some reasons. The OgorA file [9] for January 2016, lists in total 1,595 non-producing oil
completions and 1,380 non-producing gas completions. There is reason to believe that many of
these wells have been closed in for a long period of time.
There is a huge back-log related to temporary abandoned wells in the whole world. Unless this
back-log is reduced, the probability of blowouts from these wells will increase.

Loss of Well Control Occurrence and Size Estimators, Phase I and II
Page 113
UNKNOWN PHASE LOWC EVENTS
For two LOWC events, one occurred in Brazil (Platform P-7) in 2001, and one in UK (Forties
Echo) in 2008, the operational phase could not be determined based on the source description.
Both incidents occurred on production installations.
Both these events caused release of oil to the sea.
The UK LOWC incident has been categorized as a well release.
ID 655. Drill crew responded to this incident by completing the nipple up of the double ram
BOP. This was installed in 20 mins, bolts were torqued up and shear rams closed. By this action
the well was closed off. Well was then monitored for some hours and no further gas bubbles
came to surface, no pressure increase was recorded. Approximately spill area on sea surface:
10m x 500m. The source stated a duration of one minute and a spill of 200 kg (1-2 barrels).
The Brazilian LOWC Incident has been categorized as a blowout (surface flow).
ID 483. It seems they had been testing the well when something went wrong, and pipes were
spilling to the sea. The spill volume has been estimated to 13,000 (80 barrels) liter and 25,000
liters(150 barrels).The duration of the Brazilian spill is unknown.

Loss of Well Control Occurrence and Size Estimators, Phase I and II
Page 114
LOWC CHARACTERISTICS
13.1 LOWCS FLOW PATHS AND RELEASE POINTS
A LOWC event may flow to the surroundings through various flow paths. Figure 13.1 shows
an overview of the leak paths for the 117 LOWC events from the “regulated” area (US GoM
OCS, Norway, UK, the Netherlands, Canada East Coast, Australia, US Pacific OCS, Denmark,
and Brazil).
Figure 13.1 LOWC flow paths 2000–2015, regulated areas including US GoM OCS
Approximately 45% of the LOWC event’s flow came through the well annulus, 23 % came
through the tubing, 11% in-between casings, 7% through the drillstring, and the remaining
came outside casing and the remaining outside the casing or an underground flow.
More detailed overviews of the flow paths and release points for the various operational phases
and main vessel type are shown in Table 13.1, Table 13.2, Table 13.3, Table 13.4, and Table
13.5.
8
27
53
13
104 2
LOWC flowpath distribution
Through drill string/test string
Through tubing
Through annulus
Through outer annulus
Outside casing
Underground blowout
Unknown

Loss of Well Control Occurrence and Size Estimators, Phase I and II
Page 115
Table 13.1 LOWC event flow paths and release points, shallow zone incidents, 2000–2015, regulated areas including US GoM OCS
Phase Main category Release point Leak path
Through annulus
Through outer annulus
Outside casing
Total
Bottom fixed
Development drilling
Blowout (surface flow)
Diverter syst.leak 1 1
Diverter syst.leak-main diverter
1 1 2
Drill floor 1 1
From wellhead 2 2
Subsea - outside casing 2 2
Diverted well release Diverted 6 6
Total 8 4 2 14
Exploration drilling
Blowout (surface flow) Diverter syst.leak-main diverter
1 1
From wellhead 2 2
Diverted well release Diverted 4 4
Total 5 2 7
Floating vessel
Development drilling
Blowout (surface flow) Subsea wellhead 2 2
Total 2 2
Exploration drilling
Blowout (surface flow) Subsea wellhead 3 3
Well release Subsea - outside casing 1 1
Subsea wellhead 1 1
Total 4 1 5
TOTAL ALL 19 7 2 28
Most shallow zone LOWC events have their final flow-path through the well bore annulus.
Either the flow is diverted without any problems, the diverter system fails, or the flow is
released through the subsea wellhead.

Loss of Well Control Occurrence and Size Estimators, Phase I and II
Page 116
Table 13.2 LOWC event flow paths and release points, bottom fixed installation, deep zone incidents during drilling, completion, workover, and wireline operations, 2000–2015, regulated areas including US GoM OCS
Phase Main category Release point
Flow path
Total Through drill string
Through tubing
Through annulus
Through outer
annulus
Outside casing
Under-ground blowout
Unknown
Develop- ment drilling
Blowout (surface flow)
From wellhead 2 2
Subsea wellhead 1 1
Blowout (underground flow)
No surface flow 1 1
Well release Drill floor - through rotary 1 1
Unknown 1 1
Total 2 2 1 1 6
Explorat-ion drilling
Blowout (surface flow)
BOP valve outlet 1 1
Drill floor - top of drill string 1 1
From wellhead 2 2 4
Blowout (under-ground flow)
No surface flow 2 2
Total 1 3 2 2 8
Comp-letion
Blowout (surface flow)
Drill floor 1 1
Drill floor - through rotary 1 1
Well release
Drill floor - through rotary 1 1
Drill floor - top of tubing 1 1
Shaker room 1 1
Total 3 2 5
Work-over
Blowout (surface flow)
Drill floor - top of tubing 2 2
From wellhead 2 2
From x-mas tree 1 1
Mud room 1 1
Subsea - outside casing 4 4
Subsea wellhead 1 1
Well release
BOP valve outlet 3 3
Drill floor - through rotary 8 8
Drill floor - top of drill string 1 1 2
Drill floor - top of tubing 1 1
From above x-mas tree 1 1
From wellhead 1 1
From x-mas tree 1 1
Total 2 8 14 4 28
Wireline
Blowout (surface flow)
Drillfloor - through rotary 1 1
Well release
Drillfloor 2 2
Drillfloor -Wireline stuffing box/BOP 1 1
From above X-mas tree 2 2
From X-mas tree 1 1
Total 1 5 1 7
TOTAL ALL 7 13 21 5 4 3 1 54
For workover and completion LOWC events, many have the flow path through the tubing or
the drill string.

Loss of Well Control Occurrence and Size Estimators, Phase I and II
Page 117
Table 13.3 LOWC flow paths and release points, floating vessel deep zone incidents, 2000–2015, regulated areas including US GoM OCS
Phase Main category Release point Flow path
Total Through drill string
Through annulus
Outside casing
Underground blowout
Un-known
Explor-ation drilling
Blowout (surface flow)
Drill floor - through rotary, subsea BOP
1 1
Subsea - outside casing 2 2
Subsea BOP 1 1
Blowout (underground flow)
No surface flow 1 1
Diverted well release
Drill floor - through rotary 1 1
Well release
Diverted 1 1
Drill floor - through rotary 2 2
Shaker room 1 1
Total 7 2 1 10
Comp-letion
Diverted well release
Diverted 1 1
Well release Drill floor - through rotary 1 1 2
Total 1 2 3
Work-over
Well release Drill floor - through rotary 1 1
Total 1 1
TOTAL ALL 1 10 2 1 14
Most of the deep zone LOWC events for floating vessels have their final flow-path through the
well bore annulus.
Table 13.4 LOWC flow paths and release points, for abandoned well incidents, 2000–2015, regulated areas including US GoM OCS
Installation type Main category Release point
Flow path
Total Through annulus
Through outer annulus
Outside casing
Abandoned wellhead Well release Subsea wellhead 2 2
Bottom fixed Blowout (surface flow) From wellhead 1 1 2
TOTAL ALL 2 1 1 4

Loss of Well Control Occurrence and Size Estimators, Phase I and II
Page 118
Table 13.5 LOWC flow paths and release points, for producing well incidents, 2000–2015, regulated areas including US GoM OCS
Installation type Main category Release point Through tubing
Through outer annulus
Outside casing
Unknown Total
No external cause
Bottom fixed
Blowout (surface flow)
From x-mas tree 2 2
Subsea - outside casing 1 1
Well release
From wellhead 1 1 2
From x-mas tree 2 2
Unknown 1 1
Total 5 1 1 1 8
Subsea X-mas tree
Well release Subsea x-mas tree 2 2
Total 2 2
Total LOWC with NO external cause 7 1 1 1 10
LOWC with external cause
Bottom fixed
Blowout (surface flow)
From wellhead 1 1
From x-mas tree 2 2
Subsea wellhead 2 2
Total 5 5
TOTAL ALL 12 1 1 1 15
All the production LOWC incidents with external causes occurred on bottom fixed installations
and had the flow path through the tubing.
Table 13.6 LOWC flow paths and release points, for unknown phase well incidents, 2000–2015, regulated areas including US GoM OCS
Main Category Flow path
Total Through test string Through annulus
Blowout (surface flow) 1 1
Well release 1 1
Total 1 1 2
13.2 LOWCS DURATION
The LOWC events have a highly variable duration. In general, well releases have a short
duration, while blowout (surface flow) and underground blowouts have a longer duration.
Table 13.7 shows an overview of the LOWC duration for the various phases of operation and
LOWC types.

Loss of Well Control Occurrence and Size Estimators, Phase I and II
Page 119
Table 13.7 LOWC duration 2000–2015, regulated areas including US GoM OCS
Phase Deep or shallow zone
Duration grouped
T ≤10 mins
10min < T ≤
40min
40min < T ≤ 2 hrs
2 hrs < T ≤ 12
hrs
12 hrs < T ≤ 2 days
2 days < T ≤ 5 days
T > 5 days
Un-known
Total
Blowout (surface flow)
Development drilling Deep 1 1 1 3
Shallow 1 2 1 2 2 1 1 10
Exploration drilling Deep 1 1 1 3 4 10
Shallow 1 1 2 2 6
Completion 1 1 2
Workover 1 3 3 1 1 2 11
Production (no external cause) 1 1 1 3
Production (external cause) 1 1 3 5
Wireline 1 1
Abandoned well 1 1 2
Unknown 1 1
Total 1 1 4 9 7 6 13 13 54
Blowout (underground flow)
Development drilling Deep 1 1
Exploration drilling Deep 2 1 3
Total 2 2 4
Diverted well release
Development drilling Shallow 2 2 1 1 6
Exploration drilling Deep 1 1
Shallow 1 2 1 4
Completion 1 1
Total 2 3 2 3 2 12
Well release
Development drilling Deep 2 2
Exploration drilling Deep 4 4
Shallow 1 1 2
Completion 4 1 5
Workover 15 1 1 1 18
Production (no external cause) 1 1 2 3 7
Wireline 6 6
Abandoned well 1 1 2
Unknown 1 1
Total 33 2 2 2 1 2 5 47
TOTAL ALL 36 6 8 14 10 6 17 20 117
13.3 HOW THE LOWCS FLOW WERE STOPPED
LOWC events may be stopped by various means. The mean for stopping the flow will depend
on the LOWC event. Some stop by themselves (bridging or depletion). In the worst case a
relief well may be required to stop the flow. Figure 13.2 shows the methods used to stop the
LOWC events.

Loss of Well Control Occurrence and Size Estimators, Phase I and II
Page 120
Figure 13.2 Control methods for LOWC events 2000–2015, regulated areas including US GoM OCS
Most of the LOWC events were controlled by the BOP, pumping mud, bridging, or they were
capped. For two of the 117 LOWC events a relief well was needed to stop the surface flow. For
others relief wells may have been started or used to finally secure the well, but not to stop the
flow to surroundings. One LOWC that occurred in 2004 due to a hurricane is still flowing. The
selected method to be used will always depend on the situation.
A more detailed overview of how the LOWC events were stopped for the various phases of
operation and LOWC types is shown in Table 13.8.
30
17
21
7
21
8
2 110
How flow from LOWCs were stopped
BOP
Bridged/ceased/depleted
Capped
Cemented
Mud
Other
Relief well
Still flowing
Unknown

Loss of Well Control Occurrence and Size Estimators, Phase I and II
Page 121
Table 13.8 How the LOWC events are stopped for the various phases of operation and LOWC types, 2000–2015, regulated areas
Main Category
Control method
Phase of operation
Total
Development drilling
Exploration drilling
Comp-letion
Work-over
Produ-ction
Wire-line
Aban-doned
well
Un-known
Deep Shallow Deep Shallow
Blowout (surface flow)
BOP 1 1 1 3
Bridged/ceased/depleted 1 4 4 1 1 1 12
Capped 1 1 3 3 3 11
Cemented 2 1 3
Mud 3 1 4 6 1 15
Other 1 1
Relief well 1 1 2
Unknown 1 1 2 1 1 6
Still flowing 1 1
Total 3 10 10 6 2 11 8 1 2 1 54
Blowout (under-ground flow)
Cemented 2 2
Unknown 1 1 2
Total 1 3 4
Diverted well release
BOP 1 1 2
Bridged/ceased/depleted 2 1 3
Mud 3 3 6
Unknown 1 1
Total 6 1 4 1 12
Well release
BOP 1 4 5 12 3 25
Bridged/ceased/depleted 1 1 2
Capped 4 3 2 1 10
Cemented 1 1 2
Other 1 1 4 1 7
Unknown 1 1
Total 2 4 2 5 18 7 6 2 1 47
Total 6 16 18 12 8 29 15 7 4 2 117
For the blowout (surface flow) and diverted well release LOWC events the most common
methods to stop the events are either that, the well stops to flow by itself (bridging), by pumping
mud, or capped. For the well releases, the most common way the flow is stopped is by the BOP.
The flow from the two LOWC events that were stopped by a relief well were one development
drilling LOWC event in Australia in 2009 and one production LOWC event in the US GoM
OCS in 2007.
13.4 LOWC FLOW MEDIUM AND SPILL
Table 13.9 shows an overview of the LOWC flow medium for the incidents 2000–2015 in
regulated areas including US GoM OCS.

Loss of Well Control Occurrence and Size Estimators, Phase I and II
Page 122
Table 13.9 LOWC events flow medium as listed in the database for 2000–2015 in regulated areas including US GoM OCS
Main Category
Flow Medium
Phase of operation
Develop-ment
drilling
Explor-ation
drilling
Comp-letion
Work-over
Prod-uction
Wire-line
Aband-oned well
Un-known
Total
Blowout (surface flow)
Condensate, Gas (deep) 3 1 4
Condensate, Gas (deep), water 1 1
Gas (deep) 1 3 2 4 4 1 15
Mud 1 1
Oil 1 2 1 4
Oil, Gas (deep), Condensate 1 1
Oil, Gas (deep) 2 4 1 7
Oil, Gas (deep), Mud 1 1
Oil, Gas (deep), Water 1 1
Shallow gas 7 6 1 14
Shallow gas, Mud 2 2
Shallow, unknown fluid 1 1
Unknown 1 1
Water 1 1
Total 13 16 2 11 8 1 2 1 54
Blowout (underground flow)
Gas (deep) 1 2 3
Unknown 1 1
Total 1 3 4
Diverted well release
Gas (deep), Mud 1 1 2
Mud 1 1
Shallow gas 1 3 4
Shallow gas, Mud 2 2
Shallow gas, Water 3 3
Total 6 5 1 12
Well release
Condensate, Gas (deep) 1 1
Gas (deep) 1 1 2 7 3 5 1 20
Gas (deep), Mud 1 1
Mud 1 4 5
Oil 1 2 1 1 5
Oil, Gas (deep) 1 1 1 3
Oil, Gas (deep), Mud 1 1 2
Oil, Gas (deep), Water 1 1
Oil, Water 1 1 2
Shallow gas, Water 1 1
Unknown 1 1 3 5
Water 1 1
Total 2 6 5 18 7 6 2 1 47
Total 22 30 8 29 15 7 4 2 117
Fourteen of the 54 blowout (surface flow) events included oil as a part of the flow medium,
while five included condensate (grey shaded). In addition, thirteen of the well releases were
listed with oil as a part of the flow (grey shaded), and one condensate. Gas is nearly always a
part of the flow.
Table 13.10 shows a simplified version of Table 13.9, where the flow medium has been
grouped in accordance with the worst component of the flow with respect to environmental
issues.

Loss of Well Control Occurrence and Size Estimators, Phase I and II
Page 123
Table 13.10 LOWC events grouped flow medium for 2000–2015 in regulated areas including US GoM OCS
Main category Flow medium grouped
Development drilling
Exploration drilling
Comp-letion
Work-over
Prod-uction
Wireline Abandoned
well Un-
known Total
Blowout (surface flow)
Oil 2 4 4 3 1 14
Condensate
3 1 1 5
Gas 1 3 2 4 4
14
Shallow event 10 6 1 17
Mud or water 2 2
Unknown
1
1
2
Total 13 16 2 11 8 1 2 1 54
Blowout (underground flow)
Gas 1 2
3
Unknown
1
1
Total 1 3
4
Diverted well release
Gas
1 1
2
Shallow event 6 3 9
Mud or water
1
1
Total 6 5 1
12
Well release
Oil 1 2 4 3 1 1 1 13
Condensate 1 1
Gas 1 2 2 7 3 4 1 20
Shallow event 1 1
Mud or water 1 1 4 6
Unknown 1 1
3 1
6
Total 2 6 5 18 7 6 2 1 47
Total
22 30 8 29 15 7 4 2 117
All LOWC incidents where oil or condensate is a part of the flow medium have been reviewed
with respect to the amount of spill from the well based on the description of the incident. The
flows have further been categorized in spill size.
The following categories for the spill size have been used;
< 10 bbls = very small
10 – 50 bbls = small
50 – 500 bbls = medium
500 – 5,000 bbls = large
5,000 – 50,000 bbls = very large
> 50,000 bbls = gigantic
Table 13.11 shows a short description of the spills with size categories, alongside some key
data.

Loss of Well Control Occurrence and Size Estimators, Phase I and II
Page 124
Table 13.11 Overview of oil and condensate spill size from LOWC events, 2000–2015, regulated areas including US GoM OCS
Main cate-gory
Flow Medium Type
LOWC ID
Country Phase Year Spill description Spill size category
Blow-out (surface flow)
Condensate, Gas (deep)
520 US GoM OCS Workover 2003
1 MMcf of gas and 10 barrels of condensate were blown out of the well with the uncontrolled gas flow, most of which is assumed to have spilled into the ocean. A light, broken, streaky sheen measuring approximately 2 miles by ½ mile was visible the next morning
Very small
525 US GoM OCS Workover 2004 The Operator did estimate approximately 5 gallons of condensate went into the water.
Very small
626 UK Abandoned
well 2012
Much gas and some condensate. The condensate created a scattered sheen that evaporated. The estimated flow rate was around 2 kg/s gas for 53 days.
Small
631 US GoM OCS Workover 2013 Light sheen Very small
519 US GoM OCS Production 2002 Approximately 21 gallons of condensate were released during the incident which produced a barely visible sheen on the water
Very small
Oil
483 Brazil Unknown 2001 Calculated the volume to be some 25,000 liters (150 bbls) Medium
517 US GoM OCS Production 2002 An estimated 350 barrels of crude oil was released, creating a dark brown slick 6 miles long by 50 yards wide.
Medium
619 Brazil Expl.drlg 2011 600 bbls per day or 3,700 bbls in total. Large
646 US GoM OCS Production 2004
Are still leaking oil. In 2014 the daily volume of oil discharging as fluctuated between a low of less than one barrel of oil to a high of 55 barrels, average 2 bbls a day. The cumulative release over 14 years is very large. Average sheen size of 8 square miles
Very large
Oil, Gas (deep)
463 US GoM OCS Expl.drlg 2000 Gas and oil, unknown rate. Oil collected in DOT tanks Very small
480 US GoM OCS Workover 2001 The spill amount was determined to be 1.56 gallons. All attempts to recover any amount of oil were unsuccessful because of the small amount and area of coverage.
Very small
539 US Pacific OCS Workover 2004 A spill of approximately 3 gallons of crude oil went into the ocean. Very small
591 US GoM OCS Workover 2008 Oil and gas unknown volume Small
611 US GoM OCS Expl.drlg 2010 8,000 m3 a day in 85 days, 680,000 m3, or 4,250,000 bbls Gigantic
621 US GoM OCS Workover 2012 An estimated 9.34 gallons of oil was determined to have entered the Gulf waters.
Very small
648 US GoM OCS Production 2015 Minor sheening and gas bubbling. Very small
Oil, Gas (deep), Conden-sate
524 US GoM OCS Dev.drlg 2004 A sheen was observed trailing from the platform with pollution estimated to be 5.4 barrels (bbl) condensate and oil.
Very small
Oil, Gas (deep), Mud
464 US GoM OCS Expl.drlg 2000 150-200 barrels of crude oil from the wellbore and approximately 806 barrels of synthetic mud
Medium
Oil, Gas (deep), Water
590 Australia Dev.drlg 2009 A total volume of 29,600 barrels 4,800 m3, or 66 m3 per day Very large
Well release
Condensate, Gas (deep)
521 US GOM OCS Production 2003 Approximately one gallon of condensate was spilled into the Gulf. Mostly gas was released
Very small
Oil
609 US GoM OCS Abandoned
well 2009 5.1 barrels oil per day, 62 barrels in total (10 m3) Medium
624 US GOM OCS Production 2011 Sheen approx. 1/2 mile long by 100 yards. Estimated 1 gallon released to the water.
Very small
643 US GoM OCS Workover 2014 Estimated area of 300 ft. by 50 ft. of oil was in the water Very small
653 UK Production 2008 20 tonnes of oil (140 barrels), some going to sea Small
655 UK Unknown 2008 188 kg oil Very small
Oil, Gas (deep)
627 US GoM OCS Workover 2012 Seems only to have been gas, but the well was producing oil 3 years before
Very small
651 UK Wireline 2014 Estimated the amount of oil released to be between 900 - 950kg Very small
672 US GOM OCS Production 2015 Estimated 0.67 gallons of oil leaked into the waters Very small
Oil, Gas (deep), Mud
538 US GoM OCS Expl.drlg 2004 Riser gas, mud, and approximately 11 bbls was entrained crude oil Very small
614 UK Completion 2009 Approximately three barrels of oil-based mud and the equivalent 0.9 tons of oil lost to sea
Very small
Oil, Gas (deep), Water
597 UK Workover 2007 Slight amount of oil Very small
Oil, Water 475 US Pacific OCS Workover 2000
10 barrels of water and 15 barrels of oil. About one gallon of oil sprayed overboard.
Small
573 UK Completion 2003 Approximately 2 bbl of crude/brine was spilled on the drill floor Very small

Loss of Well Control Occurrence and Size Estimators, Phase I and II
Page 125
The majority of the spills are small or very small. One oil spill is categorized as gigantic and it
is the Deepwater Horizon blowout in 2010. The Montara blowout in 2009 is categorized as
very large, and the Frade Blowout in 2011 is characterized as large. These events occurred
during drilling operations. In addition there is one event that occurred in 2004 and is still
ongoing. A storm created an underwater landslide that toppled the Mississippi Canyon 20A
production platform. The daily leak rate is limited to some barrels, but the cumulative leak over
12 - 13 years caused this LOWC to be categorized as very large. The total volume leaked over
this period has been estimated to be between 6,000 – 25,000 barrels.
Figure 13.3 shows the spill size distribution for spills with release of oil or condensate.
Figure 13.3 Spill size distribution for LOWC spills with release of oil or condensate
13.5 WATER DEPTH WHEN LOWCS OCCURRED
Figure 13.4 shows an overview of number of LOWC occurrences within the various water
depth ranges.
12
1
4
421
LOWCs with spill of oil or condensate
Gigantic > 50,000 bbls
Very large (5,000 – 50,000 bbls)
Large (500 – 5,000 bbls)
Medium (50 – 500 bbls)
Small (10 – 50 bbls)
Very small (< 10 bbls)

Loss of Well Control Occurrence and Size Estimators, Phase I and II
Page 126
Figure 13.4 Water depth and number of LOWC occurrences, regulated areas including US GoM OCS 2000–2015
The majority (75%) of LOWC events occurred in water depths less than 200 m (656 ft.).
Table 13.12 shows the water depth related number of LOWC events for the various phases of
operation.
Table 13.12 Water depth related number of LOWC events for the various phases of operation, regulated areas including US GoM OCS 2000–2015
Water Depth Grouped
Phase
Total
Develop-ment
drilling
Explor-ation
drilling
Comp-letion
Work-over
Prod-uction
Wire-line
Aband-oned well
Un-known
<50 m (<164 ft.) 3 11 2 14 8 2 3 43
50 - 100 m (164 - 328 ft.) 15 4 2 7 4 2 1 35
100 - 200 m (328 - 656 ft.) 2 3 1 3 2 3 14
200 - 400 m (656 – 1,312 ft.) 2 1 3 1 1 8
400 - 600 m (1,312 – 1,969 ft.) 1 1
600 - 1000 m (1,969 – 3,281 ft.) 4 1 5
1000 - 1500 m (3,281 – 4,921 ft.) 4 4
1500 - 2500 m (4,921 – 8,202 ft.) 3 1 4
Unknown 1 2 3
Total 22 30 8 29 15 7 4 2 117
The majority of deepwater LOWC events (> 600 m/ 1,969 ft.) have occurred during exploration
drilling.
Table 13.13 shows the water depth related number of LOWC events for the various LOWC
categories.
Water depth and LOWC occurence
<50 m ( <164 ft )50 - 100 m ( 164 - 328 ft )100 - 200 m ( 328 - 656 ft )200 - 400 m ( 656 - 1312 ft )400 - 600 m ( 1312 - 1969 ft )600 - 1000 m ( 1969 - 3281 ft )1000 - 1500 m ( 3281 - 4921 ft )1500 - 2500 m ( 4921 - 8202 ft )Unknown

Loss of Well Control Occurrence and Size Estimators, Phase I and II
Page 127
Table 13.13 Water depth related number of LOWC events for the various LOWC categories, regulated areas including US GoM OCS 2000–2015
Water Depth Grouped
Main category
Blowout (surface flow)
Blowout (underground flow)
Diverted well release
Well release
Total
<50 m (<164 ft.) 24 2 4 13 43
50 - 100 m (164 - 328 ft.) 17 1 4 13 35
100 - 200 m (328 - 656 ft.) 6 1 7 14
200 - 400 m (656 – 1,312 ft.) 3 1 4 8
400 - 600 m (1,312 – 1,969 ft.) 1 1
600 - 1000 m (1,969 – 3,281 ft.) 2 2 1 5
1000 - 1500 m (3,281 – 4,921 ft.) 1 1 2 4
1500 - 2500 m (4,921 – 8,202 ft.) 1 3 4
Unknown 3 3
Total 54 4 12 47 117
13.6 WELL DEPTH WHEN LOWCS OCCURRED
Figure 13.5 shows an overview of the distribution LOWC occurrences within the various well
depth ranges. Primarily it has been sought for the TVD, but for some incidents only the MD
has been given. In those cases, the MD is used.
Figure 13.5 Well depth when LOWC events occurred and distribution of occurrences, regulated areas including US GoM OCS 2000–2015
The well depth is unknown for 28% of the LOWC occurrences. If disregarding the LOWC
events with an unknown depth, 57% occurred between 2,000 and 4,000 meters, 25% in less
than 2,000 meter, and 18 % between 4,000 and 6,000 meter.
Table 13.14 shows the number of LOWC events for the various well depth groups and the
various phases of operation.
12
9
21
27
6
5
4
33
Well depth when LOWC occured
<1000 m (< 3,281 ft.)
1000 - 2000 m (3,281 – 6,562 ft.)
2000 - 3000 m (6,562 – 9,843 ft.)
3000 - 4000 m (9,843 – 13,123 ft.)
4000 - 5000 m (13,123 – 16,404 ft.)
5000 - 6000 m (16,404 – 19,685 ft.)
6000 - 7000 m (19,685 – 22,966 ft.)
Unknown

Loss of Well Control Occurrence and Size Estimators, Phase I and II
Page 128
Table 13.14 Well depth related number of LOWC events for the various phases of operation, regulated areas including US GoM OCS 2000–2015
Well depth grouped
Phase
Total Develop-
ment drilling
Explor-ation
drilling
Comp-letion
Work-over
Prod-uction
Wire-line
Aband-oned well
Un-known
<1000 m (< 3,281 ft.) 8 4 12
1000 - 2000 m (3,281 – 6,562 ft.) 4 3 1 1 9
2000 - 3000 m (6,562 – 9,843 ft.) 1 7 2 6 4 1 21
3000 - 4000 m (9,843 – 13,123 ft.) 2 3 3 11 6 1 1 27
4000 - 5000 m (13,123 – 16,404 ft.) 3 1 2 6
5000 - 6000 m (16,404 – 19,685 ft.) 2 1 2 5
6000 - 7000 m (19,685 – 22,966 ft.) 2 1 1 4
Unknown 5 8 2 8 4 4 2 33
Total 22 30 8 29 15 7 4 2 117
A large proportion of the drilling LOWC events occur shallow in the well.
Table 13.15 shows the number of LOWC events for the various LOWC categories and the well
depth.
Table 13.15 Well depth related number of LOWC events for the various LOWC categories, regulated areas including US GoM OCS 2000–2015
Well depth grouped
Main category
Total Blowout (surface flow)
Blowout (underground flow)
Diverted well release
Well release
<1000 m (< 3,281 ft.) 5 7 12
1000 - 2000 m (3,281 – 6,562 ft.) 7 2 9
2000 - 3000 m (6,562 – 9,843 ft.) 11 1 9 21
3000 - 4000 m (9,843 – 13,123 ft.) 17 10 27
4000 - 5000 m (13,123 – 16,404 ft.) 2 1 3 6
5000 - 6000 m (16,404 – 19,685 ft.) 4 1 5
6000 - 7000 m (19,685 – 22,966 ft.) 1 3 4
Unknown 10 4 19 33
Total 54 4 12 47 117
13.7 LOWCS THAT COME FROM MAIN RESERVOIR
A LOWC event during drilling may occur at any depth in a well. Drilling LOWC events that
do not come from the main reservoir are unlikely to cause large releases of hydrocarbons.
In general, it can be assumed that:
- Shallow zone LOWC events will not come from the main reservoir.
- Workovers and completion LOWC events will likely come from the main reservoir.
- Deep zone drilling LOWC events may come from the main reservoir or
accumulations of hydrocarbons higher up in the well.
It has been investigated how many of the deep zone drilling LOWC events that come from the
main reservoir. For this investigation, only the US GoM OCS LOWC events have been
reviewed. For the deep zone drilling LOWC events from the other areas, there is not enough
background information to evaluate the individual incidents.

Loss of Well Control Occurrence and Size Estimators, Phase I and II
Page 129
To perform this evaluation various sources have been reviewed:
- The description of the LOWC events in the SINTEF Offshore Blowout Database [7]
- The 5010 borehole file [8]
- eWell WAR descriptions [10]
It has been looked at:
- The description of the LOWC to see if there is specific references to the reservoir.
- TD of the well vs. the well depth when the LOWC occurred.
- If well was sidetracked and deepened after the LOWC.
- Type of casing in the well when the incident occurred.
Based on this it has been concluded if the flow stemmed from the reservoir or not for the
individual LOWC events.
There were in total 18 deep zone drilling LOWC events from the US GoM OCS for the period
2000–2015.
The result from this evaluation is presented in Table 13.16.
Table 13.16 Origin of well flow, deep zone drilling LOWC events US GoM OCS, 2000–2015
Origin of flow Main category Phase of operation
Total Development drilling
Exploration drilling
Reservoir
Blowout (surface flow) 5 5
Blowout (underground flow) 1 1 2
Total 1 6 7
Not reservoir
Blowout (surface flow) 2 4 6
Blowout (underground flow) 1 1
Diverted well release 1 1
Well release 1 2 3
Total 3 8 11
Total 4 14 18
From Table 13.16 it can be seen that seven of the 18 deep zone drilling LOWC events came
from the reservoir, while the remaining 11 did not.
13.8 WELL DEPTH WHEN KICK OCCURRED VS. TOTAL WELL DEPTH
A well kick may occur at any depth in the well. Section 16.5, page 167 presents kick data from
the US GoM OCS. For these kicks, the depth when the kick occurred has been compared with
the total depth of the well.
It is reasonable to believe that most kicks occurring prior to reaching the target reservoir will
have a limited flow potential. Large oil releases are unlikely from these hydrocarbon deposits.
Figure 13.6 and Figure 13.7 show the well depth when the kick occurred vs. the total well depth
for kicks occurring in US GoM OCS wells spudded in the period 2011 – 2015.

Loss of Well Control Occurrence and Size Estimators, Phase I and II
Page 130
Figure 13.6 Kick depth vs. total well depth US GoM exploration wells spudded 2011 - 2015
Figure 13.7 Kick depth vs. total well depth US GoM development wells spudded 2011 - 2015
A large proportion of the well kicks occur before the wells have reached the reservoir. The
proportion is larger than indicated in Figure 13.6 and Figure 13.7, because some of the kicks
cause that the wells are abandoned. It has not been estimated how many of the kicks caused the
wells to be plugged and abandoned.
0%
10%
20%
30%
40%
50%
60%
70%
80%
90%
100%
0% 10% 20% 31% 41% 51% 61% 72% 82% 92%
Kic
k d
epth
vs.
to
tal w
ell
dep
thRelative difference Drilling TVD when kick occured
vs. total WD TVD, exploration wells
0,0 %
10,0 %
20,0 %
30,0 %
40,0 %
50,0 %
60,0 %
70,0 %
80,0 %
90,0 %
100,0 %
1% 11% 21% 31% 41% 51% 61% 71% 81% 91%
Kic
k d
epth
vs.
to
tal w
ell d
epth
Relative difference Drilling TVD when kick occured vs. total WD TVD, development wells

Loss of Well Control Occurrence and Size Estimators, Phase I and II
Page 131
LOWC CONSEQUENCES
This section focuses on the consequences related to the experienced LOWC events. The data
comes from US GoM OCS and other regulated areas. The other regulated areas include
Norway, UK, the Netherlands, Canada East Coast, Australia, US Pacific OCS, Denmark, and
Brazil.
The LOWC consequences have focused on:
Fatalities
Pollution
Ignition
Material losses to rig
The first subsection presents an overview of the data while the remaining present some more
details related to the various phases of operation and LOWC category.
14.1 OVERVIEW OF EXPERIENCED CONSEQUENCES
Fatalities
In total 13 fatalities were observed in the regulated areas including the US GoM OCS for all
operations included in the period 2000 - 2015.
Table 14.1 Total number of LOWC events vs. number of fatalities in regulated areas including US GoM OCS 2000–2015
Main Category
No. of LOWC events/Fatalities
Development drilling
Exploration drilling Com-
pletion Work-over
Prod-uction
Wire-line
Aband-oned well
Un-known
Total Deep zone
Shallow zone
Deep zone
Shallow zone
Blowout (surface flow) 3 / 0 10 / 0 10 / 12 6 / 0 2 / 0 11 / 0 8 / 0 1 / 0 2 / 0 1 / 0 54 / 12
Blowout (underground flow) 1 / 0 / 3 / 0 / / / / / / / 4 / 0
Diverted well release / 6 / 0 1 / 0 4 / 0 1 / 0 / / / / / 12 / 0
Well release 2 / 0 / 4 / 0 2 / 0 5 / 0 18 / 1 7 / 0 6 / 0 2 / 0 1 / 0 47 / 1
Total 6 / 0 16 / 0 18 / 12 12 / 0 8 / 0 29 / 1 15 / 0 7 / 0 4 / 0 2 / 0 117 / 13
One LOWC event caused 11 fatalities and two LOWC events caused one fatality. Twelve
fatalities comes from blowout (surface flow) incidents and one during a well release.
In the period 1980–1999, 186 LOWC events occurred in the regulated areas including the US
GoM OCS during the same phases of operation. For this period 58 fatalities occurred. One
LOWC in Brazil (Enchova) in 1984 caused 37 fatalities. All died when a cable for the lifeboat
snapped during lowering. The remaining 21 died in eight different LOWC incidents
There have been LOWC events in the rest of the world with several fatalities in the period 2000
-2015. Table 14.2 shows an overview of the number of LOWC events and the number of
fatalities for the various phases of operation.

Loss of Well Control Occurrence and Size Estimators, Phase I and II
Page 132
Table 14.2 Total number of LOWC events vs. number of fatalities in the rest of the world, 2000–2015
Main Category
No. of LOWC events/Fatalities
Development drilling
Exploration drilling
Unknown drilling
Com-pletion
Work-over
Prod-uction
Wire-line
Aband-oned well
Un-known
Total Deep zone
Shallow zone
Deep zone
Shallow zone
Deep zone
Shallow zone
Blowout (surface flow)
6 / 1 2 / 0 3 / 2 2 / 0 2 / 0 2 / 0 2 / 0 2 / 0 11 / 58 / 2 / 0 2 / 0 36 / 61
Blowout (underground flow)
/ / / / / / / / / / / / /
Diverted well release / / / / / / / / / / / / /
Well release 1 / 0 / / / / / / 1 / 0 / / / / 2 / 0
Unknown / / / / / / / 1 / 0 / / / / 1 / 0
Total 7 / 1 2 / 0 3 / 2 2 / 0 2 / 0 2 / 0 2 / 0 4 / 0 11 / 58 0 / 0 2 / 0 2 / 0 39 / 61
Five of the LOWC events in the rest of the world involved fatalities. Two occurred during
drilling and three during the production phase. The three production LOWCs that involved
fatalities were;
Azerbaijan 2015, 32 fatalities during evacuation.
Mexico 2007, 23 fatalities during evacuation
Saudi Arabia 2007, three persons died for unknown reasons
For the period 1980 – 1999 there were some LOWCs incidents with several fatalities. One in
China in 1980 during exploration drilling that caused 70 fatalities (rig Bohai 3). One in Saudi
Arabia in 1980 during exploration drilling that caused 19 fatalities due to inhaling H2S (rig Ron
Tappmaier). Further, in 1980, for one drilling incident in the Nigerian delta it was claimed that
180 civilians died due to the pollution (Rig Sedco 135C).
There were further, 10 more LOWC incidents in rest of the world that caused in total 33
fatalities for the period 1980 – 1999.
Pollution
Table 13.11, page 124 shows all LOWC events with oil and condensate spills in the period
2000–2015 in the US GoM OCS and the regulated areas.
Three of the deep zone drilling LOWC events that occurred in 2000–2015 in the US GoM OCS
and the regulated areas caused a major pollution. These accidents occurred in 2009, 2010, and
2011.
2009 – Australia, Montara: A total volume of 29,600 barrels 4,800 m3, or 66 m3 per day.
2010 – USA, Macondo: 8,000 m3 a day in 85 days, in total 680,000 m3, or 4,250,000 bbls
2011 – Brazil, Frade field: 600 bbls per day or 3,700 bbls in total.
The spill from the Macondo blowout was 140 times larger than the Montara blowout and 1,150
times larger than the Frade blowout in terms of amount of oil released. These incidents caused
large media attention, high direct costs, and loss of reputation for the involved parties.

Loss of Well Control Occurrence and Size Estimators, Phase I and II
Page 133
In addition there is one event that occurred in 2004 and is still ongoing. A storm created an
underwater landslide that toppled the Mississippi Canyon 20A production platform. The daily
leak rate is limited to some barrels, but the cumulative leak over 12 - 13 years caused this
LOWC to be categorized as very large. The total volume leaked over this period has been
estimated to be between 6,000 – 25,000 barrels.
In 2001 a spill occurred in Brazil. The total volume was estimated to 150 barrels. For this spill
the phase of operation was unknown. In 2002 a 350 bbls spill to the sea from a producing well
occurred in the US GoM OCS.
Further, one drilling LOWC event in 2000 caused a release of 150–200 barrels of crude oil
(Mississippi Canyon 584). Further, an abandoned well spilled 62 barrels before being
controlled in 2010.
For workovers and completions, some LOWC events were listed with minor pollution. These
spills were not severe. Typically, some few gallons of oil entered the water or a limited sheen
was reported. None of these incidents were regarded as important pollution events.
In the period 1980–1999, none of the LOWC events in the US GoM OCS, Norway, or UK
caused any significant pollution incident.
Ignition
Table 14.3 shows the number of ignited LOWC events and the ignition time.
Table 14.3 Ignition of LOWC events in regulated areas including US GoM OCS 2000–2015
Main category
Ignition time grouped
Development drilling
Exploration drilling
Compl-etion
Work-over
Prod-uction
Wire-line
Abando-ned well
Unknown Total Distri-
bution % Deep Shallow Deep Shallow
Blowout (surface flow)
Immediate ignition 2 1 1 4 7.4 %
5 min - 1 hour 1 1 1.9 %
6 - 24 hours 1 1 1.9 %
More than 24 hours 1 1 2 3.7 %
No ignition 2 8 8 6 1 11 7 1 1 1 46 85.2 %
Total 3 10 10 6 2 11 8 1 2 1 54 100.0 %
Blowout (undergro-und flow)
No ignition 1 3 4 100.0 %
Total 1 3 4 100.0 %
Diverted well release
No ignition 6 1 4 1 12 100.0 %
Total 6 1 4 1 12 100.0 %
Well release
Immediate ignition 1 1 2 4.3 %
No ignition 2 3 2 5 17 7 6 2 1 45 95.7 %
Total 2 4 2 5 18 7 6 2 1 47 100.0 %
Total all 6 16 18 12 8 29 15 7 4 2 117
Eight (8.5%) of the 117 LOWC events ignited. Eight (14.8%) of the blowout (surface flow) and
two (4.3%) of the well releases ignited. Blowout (surface flow) may ignite immediately or
delayed, whereas well releases typically have a short duration and, if igniting, it ignites
immediately.
Material losses to rig
Table 14.4 gives an overview of the installation damages related to LOWC events.

Loss of Well Control Occurrence and Size Estimators, Phase I and II
Page 134
Table 14.4 Installation damages of LOWC events in regulated areas including US GoM OCS 2000–2015
Main category
Consequence Class
Development drilling
Exploration drilling
Comp-letion
Work-over
Prod-uction
Wire-line
Abando-ned well
Un-known
Total
Deep Shallow Deep Shallow
Blowout (surface flow)
Total loss 1 1 1 1 4
Severe 1 1 2
Damage 1 1 1 3
Small 1 2 1 4
No 1 8 6 5 1 10 5 1 1 1 39
Unknown 1 1 2
Total 3 10 10 6 2 11 8 1 2 1 54
Blowout (underground flow)
No 1 2 3
Unknown 1 1
Total 1 3 4
Diverted well release
No 6 1 4 1 12
Total 6 1 4 1 12
Well release
Severe 1 1
Damage 1 1
Small 3 3
No 2 3 2 5 13 7 5 2 1 40
Unknown 1 1 2
Total 2 4 2 5 18 7 6 2 1 47
Total all 6 16 18 12 8 29 15 7 4 2 117
Most LOWC events lead to minor consequences for the installations. Four of the 117 events in
Table 14.4 are categorized as total loss after the LOWC event, and three are listed with severe
damage.
14.2 SHALLOW ZONE DRILLING LOWCS
A total of 27 shallow zone LOWC events were observed in the regulated areas including US
GoM OCS in shallow gas in the period 2000–2015.
Fatalities
No fatalities were experienced related to shallow gas in regulated areas including US GoM
OCS in the period 2000–2015.
Pollution
None of the LOWC events caused any significant pollution, only gas, formation water, and
drilling mud was spilled.
Ignition
Table 14.5 shows an overview of the experienced ignition for the shallow zone LOWC events
in regulated areas including US GoM OCS in in the period 2000–2015.

Loss of Well Control Occurrence and Size Estimators, Phase I and II
Page 135
Table 14.5 Experienced ignition of shallow gas LOWC events in regulated areas including US GoM OCS 2000–2015
Main category
Ignition time grouped
Total Drilling without riser Drilling with riser
No ignition No ignition 5 min - 1 hour More than 24 hours
Blowout (surface flow) 6 8 1 1 16
37.5 % 50.0 % 6.3 % 6.3 % 100.0 %
Diverted well release 10 10
100.0 % 100.0 %
Well release 2 2
100.0 % 100.0 %
Total 8 18 1 1 28
28.6 % 64.3 % 3.6 % 3.6 % 100.0 %
Two of the 28 LOWC events ignited. Both these LOWC events occurred during blowout
(surface flow) when drilling with a riser, i.e. from a fixed installation. When drilling without a
riser, shallow zone LOWC events rarely ignites. In deepwater the gas will pose no danger for
an installation. Some gas will dissolve in the water and the gas that comes to the surface (if
any) will be released in a large area so an explosive mixture of gas and air will not be formed.
In shallow water, shallow gas released on the seafloor may cause a danger. Successfully
diverted LOWC events rarely ignite.
Material losses to rig
Only the two ignited LOWC events caused significant damage to the installation. For one the
damage to the rig and platform was estimated to be two million dollars (2002). For the other
the derrick and substructure of the rig collapsed onto the platform, but no cost was listed in the
investigation report (2000).
In the period 1980 – 2000, a total of 72 shallow gas LOWC events occurred in the regulated
areas including US GoM OCS. Seven of these ignited and two of the ignited LOWC events
caused fatalities. One in Norway (1985) causing one fatality and one in the US GoM OCS back
in 1980 causing six fatalities.
14.3 DEEP ZONE DRILLING LOWCS
A total of 24 deep zone drilling LOWC events were observed in the regulated areas including
US GoM OCS in the period 2000–2015.
Fatalities
Two of the 24 LOWC events involved fatalities in the regulated areas including US GoM OCS
in the period 2000–2015. One LOWC caused 11 fatalities and the other caused one fatality.
Both these LOWC events were blowout (surface flow). The accident with 11 fatalities was the
Deepwater Horizon accident. The persons immediately died in the explosion. For the other fatal
accident (2001), there was no ignition. The person did not evacuate with the others and
disappeared, and the body was never found.
If looking at the deep zone drilling LOWC events in the period 1980 until 1999 there were in
to total 47 LOWC events. Four LOWC events involved fatalities. These were blowout (surface

Loss of Well Control Occurrence and Size Estimators, Phase I and II
Page 136
flow) LOWC events that ignited. Two with a single fatality, one with four fatalities, and one
with five fatalities. All the LOWC events that involved fatalities occurred in the 80’s.
Pollution
Three of the 24 LOWC events caused major pollution accidents:
• Australia, Montara; A total volume of 29,600 barrels 4,800 m3, or 66 m3 per day
(2009)
• USA, Macondo: 8,000 m3 a day in 85 days, 680,000 m3, or 4,250,000 bbls (2010)
• Brazil, Frade field: 600 bbls per day or 3,700 bbls in total (2011)
For the Australian LOWC event, only one barrier was present. When this barrier failed the well
flow could not be stopped. For the Brazilian LOWC event, water injection had increased the
formation pressure to above the natural formation pressure. The formation broke down in
association with a kick occurrence. Oil was released through the formation to the sea floor.
In addition, one LOWC event in 2000 caused a release of 150-200 barrels of crude oil. The
LMRP was accidentally disconnected when drilling in the reservoir. They managed to re-
connect the LMRP after some hours.
If looking at the LOWC events from 1980–1999 none had a significant release of crude oil.
Only one of the deep zone drilling LOWC events had a significant release of condensate. That
was the Vinland blowout in 1984 offshore the east coast of Canada. The flow rate was estimated
to be 48 cubic meters/day (300 bbls a day) of condensate and 2 million cubic meter of gas per
day. The flow rate was observed to diminish throughout the course of the blowout. The blowout
lasted for 10 days. Sea surface spill was not mentioned in the data sources, indicating that the
condensate was evaporated/diluted rather fast. It was bad weather in the area through the first
days of the incident.
Table 13.11, page 124 shows all drilling LOWC events with oil and condensate spills in the
period 2000–2015 in the US GoM OCS and the regulated areas.
Ignition
Table 14.6 shows an overview of the experienced ignition for the deep zone drilling LOWC
events in regulated areas including US GoM OCS in in the period 2000–2015.

Loss of Well Control Occurrence and Size Estimators, Phase I and II
Page 137
Table 14.6 Experienced ignition of deep zone drilling LOWC events in regulated areas including US GoM OCS 2000–2015
Main category Ignition time grouped
Total No ignition
Immediate ignition
More than 24 hours
Blowout (surface flow) 10 2 1 13
76.9 % 15.4 % 7.7 % 100.0 %
Blowout underground flow 4 4
100.0 % 100.0 %
Diverted well release 1 1
100.0 % 100.0 %
Well release 5 1 6
83.3 % 16.7 % 100.0 %
Total 20 3 1 24
83.3 % 12.5 % 4.2 % 100.0 %
Of the 24 deep zone drilling LOWC events four ignited. Three of these four were blowout
(surface flow) LOWC events, and the forth one was a well release LOWC. Three of the four
incidents ignited immediately.
For the period 1980 to 1999, a total of 47 LOWC events occurred during drilling. Of these 47
incidents, eight ignited. All of them were blowout (surface flow) incidents. In total 25% of the
blowout (surface flow) LOWC events ignited.
Material losses to rig
For two of the LOWC events in regulated areas including US GoM OCS in in the period 2000–
2015 the installation was damaged beyond repair. One was the Deepwater Horizon rig that sank
because of the fire. The second one was the West Atlas Jack-up (used for Montara operations)
in Australia that was condemned.
For one well release LOWC, the rig was severely damaged. This was for a well drilled in Brazil
in 2007. The rig was inoperable for 11 months after the incident, before it was repaired. For
the remaining incidents, the damages were small.
14.4 WORKOVER LOWCS
A total of 29 workover LOWC events were observed in the regulated areas including US GoM
OCS in the period 2000–2015.
Fatalities
One workover LOWC caused a fatality. During a well release, the tubing was blown out of the
well causing the slips to fatally strike the operators representative.
If looking at the workover LOWC events in the period 1980 until 1999 there were in to total
31 LOWC events. Two LOWC events involved fatalities. One blowout (surface flow) LOWC
event ignited and caused two fatalities. The other one was an unignited well release where the
tubing used for removing the back pressure valve jumped and the rotary bushing inserts were
blown out. One of these inserts hit and killed a person.

Loss of Well Control Occurrence and Size Estimators, Phase I and II
Page 138
Pollution
Ten of the 28 workover LOWC events were listed with some pollution. These spills were not
severe. Typically, they were listed with some few gallons that had entered the water or a limited
sheen was reported. For none of the incidents the pollution was regarded as an important issue.
Table 13.11, page 124 shows all workover LOWC events with oil and condensate spills in the
period 2000–2015 in the US GoM OCS and the regulated areas.
If looking at the 31 workover LOWC events from 1980–1999 in US GoM OCS, Norway and
the UK, the same type of spills are observed, typically small and some sheen observed on the
sea surface.
Ignition
Table 14.7 shows an overview of the experienced ignition for the workover LOWC events in
regulated areas including US GoM OCS in in the period 2000–2015.
Table 14.7 Experienced ignition of workover LOWC events in regulated areas including US GoM OCS 2000–2015
Main category Ignition time grouped
Total No ignition Immediate ignition
Blowout (surface flow) 11 11
100.0 %
Well release 17 1 18
94.4 % 5.6 %
Total 28 1 29
96.6 3.4 %
Of the 29 workover LOWC events, only one ignited. This incident was a well release LOWC
that ignited immediately.
Material losses to rig
For three of the incidents there were minor damages to the installation. For the Norwegian
Snorre blowout, there was no significant damage to the installation, but it took several months
before the field could be restarted.

Loss of Well Control Occurrence and Size Estimators, Phase I and II
Page 139
14.5 COMPLETION LOWCS
Eight completion LOWC events were observed in the regulated areas including US GoM OCS
in the period 2000–2015.
Fatalities
None of the completion LOWC events caused fatalities.
If looking at the completion LOWC events in the period 1980 until 1999 there were in total 13
LOWC events. None of the LOWC events involved fatalities.
Pollution
None of the eight completion LOWC events were listed with pollution.
If looking at the 13 completion LOWC events from 1980–1999, two of them were listed with
small pollution. Both reported a light sheen.
Ignition
Table 14.8 shows an overview of the experienced ignition for the completion LOWC events in
regulated areas including US GoM OCS in the period 2000–2015.
Table 14.8 Experienced ignition of completion LOWC events in regulated areas including US GoM OCS 2000–2015
Main category Ignition time grouped
Total No ignition 6 – 24 hours
Blowout (surface flow) 1 1 11
50.0 % 50.0 % 100.0 %
Diverted well release 1 1
100.0 % 100.0 %
Well release 5 5
100.0 % 100.0 %
Total 7 1 28
87.5% 12.5% 100.0 %
Of the eight completion LOWC events only one ignited. This incident was the Walter Oil &
Gas blowout on Hercules 265 in 2013. The blowout ignited after 13 hours. The flow rate was
estimated to be 400 million cubic feet per day (115 kg/s). The platform was damaged beyond
repair, and Hercules received 50 million US Dollars from the insurance company.
None of the other completion LOWC events caused significant damage to the installation.
14.6 PRODUCTION LOWCS
Fifteen production well LOWC events were observed in the regulated areas including US GoM
OCS in the period 2000–2015. Five of these events were caused by an external force (storm,
collision, fire, etc.).

Loss of Well Control Occurrence and Size Estimators, Phase I and II
Page 140
Fatalities
None of the production well LOWC events caused fatalities.
Pollution
For eight of the 15 events, some pollution to the sea surface was observed. Six these releases
were small or very small. One was categories as medium and one as very large. The very large
spill has been going one for many years. The flowrate is low, but the cumulative amount of oil
spilled is high. For the medium spill an estimated 350 barrels of crude oil was released.
Ignition
One of the incidents ignited. This was an event where a boat hit an unmanned structure and
ignited immediately. Ninety percent of the structure was destroyed because of the collision and
subsequent fire.
14.7 WIRELINE LOWCS
Seven wireline LOWC events were observed in the regulated areas including US GoM OCS in
the period 2000–2015. Most of the incidents were categorized as well releases, that typically
have a short duration. One incident was categorized as a blowout (surface flow). For this case
the wireline BOP failed to stop the gas flow.
Fatalities
None of the wireline LOWC events caused fatalities.
Pollution
None of the LOWC events caused pollution to the sea surface. For one some oil was released,
but it was collected on the rig.
Ignition
None of the LOWC incidents ignited.
14.8 ABANDONED WELLS LOWCS
Four abandoned well LOWC events were observed in the regulated areas including US GoM
OCS in the period 2000–2015.
Fatalities
None of the abandoned well LOWC events caused fatalities.
Pollution
One incident caused a gas release. One incident (Elgin) released mostly gas, but some
condensate. The condensate created a scattered sheen that evaporated. The estimated flow rate
was around 2 kg/s for 53 days. For the third incident oil seeped from the abandoned wellhead
at an initial estimated rate of 5.1 barrels a day. The total volume spilled during the 32 days’
release was estimated to 62 barrels (10 m3). For the forth incident some gas leaked and allowed

Loss of Well Control Occurrence and Size Estimators, Phase I and II
Page 141
gas to migrate up through the cement into the annular void of the well and into the atmosphere,
when working on the neighbor well.
Ignition
One of the incidents ignited immediately. The fire lasted for 27 hours and made damages to the
installation.
For the other LOWC incidents there were no damages to the installations. The Elgin and
Franklin was however closed in for one year. The production rate from the field was around
70,000 barrels a day.
14.9 UNKNOWN PHASE LOWCS
Two Unknown Phase LOWC event was observed in the regulated areas including US GoM
OCS in the period 2000–2015. One was categorized as a well release, and the other as a blowout
(surface flow).
Fatalities
None of the Unknown Phase LOWC events caused fatalities.
Pollution
Both incidents caused a spill to sea. For one it was very small. For the other the release was in
the range of 80 – 150 barrels.
Ignition
None of the incident ignited.
There were no damages to the installations.

Loss of Well Control Occurrence and Size Estimators, Phase I and II
Page 142
LOWC CAUSAL FACTORS
The causal factor in this section stems from LOWC events that have occurred in the regulated
areas including the US GoM OCS for the period 2000 – 2015.
15.1 SHALLOW ZONE LOWC
The experience related to shallow zone LOWC events is presented in Section 5. The intention
with this subsection is to identify the most common causes related to shallow zone LOWC
events as well as the most frequent sequences of events leading to LOWC.
For shallow gas, the only barrier against flow is the hydrostatic pressure from the mud. If the
hydrostatic control of the well is lost it will result in a LOWC. Shallow flows cannot normally
be closed in because the fracture gradient at the casing shoe will normally be low, and a BOP
is not set on the wellhead.
For floating vessels, the shallow gas is released on the sea floor because there is no riser
between the wellhead and the rig. For fixed installation, the gas will normally be diverted away
from the rig.
15.1.1 SHALLOW ZONE KICK CAUSES
Figure 15.1 shows a distribution of the shallow zone kick causes.
Figure 15.1 Shallow zone kick causes
Unexpected high well pressure and flow after cementing are the two most frequent causes for
the shallow flows.
The shallow section of a well is frequently drilled with seawater as the drilling fluid; slightly
over pressured gas accumulations may initiate a flow. For several of the incidents shallow gas
was not expected to be present, because geo-hazard analysis did not foresee any shallow gas
problem. Shallow gas experience from nearby wells are not always considered. The risk of
shallow gas has not always been properly communicated to the involved parties.
12
6
8
2
Shallow zone kick causes
Unexpected high well pressure/toolow mud weight
Annular losses /Swabbing/unknown
While cement setting
Poor cement

Loss of Well Control Occurrence and Size Estimators, Phase I and II
Page 143
For some cases, the cement program was not properly designed. The flow while cement is
setting cases confirm that.
Important factors to focus on to reduce the possibility of flow after cementing are:
- Awareness of shallow gas.
- Continuously monitoring the annulus for fluid level or fluid gain.
- Waiting time for cement to cure.
- Utilize lower fluid loss cement slurry to avoid flow after cementing.
- Hold nominal pressure on annulus while waiting on cement.
15.1.2 HANDLING OF SHALLOW ZONE LOWCS
The handling of shallow gas LOWC events is separated in two pie charts. Figure 15.2 shows
shallow flow handling, when drilling without a riser and Figure 15.3 shows the shallow flow
handling, when drilling with a riser.
Figure 15.2 Shallow zone flow handling, drilling without a riser
5
2
1
Shallow flow handling, Drilling without riser
Subsea release
Not relevant
Other

Loss of Well Control Occurrence and Size Estimators, Phase I and II
Page 144
Figure 15.3 Shallow zone flow handling, drilling with a riser
Release at the seafloor for floating installations and diverted release for bottom fixed
installations are the normal outcomes of shallow gas flow.
For a large proportion of the diverted incidents, the diverters failed to function as intended.
Two incidents occurred because the diverter was nippled down, one because the diverter was
inoperable due to a human error, and in three cases there was a leak in the diverter or diverter
flange. Only one incident caused a diverter line to erode and leak. Diverter line leaks due to
erosion were far more frequent in the period 1980–1999, indicating that the diverter systems
have improved.
15.2 DEEP ZONE DRILLING
A deep zone drilling LOWC event will always start with a well kick. If failing to close in the
well when it kicks it will result in a LOWC event. It should be noted that well kicks are fairly
normal. They are normally detected in a timely manner and handled properly so an LOWC
event will not be the outcome. Well kick occurrences are discussed in Section 15.8, page 158.
15.2.1 KICK OBSERVATION
For 11 of the 24 drilling LOWC events the kick was not observed before fluid was flowing out
of the well. For nine the kick was observed in time to close in the well, and for four it is
unknown when the kick was observed. Figure 15.4 shows a pie diagram for the kick
observation.
10
7
2
1
Shallow flow handling, Drilling with riser
Diverted - no problem
Diverter failed or not in place
Casing/cement formation
Unknown/Not relevant

Loss of Well Control Occurrence and Size Estimators, Phase I and II
Page 145
Figure 15.4 Kick observation in deep zone drilling LOWC events
Many of these late observations are related to lack of attention, but some are also related to the
procedures followed. One typical example is that after the casing has been cemented and the
preset time for the cement to harden has ended, the surface BOP is nippled down to cut
casing/energize casing seals, and the well starts to flow when the BOP is disconnected. This
may be caused by too short waiting time, but other factors as cement type used and problems
during cementing may contribute to these types of incidents.
15.2.2 CAUSES FOR SECONDARY BARRIER FAILURES
For the 11 LOWC incidents categorized as blowout (underground flow), diverted well release,
and well release typically there were no equipment failures involved. For the blowout
(underground flow), typically the formation broke down.
For the well releases type LOWC events the most typical was that the BOP was closed late
because the kick was detected late. After the BOP was closed, the situations were controlled.
For the 13 blowout (surface flow) LOWC incidents equipment failures were involved in most
of them. Four of these incident occurred on drillships and semisubmersibles, eight on jack-ups
and one on a jacket.
Since the floating vessels have a subsea BOP and the jack-ups and jackets have a surface BOP
these have been separated when evaluating the secondary barrier failures for deep zone drilling
blowout (surface flow) LOWC events.
Figure 15.5 and Figure 15.6 shows pie diagrams for equipment failure in deep zone drilling
Blowout (surface flow.)
11
9
4
Kick observation, deep zone drilling LOWCs
Late kick observation
In time kick observation
Unknown
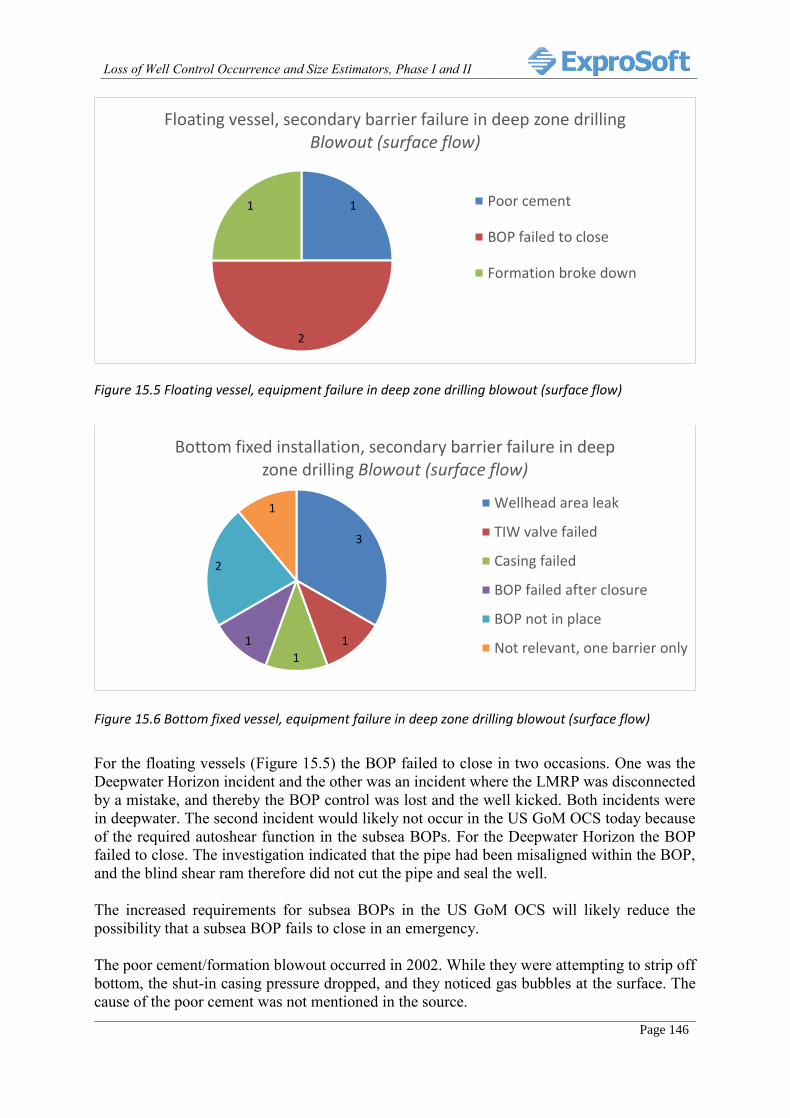
Loss of Well Control Occurrence and Size Estimators, Phase I and II
Page 146
Figure 15.5 Floating vessel, equipment failure in deep zone drilling blowout (surface flow)
Figure 15.6 Bottom fixed vessel, equipment failure in deep zone drilling blowout (surface flow)
For the floating vessels (Figure 15.5) the BOP failed to close in two occasions. One was the
Deepwater Horizon incident and the other was an incident where the LMRP was disconnected
by a mistake, and thereby the BOP control was lost and the well kicked. Both incidents were
in deepwater. The second incident would likely not occur in the US GoM OCS today because
of the required autoshear function in the subsea BOPs. For the Deepwater Horizon the BOP
failed to close. The investigation indicated that the pipe had been misaligned within the BOP,
and the blind shear ram therefore did not cut the pipe and seal the well.
The increased requirements for subsea BOPs in the US GoM OCS will likely reduce the
possibility that a subsea BOP fails to close in an emergency.
The poor cement/formation blowout occurred in 2002. While they were attempting to strip off
bottom, the shut-in casing pressure dropped, and they noticed gas bubbles at the surface. The
cause of the poor cement was not mentioned in the source.
1
2
1
Floating vessel, secondary barrier failure in deep zone drilling Blowout (surface flow)
Poor cement
BOP failed to close
Formation broke down
3
1
1
1
2
1
Bottom fixed installation, secondary barrier failure in deep zone drilling Blowout (surface flow)
Wellhead area leak
TIW valve failed
Casing failed
BOP failed after closure
BOP not in place
Not relevant, one barrier only

Loss of Well Control Occurrence and Size Estimators, Phase I and II
Page 147
The formation break down blowout occurred in Brazil in 2011. The reservoir was over
pressured by water injection. When drilling in the reservoir and taking a kick the well flowed
through a fault opened by the over pressure to the sea floor. A similar incident occurred in
China in 2011.
For the bottom fixed installations (Figure 15.6), three of the LOWC events occurred because
leaks developed in the wellhead area below the BOP during a kick. One of the leaks was caused
by a human error. The two others were regular leaks. These types of leaks are not observed for
wells drilled with subsea BOPs.
Two blowouts occurred when the BOP was not in place after cementing the casing. The BOP
was nippled down to cut casing or energize casing seals. These are incidents not observed for
wells with subsea BOPs.
For the BOP failed after closure, the annular preventer began leaking gas during the well control
operation.
In one case, they failed to close the TIW valve (kelly valve), three men were not able to apply
enough torque. The valve had not been regularly tested. The BOP did not include a blind shear
ram so the well could not be sealed off.
For one LOWC event the casing burst below its rated burst pressure because of heavy wear in
the casing that was not detected.
The not relevant incidents is the Montara LOWC event in Australia. The well did not have a
secondary barrier. When the primary barrier (an untested cement plug) failed, the blowout
occurred.
15.3 COMPLETION
This section focuses on the causes of the completion LOWC events. Since two barriers
normally should be present during completion operations, this section is focused on the causes
of losing the primary barrier and the secondary barrier. The primary barrier in completion
operations is normally the hydrostatic control of the well. In some cases, the primary barrier
may be a mechanical barrier, depending on how the completion is carried out and the progress
of the completion operation.
15.3.1 CAUSES FOR THE PRIMARY BARRIER FAILURES
All the completion LOWC events in the US GoM and the regulated areas occurred in killed
wells.
Figure 15.7 shows the kick observation time in completion LOWC events.

Loss of Well Control Occurrence and Size Estimators, Phase I and II
Page 148
Figure 15.7 Kick observation in completion LOWC events
For seven of the eight completion LOWC events the kick was not observed before the well was
flowing out to the surroundings.
The late kick detection may be caused by lack of attention, but such incidents are also caused
by unforeseen conditions in the well.
Keeping control of the fluid coming out of the well vs. the fluid pumped in is utmost important
in kick detection. For two of the LOWC events they had no control of the volume coming out
of the well. The fluid was pumped overboard or to the reserve pits without measuring the
volume.
Figure 15.8 shows an overview of the causes for the loss of the primary barrier during
completions LOWC events.
7
1
Completion LOWC observation
Late kick observation
Unknown

Loss of Well Control Occurrence and Size Estimators, Phase I and II
Page 149
Figure 15.8 Cause for the primary barrier losses in completion LOWC events
As for drilling, there are several different causes for losing the hydrostatic control of the well
during completion operations. For one incident it was a downhole isolation packer and a
formation isolation valve (FIV) that failed, causing the kick. This valve was inflow tested just
before the incident.
15.3.2 CAUSES FOR THE SECONDARY BARRIER FAILURES
Figure 15.9 shows the causes for loss of secondary barrier for completion LOWC events
Figure 15.9 Loss of secondary barrier for completion LOWC events
Few equipment failures are observed during completion LOWC events. This is likely because
the equipment in the wells during completions is new equipment. The failure of the secondary
barrier is typically caused by too late detection of the kicks and not the equipment that is failing.
1
2
11
2
1
Loss of primary barrier for completion LOWCs
Too low hyd. head, too low mud weight
Too low hyd. head, unknown why
Too low hyd. head, trapped gas
Too low hyd. head, annular losses
Too low hyd. head, swabbing
Packer plug failure
2
4
1
1
Loss of secondary barrier for completion LOWCs
Failed to close BOP
Failed to close BOP (closed late)
Failed to stab Kelly valve
String safety valve failed

Loss of Well Control Occurrence and Size Estimators, Phase I and II
Page 150
There are two exceptions. In one incident the blind shear rams failed to shear the tubing. For
the other incident, first a recently tested formation isolation valve failed, then when attempting
to close the BOP the flow through the BOP was too high. API 16A has no requirements related
to BOP closure under dynamic flowing conditions. Most BOPs are therefore not designed or
tested to close and seal under high rate flowing conditions.
For the string safety valve failed case, the valve was opened by mistake with pressure below.
15.4 WORKOVER
In well workover operations the well may be controlled by the hydrostatic pressure from the
drilling fluid (killed wells), or mechanical barriers only (live wells).
Human errors were identified in 15 of the 29 workover LOWC events that occurred in the
regulated areas including the US GoM OCS. It is likely that there have been more human errors
as well, but they cannot be observed from the LOWC descriptions and data sources.
Some of the human errors were related to poor planning of the operations. The possible risks
were not properly considered.
Others were related to equipment that would not function due to lack of maintenance or that
was not accessible.
In addition, some were related to faulty operations, as jeopardizing a barrier by mistake, closing
or opening the wrong valve, tearing off the tubing by using too much force, not performing
operations in a safe matter. Poor planning or that procedures are not followed can cause these
types of events.
15.4.1 CAUSES FOR PRIMARY BARRIER FAILURES
Eleven LOWC events occurred in live wells, three categorized as blowout (surface flow) and
eight categorized as well releases. The remaining 18 LOWC events occurred in killed wells,
seven categorized as blowout (surface flow) and 11 categorized as well releases. Eleven
LOWC events occurred in live wells. Eighteen LOWC events occurred in killed wells. Figure
15.10 shows a pie diagram for the workover LOWC observation.

Loss of Well Control Occurrence and Size Estimators, Phase I and II
Page 151
Figure 15.10 Workover LOWC observation
For the 11 LOWC events that occurred in live wells the LOWC events were observed as a leak
of hydrocarbons to the surroundings.
For 14 of the 18 workover LOWC events that had the well status killed the kick was not
observed before the well was flowing out to the surroundings. For two of the remaining they
failed to control the kick after some hours of kick killing operations. For two the time from
kick to event was unknown.
The late kick detection in many of the cases may be caused by lack of attention, but such
incidents are also caused by unforeseen conditions in the well. Barriers may be in failed
conditions, equipment is stuck, and pressures may be trapped. A thorough planning prior to
workovers will always be important.
Figure 15.11 shows an overview of the causes for the loss of the primary barrier in killed wells.
Figure 15.11 Loss of primary barrier in killed wells
14
2
11
2
Workover LOWC observation
Late kick observation
Unknown
Live well
In time kick observation
1
2
2
43
2
1
2
1
Loss of primary barrier for workower LOWCs in killed wells
Too low hyd. head, annular losses
Too low hyd. head, swabbing
Too low hyd. head, too low mud weight
Too low hyd. head, trapped gas
Too low hyd. head, unexpected high well pressure
Too low hyd. head, unknown why
Tubing parted
Well plug failure
Unknown

Loss of Well Control Occurrence and Size Estimators, Phase I and II
Page 152
Four of the kicks (22%) were caused by trapped gas in the well. For some of the others trapped
gas may have contributed to the kick, for instance unexpected high well pressure incidents.
Otherwise, the reason for the kicks are similar to drilling kicks. Swabbing, annular losses and
too low mud weight are listed as causes for the kick. Further, for two of the incidents well plugs
failed and for one the tubing parted.
Figure 15.12 shows an overview of the causes for the loss of the primary barrier in live wells.
Figure 15.12 Loss of primary barrier in live wells
For the live wells the major causes for loss of the primary barrier during a workover were that
the SCSSV failed or the tubing failed.
15.4.2 CAUSES FOR SECONDARY BARRIER FAILURES
For the 18 workover LOWC events categorized as well release, there were typically not any
equipment failures involved for the secondary barrier. Typically, the BOP or another available
barrier was closed and the situations were controlled after hydrocarbons had been leaking to
the surroundings for a limited period.
For the 11 blowout (surface flow) incidents, equipment failures were involved in most of the
incidents. None of these incidents occurred on a floating installation.
Figure 15.13 shows pie diagrams for equipment failure in workover blowout (surface flow)
LOWC events.
4
21
4
Loss of primary barrier for workower LOWCs in live wells
SCSSV/storm choke failure
Snubbing equipment failure
Tubing plug failure
Tubing to annulus leakage/parted

Loss of Well Control Occurrence and Size Estimators, Phase I and II
Page 153
Figure 15.13 Sum of Loss of secondary barriers in workover blowout (surface flow)
Four of these 11 blowout (surface flow) events were in wells that should be permanently
abandoned.
For the two string safety valve not available, the valve was not in a ready state to be stabbed
into the string. For one the BOPs did not have a blind shear ram, for the other the well was
isolated with the blind shear ram after a while.
For the failed to close BOP, the BOP did not have a blind shear ram.
For one tubing and casing leak secondary barrier failure, severe corrosion in the tubing and
casing caused the barrier failure.
For the other tubing to annulus leak and casing leak secondary barrier failure, they accidentally
cut two holes with a hole saw during toppled well P&A.
For one casing leak a scab-liner in the well had been pulled, opening a known casing leak path.
When the well kicked, the casing leaked out this leak path.
For the other casing leak natural gas bubbled to surface outside the well during plugging
operations. The conductor casing was heavily corroded.
For the outer and inner casing failed, well control was lost due to leaks in the tubing, production
casing, and surface casing to an unsealed annulus.
For one of the wellhead leaked incidents a wellhead service technician removed a 1.5"diameter
lockdown pin and packing-gland from the wellhead ruining the barrier.
For the other wellhead leaked a failed plastic injector port, together with a missing wellhead
seal assembly, allowed for the LOWC event to occur.
2
1
1
2
2
2
1
Sum of Loss of secondary barriers in workover Blowout (surface flow)
Casing leakage
Failed to close BOP
Outer casing an inner casing failed
String safety valve not available
Tubing and casing leak
Wellhead failed
X-mas tree failed and casing leakage

Loss of Well Control Occurrence and Size Estimators, Phase I and II
Page 154
For the X-mas tree and casing leak while installing the hot tap tool on the number 2 tubing
string (Short String) the well started flowing gas out the X-mas tree 200 feet.
15.5 PRODUCTION
This section concerns the causes of the production LOWC events. Since two barriers should be
present during production operations, this section is focused on the causes of losing the primary
barrier and the secondary barrier. During production both the primary and secondary barriers
are mechanical barriers. In a flowing well, the barriers closest to the reservoir are usually
regarded as the primary barrier. This would typically be the packer that seals off the annulus,
the tubing below the SCSSV, and the SCSSV. The secondary barriers would then be the tubing
above the SCSSV, the Xmas tree main flow side, the casing/wellhead, and the annulus side of
the Xmas tree.
A large proportion of the production LOWC incidents are caused by an external load. The most
typical external loads are storm, fires and ship collisions. It is, however, important to note that
an external load normally only ruins the topside barrier. To experience a blowout, the downhole
barrier also must fail. So, an external load will not be the single blowout cause. Typically, the
external load ruins the wellhead/X-mas tree barriers of an active well (secondary barrier), and
the downhole barrier (primary barrier) then fails to activate or is leaking.
In the regulated areas including the US GoM OCS the wells will have a down hole safety valve
(SCSSV). This is not the case for many other areas of the world.
15.5.1 CAUSES FOR THE PRIMARY BARRIER FAILURES
Figure 15.14 shows the primary barriers failures in the production phase LOWC events.
Figure 15.14 Loss of primary barrier in production phase LOWC events
Most of the primary barrier failures involves the SCSSV. The failed to close incidents may be
related to the controls, the ESD, the valve itself, sand in the well, or scale. The closed late
7
2
3
1
1
1
Loss of primary barrier for production LOWCs
SCSSV failure, failed to close
SCSSV failure, leaking
SCSSV failure, closed late
Tubing leakage
Tubing plug failure and tubing leakage
Unknown

Loss of Well Control Occurrence and Size Estimators, Phase I and II
Page 155
incidents are typically incidents where the valve is closed after the release on surface is
observed.
15.5.2 CAUSES FOR SECONDARY BARRIER FAILURES
Figure 15.15 shows the secondary barriers failures in the production phase LOWC events.
Figure 15.15 Loss of secondary barrier in production phase LOWC events
The wellhead or X-mas tree has some sort of failure in most of the production phase LOWC
incident. Either valves fail to close or there is a leak. The leak may be caused by normal wear
and tear failures, or as a result of an external load.
15.6 WIRELINE
All wireline LOWCs occurred in live wells. During wireline operations, a stuffing
box/lubricator and/or a wireline BOP located on top of the X-mas tree is normally the primary
barrier. If the well cannot be controlled by those means, the wireline is dropped or cut before
the X-mas tree is closed to control the well.
15.6.1 CAUSES FOR THE PRIMARY BARRIER FAILURES
Figure 15.16 shows the primary barriers failures in the wireline LOWC events.
3
4
3
1
1
2
1
Loss of secondary barrier for production LOWCs
Wellhead/X-mas tree failed, failed to close
Wellhead/X-mas tree failed, leak
Wellhead/X-mas tree failed, storm damage
Wellhead/X-mas tree failed, collision damage
Wellhead/X-mas tree failed, underwater land slide
Casing/cement/ formation
Unknown

Loss of Well Control Occurrence and Size Estimators, Phase I and II
Page 156
Figure 15.16 Loss of primary barrier in wireline LOWC events
Wireline stuffing box and wireline lubricator were involved in four of the seven events.
15.6.2 CAUSES FOR SECONDARY BARRIER FAILURES
Figure 15.17 shows the secondary barriers failures in the wireline LOWC events.
Figure 15.17 Loss of secondary barrier in wireline LOWC events
For the case were the wireline failed after closure the incident resulted in a blowout (surface
flow) event. For the other events the release had a relatively short duration and were categorized
as a well release.
2
2
1
1
1
Loss of primary barrier for wireline LOWCs
Wireline stuffing box failure
Wireline lubricator failure
X-mas tree failure
Other
Unknown
1
2
2
1
1
Loss of secondary barrier for wireline LOWCs
Wireline BOP failed after closure
Failed to close wireline BOP (closed late)
X-mas tree failed
Not relevant
Other

Loss of Well Control Occurrence and Size Estimators, Phase I and II
Page 157
15.7 CAUSAL FACTORS SUMMARY
Equipment failures and human errors are frequently involved in LOWC events. Table 15.1
shows a summary of the causal factors discussed in this section.
Table 15.1 Causal factors summary
Type of operation
Primary barrier failure Distri-bution
Well kick observation Distri-bution
Gas handling Distri-bution
Shallow gas bottom fixed installation
Unexpected high well pressure
42 % Diverted, no problem 44 %
While cement setting 27 % Diverter failed or not in place 30 %
Other 31 % Other/unknown 24 %
Shallow gas floating installation
Unexpected high well pressure
42 % Subsea release 75 %
While cement setting 27 % Other/unknown 25 %
Other 31 %
Deep zone drilling floating
Primary barrier failure Well kick observation Secondary barrier (Blowout (surface Flow))
Loss of hydrostatic control 100%
Late kick observation 38 % BOP failed 50 %
In time kick observation 38 % Formation broke down 25 %
Unknown 24 % Poor cement 25 %
Deep zone drilling fixed
Primary barrier failure Late kick observation 38 % Wellhead area leak 33 %
Loss of hydrostatic control 100%
In time kick observation 38 % BOP not in place 22 %
Unknown 24 % BOP failed after closure 11 % Casing failed 11 % Other 22 %
Workover, killed wells
Primary barrier failure Well kick observation Secondary barrier (Blowout (surface Flow))
Unexpected high well pressure/too low mud weight
28 % Late kick observation 78 % Casing leak 27 %
Trapped gas 22 % In time kick observation 11 % Casing and tubing leaked 18 %
Swabbing, losses, unknown 22 % Unknown 11 % Casing and X-mas tree leaked 9 %
Well plug failure 11 % Wellhead failed 18 %
Tubing parted 6 % Kelly valve not available 18 %
Unknown 6 % Failed to close BOP 9 %
Workover, live wells
Primary barrier failure Secondary barrier (Blowout (surface Flow))
SCSSV /storm choke failure 36 % Casing leak 27 %
Tubing leakage/parted 36 % Casing and tubing leaked 18 %
Snubbing equipment failure 18 % Casing and X-mas tree leaked 9 %
Tubing plug failure 9 % Wellhead failed 18 % Kelly valve not available 18 % Failed to close BOP 9 %
Completion
Primary barrier failure Well kick observation Secondary barrier (Blowout (surface Flow))
Loss of hydrostatic control 100% Late kick observation 87 % Failed to close BOP 100 %
Unknown 13 %
Production
Primary barrier failure Secondary barrier (Blowout (surface Flow))
SCSSV failed 75% X-mas tree failed, external load 40%
Tubing leak 25% X-mas tree failed, wear and tear
30%
Casing/cement/formation 30%
Wireline Primary barrier failure Secondary barrier (Blowout (surface Flow))
Stuffing box/lubricator failure 100% Wireline BOP failure 50%
X-mas tree failed 50%
Shallow zone incidents typically occur due to unexpected high well pressure or while the
cement is setting. For a bottom fixed installation, most incidents are diverted without problems.
In some cases, the diverter is not in place, because it has been nippled down.

Loss of Well Control Occurrence and Size Estimators, Phase I and II
Page 158
For the deep zone drilling incidents, the well may kick for various reasons. Approximately 50%
of the kicks were detected late. For floating drilling blowout (surface flow) LOWC events, the
BOP failed to close in 50% of the incidents, and the formation and cement failed for the
remaining. For bottom fixed drilling, leaks developed below the BOP in one third of the
incidents, and the BOP was nippled down for installing casing seals in 22% of the incidents.
For workovers in killed wells, the kicks were caused by unexpected high pressure or trapped
gas in 50% of the incidents. The majority of kicks were observed late. For the workover LOWC
events in live wells, the SCCSV or tubing failed in 72% of the incidents. For more than 50%
of the incidents that resulted in a blowout (surface flow), a casing leak was involved.
Workovers are frequently performed in old wells. Equipment failures are therefore more likely
in these operations than in other well operations.
Nearly all kicks during completion that led to a LOWC event were detected late. A BOP failure
is typical involved in completion blowout (surface flow) LOWC events.
For a blowout (surface flow) LOWC to occur in a producing well it will most likely occur as a
combination of a failure in the X-mas tree or wellhead area and a SCSSV failure. The X-mas
tree may have a degradation or being destroyed by storm or another external force.
For a blowout (surface flow) LOWC to occur during a wireline operation a leak in the lubricator
or the stuffing box in combination with a wireline BOP failure seems to be the most likely
cause.
15.8 VIOLATION OF RULES AND REGULATIONS
Violations of rules and regulations are from time to time described in LOWC investigation
reports, but many times they are not. There are likely many more violations of rules and
regulations than described in the investigation reports. The investigation reports focus on
describing what went wrong and why things went wrong, but not pointing back to the specific
rules and regulations that were breached. Below relevant breaches of rules and regulations
identified in the 2000–2015 LOWC events are briefly listed.
The described violations are often of a general character such as:
- Failure to prevent pollution of offshore waters from the well control incident.
- Failure to perform all operations in a manner that ensured complete well control and that
resulted in a sustained and uncontrolled flow of hydrocarbon fluids to surface.
- Failed to protect health, safety, property, and the environment. Did not perform all
operations in a safe and workmanlike manner.
- Failed to take necessary precautions to keep the well under control at all times.
- Did not complete the well in a manner, which protected against harm or damage to life,
property, natural resources, the national security, or the environment.
- Polluted the waters.
- Failure to maintain the casing in a safe condition.
More specific violations listed were:
- Failure to comply with regulatory requirement at 30 CFR 250.618(c) W/L lubricator not
being tested prior to RIH to pull the DX plug.

Loss of Well Control Occurrence and Size Estimators, Phase I and II
Page 159
- Failed to design and implement a fluid program to prevent the loss of well control.
- Failure to perform the JSA meeting prior to operation.
- Failure to utilize Stop Work Authority in order to stop job when operations varied from
approved procedure.
- Failed to exercise Stop Work Authority and verify the depth of the hole-saw after the diver
expressed concerns regarding which string of pipe he was cutting.
- The Inquiry found that at the time the well was suspended, not one well control barrier
complied with Operator’s own Well Construction Standards (or, importantly, with sensible
oilfield practice).
- Operator conducted its operations in a manner that was clearly contrary to Brazilian
regulations, heightening the risk of the drilling of the well that gave rise to the accident.
- Operator failed to carry out an analysis in conformity with Brazilian regulations, even
ignoring its own risk management procedures (Risk and Uncertainty Management Standard
- RUMS of July 26, 2011, and the Single Well CPDEP Roadmap).
- Failure to conduct operations according to the approved permit.
- The safety valve was not readily available for insertion into the work string.
- Ignored alarms.
- Failure to follow approved procedure.
15.9 TEST OF EQUIPMENT PRIOR TO LOWC
It has been sought to find information about testing of the relevant equipment prior to the
LOWC events. Information has been sought in the LOWC source material and also the BSEE
Well Activity Report system [10].
Information about equipment testing prior to a LOWC event is normally not included in LOWC
descriptions. Only detailed investigation reports may have this information.
No incidents have been found where the regular BOP has not been tested in time prior to an
incident. From time to time BSEE grant a waiver to postpone a BOP test. Such waivers are
granted in cases where the ongoing operations make it impossible to test the BOP within the
preset time.
For other equipment, a missing wireline BOP test was noted prior to a LOWC event, which has
been observed. The wireline BOP failed and caused the LOWC. For another incident the 9⅝”
cemented casing shoe had not been pressure tested in accordance with the company’s well
construction standards. This caused a major blowout.
For workover LOWC events, it has also been mentioned that the equipment and well barriers
have not been properly tested or evaluated before operation.
There are some examples that kelly valve type equipment has not been tested and maintained
regularly and therefore has failed when needed.

Loss of Well Control Occurrence and Size Estimators, Phase I and II
Page 160
WELL KICK EXPERIENCE
16.1 KICK FREQUENCIES FROM VARIOUS AREAS
A blowout during drilling operations will start with a well kick. A low kick frequency will
thereby also reduce the LOWC probability. For some type of wells, it will be more likely to
experience a kick than for others.
A general perception is that there are more frequent kicks in:
HPHT wells vs. normally pressurized wells.
Exploration wells vs. development wells.
Exploration wildcats vs. exploration appraisal wells.
Very deep wells vs. normal depth wells.
Various studies have revealed that some factors significantly affect the kick frequency (Section
16.2). The most significant factor is the margin between the fracture gradient and the pore
pressure of a well. Further, uncertainty about the pore pressure typically causes many kicks.
When there is a low margin between the fracture gradient and the pore pressure, it is more
likely to experience a kick. Factors like:
too low mud weight
losses
swabbing
gas cut mud
may more likely cause a well to kick. Many of the HPHT wells and deepwater wells drilled
have this low margin, and thereby the kick frequency in such wells is high. The high pressure
itself in a HPHT well does not seem to be a problem as long as the margin between the pore
pressure and the fracture gradient is high.
In addition, the overall well control policies and the competency of the personnel and the
organization will influence the kick frequency.
16.2 KICK STATISTICS FROM PREVIOUS STUDIES
Kick statistics are not commonly available in the public domain. Table 16.1 shows an overview
of the kick frequencies. These data stem from various studies [5], [6], [3], and [4].

Loss of Well Control Occurrence and Size Estimators, Phase I and II
Page 161
Table 16.1 Drilling kick frequencies
Drilling dataset No. of kicks
No. of wells
Kick frequency per well drilled
Shallow gas kick included
Canadian East Coast (1970 - 1993), Exploration wells [5] 55 273 0.20 Yes
US GoM OCS deepwater
Explorat-ion wells
Well drilled 1997 - 1998) [3] 39 58 0.67 No
Wells drilled 2007 – 2009 [4] 74 206 0.36 No
TOTAL 113 264 0.43 No
Develop-ment wells
Well drilled 1997 - 1998) [3] 9 25 0.38 No
Wells drilled 2007 – 2009 [4] 7 53 0.13 No
TOTAL 16 78 0.21 No
Norwegian, Wells drilled 1984 -1997 [6]
Explorat-ion wells
Normal (Well depth < 4000m TVD) 39 416 0.09 No
Deep (Well depth > 4000m TVD, not incl. HPHT)
36 111 0.32 No
HPHT wells 68 49 1.39 No
TOTAL 143 576 0.25 No
Development wells 272 1,478 0.19 No
Canadian Beaufort wells deep (1973 - 1991), Exploration wells, [5] 42 86 0.49 No
Canadian East Coast (1970 - 1993). These kick data originally stem from the Alberta Energy
and Utilities Board in Canada. A total of 55 kicks (included shallow kicks) were experienced
during drilling these 273 wells. This corresponds to a frequency of one kick every fifth well.
US GoM OCS deepwater (1997 - 1998). This frequency is based on kick data collected by
SINTEF/ExproSoft in [3]. The kick frequency in this dataset was high. The main reason for the
high kick frequency is the low limit between the pore pressure and the fraction pressure. Many
of the US GoM deepwater wells are deep wells and HPHT wells.
Norwegian offshore (1984 -1997). The majority of the kick data was originally collected
through a Ph. D. work [15]. The frequencies are based on wells drilled in Norway during the
period 1984 - 1997. The exploratory wells are typically drilled in water depths ranging from 50
to 400 meters. The majority of the exploratory wells are drilled with semisubmersible rigs while
the development wells are mostly drilled from jackets or concrete structures.
Canadian Beaufort wells deep (1973 - 1991). The kick data is based on a spreadsheet
extracted from the Canadian EUB and Downloaded Well files from Northwest Territories,
Geoscience Office (2007).
The kick frequency for these wells was high. Some of the wells experienced many kicks - one
well as many as 10. For many of the wells that experienced a kick the pore pressures of the
wells were rather high. Several of the wells have to be regarded as high pressure wells. Fourteen
kicks occurred when drilling with mud weights above 1,800 kg/m3. These kicks occurred in
five different wells.
The causes of kicks were: Too low mud weight/unexpected high pore pressure for 75% of the
kicks, Swabbing was listed as cause for 17% of the kicks. It should be noted that for none of
the kicks that occurred loss of circulation was the initial kick cause. It should further be noted
that for many of the wells the mud weight was increased quite significantly to kill the well.
This means that it would have been possible to drill most of the wells with a significantly higher

Loss of Well Control Occurrence and Size Estimators, Phase I and II
Page 162
mud weight, indicating a high margin between the pore pressure and the fracture gradient for
most of the wells.
It may also have been the case that when drilling many of these wells they were “drilling for
kicks”. This way of drilling will result in many kick occurrences. “Drilling for kick” is not a
normal practice anymore.
16.3 RECENT ESTABLISHED KICK STATISTICS
A search for more recent public domain kick data has been made. Some kick data from the UK
for the period 1999-2008 has been published [1]. The UK drilling activity can be found at the
UK Oil and Gas Authority web page [13]. By combining the UK kick and well drilling
information, overall kick frequencies were established for the period 1999 – 2008. The kick
frequencies are presented in Section 16.3.1.
Kick data from the Norwegian sector for the period 2000 – 2015, published by Petroleum Safety
Authority (PSA), has been made available for generating general statistics. The Norwegian kick
frequencies are presented in Section 16.3.2.
16.3.1 UK KICK FREQUENCIES
The kick data from the UK [1] has been processed and combined with drilling activity data
information to establish overall kick frequencies. No detailed kick information exists in the
data.
Table 16.2 Exploration and appraisal drilling kick frequencies UK 1999 -2008 (shallow gas kicks included)
Area
No. of wells (not
incl. sidetracks)
No. of sidetracks
No. of wells incl. sidetracks
No. of kicks
Kick frequency (per well
drilled, incl sidetracks)
Mean time between kicks (no. of wells
incl sidetracks)
Kick frequency (per well
drilled, not incl
sidetracks)
Mean time between kicks (no. of wells
not incl sidetracks)
Southern North Sea 114 16 130 22 0.169 5.9 0.193 5.2
Central North Sea 341 109 450 36 0.080 12.5 0.106 9.5
Northern North Sea 161 53 214 4 0.019 53.5 0.025 40.3
West of England/Wales
9 1 10 6 0.600 1.7 0.667 1.5
West of Shetland 47 11 58 6 0.103 9.7 0.128 7.8
Total 673 189 862 74 0.086 11.6 0.110 9.1

Loss of Well Control Occurrence and Size Estimators, Phase I and II
Page 163
Table 16.3 Development drilling kick frequencies UK 1999 -2008 (shallow gas kicks included)
Area
No. of wells (not incl. side-
tracks)
No. of side-
tracks
No. of wells incl. sidetracks
No. of kicks
Kick frequency (per well
drilled, incl sidetracks)
Mean time between kicks (no. of wells
incl sidetracks)
Kick frequency (per well
drilled, not incl sidetracks)
Mean time between kicks
(no. of wells not incl sidetracks)
Southern North Sea 265 131 396 67 0.169 5.9 0.253 4.0
Central North Sea 961 460 1,421 69 0.049 20.6 0.072 13.9
Northern North Sea 763 280 1,043 74 0.071 14.1 0.097 10.3
West of England/Wales
49 23 72 1 0.014 72.0 0.020 49.0
West of Shetland 109 41 150 7 0.047 21.4 0.064 15.6
Total 2,147 935 3,082 218 0.071 14.1 0.102 9.8
Five of the kicks were shallow gas kicks. It is not stated how many shallow gas kicks that were
observed in development wells and exploration wells.
The average kick frequency in exploration wells and development wells are 0.103 and 0.071
kicks per well drilled when regarding sidetracks as separate wells. The source [1] states that 27
of the kicks occurred in HPHT wells. A total of 82 HPHT wells were drilled. It is not
specifically stated, but it seems the majority of the HPHT wells were development wells.
The study concluded that most of the kicks were directly related to geological conditions and
mostly to conditions that were difficult to detect before drilling. Other geological related
incidents included challenges in cementing casing and maintaining mud weight between influx
and losses. According to [1] a significant, though minor, proportion of the incidents were due
to human errors.
16.3.2 NORWEGIAN KICK FREQUENCIES
The Petroleum Safety Authority (PSA) in Norway published Norwegian kick statistics from
the year 2000 in the project “Trends in risk level in the petroleum activity (RNNP)” [2]. PSA
was requested to provide access to descriptions of the individual kicks so the data could be
analyzed further.
The drilling kicks occurring in 2009 and later kicks have been re-categorized and analyzed.
The kicks that occurred before 2009 did not include a kick description and the focus has
therefore been on the kicks occurring from 2009 through 2014.
For the period 2009 – 2014, 109 kicks were reported in Norwegian wells. Forty-nine of these
kicks occurred during exploration drilling and 60 during development drilling. Of the 49
exploration well kicks, 26 were shallow kicks (kicks occurring before the BOP was installed)
and 23 kicks occurred after the BOP was installed. Of the 60 development drilling kicks, 10
were shallow kicks and 50 deep kicks.
Table 16.4 shows the annual kick occurrence and the associated number of wells drilled

Loss of Well Control Occurrence and Size Estimators, Phase I and II
Page 164
Table 16.4 Norwegian kick frequencies for exploration and development wells (2009 - 2014)
Year
Exploration drilling Development drilling
No. of kicks No. of wells
spudded Kick frequency pr.
well No. of kicks
No. of wells spudded
Kick frequency pr. well
2009 3 66 0.045 13 166 0.078
2010 2 46 0.043 13 126 0.103
2011 3 52 0.058 7 125 0.056
2012 4 43 0.093 7 130 0.054
2013 3 59 0.051 3 166 0.018
2014 8 57 0.140 7 162 0.043
Total 23 323 0.071 50 875 0.057
As seen the exploration drilling frequency is a bit higher than the development drilling kick
frequency. It should be noted that seven of the development drilling kicks were associated with
completion activities and two with workover activities.
The exploration well kicks occurred in 94 exploration appraisal wells and 229 exploration
wildcat wells. These exploration wells and the kicks have further been categorized into;
deep wells (>4,000m)
o Normal pressure and temperature well
o HPHT well, and
o HT wells
normal depth wells (<4,000m)
o Normal pressure and temperature well
o HPHT well, and
o HT wells
Table 16.5 shows an overview of kick frequency for the various types of exploration wells.
Table 16.5 Exploration well kick frequency, Norwegian waters, 2009 - 2014
Appraisal well
Wildcat
Total Well depth <4000 m Well depth >4000 m Total a) Normal press.
and temp. b) HT (>150
Celsius) a) Normal press.
and temp b) HT (>150
Celsius) c) HPHT
Number of kicks 1 10 5 2 5 22 23
Number of wells drilled 94 180 2 27 14 6 229 323
Kick frequency per well 0.011 0.056 0.185 0.143 0.833 0.096 0.071
MTBK (Mean Time between kick (wells)
94.0 18.0 5.4 7.0 1.2 10.4 14.0
The overall wildcat kick frequency is one kick in every 10 wells. For HPHT wells the kick
frequency is high, nearly one kick on average per well drilled. Deep wells (>4,000 m) have a
higher kick frequency than normal wells (<4,000m). The kick frequency for a normal wildcat
well is one kick every 18 wells drilled.
All wells, except 10, were drilled in water depths less than 450 meter. Ten wells were drilled
in water depths ranging from 650 to 1,452 meters. No kick was observed for any of these
deepwater wells.
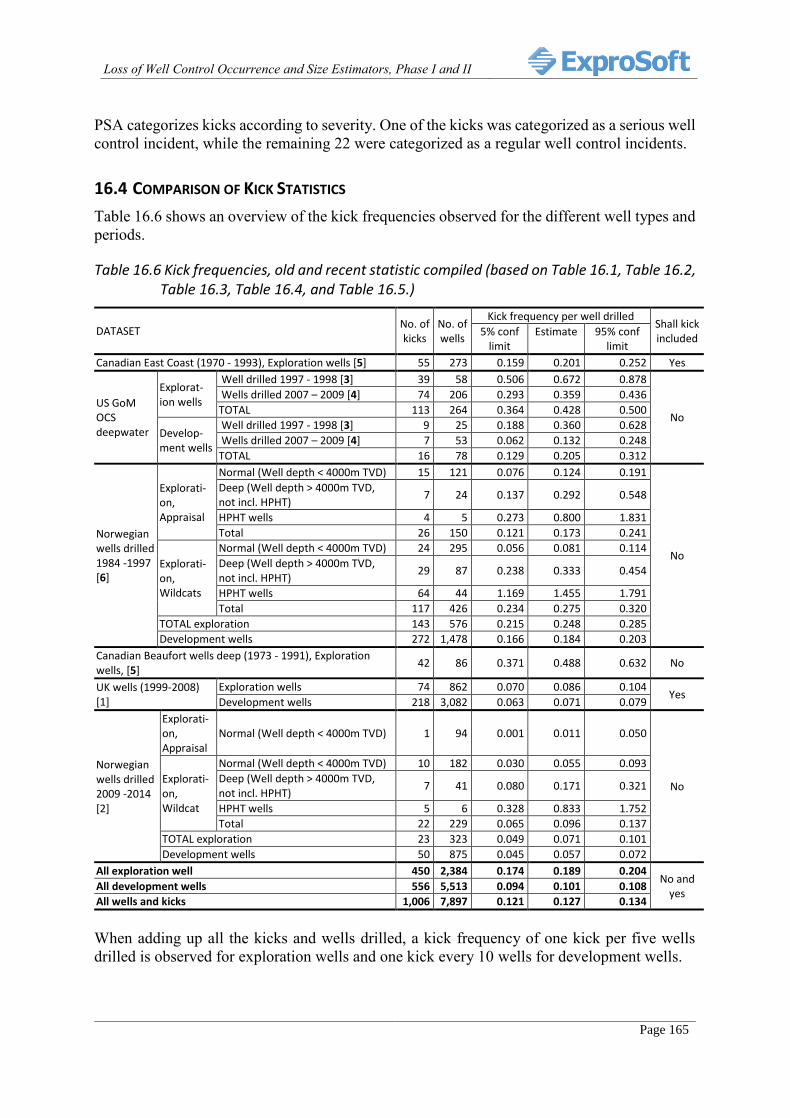
Loss of Well Control Occurrence and Size Estimators, Phase I and II
Page 165
PSA categorizes kicks according to severity. One of the kicks was categorized as a serious well
control incident, while the remaining 22 were categorized as a regular well control incidents.
16.4 COMPARISON OF KICK STATISTICS
Table 16.6 shows an overview of the kick frequencies observed for the different well types and
periods.
Table 16.6 Kick frequencies, old and recent statistic compiled (based on Table 16.1, Table 16.2, Table 16.3, Table 16.4, and Table 16.5.)
DATASET No. of kicks
No. of wells
Kick frequency per well drilled Shall kick included
5% conf limit
Estimate 95% conf limit
Canadian East Coast (1970 - 1993), Exploration wells [5] 55 273 0.159 0.201 0.252 Yes
US GoM OCS deepwater
Explorat-ion wells
Well drilled 1997 - 1998 [3] 39 58 0.506 0.672 0.878
No
Wells drilled 2007 – 2009 [4] 74 206 0.293 0.359 0.436
TOTAL 113 264 0.364 0.428 0.500
Develop-ment wells
Well drilled 1997 - 1998 [3] 9 25 0.188 0.360 0.628
Wells drilled 2007 – 2009 [4] 7 53 0.062 0.132 0.248
TOTAL 16 78 0.129 0.205 0.312
Norwegian wells drilled 1984 -1997 [6]
Explorati-on, Appraisal
Normal (Well depth < 4000m TVD) 15 121 0.076 0.124 0.191
No
Deep (Well depth > 4000m TVD, not incl. HPHT)
7 24 0.137 0.292 0.548
HPHT wells 4 5 0.273 0.800 1.831
Total 26 150 0.121 0.173 0.241
Explorati-on, Wildcats
Normal (Well depth < 4000m TVD) 24 295 0.056 0.081 0.114
Deep (Well depth > 4000m TVD, not incl. HPHT)
29 87 0.238 0.333 0.454
HPHT wells 64 44 1.169 1.455 1.791
Total 117 426 0.234 0.275 0.320
TOTAL exploration 143 576 0.215 0.248 0.285
Development wells 272 1,478 0.166 0.184 0.203
Canadian Beaufort wells deep (1973 - 1991), Exploration wells, [5]
42 86 0.371 0.488 0.632 No
UK wells (1999-2008) [1]
Exploration wells 74 862 0.070 0.086 0.104 Yes
Development wells 218 3,082 0.063 0.071 0.079
Norwegian wells drilled 2009 -2014 [2]
Explorati-on, Appraisal
Normal (Well depth < 4000m TVD) 1 94 0.001 0.011 0.050
No Explorati-on, Wildcat
Normal (Well depth < 4000m TVD) 10 182 0.030 0.055 0.093
Deep (Well depth > 4000m TVD, not incl. HPHT)
7 41 0.080 0.171 0.321
HPHT wells 5 6 0.328 0.833 1.752
Total 22 229 0.065 0.096 0.137
TOTAL exploration 23 323 0.049 0.071 0.101
Development wells 50 875 0.045 0.057 0.072
All exploration well 450 2,384 0.174 0.189 0.204 No and
yes All development wells 556 5,513 0.094 0.101 0.108
All wells and kicks 1,006 7,897 0.121 0.127 0.134
When adding up all the kicks and wells drilled, a kick frequency of one kick per five wells
drilled is observed for exploration wells and one kick every 10 wells for development wells.

Loss of Well Control Occurrence and Size Estimators, Phase I and II
Page 166
The kick frequencies varies a lot for the different well types, areas and periods during which
the data was collected. Some type of wells have a high probability of kick while others have a
low probability.
In HPHT wells and the deepwater US GoM OCS wells there is typically a narrow margin
between the pore pressure and the fracture gradient. These wells are kick prone because the
mud overbalance has to be low. Factors like slightly higher pore pressures than anticipated,
formation depth uncertainties, swabbing, gas cut mud will more likely cause a kick to occur
than in a well where a large mud overbalance is used. These wells are also more likely to
develop losses.
The well kill operations will also be more difficult for these wells. Kill mud weight has to be
carefully selected, kill fluid rates need to be low to reduce friction and increased bottom hole
pressure and losses.
The kick frequency for the Beaufort wells were also high. The main reason for the high
frequency is believed to be that they at that time were “drilling for kicks”. The well and kick
data for those kicks indicate that the margin between the pore pressure and the fracture gradient
was large for most of the kicks observed.
From both the Norwegian exploration well kick data sets it is observed that normally pressured
deep wells (TD > 4,000m) are more kick prone than normally pressured shallow wells (TD <
4,000m).
When comparing the Norwegian dataset from 1984 - 1997 with the dataset from 2009 – 2014,
the average kick frequency for exploration wells has decreased from 0.248 kicks per well (one
per four wells drilled) to 0.071 kicks per well (one per 14 wells drilled). The high number of
HPHT kicks that was observed in the period 1984 – 1997 may partly explain this. When
comparing the development wells kick, the kick frequency has decreased from one kick every
10th well to one kick every 19th well.

Loss of Well Control Occurrence and Size Estimators, Phase I and II
Page 167
16.5 US GOM OCS KICK STATISTICS (FOR WELLS SPUDDED 2011-2015)
BSEE does not capture kick information from the US GoM OCS activity systematically. The
BSEE eWell system has a specific part that reports significant events. One of the possible
significant events is well kick. Through the study [4], it was observed that approximately 50 %
of the kicks were reported as a significant event, while the remaining 50% were not. This is
however not a description of the kick, only stating that within a specific week a kick occurred.
The kicks in this section have been identified from the verbal description in the BSEE eWell
WAR (Well Activity Reports) for wells spudded in the period 2011-2015. Ninety-nine of these
kicks were listed as a significant event in eWell (2011-2013), while the remaining kicks have
been identified by reviewing the description of the operations in WAR.
The complete Well Activity Reports (WAR) Database [10] was downloaded 10th of March
2016. This data was combined with the data in the BSEE Borehole file [8] to extract the WAR
for all wells spudded in the US GoM OCS in the period 2011 – 2015.
In order to identify WARs that may include kicks several search and filter operations were
carried out. The following key words were used to identify potential WAR that included a kick:
Kick, Gain, Flow, Well started flowing, Well started to flow, SIDP, SICP, SIDDP,
Balloon, Shut in, Well control, Strip, Diverted, Gas in riser, well kill, kill well,
Bullhead, Drillers method, Influx, Wait and weight
The WARs identified through the key word search have been evaluated to identify those WARs
that describe a well kick. There is likely some inaccuracy in the data. There are probably several
kicks that have not been identified, and some of the incidents identified as a kick may not be a
kick.
16.5.1 ABOUT THE KICK DATA COLLECTED
Below are some key information related to the kicks identified from WAR.
1. Only included wells spudded in the period 2011 – 2015.
2. Only included wells where a verbal description of the operation is included in the
WAR.
3. Total number of spudded wells in the period 1,519.
4. Total number of spudded wells in the period with a verbal description of the
operation is included in the WAR 1,121.
5. Total number of WARs 12,784.
6. Total number of operational days; 82,008 (based on a WAR count, including one
relief well not included in the analysis. This relief well experienced a kick).
7. A WAR duration is 7 days or less.
8. A kick has been identified in 307 of the 12,784 WARs.
9. A kick may be reported in subsequent WARs (1, 2, and up to 5 WARs).
10. A WAR has in many cases included more than one kick.
11. Several wells have more than one kick.
12. Total number of kicks observed = 266 kicks (including 1 relief well kick).

Loss of Well Control Occurrence and Size Estimators, Phase I and II
Page 168
13. Total 184 wells experienced one or more kicks:
a. 131 wells experienced 1 kick
b. 35 wells experienced 2 kicks
c. 9 wells experienced 3 kick
d. 6 wells experienced 4 kicks
e. 1 well experienced 6 kicks
f. 1 well experienced 7 kicks
16.5.2 LOWC AND KICKS
For the wells spudded in the period 2011-2015, nine LOWC events are listed in the SINTEF
Offshore Blowout Database [7]. Only seven of these nine were found in the WAR. For the two
remaining LOWC events there was no description of the activities in the WAR (not all wells
have such a description).
For the seven identified in WAR, five were related to shallow flow before the BOP was installed
on the wellhead, and two happened after the BOP was installed on the wellhead.
These nine LOWC events were all drilling or completion incidents. All of these events started
with a kick because, for some reason, the mud weight could not control the pore pressure.
There are in addition seven LOWC incidents in the database for the period 2011 – 2015, but
these incidents occurred in wells that were spudded before 2011. They were all workover
incidents. Such incidents may start with a kick or a mechanical barrier failure.
In the subsequent pages, the kick statistics are presented. It should be noted that shallow zone
incidents (before the BOP has been landed on the wellhead) are also included in the statistics.
16.5.3 KICK FREQUENCIES AND WELL DEPTH
Table 16.7 and Table 16.8 show the well kick frequencies for development and exploration
wells. The wells have further been categorized in total well depth.
Table 16.7 Development wells kick frequencies US GoM OCS, wells spudded 2011 - 2015
Well depth grouped Deep well
(>4,000 mTVD) Normal well
(<4,000 mTVD) Dev total
Number of wells spudded 157 664 821
Number of drilling days 18,110 33,537 51,647
Number of kicks 44 78 122
Number of wells with kicks 33 61 94
Kick frequency per well 0.28 0.12 0.15
Kick frequency per 1000 days in operation 2.43 2.33 2.36
Mean time between kicks (MTBK), wells 3.57 8.51 6.73
Mean time between kicks (MTBK), days 412 430 423
Percentage number of wells with kicks 21.0 % 9.2 % 11.4 %

Loss of Well Control Occurrence and Size Estimators, Phase I and II
Page 169
Table 16.8 Exploration wells kick frequencies US GoM OCS, wells spudded 2011 - 2015
Well depth grouped Deep well
(>4,000 mTVD) Normal well
(<4,000 mTVD) Expl total
Number of wells spudded 215 85 300
Number of drilling days 25,624 4,606 30,230
Number of kicks 111 32 143
Number of wells with kicks 69 20 89
Kick frequency per well 0.52 0.38 0.48
Kick frequency per 1000 days in operation 4.33 6.95 4.73
Mean time between kicks (MTBK), wells 1.94 2.66 2.10
Mean time between kicks (MTBK), days 231 144 211
Percentage number of wells with kicks 32.1 % 23.5 % 29.7 %
The data shows that the kick frequency for development wells is in average 1 kick per every
6.7 well drilled, and for exploration wells, 1 kick every 2.2 wells drilled. When comparing
with the total kick frequencies in Table 16.6, page 165 it has to be concluded that the overall
kick frequencies for development wells and exploration wells in the US GoM OCS for the
period 2011 – 2015 seem high. For exploration wells the kick frequency per well drilled is
approximately 2.5 times higher and frequency for development well kicks is approximately 1.5
times higher.
It can further be noted that, as expected, the kick frequency per well drilled in the deep wells
(TVD > 4,000 m = 13,123 ft.) is higher than the kick frequency in normal wells (TVD < 4,000
m).
The drilling of a deep well normally takes more time than drilling a normal well. If comparing
the kick frequency per 1,000 days in operation it is seen that it is approximately the same for
deep and normal wells in development drilling and lower for deep wells than for normal wells
in exploration drilling.
16.5.4 KICK FREQUENCIES AND WATER DEPTH
For the purpose of this study, drilling in deeper water than 600 m (1,969 ft.) has been regarded
as deepwater drilling, and drilling in water depths less than 600 m for shallow water drilling.
Table 16.9 and Table 16.10 show the well kick frequencies for development and exploration
wells in deepwater vs. shallow water.
Table 16.9 Development wells, deepwater vs. shallow water
Water depth grouped <600 m >600 m Dev total
Number of wells spudded 699 122 821
Number of drilling days 37,203 14,444 51,647
Number of kicks 95 27 122
Number of wells with kicks 71 23 94
Kick frequency per well 0.14 0.22 0.15
Kick frequency per 1000 days in operation 2.55 1.87 2.36
Mean time between kicks (MTBK), wells 7.36 4.52 6.73
Mean time between kicks (MTBK), days 392 535 423
Percentage number of wells with kicks 10.2 % 18.9 % 11.4 %

Loss of Well Control Occurrence and Size Estimators, Phase I and II
Page 170
Table 16.10 Exploration wells, deepwater vs. shallow water
Water depth grouped <600 m >600 m Expl total
Number of wells spudded 110 190 300
Number of drilling days 9,440 20,790 30,230
Number of kicks 61 82 143
Number of wells with kicks 33 56 89
Kick frequency per well 0.55 0.43 0.48
Kick frequency per 1000 days in operation 6.46 3.94 4.73
Mean time between kicks (MTBK), wells 1.80 2.32 2.10
Mean time between kicks (MTBK), days 155 254 211
Percentage number of wells with kicks 30.0 % 29.5 % 29.7 %
The shallow water kick frequency per well drilled is lower than in deepwater for development
drilling. For exploration drilling the kick frequency per well drilled is lower in deepwater
drilling than in shallow water drilling. If looking at the kick frequency per 1,000 drilling days
it is lower in deepwater drilling than in shallow water drilling both for development drilling
and exploration drilling.
16.5.5 KICK FREQUENCIES AND WELL DEPTH WHEN KICK OCCURRED
The WAR includes information related to the well depth for the specific week the report
describes. This depth is referring to the depth at the end of the WAR period. This depth has
been used as the well depth when the kick occurred. In many cases this is 100 % correct, while
in other cases the drilling may have progressed a bit since the kick was controlled.
It has been selected to establish a frequency based on the number of drilling days within the
various drilling depth ranges. A kick occurrence rate for the various drilling depths cannot be
measured as a kick frequency per well drilled.
Table 16.11 and Table 16.12 shows the drilling TVD when the kick occurred for development
and exploration drilling.
Table 16.11 Development Drilling TVD when kick occurred
Drilling TVD Grouped (ft.) <5,000
ft. 5,000 –
10,000 ft. 10,000 – 15,000 ft.
15,000 -20,000 ft.
20,000 -25,000 ft.
25,000 – 30,000 ft.
>30,000 ft.
No depth listed
Total
Number of kicks 7 53 37 16 8 1 122
Number of drilling days in the various depth groups
6,515 18,859 15,385 5,950 3,193 1,060 685 51,647
Kick frequency per 1000 days in operation
1.07 2.81 2.40 2.69 2.51 0.94 2.36
Table 16.12 Exploration Drilling TVD when kick occurred
Drilling TVD Grouped (ft.) <5,000
ft. 5,000 –
10,000 ft. 10,000 -
15,000 ft. 15,000 -
20,000 ft. 20,000 -
25,000 ft. 25,000 -
30,000 ft. >30,000
ft. No depth
listed Total
Number of kicks 4 21 37 24 35 18 4 143
Number of drilling days in the various depth groups
1,217 3,927 6,618 7,459 5,010 4,478 1,221 300 30,230
Kick frequency per 1000 days in operation
3.29 5.35 5.59 3.22 6.99 4.02 3.28 4.73

Loss of Well Control Occurrence and Size Estimators, Phase I and II
Page 171
For development wells, the kick frequency per 1,000 days seems fairly independent of the well
depth. For exploration wells the highest kick frequency per 1,000 days drilled is for well depths
between 20,000 to 25,000 ft. Thereafter well depths between 5,000 to 15,000 feet. The depth
range from 15,000 to 20,000 ft. and from 25,000 to 30,000 ft. have a lower kick frequency per
1,000 days drilled.
16.5.6 KICK FREQUENCIES AND BOP TYPE
Subsea BOPs are typically used for floating drilling and surface BOPs are typically used for
drilling with a bottom fixed platform, including Spars and TLPs.
Floating rigs move due to the waves, making pit level control more difficult than on a bottom
fixed installation. On the other hand, many of the floating rigs have more advanced kick
detection systems than the jack-ups.
From a kick control perspective it is better with a surface BOP because the kick is easier to
observe before it reaches the BOP. Kick circulation is easier because the kill and choke lines
are short and that reduces friction. Higher pump rate can frequently be used.
Table 16.13 and Table 16.14 show the BOP type used when the kick occurred for development
and exploration drilling. Bottom fixed installations typically use surface BOPs while floating
installations typically use subsea BOP. The wells have been sorted in deep wells and normal
depth wells.
Table 16.13 Development wells and BOP type
Well depth grouped
Dry BOP Subsea BOP Dev total
Deep well (>4,000 mTVD)
Normal well (<4,000 mTVD)
Deep well (>4,000 mTVD)
Normal well (<4,000 mTVD)
Number of wells spudded 84 648 73 16 821
Number of drilling days 8,150 32,015 9,960 1,522 51,647
Number of kicks 22 75 22 3 122
Number of wells with kicks 15 58 18 3 94
Kick frequency per well 0.26 0.12 0.30 0.19 0.15
Kick frequency per 1000 days in operation
2.70 2.34 2.21 1.97 2.36
Mean time between kicks (MTBK), wells 3.82 8.64 3.32 5.33 6.73
Mean time between kicks (MTBK), days 370 427 453 507 423
Percentage number of wells with kicks 17.9 % 9.0 % 24.7 % 18.8 % 11.4 %

Loss of Well Control Occurrence and Size Estimators, Phase I and II
Page 172
Table 16.14 Exploration wells and BOP type
Well depth grouped
Dry BOP Subsea BOP Expl total
Deep well (>4,000 mTVD)
Normal well (<4,000 mTVD)
Deep well (>4,000 mTVD)
Normal well (<4,000 mTVD)
Number of wells spudded 50 60 166 24 300
Number of drilling days 6,832 3,066 18,792 1,540 30,230
Number of kicks 36 24 75 8 143
Number of wells with kicks 16 16 54 3 89
Kick frequency per well 0.72 0.40 0.45 0.33 0.48
Kick frequency per 1000 days in operation
5.27 7.83 3.99 5.19 4.73
Mean time between kicks (MTBK), wells 1.39 2.50 2.21 3.00 2.10
Mean time between kicks (MTBK), days 190 128 251 193 211
Percentage number of wells with kicks 32.0 % 26.7 % 32.5 % 12.5 % 29.7 %
For the development wells the kick frequency per well is a bit higher for wells drilled with
subsea BOPs than with dry BOPs. The kick frequencies per 1,000 days in operation are similar.
For the exploration wells the kick frequency is lower for subsea BOPs than for surface BOPs
when measuring both per well drilled and per 1,000 days in operation.
16.5.7 ANNUALIZED KICK FREQUENCIES
Table 16.15 shows kick data for the individual years.
Table 16.15 Annualized kick frequencies
Well type Water depth grouped
Number of wells drilled and kicks observed
Spud year
2011 2012 2013 2014 2015 Total
Devel-opment
<600 m
Number of wells spudded 168 186 191 112 42 699
Number of kicks 28 13 35 8 11 95
Kick frequency per well spudded 0,17 0,07 0,18 0,07 0,26 0,14
>600 m
Number of wells spudded 17 44 37 20 4 122
Number of kicks 4 13 5 5 27
Kick frequency per well spudded 0,24 0,30 0,14 0,25 0,00 0,22
Total
Number of wells spudded 185 230 228 132 46 821
Number of kicks 32 26 40 13 11 122
Kick frequency per well spudded 0,17 0,11 0,18 0,10 0,24 0,15
Explor-ation
<600 m
Number of wells spudded 26 35 38 11 0 110
Number of kicks 15 24 22 61
Kick frequency per well spudded 0,58 0,69 0,58 0,00 0,55
>600 m
Number of wells spudded 48 64 61 14 3 190
Number of kicks 26 28 25 3 82
Kick frequency per well spudded 0,54 0,44 0,41 0,21 0,00 0,43
Total
Number of wells spudded 74 99 99 25 3 300
Number of kicks 41 52 47 3 143
Kick frequency per well spudded 0,55 0,53 0,47 0,12 0,00 0,48
Total
Number of wells spudded 259 329 327 157 49 1121
Number of kicks 73 78 87 16 11 265
Kick frequency per well spudded 0,28 0,24 0,27 0,10 0,22 0,24
Table 16.15 shows that the majority of the kick data stems from wells spudded in the period
2011 to 2013. This is mainly because less WAR reports exist for 2014 and 2015. The table is
based on data in the WAR Database [10] that was downloaded 10th of March 2016. For the
years 2011 to 2013 more than 90% of the wells spudded were included in the WAR database,

Loss of Well Control Occurrence and Size Estimators, Phase I and II
Page 173
for 2014 and 2015, 48% and 25% were included. In addition the drilling activity was lower in
2015 than the previous years (Table 2.1, page 33.).
16.6 COMPARISON OF US GOM KICK FREQUENCY VS. OTHER STATISTICS
Table 16.16 shows an overview of all the kick data available.
Table 16.16 Kick frequencies, old and recent statistic compiled (based on Table 16.6, Table 16.7, and Table 16.8)
DATASET No. of kicks
No. of wells
Kick frequency per well drilled Shall kick included
5% conf limit
Estimate 95% conf
limit
Canadian East Coast (1970 - 1993), Exploration wells [5] 55 273 0.159 0.201 0.252 Yes
US GoM OCS deepwater
Explorati-on wells
Well drilled 1997 - 1998 [3] 39 58 0.506 0.672 0.878
No
Wells drilled 2007 – 2009 [4] 74 206 0.293 0.359 0.436
TOTAL 113 264 0.364 0.428 0.500
Develop-ment wells
Well drilled 1997 - 1998 [3] 9 25 0.188 0.360 0.628
Wells drilled 2007 – 2009 [4] 7 53 0.062 0.132 0.248
TOTAL 16 78 0.129 0.205 0.312
Norwegian wells drilled 1984 -1997 [6]
Explorat-ion, Appraisal wells
Normal (Well depth < 4000m TVD) 15 121 0.076 0.124 0.191
No
Deep (Well depth > 4000m TVD, not incl. HPHT)
7 24 0.137 0.292 0.548
HPHT wells 4 5 0.273 0.800 1.831
Total 26 150 0.121 0.173 0.241
Explorat-ion, Wildcats
Normal (Well depth < 4000m TVD) 24 295 0.056 0.081 0.114
Deep (Well depth > 4000m TVD, not incl. HPHT)
29 87 0.238 0.333 0.454
HPHT wells 64 44 1.169 1.455 1.791
Total 117 426 0.234 0.275 0.320
TOTAL exploration 143 576 0.215 0.248 0.285
Development wells 272 1,478 0.166 0.184 0.203
Canadian Beaufort wells deep (1973 - 1991), Exploration wells, [5]
42 86 0.371 0.488 0.632 No
UK wells (1999-2008) [1]
Exploration wells 74 862 0.070 0.086 0.104 Yes
Development wells 218 3,082 0.063 0.071 0.079
Norwegian wells drilled 2009 -2014 [2]
Explorat-ion, Appraisal
Normal (Well depth < 4000m TVD) 1 94 0.001 0.011 0.050
No Explorat-ion, Wildcat
Normal (Well depth < 4000m TVD) 10 182 0.030 0.055 0.093
Deep (Well depth > 4000m TVD, not incl. HPHT)
7 41 0.080 0.171 0.321
HPHT wells 5 6 0.328 0.833 1.752
Total 22 229 0.065 0.096 0.137
TOTAL exploration 23 323 0.049 0.071 0.101
Development wells 50 875 0.045 0.057 0.072
US GoM OCS (2011 – 2015)
Explorat-ion wells
Normal (Well depth < 4000m TVD) 32 85 0.274 0.376 0.506
Yes
Deep (Well depth > 4000m TVD 111 215 0.438 0.516 0.604
Total 143 300 0.413 0.477 0.548
Develop-ment wells
Normal (Well depth < 4000m TVD) 78 664 0.096 0.117 0.142
Deep (Well depth > 4000m TVD 44 157 0.215 0.280 0.360
Total 122 821 0.127 0.149 0.173
All exploration well 593 2,684 0.206 0.221 0.236 No and
yes All development wells 600 5,670 0.099 0.106 0.113
All wells and kicks 1,193 8,354 0.136 0.143 0.150

Loss of Well Control Occurrence and Size Estimators, Phase I and II
Page 174
The frequency of kicks in the US GoM OCS for the period 2011 – 2015 is high compared to
other areas. If comparing this US GoM OCS data with the most recent data from Norway (2009
-2014) and UK (1999 -2008) there is a statistically significant difference. The Norwegian and
UK data sets are similar.
Figure 16.1 shows a graphical overview of the overall kick data from the various data sources.
Figure 16.1 Overview of kick frequencies
By comparing the US GoM OCS 2011–2015 kick frequency with the most recent statistics
from Norway and the UK, the kick frequency is significantly higher in the US GoM OCS.
Compared with the Norwegian kick frequency for 1984–1997, however, the kick frequency in
the US GoM OCS is in the same order of magnitude.
It is not known why the observed kick frequency in the US GoM OCS is so much higher than
the most recent data from UK and Norway. There may be several reasons, including:
1. UK and Norwegian data is based on well kicks reported to the authorities. The
operators may not report all the well kicks to the authorities.
2. Many US GoM wells are extremely deep and take a long time to drill. This increases
the probability of having a kick due to the increased exposure time.
3. US GoM OCS may be a more complicated area to drill due to different formations.
Narrow margin between pore pressure and fracture gradient constitutes a typical
problem that causes many kicks.
4. Some of the shallow water wells in the US GoM OCS may be drilled with less
advanced instrumentation.
5. There may be different requirements for drilling personnel qualifications in the US
GoM OCS as compared to Norway and the UK.
6. The well control policies with respect to mud weight and casing program may be
different.
0 0,1 0,2 0,3 0,4 0,5 0,6 0,7
Total all kicks and wells
US GoM OCS (2011 – 2015)
Norwegian wells drilled 2009 -2014
UK wells (1999-2008)
Canadian Beaufort wells deep (1973 - 1991)
Norwegian wells drilled 1984 -1997
US GoM OCS deepwater Wells drilled 2007 – 2009
US GoM OCS deepwater Well drilled 1997 - 1998
Canadian East Coast (1970 - 1993)
No. of kicks per well drilled
Overview of kick frequencies from various countries
Development wells Exploration wells

Loss of Well Control Occurrence and Size Estimators, Phase I and II
Page 175
16.7 KICK CAUSES
16.7.1 KICK CAUSES DISCUSSION
A detailed review and categorizing of the US GoM OCS 2011 – 2015 kicks has not been carried
out. This will require significant work effort and is not a part of the study scope.
When evaluating causes of kicks, it is very important to note that there are two main factors
that influence the occurrence of a kick;
Well control policy
Local well conditions
If wells can be drilled with a high mud overbalance, kicks will be less likely than if wells are
drilled with a low overbalance. Factors like slightly higher pore pressures than anticipated,
formation depth uncertainties, swabbing, and gas cut mud will less likely cause a kick to occur
than if the well is drilled with a low mud overbalance.
It is in general assumed that when drilling with a high mud overbalance the rate of penetration
will be lower. This means that increasing the mud weight will be costly.
For some wells, the local well conditions do not make it possible to drill with a high overbalance
due to a limited margin between the pore pressure and formation fracture gradient. For these
wells a low overbalance has to be selected. In some cases running an extra casing may eliminate
the problem. But adding an extra casing may on the other hand cause that the well target cannot
be reached. Adding an extra casing will also cause additional costs.
HPHT wells in the North Sea and many deepwater wells in the US GoM OCS typically have a
low margin between the pore- and fracture gradient. These wells are expected to cause more
frequent kicks than in wells where a large margin between the pore- and fracture gradient exist
The casing program selected may also affect how large the mud overbalance can be, and
thereby the probability of kicks.
In 2001 SINTEF/ExproSoft completed a deepwater kick study for MMS [3]. In 2012 Exprosoft
completed another study related to deepwater kicks and BOP reliability [4] for BSEE. Both
these report are available from the BSEE web page.
The kick causes were coarsely evaluated based on the description of the events in both these
studies. The kick causes were listed as shown in Table 16.17 and Table 16.18.

Loss of Well Control Occurrence and Size Estimators, Phase I and II
Page 176
Table 16.17 Kick causes for US GoM OCS deepwater (1997 – 1998) kicks [3]
Kick cause No. of kicks Distribution
Losses 7 17.9 %
Swab 5 12.8 %
Unexpected high pore pressure/too low mud weight 27 69.2 %
Total 39 100.0 %
Table 16.18 Kick causes for US GoM OCS deepwater (2007 – 2009) kicks [4]
Kick cause No. of kicks Distribution
Losses 4 5.4 %
Other 5 6.8 %
Swab 9 12.2 %
Unexpected high pore pressure/too low mud weight 52 70.3 %
Unknown 4 5.4 %
Total 74 100.0 %
For many of the kicks listed with too low mud weight, gas cut mud was a part of the problem.
The occurrence of swabbed in kicks will also be influenced by a low mud weight.
Based on the limited incident descriptions for the Norwegian exploration wells drilled 2009 –
2014 [2] a coarse review of the exploration kick causes was performed. The results show the
same distribution of causes as for the US GoM deepwater kicks. Table 16.19 shows an
overview of the kick causes for the Norwegian exploration wells.
Table 16.19 Exploration well kick causes, Norwegian waters, 2009 - 2014
Kick Cause No. of kicks % distribution
Unexpected high pore pressure/too low mud weight 19 83 %
Swabbing 3 13 %
Losses 1 4 %
Total 23 100 %
16.7.2 KICK AND DEVIATED WELLS
It has been investigated to see if the kick occurrence rate is higher in deviated wells than in
vertical wells for the US GoM OCS kicks identified. Each WAR [10] lists the MD and the TVD
for the activity the WAR describes. The deviation have been measured as the MD/TVD for the
specific point in the well and not the angle. The various depths have been grouped in ranges
for both the kicks and the drilling exposure days. Table 16.20 shows the results from this
analysis.

Loss of Well Control Occurrence and Size Estimators, Phase I and II
Page 177
Table 16.20 Kick frequency vs. well deviation
MD vs. TVD Grouped (for each war)
Development wells Exploration wells Total
Sum of days in
operation
Distribu-tion (%)
No. of kicks
Kick frequency per 1000 days in
operation
Sum of days in
operation
Distribu-tion (%)
No. of kicks
Kick frequency per 1000 days in
operation
Sum of days in
operation
Distribut-ion (%)
No. of kicks
Kick frequency per 1000 days in
operation
less than 110% 29,570 57.3 % 80 2.71 26,786 88.6 % 132 4.93 56,356 68.8 % 212 3.76
110 - 120% 9,450 18.3 % 17 1.80 1,820 6.0 % 7 3.85 11,270 13.8 % 24 2.13
120 - 130% 5,502 10.7 % 9 1.64 569 1.9 % 6,071 7.4 % 9 1.48
130 - 140% 1,872 3.6 % 3 1.60 583 1.9 % 3 5.15 2,455 3.0 % 6 2.44
140 - 150% 1,208 2.3 % 2 1.66 150 0.5 % 1 6.67 1,358 1.7 % 3 2.21
150-200% 2,467 4.8 % 9 3.65 22 0.1 % 2,489 3.0 % 9 3.62
200- 250% 770 1.5 % 2 2.60 0.0 % 770 0.9 % 2 2.60
more than 250% 123 0.2 % 0.0 % 123 0.2 % 0 0.00
Unknown 685 1.3 % 300 1.0 % 985 1.2 % 0 0.00
Total 51,647 100.0 % 122 2.36 30,230 100.0 % 143 4.73 81,877 100.0 % 265 3.24
When looking at the results in Table 16.20 it is observed that the majority of drilling and the
majority of well kicks stem from the nearly vertical part of the well. It can also be observed
that there does not seem to be any relation between the deviation and the frequency of kicks
per 1,000 drilling days.
16.7.3 KICK AND STUCK PIPE
Stuck pipe is from time to time a complication in association with a kick. Table 16.21 shows
an overview of number of stuck pipe incidents for the US GoM OCS (2011 - 2015).
Table 16.21 Number of stuck pipe incidents US GoM OCS (2011 - 2015) based on WAR
Well depth grouped Development
wells Exploration
wells Total
Number of wells spudded 821 300 1,121
Number of drilling days 51,647 30,230 81,877
Number of stuck pipe incidents 286 162 448
Number of wells with stuck pipe incidents 225 99 324
Stuck pipe incident frequency per well 0.35 0.54 0.40
Stuck pipe incident frequency per 1000 days in operation 5.54 5.36 5.47
Mean time Between Stuck pipe incident frequency, wells 2.87 1.85 2.50
Mean time Between Stuck pipe incident frequency, days 181 187 183
Percentage number of wells with Stuck pipe 27.4 % 33.0 % 28.9 %
For 47 of the WARs both a kick and a stuck pipe incident are occurring within the same week.
This represents 17.7% of the kicks and 10.5% of the stuck pipe incidents.
These WARs have been read more closely and it was found that for 25 of these kick incidents
the well kicked before the pipe became stuck. For 12 of these incidents the pipe became stuck
before the well kicked. For the remaining incidents the stuck pipe and kick were not found to
be related.
There are rather many kicks that also involves stuck pipe. It does however not seem that stuck
pipe frequently causes the well to kick.

Loss of Well Control Occurrence and Size Estimators, Phase I and II
Page 178
Some other stuck pipe findings;
The frequency of stuck pipe incidents per well drilled is some higher in exploration
wells compared to development wells.
The frequency of stuck pipe incidents per day in operation is the same in exploration
wells compared to development wells.
Deep wells (> 4,000mTVD) have more stuck pipe incidents than Normal wells
(<4,000mTVD).
There does not seem to be any relation between the water depth and the stuck pipe
incident frequency.
Stuck pipe may occur at any well depth.
There seems not to be any strong relation between drilling TVD and stuck pipe
occurrences. It may seem that in the drilling depth range between 25,000 – 30,000 ft.
the occurrence of stuck pipe is higher than the other depth ranges for exploration
drilling. This was not observed for development drilling.
A kick may occur at any depth. Many of the kicks occurred far from the TD of the well. These
kicks will typically not have the potential to cause a large release of oil, but release of gas may
cause danger for the personnel and the installations.

Loss of Well Control Occurrence and Size Estimators, Phase I and II
Page 179
LOWC RISK ANALYSIS
The experience with LOWC events and well kicks is discussed in the previous section of this
report. Exposure data related to no of wells drilled, completed, and wells in productions is
presented in Section 2, page 33. This section focus on risk related to the various operations,
well types, water depths, and vessel types (floating or fixed).
The LOWC risk can be measured by several measures. In this report the measures used are:
Fatalities
Pollution
Ignition
Material losses to rig
Risk is in general a function of the frequency of an event and the consequence of an event.
17.1 EXPERIENCED RISK
17.1.1 US GOM OCS LOWC FREQUENCIES VS. REGULATED AREAS
Table 17.1 and Table 17.2 compare the drilling LOWC event frequencies in the regulated areas
and the US GoM OCS.
Table 17.1 Development Drilling LOWC frequency comparison US GoM OCS and regulated areas, 2000–2015
Deep or shallow zone
Main category
Regulated area US/GOM OCS US GoM OCS vs.
Regulated areas
No. of LOWCs
No. of wells
drilled
LOWC frequency per
1000 wells drilled
No. of LOWCs
No. of wells
drilled
LOWC frequency per
1000 wells drilled
Deep
Blowout (surface flow) 1
8,156
0.12 2
6,288
0.32 2.59
Blowout (underground flow) 1 0.16 -
Diverted well release -
Well release 1 0.12 1 0.16 1.30
Total 2 0.25 4 0.64 2.59
Shallow
Blowout (surface flow) 3 0.37 7 1.11 3.03
Diverted well release 1 0.12 5 0.80 6.49
Well release -
Total 3 0.37 12 1.91 5.19
Total 6 0.74 16 2.54 3.46

Loss of Well Control Occurrence and Size Estimators, Phase I and II
Page 180
Table 17.2 Exploration Drilling LOWC frequency comparison US GoM OCS and regulated areas, 2000–2015
Deep or shallow zone
Main category
Regulated area US GoM OCS US GoM OCS vs.
Regulated areas
No. of LOWCs
No. of wells
drilled
LOWC frequency per
1000 wells drilled
No. of LOWCs
No. of wells
drilled
LOWC frequency per
1000 wells drilled
Deep
Blowout (surface flow) 1
3,998
0.25 9
3,971
2.27 9.06
Blowout (underground flow) 1 0.25 2 0.50 2.01
Diverted well release 1 0.25 -
Well release 2 0.50 2 0.50 1.01
Total 4 1.00 14 3.53 3.52
Shallow
Blowout (surface flow) 1 0.25 5 1.26 5.03
Diverted well release 1 0.25 3 0.76 3.02
Well release 2 0.50 -
Total 2 0.50 10 2.52 5.03
Total 6 1.50 24 6.04 4.03
Table 17.1 and Table 17.2 show that the total LOWC event frequency in the US GoM OCS is
significantly higher than in the comparable regulated areas for both development and
exploration drilling.
The LOWC event type with the highest risk is the blowout (surface flow) type incident. Nine
such events occurred in the US GoM OCS exploration wells and only one in the regulated
areas. Approximately the same number of wells were drilled in the US GoM OCS and the
regulated areas.
Causes for drilling LOWC events are discussed in Section 15, page 142.
Table 17.3 compares the completion LOWC event frequencies in the UK and Norway and the
US GoM OCS.
Table 17.3 Completion LOWC frequency comparison US GoM OCS and UK and Norway, 2000–2015
Main category
UK & Norwegian waters US GoM OCS US GoM OCS vs. Norway and UK
No. of LOWCs
Number of well
completions
Frequency per 1000 wells completed
No. of LOWCs
Number of well
completions
Frequency per 1000 wells completed
Blowout (surface flow) 1
5,305
0,19 1
5,004
0,20 1.05
Diverted well release 1 0,20 -
Well release 4 0,75 1 0,20 0.27
Total 5 0,94 3 0,60 0.64
The LOWC event frequency during completion is lower in the US GoM OCS than in the
Norwegian and UK waters combined, when measured by the number of well completions
carried out. It should here be noted that the total number of completion LOWC events is low
such that the statistical uncertainty of this conclusion is high.
Table 17.4 compares the workover LOWC event frequencies in the UK and Norway, and the
US GoM OCS.

Loss of Well Control Occurrence and Size Estimators, Phase I and II
Page 181
Table 17.4 Workover LOWC frequency comparison US GoM OCS and UK and Norway, 2000–2015
Main category
UK & Norwegian waters US GoM OCS US GoM OCS vs. Norway and UK
No. of LOWCs
Number of well years in
service
LOWC frequency per 10,000 well years in service
No. of LOWCs
Number of well years in
service
LOWC frequency per 10,000 well years in service
Blowout (surface flow) 1
47,683
0.21 9
77,843
1.16 5.51
Well release 4 0.84 12 1.54 1.84
Total 5 1.05 21 2.70 2.57
The LOWC event frequency during workovers is significantly higher in the US GoM OCS than
in in the Norwegian and UK waters combined, when measuring by the number of well years in
service.
The frequency of well workovers may be higher in the US GoM OCS due to in average older
wells that require more frequent workovers. In addition, many of the US GoM workovers have
been carried out in wells with poor barriers due to aging. Many of the workover LOWC events
occurred in wells that have been temporary abandoned for long periods.
Table 17.5 compares the production LOWC event frequencies in the UK and Norway and the
US GoM OCS.
Table 17.5 Production LOWC frequency comparison US GoM OCS and UK and Norway, 2000–2015
Main category
UK & Norwegian waters US/GOM OCS
US GoM OCS vs. Norway and UK
No. of LOWCs
Number of well years in service
LOWC frequency per 10,000 well years in service
No. of LOWCs Number of well years in service
LOWC frequency per 10,000 well years in service
No external
load No external load
No external
load
External load
No external
load
External load
Total
Blowout (surface flow) 47,683
3 5
77,843
0.39 0.64 1.03 -
Well release 3 0.63 4 0.51 0.00 0.51 0.82
Total 3 0.63 7 5 0.90 0.64 1.54 2.45
The LOWC event frequency during production is significantly higher in the US GoM OCS
than in in the Norwegian and UK waters combined, when measuring by the number of well
years in service.
Many of the LOWC events in the US GoM OCS are caused by external causes as storm, and
collisions. These type of LOWCs are not observed in the Norwegian and UK waters. The strong
hurricanes and the small shallow water installations causes these types of events. If disregarding
these events the LOWC frequencies becomes more similar.
Table 17.6 compares the wireline LOWC event frequencies in the UK and Norway and the US
GoM OCS.

Loss of Well Control Occurrence and Size Estimators, Phase I and II
Page 182
Table 17.6 Wireline LOWC frequency comparison US GoM OCS and UK and Norway, 2000–2015
Main category
UK & Norwegian waters US GoM OCS US GoM OCS vs. Norway and UK
No. of LOWCs
Number of well years in
service
LOWC frequency per 10,000 well years in service
No. of LOWCs
Number of well years in
service
LOWC frequency per 10,000 well years in service
Blowout (surface flow) 1
47,683
0.21
77,843
Well release 3 0.63 3 0.39 0.61
Total 4 0.84 3 0.39 0.46
The LOWC event frequency during wireline is lower in the US GoM OCS than in in the
Norwegian and UK waters combined, when measuring by the number of well years in service.
There are relatively few wireline LOWC events in the database.
17.1.2 DEEPWATER VS. SHALLOW WATER DRILLING
Table 17.7 and Table 17.8 show the LOWC frequency vs. water depth for development and
exploration drilling. Water depths deeper than 600 m (1,969 ft.) have been considered as
deepwater.
Table 17.7 Development drilling LOWC frequency comparison shallow water vs. deepwater, US GoM OCS 2000–2015
Main category
Development drilling Water depth
<600 m vs. >600m
Water depth < 600m (1,969 ft.) Water depth > 600m (1,969 ft.)
No. of LOWCs
No. of wells
drilled
Frequency per 1,000
wells drilled
No. of LOWCs
No. of well drilled
Frequency per 1,000 wells
drilled
Deep zone incidents
Blowout (surface flow) 2
5,422
0.37 0
868
0.00 -
Blowout (underground flow) 1 0.18 0 0.00 -
Diverted well release 0.00 0 0.00 -
Well release 1 0.18 0 0.00 -
Total 4 0.74 0 0.00 -
Shallow zone incidents
Blowout (surface flow) 7
5,422
1.29 0
868
0.00 -
Diverted well release 5 0.92 0 0.00 -
Well release 0.00 0 0.00 -
total 12 2.21 0 0.00 -
Total all 16 2.95 0 0.00 -
No deepwater LOWC events have been observed for development wells, while 16 have been
observed for the shallow water drilling. The number of wells drilled is also far higher in
shallow water.

Loss of Well Control Occurrence and Size Estimators, Phase I and II
Page 183
Table 17.8 Exploration drilling LOWC frequency comparison shallow water vs. deepwater, US GoM OCS 2000–2015
Main category
Exploration drilling Water depth
<600m vs. >600m
Water depth < 600m (1,969 ft.) Water depth > 600m (1,969 ft.)
No. of LOWCs
No. of well drilled
Frequency per 1,000
wells drilled
No. of LOWCs
No. of well drilled
Frequency per 1,000 wells
drilled
Deep zone incidents
Blowout (surface flow) 7
2,545
2.75 2
1,427
1,40 196 %
Blowout (underground flow) 2 0.79 0,00 -
Diverted well release 0.00 1 0,70 0 %
Well release 0.00 2 1,40 0 %
Total 9 3.54 5 3,50 101 %
Shallow zone incidents
Blowout (surface flow) 4
2,545
1.57 1
1,427
0,70 224 %
Diverted well release 3 1.18 0,00 -
Well release 0.00 2 1,40 0 %
Total 7 2.75 3 2,10 131 %
Total all 16 6.29 8 5,61 112 %
For exploration drilling, the experienced total LOWC frequency is on the same level for
shallow water as for deepwater. If looking at the most serious LOWC events, blowout (surface
flow) type incidents, the observed frequency is higher in shallow water than in deepwater.
17.1.3 SURFACE BOP VS. SUBSEA BOPS
Bottom fixed installations typically use surface BOPs while floating installations typically use
subsea BOPs. Table 17.9 and Table 17.10 shows the LOWC frequency for bottom fixed vs.
floating installations for development and exploration drilling.
Table 17.9 Development drilling LOWC frequency comparison bottom fixed vs. floating vessel, US GoM OCS 2000–2015
Main category
Development drilling
Bottom fixed vs. floating
Bottom fixed Floating
No. of LOWCs
No. of wells
drilled
Frequency per 1,000
wells drilled
No. of LOWCs
No. of well drilled
Frequency per 1,000 wells
drilled
Deep zone incidents
Blowout (surface flow) 2
5,606
0.36
684
0.00 -
Blowout (underground flow) 1 0.18 0.00 -
Well release 1 0.18 0.00 -
Total 4 0.71 0.00 -
Shallow zone incidents
Blowout (surface flow) 7
5,606
1.25
684
0.00 -
Diverted well release 5 0.89 0.00 -
Total 12 2.14 0.00 -
Total all 16 2.85 0 0.00 -

Loss of Well Control Occurrence and Size Estimators, Phase I and II
Page 184
Table 17.10 Exploration drilling LOWC frequency comparison bottom fixed vs. floating vessel, US GoM OCS 2000–2015
Main category
Exploration drilling
Bottom fixed vs. floating
Bottom fixed Floating
No. of LOWCs
No. of well drilled
Frequency per 1,000
wells drilled
No. of LOWCs
No. of well drilled
Frequency per 1,000 wells
drilled
Deep zone incidents
Blowout (surface flow) 6
2,350
2.55 3
1,622
1.85 138 %
Blowout (underground flow) 2 0.85 0.00
Diverted well release 0.00 1 0.62 0 %
Well release 0.00 2 1.23 0 %
Total 8 3.40 6 3.70 92 %
Shallow zone incidents
Blowout (surface flow) 3
2,350
1.28 2
1,622
1.23 104 %
Diverted well release 3 1.28 0.00
Well release 0.00 2 1.23
Total 6 2.55 4 2.47 104 %
Total all 14 5.96 10 6.17 97 %
There are fairly few development wells drilled from a floating unit, and no LOWC events have
been observed. Approximately eight times as many development wells have been drilled from
bottom fixed units, and in total 16 LOWC events have been observed.
For exploration drilling the LOWC frequency for floating units and bottom fixed units are
similar.
When combing all the LOWC events in Table 17.9 and Table 17.10 with the kick frequency in
Table 16.13, page 171 and Table 16.14, page 172 an estimate for experiencing a LOWC per
well kick can be established for a floating vs. bottom fixed installation. The experience from
exploration drilling and development drilling have been merged. The results are shown in Table
17.11.
Table 17.11 Number of kicks per LOWC floating vs. bottom fixed drilling
Type of installation
All drilling LOWCs (2000–2015) All drilling kicks (2011 – 2015) No. of kicks per LOWCs
No. of LOWCs
Total no. of well drilled
LOWC frequency per well drilled
Total no. of drilling kicks
No. of wells spudded
Kick frequency per well spudded
Bottom fixed 30 7,956 0.00377 157 842 0.18646 49
Floating units 10 2,306 0.00434 108 279 0.38710 89
Table 17.11 assumes that the kick frequency for the period 2011 – 2015 will be representative
for the period 2000–2015.
Table 17.11 indicates that one out of 49 kicks on a bottom fixed installation results in a LOWC
and one out of 89 kicks on a floater results in a LOWC.
From a risk perspective the LOWC type blowout (surface flow) from a deep zone is the LOWC
type with the highest risk. When combing the deep zone blowout (surface flow) LOWC events
in Table 17.9 and Table 17.10 with the kick frequency in Table 16.13, page 171 and Table
16.14, page 172 an estimate for that a well kick shall develop to a deep zone blowout (surface
flow) has been established for a floating vs. a bottom fixed installation. The experience from
exploration drilling and development drilling have been merged.

Loss of Well Control Occurrence and Size Estimators, Phase I and II
Page 185
The results are shown in Table 17.12.
Table 17.12 Number of kicks per blowout (surface flow) LOWC floating vs. bottom fixed drilling
Type of installation
All drilling LOWCs (2000–2015) All drilling kicks (2011 – 2015) No. of kicks per LOWCs
No. of LOWCs
Total no. of well drilled
LOWC frequency per well drilled
Total no. of drilling kicks
No. of wells spudded
Kick frequency per well spudded
Bottom fixed 8 7,956 0.00101 157 842 0.18646 185
Floating units 3 2,306 0.00130 108 279 0.38710 298
Table 17.12 indicates that one out of 185 kicks on a bottom fixed installation results in a
blowout (surface flow) type LOWC and one out of 298 kicks on a floater results in a blowout
(surface flow) type LOWC.
17.1.4 PROBABILITY OF OIL SPILLS LARGER THAN 500 BLLS
Acute large oil spills have occurred on three occasions in regulated areas including US GoM
OCS in the period 2000–2015 as discussed in section 13.4, page 121. These all occurred
during drilling. In addition an incident that occurred in 2004 is still not under control. The
flow rate from this incident is, however, low but the cumulative amount over a 12 – 13 year
period causes that this spill is qualified as a very large oil spill.
Probability for Drilling LOWC events with an oil spill larger than 500 bbls
The three spills all occurred during drilling, they are:
2009 – Australia, Montara: A total volume of 29,600 barrels 4,800 m3, or 66 m3 per day.
2010 – USA, Macondo: 8,000 m3 a day in 85 days, in total 680,000 m3, or 4,250,000 bbls
2011 – Brazil, Frade field: 600 bbls per day or 3,700 bbls in total.
These incidents caused large media attention, high direct cost and loss of reputation for the
involved parties.
If relying on these three incidents and the number of wells drilled in the period 2000–2015
(Table 2.1, page 33 and Table 2.4, page 36) in the US GoM OCS and the regulated areas, the
probability of a large oil spill will be;
Exploration drilling; 2 blowouts / 7,969 wells drilled = 1 blowout / 3,985 wells drilled,
or 0.025% per well drilled4
Development drilling; 1 blowout / 14,444 wells drilled , or 0.007% per well drilled
One of three deep zone development drilling blowouts (surface flow) and two of 10 deep zone
exploration drilling Blowouts (surface flow) caused a large spill.
4 Statoil said the statistical probability of a blow-out, an uncontrolled oil spill from a well, was 0.014 percent - or one for every 7,100 exploration wells in the Norwegian Barents Sea (www.Rigzone.com Monday, April 24, 2017

Loss of Well Control Occurrence and Size Estimators, Phase I and II
Page 186
If looking further back in time, no drilling blowouts with large oil spills occurred in the US
GoM OCS and the regulated areas in the period 1980–1999. Number of wells drilled in this
period:
15,388 exploration wells [7]
21,727 development wells [7]
If adding this to the exposure data the experienced frequency for the period 1980 – 2015 for
US GoM and the regulated areas will be;
Exploration drilling; 2 blowouts / 23,357 wells drilled = 1 blowout /11,679 wells drilled
Development drilling; 1 blowout / 36,171 wells drilled
When looking at the period 1980 – 2015 for US GoM and the regulated areas, one of 10 deep
zone development drilling blowout (surface flow) incidents and two of 27 deep zone
exploration drilling blowouts (surface flow) caused a large spill.
It seems reasonable to base a large spill probability on the period 1980 – 2015 for US GoM and
the regulated areas. It can then be assumed that 3 of 37, or 8.1%, of the deep zone drilling
blowout (surface flow) incidents will cause a large release.
If looking further back in time to the 70’s none of the drilling blowouts caused large pollution
in the US GoM and regulated areas, but one workover blowout, one blowout during production,
and one wireline blowout did.
Although there has been no large releases from workover and completion LOWC events
observed in the period 1980 to 2015 for the US GoM OCS and the regulated areas this
probability cannot be ruled out. Such incidents have been observed in other areas of the world
and in other periods.
Probability for Workover LOWC events with large spill
As input for the analysis, it has been assumed that 0.5 blowout (surface flow) workover LOWC
incidents with a large release have been observed for all workover activities in the period 1980
- 2015 in the US GoM OCS, Norway and UK. The SINTEF Offshore Blowout Database [7]
shows that 28 blowout (surface flow) LOWC events occurred in this period during workover
activities. Under this assumption it can be expected that one of every 56 (or 1.8%) blowout
(surface flow) LOWC events during workover will involve a large release.
Probability for Completion LOWC events with large spill probability
As input for the analysis, it has been assumed that 0.5 blowout (surface flow) completion
LOWC incidents with a large release have been observed for all completion activities in the
period 1980 until 2015 in the US GoM OCS and the regulated areas. The SINTEF Offshore
Blowout Database [7] shows that 11 blowout (surface flow) LOWC events occurred in this
period during well completion activities. Under this assumption it can be expected that one of
every 22 (or 4.5%) blowout (surface flow) LOWC events during completion will involve a large
release.
Probability for Production LOWC events with large spill probability

Loss of Well Control Occurrence and Size Estimators, Phase I and II
Page 187
As input for the analysis, it has been assumed that 0.7 blowout (surface flow) production
LOWC incidents with a large release have been observed for all production activities in the
period 1980 - 2015 in the US GoM OCS, Norway and UK.
No acute large oil spill has occurred during production, but an incident that occurred in 2004
is still not under control. The daily leak rate is limited to around 2 barrels, but the cumulative
leak over 12 - 13 years caused this LOWC to be categorized as very large. The total volume
leaked over this period has been estimated to be between 6,000 – 25,000 barrels. The incident
was caused by an underwater landslide caused by a hurricane.
When looking at the period from 1980 – 1999 no large oil spills have occurred in the production
phase in the US GoM OCS, Norway and UK.
The SINTEF Offshore Blowout Database [7] shows that 23 blowout (surface flow) LOWC
events occurred in this period during well production. Under this assumption it can be expected
that one of every 33 (or 3.0%) blowout (surface flow) LOWC events during production will
involve a large and acute release.
Probability for Wireline LOWC events with large spill probability
As input for the analysis, it has been assumed that the probability of a large leak from a wireline
blowout (surface flow) event is the same as for a workover blowout (surface flow) event, i.e.
1.8%.

Loss of Well Control Occurrence and Size Estimators, Phase I and II
Page 188
17.2 RISK MODEL FOR PREDICTION OF FUTURE RISK
To predict the future risk related to LOWC events in the US GoM OCS, the LOWC experience
from the past in the US GoM and the regulated areas have been used in combination with a
predicted activity level.
Figure 17.1 Risk model used for predicting the risk
As discussed in this report LOWC events may originate from many causes and create a large
variety of consequences. Most LOWC events have small consequences, but some have very
severe consequences.
For the overall risk results the experience from US GOM OCS has been used with respect to
the frequency of the LOWC events, while a combination of the US GoM OCS and the regulated
areas has been used for assessing the consequences of the LOWC events.
Spreadsheets have been used to perform the calculations. The three main spreadsheets with
input data and references to where the data is taken from are shown in Appendix 1 to this report.
The first spreadsheet shows a five year LOWC risk that has been predicted mainly based on
the 2000–2015 US GoM OCS experience.
For the second spreadsheet, a five year LOWC risk has been predicted based on the 2000–2015
US GoM OCS and regulated areas experience.
Loss of primary barrier Typical kicks for
drilling wells Typical kicks or
equipment failures for workover and
completions
Loss of secondary barrier Typical BOP,
casing, welheads, valve,formation failures
LOWC
Consequence of eventProbability of event
Blowout (surface
flow)
Ignition
No ignition
Gas only
Oil and gas
Ignition
No ignition
Fatalities
Material damages
Fatalities
Material damages
Possible oil pollution
Large oil spill
No or minor oil spill
Well release
Ignition
No ignitionGas only
Oil and gas
Fatalities
Material damages
No or minor oil spill
Blowout (under-ground flow)
Small conse-quences
Diverted well
release Ignition
No ignition
Fatalities
Material damages
IgnitionFatalities
Material damages
No ignition

Loss of Well Control Occurrence and Size Estimators, Phase I and II
Page 189
The third spreadsheet has been used to verify the risk model by calculating the risk for the
period 2000–2015 and comparing with the experienced events in the database.
For the risk assessment, a five-year period has been assumed. The US GoM OCS activity for
this five-year period is based on the 2015 activity level. Table 17.13 shows the estimated
activity for a five-year period
Table 17.13 Estimated US GoM OCS activity for a five year period, based on the 2015 activity (from Table 2.1, Table 2.2, Table 2.3, and Table 2.6)
Activity type Activity level
Exploration drilling from bottom fixed installation (Number of wells drilled) 25
Exploration drilling from floating vessel (Number of wells drilled) 490
Development drilling floating or bottom fixed installation (Number of wells drilled) 540
Workover (Number of well years in service) 16,900
Completion (Number of wells completed) 440
17.3 ESTIMATED RISK LEVEL IN US GOM OCS FOR A FIVE-YEAR PERIOD
Table 17.14 shows the overall result from the risk analysis for US GoM in a five-year period
based on an annual activity level as in 2015.
Table 17.14 Overall risk analysis result US GoM OCS a five-year period, input frequencies based on US GoM OCS 2000–2015, annual activity level based on US GoM OCS 2015
Activity type
Risk results
No. of LOWCs to
expect
No. of ignited
events to expect
No. of fatalities to expect
Material damages Large spill probability Total
Loss Severe Damage Small-/no
Exploration drilling from bottom fixed installation
0.149 0.014 0.021 0.0071 0.0035 0.0053 0.1330 0.0052
Exploration drilling from floating vessel
3.018 0.275 0.361 0.1118 0.0815 0.1095 2.7156 0.0734
Development drilling floating or bottom fixed installation
1.376 0.118 0.174 0.0574 0.0305 0.0449 1.2436 0.0140
Workover 4.559 0.401 0.490 0.1447 0.1278 0.1640 4.1227 0.0352
Completion 0.264 0.017 0.021 0.0065 0.0051 0.0068 0.2454 0.0040
Production 2.605 0.294 0.404 0.1287 0.0828 0.1150 2.2788 0.0521
Wireline 0.651 0.028 0.014 0.0000 0.0139 0.0139 0.6236 0.0000
Total all 12.62 1.15 1.49 0.46 0.34 0.46 11.36 0.18
Table 17.14 shows that the expected value for the number of LOWC events for a five-year
period is 12.6. This means that 12 to 13 LOWC events can be expected to occur in a five-year
period.
It should be noted that the reduced drilling activity in the US GoM OCS is reflected in the risk
model, causing that the relative risk contribution from drilling LOWC events is reduced
compared to workover and the production phase where the activity is assumed to be more
stable.

Loss of Well Control Occurrence and Size Estimators, Phase I and II
Page 190
Table 17.14, further indicates that there is a probability of a large spill in in this five-year period
of 18%. A large spill includes spills with a total release above from 500 barrels to millions of
barrels.
Figure 17.2 shows a pie chart with the estimated contribution from the various phases of
operation to the large spill probability based on a 2015 activity level.
Figure 17.2 The contributors to the large spill probability based on a 2015 activity level.
Should there be a large spill caused by a LOWC event, the risk analysis indicates that with
around a 40% probability, it will occur during exploration drilling from a floater. The
proportion from a producing well is close to 30%, and from a workover event is around 20%.
If there should occur a large spill during production it is likely to be caused by an external load
as a hurricane.
It can be expected that 3.5% of the LOWC events will result in a total loss of the installation.
With the estimated number of LOWC events for a five-year period in the US GoM OCS, there
is a 46% probability that a total loss incident shall occur in a five-year period. Most LOWC
events cause no or minor damages to the installation.
There are few LOWC events with fatalities. Occasionally a LOWC may cause several fatalities.
Based on the average numbers, one to two fatalities caused by LOWC events can be expected
in a five-year period in the US GoM OCS.
One LOWC event can be expected to ignite in a five-year period.
If assuming that the LOWC frequencies from the regulated areas and the GoM combined will
be representative for the five-year risk estimate for the US GoM OCS, Table 17.15 shows the
risk.
3%
41%
8%
20%
2%
29%
0%Contributors to large spill probability
Exploration drilling from bottom fixed installation
Exploration drilling from floating vessel
Development drilling floating or bottom fixed installation
Workover
Completion
Production
Wireline

Loss of Well Control Occurrence and Size Estimators, Phase I and II
Page 191
Table 17.15 Overall risk analysis result, US GoM OCS for a five-year period, input frequencies based on US GoM OCS and regulated areas combined, 2000–2015
Activity type
Risk results
No. of LOWCs to expect
No. of ignited events to
expect
No. of fatalities to
expect
Material damages Large spill probability
Total Loss
Severe Damage Small-
/no
Exploration drilling 1.94 0.170 0.238 0.077 0.047 0.066 1.750 0.052
Development drilling 0.82 0.075 0.110 0.036 0.020 0.029 0.738 0.009
Workover 3.50 0.292 0.345 0.100 0.096 0.121 3.184 0.024
Completion 0.34 0.022 0.024 0.006 0.008 0.009 0.318 0.004
Production 2.02 0.200 0.259 0.080 0.060 0.080 1.800 0.032
Wireline 0.94 0.055 0.047 0.010 0.022 0.025 0.886 0.002
Total all 9.57 0.813 1.023 0.308 0.252 0.329 8.676 0.124
When basing the input frequencies on a combination of the US GoM OCS and the regulated
areas the estimated risk becomes lower because the LOWC frequencies are lower in the
regulated areas than in the US GoM. For all the risk measures, the risk is reduced to 67% –
76%.
17.4 RISK MODEL VERIFICATION
To verify the risk model used, the total activity in the US GoM OCS for the period 2000–2015
has been fed into the model. Table 17.16 shows the US GoM OCS activity for the period 2000–
2015.
Table 17.16 The US GoM OCS activity for the period 2000–2015 (from Table 2.1, Table 2.3, and Table 2.6)
Activity type Activity level
Exploration drilling from bottom fixed installation (Number of wells drilled) 2,350
Exploration drilling from floating vessel (Number of wells drilled) 1,622
Development drilling Floating or bottom fixed installation (Number of wells drilled) 6,288
Workover (Number of well years in service) 77,843
Completion (Number of wells completed) 5,004
Table 17.17 shows the comparison of the risk result from the risk model and from a count in
the SINTEF Offshore Blowout Database.
Table 17.17 Risk model verification, input frequencies based on US GoM OCS 2000–2015, activity level 2000–2015
Result type
Risk comparison
No. of LOWCs
No. of ignited events
No. of fatalities
Material damages Large spill probability Total
Loss Severe Damage
Small-/no
Risk calculated with risk model 79.03 7.15 9.65 3.04 2.05 2.81 71.13 1.34
Count from SINTEF Offshore Blowout Database
79 6 13 3 1 3 72 1
Table 17.17 shows that the results from the risk model corresponds well with the incident count
from the SINTEF Offshore Blowout Database.

Loss of Well Control Occurrence and Size Estimators, Phase I and II
Page 192
17.5 RISK MATRICES
To illustrate the risk level for the future activities in the US GoM OCS two risk matrices have
been established. The frequency and the consequences in the risk matrices are based on the
results in this Section 17.3, page 189, and some coarse evaluations.
The color codes used are based on the authors subjective opinion. A red color code indicates a
high risk, a yellow indicates a medium risk, and green indicates a low risk. The x indicates the
predicted LOWC risk level for the US GoM OCS activities combined. The phases of operation
included are exploration drilling, development drilling, workover- and completion activities.
Figure 17.3 shows a risk matrix for oil spills caused by LOWCs and Figure 17.4 shows a risk
matrix for fatalities caused by LOWCs.
Probability
LOWC consequence (Spill size)
No or insignificant
spill
Minor spill (10 - 50 bbls)
Medium spill (50 -500 bbls)
Large spill (500 – 5,000
bbls)
Very large spill (5,000 - 50,000 bbls)
Gigantic spill (>50,000
bbls)
More frequent than once a year
X
1 - 5 times in 5 year
X
1 - 4 times in 20 year
1- 4 times in 80 year
X
1 - 2 times in 160 year
X X X
less than once in 160 year
Figure 17.3 Risk matrix LOWC oil spill for the US GoM OCS
Probability LOWC consequence (No. of fatalities)
No fatalities 1 fatality 1- 5 fatalities 5 - 20 fatalities More than 20
fatalities
More frequent than once a year
X
1 - 5 times in 5 year
1 - 4 times in 20 year
1- 4 times in 80 year
X X
1 - 2 times in 160 year
X
less than once in 160 year
X
Figure 17.4 Risk matrix LOWC fatalities for the US GoM OCS

Loss of Well Control Occurrence and Size Estimators, Phase I and II
Page 193
17.6 LOWC RISK REDUCTION DISCUSSION
The main contributors to the risk are the blowout (surface flow) accidents. These incidents have
the largest accident potential with respect to fires, loss of lives, spill to the surroundings, and
damage to material assets.
In general, by reducing the kick frequency the LOWC event frequency will be reduced. The
kick frequencies in the US GoM OCS are high, as shown in Figure 16.1, page 174. A reduction
of the kick frequency will reduce the LOWC event frequency. If assuming that a kick frequency
reduction of 50% in drilling operations will reduce the LOWC event frequency in drilling with
50%, the total risk for the US GoM OCS will be reduced.
Table 17.18 shows the effect of reducing the drilling kick frequency with 50% when assuming
a five-year period with an annual activity levels as in 2015.
Table 17.18 Sensitivity analysis, effect of reducing of drilling kick frequency with 50%
Activity type
Risk results
No. of LOWCs to
expect
No. of ignited
events to expect
No. of fatalities to expect
Material damages Large spill probability Total
Loss Severe Damage Small-/no
Exploration drilling from bottom fixed installation
0.075 0.007 0.011 0.0035 0.0018 0.0027 0.0665 0.0026
Exploration drilling from floating vessel
1.509 0.138 0.181 0.0559 0.0408 0.0547 1.3578 0.0367
Development drilling floating or bottom fixed installation
0.688 0.059 0.087 0.0287 0.0153 0.0224 0.6218 0.0070
Workover 4.559 0.401 0.490 0.1447 0.1278 0.1640 4.1227 0.0352
Completion 0.264 0.017 0.021 0.0065 0.0051 0.0068 0.2454 0.0040
Production 2.605 0.294 0.404 0.1287 0.0828 0.1150 2.2788 0.0521
Wireline 0.651 0.028 0.014 0.0000 0.0139 0.0139 0.6236 0.0000
Total risk with 50% reduced kick frequency drilling events
10.351 0.944 1.208 0.368 0.287 0.379 9.317 0.138
Result from Base Case Table 17.14
12.62 1.15 1.49 0.46 0.34 0.46 11.36 0.18
Risk reduction compared to base case
18.0 % 17.9 % 18.9 % 20.0 % 15.6 % 17.6 % 18.0 % 23.3 %
Table 17.18 shows that by reducing the drilling kick frequency the total LOWC risk in the US
GoM OCS risk will be reduced with around 20%.
Another important factor with respect to drilling LOWC events is the kick detection. For
approximately 50% of the deep zone drilling LOWC events, the kick was not observed before
the well was flowing to the surroundings. If these kicks had been observed in time, the LOWC
events would most likely not have occurred.
For most of the well completion kicks and the workover kicks in killed wells, late kick detection
is a common factor.
Efforts to improve the kick detection during drilling, completion, and workover activities will
in most cases give a corresponding reduction in the LOWC event frequency.

Loss of Well Control Occurrence and Size Estimators, Phase I and II
Page 194
For workovers, it is especially important to be prepared that the barrier situation and the
pressures in the well that shall be worked over may be different than expected.
The highest risk contribution from producing wells stems from LOWC incidents caused by
hurricanes. When a hurricane damages the topside barriers, the quality of the downhole barriers
as tubing, packer, and SCSSV is important.
Wireline incidents have a small impact on the total risk.
The abandoned wells have not been included in the risk model, and the risk is difficult to
quantify. In the period 2000–2015, LOWC events from these well types did not cause any
significant damage. The number of temporary abandoned wells in the whole world is large.
Many of these wells have been temporary abandoned for many years. The risk related to LOWC
events from the temporary abandoned wells will increase unless a significant effort is put in to
permanently plug and abandon these wells.

Loss of Well Control Occurrence and Size Estimators, Phase I and II
Page 195
REFERENCES
1. James Donald Dobson (HSE), “Kicks in Offshore UK Wells - Where Are They
Happening, And Why? “SPE-119942-MS, SPE/IADC Drilling Conference and
Exhibition, 17-19 March, Amsterdam, The Netherlands, 2009
2. Trends in risk level in the petroleum activity (RNNP), Petroleum Safety Authority
Norway (http://www.psa.no/about-rnnp/category911.html)
3. Holand, P.: "Deepwater Kicks and BOP Performance" SINTEF Report STF38
AA01419
4. Holand, P., Awan H.: "Reliability of Deepwater Subsea BOP Systems and Well
Kicks”. Exprosoft Report ES201252
5. Holand, P. “Analysis of Blowout Causes based on the SINTEF Offshore Blowout
Database” ExproSoft Report no.: 1611197/1 (Restricted)
6. Andersen L. B. (Alliance Technology) Holand, P. (SINTEF) Wicklund, J.
Scandpower: “Estimation of Blowout Probability for HPHT Wells”. SINTEF Report
STF38 F98420. (Restricted).
7. SINTEF Offshore Blowout Database, https://www.sintef.no/en/projects/sintef-
offshore-blowout-database/
8. BSEE borehole file http://www.data.bsee.gov/homepg/data_center/well/well.asp
9. BSEE OgorA file
https://www.data.bsee.gov/homepg/pubinfo/freeasci/product/freeprod_ogora.asp
10. BSEE WAR https://www.data.boem.gov/homepg/data_center/well/war/master.asp
11. BSEE LOWC definition https://www.bsee.gov/site-page/loss-of-well-control
12. Safety Alerts from BSEE in the US (http://www.bsee.gov/BSEE-
Newsroom/Publications-Library/Historical-BSEE-Safety-Alerts/ )
13. UK wells drilled https://www.gov.uk/guidance/oil-and-gas-wells.
14. Brazilian wells drilled from ANP (http://www.bdep.gov.br/?id=261)
15. Lasse Berg Andersen “Stochastic Modelling for the Analysis of Blowout Risk in
Exploration Drilling”, PhD Thesis, Robert Gordon University, Aberdeen, UK, 1995
16. Rasmus Nes “Blowout and well release frequencies based on SINTEF offshore
blowout database 2014”, Lloyd’s Register Report 19101001 -8/2015/R3, Kjeller
March 2015
17. Adams, N., and Kuhlman, L., Kicks and Blowout Control, Second Edition, Pennwell
Publishing Company, Tulsa, OK, USA, 1994
18. Grace R. D., Advanced Blowout & Well Control, Gulf Publishing Company, Houston,
TX, USA, 1994
19. NORSOK D-010 (Rev 4, June 2013)
20. Petroleum Safety Authority Norway (http://www.ptil.no/English/Frontpage.htm)
21. Norwegian Regulations related to well barriers during drilling
(http://www.ptil.no/regelverk/r2002/frame_e.htm).
22. IADC Lexicon http://www.iadclexicon.org/

Loss of Well Control Occurrence and Size Estimators, Phase I and II
Page 196
APPENDIX 1, RISK ANALYSES SPREADSHEETS
In the subsequent pages three spreadsheets are shown presenting input data and results from
the main risk calculations.
1. Frequencies based on US GoM OCS 2000–2015. Consequences mainly based on US
GoM OCS and regulated areas 2000–2015, assumed 5 years of activity equal to 2015
activity level.
2. Frequencies and Consequences based on US GoM OCS and regulated areas 2000–
2015, assumed 5 years of activity equal to 2015 activity level.
3. Risk model verification, Frequencies based on US GoM OCS 2000–2015.
Consequences mainly based on US GoM OCS and regulated areas 2000–2015, All US
GoM activities 2000–2015.

Frequencies based on US GoM OCS 2000–2015. Consequences mainly based on US GoM OCS and regulated areas 2000–2015, assumed 5 year activity level based on 2015
Offshore activity INPUT DATA Risk results
Type of drilling
Deep or shallow zone
Main category
LOWC frequency per well drilled (Table 17.10) (US GOM OCS frequencies)
Ignition probability per LOWC (Table
14.3)
Fatalities per LOWC
(Table 14.1)
Material damages (Table 14.4) Large spill probability per LOWC (Section
17.1.4)
US GoM OCS activity level five year period (Table 17.13), no.
of exploration wells
No. of LOWCs to
expect
No. of ignited events to
expect
No. of fatalities to expect
Material damages Large spill probability
Total Loss
Severe Damage Small /no Total Loss
Severe Damage Small /no
Exploration drilling from bottom fixed installation
Deep
Blowout surface flow 0.00255 14.8 % 0.22 7.4 % 3.7 % 5.6 % 83.3 % 8.10 % 25 0.064 0.009 0.014 0.0047 0.0024 0.0035 0.0531 0.0052 Blowout (underground flow) 0.00085 0.0 % 0.00 0.0 % 0.0 % 0.0 % 100.0 % 0 % 25 0.021 0 0 0 0 0 0.0213 0 Diverted well release 0 0.0 % 0.00 0.0 % 0.0 % 0.0 % 100.0 % 0 % 25 0 0 0 0 0 0 0 0 Well release 0 4.3 % 0.02 0.0 % 2.1 % 2.1 % 95.7 % 0 % 25 0 0 0 0 0 0 0 0
Shallow
Blowout surface flow 0.00128 14.8 % 0.22 7.4 % 3.7 % 5.6 % 83.3 % 0 % 25 0.032 0.005 0.007 0.0024 0.0012 0.0018 0.0267 0 Blowout (underground flow) 0.00128 0.0 % 0.00 0.0 % 0.0 % 0.0 % 100.0 % 0 % 25 0.032 0 0 0 0 0 0.0320 0 Diverted well release 0 0.0 % 0.00 0.0 % 0.0 % 0.0 % 100.0 % 0 % 25 0 0 0 0 0 0 0 0 Well release 0.00000 4.3 % 0.02 0.0 % 2.1 % 2.1 % 95.7 % 0 % 25 0 0 0 0 0 0 0 0
SuM 0.00596 SuM 0.149 0.014 0.021 0.0071 0.0035 0.0053 0.1330 0.0052
Exploration drilling from floating vessel
Deep
Blowout surface flow 0.00185 14.8 % 0.22 7.4 % 3.7 % 5.6 % 83.3 % 8.10 % 490 0.907 0.134 0.201 0.0671 0.0336 0.0504 0.7554 0.0734 Blowout (underground flow) 0 0.0 % 0.00 0.0 % 0.0 % 0.0 % 100.0 % 0 % 490 0 0 0 0 0 0 0 0 Diverted well release 0.00062 0.0 % 0.00 0.0 % 0.0 % 0.0 % 100.0 % 0 % 490 0.304 0 0 0 0 0 0.3038 0 Well release 0.00123 4.3 % 0.02 0.0 % 2.1 % 2.1 % 95.7 % 0 % 490 0.603 0.026 0.013 0 0.0128 0 0.5771 0
Shallow
Blowout surface flow 0.00123 14.8 % 0.22 7.4 % 3.7 % 5.6 % 83.3 % 0 % 490 0.603 0.089 0.134 0.0446 0.0223 0.0335 0.5023 0 Blowout (underground flow) 0 0.0 % 0.00 0.0 % 0.0 % 0.0 % 100.0 % 0 % 490 0 0 0 0 0 0 0 0 Diverted well release 0.0 % 0.00 0.0 % 0.0 % 0.0 % 100.0 % 0 % 490 0.000 0 0 0 0 0 0.0000 0 Well release 0.00123 4.3 % 0.02 0.0 % 2.1 % 2.1 % 95.7 % 0 % 490 1 0 0 0 0 0 1 0
SuM 0.00616 SuM 3.018 0.275 0.361 0.1118 0.0815 0.1095 2.7156 0.0734
Operation Deep or shallow zone
Main category LOWC frequency per well
drilled (Table 17.9) (US GOM OCS frequencies)
Ignition probability per LOWC (Table
14.3)
Fatalities per LOWC
(Table 14.1)
Material damages (Table 14.4) Large spill probability per LOWC (Section
17.1.4)
US GoM OCS activity level five year period (Table 17.13), no.
of development wells
No. of LOWCs to
expect
No. of ignited events to
expect
No. of fatalities to expect
Material damages Large spill probability
Total Loss
Severe Damage Small /no Total Loss
Severe Damage Small /no
Development drilling Floating or bottom fixed installation
Deep
Blowout surface flow 0.00032 14.8 % 0.22 7.4 % 3.7 % 5.6 % 83.3 % 8.10 % 540 0.173 0.026 0.039 0.0128 0.0064 0.0096 0.1444 0.0140 Blowout (underground flow) 0.00016 0.0 % 0.00 0.0 % 0.0 % 0.0 % 100.0 % 0 % 540 0.087 0 0 0 0 0 0.0866 0 Diverted well release 0.00000 0.0 % 0.00 0.0 % 0.0 % 0.0 % 100.0 % 0 % 540 0 0 0 0 0 0 0 0 Well release 0.00016 4.3 % 0.02 0.0 % 2.1 % 2.1 % 95.7 % 0 % 540 0.087 0.004 0.002 0 0.0018 0 0.0829 0
Shallow
Blowout surface flow 0.00111 14.8 % 0.22 7.4 % 3.7 % 5.6 % 83.3 % 0 % 540 0.602 0.089 0.134 0.0446 0.0223 0.0334 0.5013 0 Blowout (underground flow) 0.0 % 0.00 0.0 % 0.0 % 0.0 % 100.0 % 0 % 540 0 0 0 0 0 0 0 0 Diverted well release 0.00079 0.0 % 0.00 0.0 % 0.0 % 0.0 % 100.0 % 0 % 540 0.428 0 0 0 0 0 0.4283 0 Well release 4.3 % 0.02 0.0 % 2.1 % 2.1 % 95.7 % 0 % 540 0 0 0 0 0 0 0 0
SuM 0.00255 SuM 1.376 0.118 0.174 0.0574 0.0305 0.0449 1.2436 0.0140 Material damages (Table 14.4) Material damages
Operation Main category LOWC frequency per well
year in service (Table 17.4) (US GOM OCS frequencies)
Ignition probability per LOWC (Table
14.3)
Fatalities per LOWC
(Table 14.1)
Total Loss
Severe Damage Small /no Large spill probability
per LOWC (Section 17.1.4)
US GoM OCS activity level five year period (Table 17.13), no.
of well years in service
No. of LOWCs to
expect
No. of ignited events to
expect
No. of fatalities to expect
Total Loss
Severe Damage Small /no Large spill probability
Workover
Blowout surface flow 0.000116 14.8 % 0.22 7.4 % 3.7 % 5.6 % 83.3 % 1.80 % 16,900 1.954 0.289 0.434 0.1447 0.0724 0.1086 1.6283 0.0352 Blowout (underground flow) 0.00000 0.0 % 0.00 0.0 % 0.0 % 0.0 % 100.0 % 0 % 16,900 0 0 0 0 0 0 0 0 Diverted well release 0.00000 0.0 % 0.00 0.0 % 0.0 % 0.0 % 100.0 % 0 % 16,900 0 0 0 0 0 0 0 0 Well release 0.000154 4.3 % 0.02 0.0 % 2.1 % 2.1 % 95.7 % 0 % 16,900 2.605 0.112 0.055 0 0.0554 0 2.4944 0
SuM 0.000270 SuM 4.559 0.401 0.490 0.1447 0.1278 0.1640 4.1227 0.0352 Material damages (Table 14.4) Material damages
Operation Main category LOWC frequency per well
year in service (Table 17.3) (US GoM OCS frequencies)
Ignition probability per LOWC (Table
14.3)
Fatalities per LOWC
(Table 14.1)
Total Loss
Severe Damage Small /no Large spill probability
per LOWC (Section 17.1.4)
US GoM OCS activity level five year period (Table 17.13), no.
of completed wells
No. of LOWCs to
expect
No. of ignited events to
expect
No. of fatalities to expect
Total Loss
Severe Damage Small /no Large spill probability
Completion
Blowout surface flow 0.000200 14.8 % 0.22 7.4 % 3.7 % 5.6 % 83.3 % 4.50 % 440 0.088 0.013 0.020 0.0065 0.0033 0.0049 0.0733 0.0040 Blowout (underground flow) 0.000000 0.0 % 0.00 0.0 % 0.0 % 0.0 % 100.0 % 0 % 440 0 0 0 0 0 0 0 0 Diverted well release 0.000200 0.0 % 0.00 0.0 % 0.0 % 0.0 % 100.0 % 0 % 440 0.088 0 0 0 0 0 0.0879 0 Well release 0.000200 4.3 % 0.02 0.0 % 2.1 % 2.1 % 95.7 % 0 % 440 0.088 0.004 0.002 0 0.0019 0 0.0842 0
SuM 0.000600 SuM 0.264 0.017 0.021 0.0065 0.0051 0.0068 0.2454 0.0040 Material damages (Table 14.4) Material damages
Operation Main category LOWC frequency per well
year in service (Table 17.5) (US GOM OCS frequencies)
Ignition probability per
LOWC (Table 14.3)
Fatalities per LOWC
(Table 14.1)
Total Loss
Severe Damage Small /no Large spill probability
per LOWC (Section 17.1.4)
US GoM OCS activity level five year period (Table 17.13), no.
of well years in service
No. of LOWCs to
expect
No. of ignited events to
expect
No. of fatalities to expect
Total Loss
Severe Damage Small /no Large spill probability
Production
Blowout surface flow 0.000103 14.8 % 0.22 7.4 % 3.7 % 5.6 % 83.3 % 3.00 % 16,900 1.737 0.257 0.386 0.1287 0.0643 0.0965 1.4474 0.0521 Blowout (underground flow) 0.000000 0.0 % 0.00 0.0 % 0.0 % 0.0 % 100.0 % 0 % 16,900 0 0 0 0 0 0 0 0 Diverted well release 0.000000 0.0 % 0.00 0.0 % 0.0 % 0.0 % 100.0 % 0 % 16,900 0.000 0 0 0 0 0 0.0000 0 Well release 0.000051 4.3 % 0.02 0.0 % 2.1 % 2.1 % 95.7 % 0 % 16,900 0.868 0.037 0.018 0 0.0185 0 0.8315 0 SuM 0.000154 SuM 2.605 0.294 0.404 0.1287 0.0828 0.1150 2.2788 0.0521 Material damages (Table 14.4) Material damages
Operation Main category LOWC frequency per well
year in service (Table 17.6) (US GOM OCS frequencies)
Ignition probability per
LOWC (Table 14.3)
Fatalities per LOWC
(Table 14.1)
Total Loss
Severe Damage Small /no Large spill probability
per LOWC (Section 17.1.4)
US GoM OCS activity level five year period (Table 17.13), no.
of well years in service
No. of LOWCs to
expect
No. of ignited events to
expect
No. of fatalities to expect
Total Loss
Severe Damage Small /no Large spill probability
Wireline
Blowout surface flow 0.000000 14.8 % 0.22 7.4 % 3.7 % 5.6 % 83.3 % 1.80 % 16,900 0.000 0.000 0.000 0.0000 0.0000 0.0000 0.0000 0.0000 Blowout (underground flow) 0.000000 0.0 % 0.00 0.0 % 0.0 % 0.0 % 100.0 % 0 % 16,900 0 0 0 0 0 0 0 0 Diverted well release 0.000000 0.0 % 0.00 0.0 % 0.0 % 0.0 % 100.0 % 0 % 16,900 0.000 0 0 0 0 0 0.0000 0 Well release 0.000039 4.3 % 0.02 0.0 % 2.1 % 2.1 % 95.7 % 0 % 16,900 0.651 0.028 0.014 0 0.0139 0 0.6236 0 SuM 0.000039 SuM 0.651 0.028 0.014 0.0000 0.0139 0.0139 0.6236 0.0000
Material damages
US GoM OCS five year period risk
No of
LOWCs to expect
No. of ignited events to
expect
No. of fatalities to expect
Total Loss
Severe Damage Small /no Large spill probability
Total all 12.623 1.148 1.486 0.456 0.345 0.459 11.363 0.184

Frequencies and Consequences based on US GoM OCS and regulated areas 2000–2015, assumed 5 year activity level based on 2015
Offshore activity INPUT DATA Risk results
Type of drilling
Deep or shallow zone
Main category
LOWC frequency per well drilled (Table 17.2) (US, UK & Norwegian frequencies)
Ignition probability per LOWC (Table
14.3)
Fatalities per LOWC
(Table 14.1)
Material damages (Table 14.4) Large spill probability per LOWC (Section
17.1.4)
US GoM OCS activity level five year period (Table 17.13), no.
of exploration wells
No. of LOWCs to
expect
No. of ignited events to
expect
No. of fatalities to expect
Material damages Large spill probability
Total Loss
Severe Damage Small /no Total Loss
Severe Damage Small /no
Exploration drilling Floating or bottom fixed installation
Deep
Blowout surface flow 0.00125 14.8 % 0.22 7.4 % 3.7 % 5.6 % 83.3 % 8.10 % 515 0.646 0.096 0.144 0.0479 0.0239 0.0359 0.5385 0.0523 Blowout (underground flow) 0.00038 0.0 % 0.00 0.0 % 0.0 % 0.0 % 100.0 % 0 % 515 0.194 0.000 0.000 0.0000 0.0000 0.0000 0.1939 0.0000 Diverted well release 0.00013 0.0 % 0.00 0.0 % 0.0 % 0.0 % 100.0 % 0 % 515 0.065 0.000 0.000 0.0000 0.0000 0.0000 0.0646 0.0000 Well release 0.00050 4.3 % 0.02 0.0 % 2.1 % 2.1 % 95.7 % 0 % 515 0.259 0.011 0.006 0.0000 0.0055 0.0055 0.2475 0.0000
Shallow
Blowout surface flow 0.00075 14.8 % 0.22 7.4 % 3.7 % 5.6 % 83.3 % 0 % 515 0.388 0.057 0.086 0.0287 0.0144 0.0215 0.3231 0.0000 Blowout (underground flow) 0.00000 0.0 % 0.00 0.0 % 0.0 % 0.0 % 100.0 % 0 % 515 0 0.000 0.000 0.0000 0.0000 0.0000 0.0000 0.0000 Diverted well release 0.00050 0.0 % 0.00 0.0 % 0.0 % 0.0 % 100.0 % 0 % 515 0.259 0.000 0.000 0.0000 0.0000 0.0000 0.2585 0.0000 Well release 0.00025 4.3 % 0.02 0.0 % 2.1 % 2.1 % 95.7 % 0 % 515 0.129 0.006 0.003 0.0000 0.0028 0.0028 0.1238 0.0000
SuM 0.00376 SUM 1.94 0.170 0.238 0.077 0.047 0.066 1.750 0.052
Operation Deep or shallow zone
Main category LOWC frequency per well drilled Table 17.1) (US, UK & Norwegian frequencies)
Ignition probability per LOWC (Table
14.3)
Fatalities per LOWC
(Table 14.1)
Material damages (Table 14.4) Large spill probability per LOWC (Section
17.1.4)
US GoM OCS activity level five year period (Table 17.13), no.
of development wells
No. of LOWCs to
expect
No. of ignited events to
expect
No. of fatalities to expect
Material damages Large spill probability
Total Loss
Severe Damage Small /no Total Loss
Severe Damage Small /no
Development drilling Floating or bottom fixed installation
Deep
Blowout surface flow 0.00021 14.8 % 0.22 7.4 % 3.7 % 5.6 % 83.3 % 8.10 % 540 0.112 0.017 0.025 0.0083 0.0042 0.0062 0.0935 0.0091 Blowout (underground flow) 0.00007 0.0 % 0.00 0.0 % 0.0 % 0.0 % 100.0 % 0 % 540 0.037 0.000 0.000 0.0000 0.0000 0.0000 0.0374 0.0000 Diverted well release 0.00000 0.0 % 0.00 0.0 % 0.0 % 0.0 % 100.0 % 0 % 540 0.000 0.000 0.000 0.0000 0.0000 0.0000 0.0000 0.0000 Well release 0.00014 4.3 % 0.02 0.0 % 2.1 % 2.1 % 95.7 % 0 % 540 0.075 0.003 0.002 0.0000 0.0016 0.0016 0.0716 0.0000
Shallow
Blowout surface flow 0.00069 14.8 % 0.22 7.4 % 3.7 % 5.6 % 83.3 % 0 % 540 0.374 0.055 0.083 0.0277 0.0138 0.0208 0.3115 0.0000 Blowout (underground flow) 0.0 % 0.00 0.0 % 0.0 % 0.0 % 100.0 % 0 % 540 0 0.000 0.000 0.0000 0.0000 0.0000 0.0000 0.0000 Diverted well release 0.00042 0.0 % 0.00 0.0 % 0.0 % 0.0 % 100.0 % 0 % 540 0.224 0.000 0.000 0.0000 0.0000 0.0000 0.2243 0.0000 Well release 4.3 % 0.02 0.0 % 2.1 % 2.1 % 95.7 % 0 % 540 0.000 0.000 0.000 0.0000 0.0000 0.0000 0.0000 0.0000
SuM 0.00152 SUM 0.82 0.075 0.110 0.036 0.020 0.029 0.738 0.009 Material damages (Table 14.4) Material damages
Operation Main category
LOWC frequency per well year in service (Table 17.4)
(US, UK & Norwegian frequencies)
Ignition probability per LOWC (Table
14.3)
Fatalities per LOWC
(Table 14.1)
Total Loss
Severe Damage Small /no Large spill probability
per LOWC (Section 17.1.4)
US GoM OCS activity level five year period (Table 17.13), no.
of well years in service
No. of LOWCs to
expect
No. of ignited events to
expect
No. of fatalities to expect
Total Loss
Severe Damage Small /no Large spill probability
Workover
Blowout surface flow 0.000080 14.8 % 0.22 7.4 % 3.7 % 5.6 % 83.3 % 1.80 % 16,900 1.346 0.199 0.299 0.0997 0.0499 0.0748 1.1219 0.0242 Blowout (underground flow) 0.00000 0.0 % 0.00 0.0 % 0.0 % 0.0 % 100.0 % 0 % 16,900 0.000 0.000 0.000 0.0000 0.0000 0.0000 0.0000 0.0000 Diverted well release 0.00000 0.0 % 0.00 0.0 % 0.0 % 0.0 % 100.0 % 0 % 16,900 0.000 0.000 0.000 0.0000 0.0000 0.0000 0.0000 0.0000 Well release 0.000127 4.3 % 0.02 0.0 % 2.1 % 2.1 % 95.7 % 0 % 16,900 2.154 0.093 0.046 0.0000 0.0458 0.0458 2.0625 0.0000
SuM 0.000207 SuM 3.50 0.292 0.345 0.100 0.096 0.121 3.184 0.024 Material damages (Table 14.4) Material damages
Operation Main category
LOWC frequency per well year in service (Table 17.3)
(US, UK & Norwegian frequencies)
Ignition probability per LOWC (Table
14.3)
Fatalities per LOWC
(Table 14.1)
Total Loss
Severe Damage Small /no Large spill probability
per LOWC (Section 17.1.4)
US GoM OCS activity level five year period (Table 17.13), no.
of completed wells
No. of LOWCs to
expect
No. of ignited events to
expect
No. of fatalities to expect
Total Loss
Severe Damage Small /no Large spill probability
Completion
Blowout surface flow 0.000194 14.8 % 0.22 7.4 % 3.7 % 5.6 % 83.3 % 4.50 % 440 0.085 0.013 0.019 0.0063 0.0032 0.0047 0.0711 0.0038 Blowout (underground flow) 0.000000 0.0 % 0.00 0.0 % 0.0 % 0.0 % 100.0 % 0 % 440 0.000 0.000 0.000 0.0000 0.0000 0.0000 0.0000 0.0000 Diverted well release 0.000097 0.0 % 0.00 0.0 % 0.0 % 0.0 % 100.0 % 0 % 440 0.043 0.000 0.000 0.0000 0.0000 0.0000 0.0427 0.0000 Well release 0.000485 4.3 % 0.02 0.0 % 2.1 % 2.1 % 95.7 % 0 % 440 0.213 0.009 0.005 0.0000 0.0045 0.0045 0.2043 0.0000
SuM 0.000776 SuM 0.34 0.022 0.024 0.006 0.008 0.009 0.318 0.004 Material damages (Table 14.4) Material damages
Operation Main category
LOWC frequency per well year in service (Table 17.5)
(US, UK & Norwegian frequencies)
Ignition probability per
LOWC (Table 14.3)
Fatalities per LOWC
(Table 14.1)
Total Loss
Severe Damage Small /no Large spill probability
per LOWC (Section 17.1.4)
US GoM OCS activity level five year period (Table 17.13), no.
of well years in service
No. of LOWCs to
expect
No. of ignited events to
expect
No. of fatalities to expect
Total Loss
Severe Damage Small /no Large spill probability
Production
Blowout surface flow 0.000064 14.8 % 0.22 7.4 % 3.7 % 5.6 % 83.3 % 3.00 % 16,900 1.077 0.159 0.239 0.0798 0.0399 0.0598 0.8976 0.0323 Blowout (underground flow) 0.00000 0.0 % 0.00 0.0 % 0.0 % 0.0 % 100.0 % 0 % 16,900 0.000 0.000 0.000 0.0000 0.0000 0.0000 0.0000 0.0000 Diverted well release 0.00000 0.0 % 0.00 0.0 % 0.0 % 0.0 % 100.0 % 0 % 16,900 0.000 0.000 0.000 0.0000 0.0000 0.0000 0.0000 0.0000 Well release 0.000056 4.3 % 0.02 0.0 % 2.1 % 2.1 % 95.7 % 0 % 16,900 0.942 0.041 0.020 0.0000 0.0201 0.0201 0.9023 0.0000 SuM 0.000119 SuM 2.02 0.200 0.259 0.080 0.060 0.080 1.800 0.032 Material damages (Table 14.4) Material damages
Operation Main category
LOWC frequency per well year in service (Table 17.6)
(US, UK & Norwegian frequencies)
Ignition probability per
LOWC (Table 14.3)
Fatalities per LOWC
(Table 14.1)
Total Loss
Severe Damage Small /no Large spill probability
per LOWC (Section 17.1.4)
US GoM OCS activity level five year period (Table 17.13), no.
of well years in service
No. of LOWCs to
expect
No. of ignited events to
expect
No. of fatalities to expect
Total Loss
Severe Damage Small /no Large spill probability
Wireline
Blowout surface flow 0.000008 14.8 % 0.22 7.4 % 3.7 % 5.6 % 83.3 % 1.80 % 16,900 0.135 0.020 0.030 0.0100 0.0050 0.0075 0.1122 0.0024 Blowout (underground flow) 0.00000 0.0 % 0.00 0.0 % 0.0 % 0.0 % 100.0 % 0 % 16,900 0.000 0.000 0.000 0.0000 0.0000 0.0000 0.0000 0.0000 Diverted well release 0.00000 0.0 % 0.00 0.0 % 0.0 % 0.0 % 100.0 % 0 % 16,900 0.000 0.000 0.000 0.0000 0.0000 0.0000 0.0000 0.0000 Well release 0.000048 4.3 % 0.02 0.0 % 2.1 % 2.1 % 95.7 % 0 % 16,900 0.808 0.035 0.017 0.0000 0.0172 0.0172 0.7734 0.0000 SuM 0.000056 SUM 0.94 0.055 0.047 0.010 0.022 0.025 0.886 0.002
Material damages
US GoM OCS five year period risk
No of
LOWCs to expect
No. of ignited events to
expect
No. of fatalities to expect
Total Loss
Severe Damage Small /no Large spill probability
Total all 9,57 0,813 1,023 0,308 0,252 0,329 8,676 0,124

RISK MODEL VERIFICATION. Frequencies based on US GoM OCS 2000–2015. Consequences mainly based on US GoM OCS and regulated areas 2000–2015. US GoM activities 2000–2015
Offshore activity INPUT DATA Risk results Type of drilling
Deep or shallow zone
Main category
LOWC frequency per well drilled (Table 17.10) (US GOM OCS frequencies)
Ignition probability per LOWC (Table
14.3)
Fatalities per LOWC
(Table 14.1)
Material damages (Table 14.4) Large spill probability per LOWC (Section
17.1.4)
US GoM OCS activity level 2000-2015 (Table 17.16), no.
of exploration wells
No. of LOWCs to
expect
No. of ignited events to
expect
No. of fatalities to expect
Material damages Large spill probability
Total Loss
Severe Damage Small /no Total Loss
Severe Damage Small /no
Exploration drilling from bottom fixed installation
Deep
Blowout surface flow 0.00255 14.8 % 0.22 7.4 % 3.7 % 5.6 % 83.3 % 8.10 % 2,350 5.993 0.887 1.332 0.4439 0.2219 0.3329 4.9938 0.4854 Blowout (underground flow) 0.00085 0.0 % 0.00 0.0 % 0.0 % 0.0 % 100.0 % 0 % 2,350 1.998 0 0 0 0 0 1.9975 0 Diverted well release 0 0.0 % 0.00 0.0 % 0.0 % 0.0 % 100.0 % 0 % 2,350 0 0 0 0 0 0 0 0 Well release 0 4.3 % 0.02 0.0 % 2.1 % 2.1 % 95.7 % 0 % 2,350 0 0 0 0 0 0 0 0
Shallow
Blowout surface flow 0.00128 14.8 % 0.22 7.4 % 3.7 % 5.6 % 83.3 % 0 % 2,350 3.008 0.445 0.668 0.2228 0.1114 0.1671 2.5067 0 Blowout (underground flow) 0.00128 0.0 % 0.00 0.0 % 0.0 % 0.0 % 100.0 % 0 % 2,350 3.008 0 0 0 0 0 3.0080 0 Diverted well release 0 0.0 % 0.00 0.0 % 0.0 % 0.0 % 100.0 % 0 % 2,350 0 0 0 0 0 0 0 0 Well release 0.00000 4.3 % 0.02 0.0 % 2.1 % 2.1 % 95.7 % 0 % 2,350 0 0 0 0 0 0 0 0
SuM 0.00596 SuM 14.006 1.332 2.000 0.6667 0.3334 0.5000 12.5059 0.4854
Exploration drilling from floating vessel
Deep
Blowout surface flow 0.00185 14.8 % 0.22 7.4 % 3.7 % 5.6 % 83.3 % 8.10 % 1,622 3.001 0.444 0.667 0.2223 0.1111 0.1667 2.5006 0.2431 Blowout (underground flow) 0 0.0 % 0.00 0.0 % 0.0 % 0.0 % 100.0 % 0 % 1,622 0 0 0 0 0 0 0 0 Diverted well release 0.00062 0.0 % 0.00 0.0 % 0.0 % 0.0 % 100.0 % 0 % 1,622 1.006 0 0 0 0 0 1.0056 0 Well release 0.00123 4.3 % 0.02 0.0 % 2.1 % 2.1 % 95.7 % 0 % 1,622 1.995 0.086 0.042 0 0.0424 0 1.9102 0
Shallow
Blowout surface flow 0.00123 14.8 % 0.22 7.4 % 3.7 % 5.6 % 83.3 % 0 % 1,622 1.995 0.295 0.443 0.1478 0.0739 0.1108 1.6626 0 Blowout (underground flow) 0 0.0 % 0.00 0.0 % 0.0 % 0.0 % 100.0 % 0 % 1,622 0 0 0 0 0 0 0 0 Diverted well release 0.0 % 0.00 0.0 % 0.0 % 0.0 % 100.0 % 0 % 1,622 0.000 0 0 0 0 0 0.0000 0 Well release 0.00123 4.3 % 0.02 0.0 % 2.1 % 2.1 % 95.7 % 0 % 1,622 2 0 0 0 0 0 2 0
SuM 0.00616 SuM 9.992 0.911 1.195 0.3701 0.2699 0.3624 8.9891 0.2431
Operation Deep or shallow zone
Main category LOWC frequency per well
drilled (Table 17.9) (US GOM OCS frequencies)
Ignition probability per LOWC (Table
14.3)
Fatalities per LOWC
(Table 14.1)
Material damages (Table 14.4) Large spill probability per LOWC (Section
17.1.4)
US GoM OCS activity level 2000-2015 (Table 17.16), no.
of development wells
No. of LOWCs to
expect
No. of ignited events to
expect
No. of fatalities to expect
Material damages Large spill probability
Total Loss
Severe Damage Small /no Total Loss
Severe Damage Small /no
Development drilling Floating or bottom fixed installation
Deep
Blowout surface flow 0.00032 14.8 % 0.22 7.4 % 3.7 % 5.6 % 83.3 % 8.10 % 6,288 2.018 0.299 0.448 0.1494 0.0747 0.1121 1.6813 0.1634 Blowout (underground flow) 0.00016 0.0 % 0.00 0.0 % 0.0 % 0.0 % 100.0 % 0 % 6,288 1.009 0 0 0 0 0 1.0088 0 Diverted well release 0.00000 0.0 % 0.00 0.0 % 0.0 % 0.0 % 100.0 % 0 % 6,288 0 0 0 0 0 0 0 0 Well release 0.00016 4.3 % 0.02 0.0 % 2.1 % 2.1 % 95.7 % 0 % 6,288 1.009 0.043 0.021 0 0.0215 0 0.9658 0
Shallow
Blowout surface flow 0.00111 14.8 % 0.22 7.4 % 3.7 % 5.6 % 83.3 % 0 % 6,288 7.005 1.037 1.557 0.5189 0.2595 0.3892 5.8377 0 Blowout (underground flow) 0.0 % 0.00 0.0 % 0.0 % 0.0 % 100.0 % 0 % 6,288 0 0 0 0 0 0 0 0 Diverted well release 0.00079 0.0 % 0.00 0.0 % 0.0 % 0.0 % 100.0 % 0 % 6,288 4.988 0 0 0 0 0 4.9878 0 Well release 4.3 % 0.02 0.0 % 2.1 % 2.1 % 95.7 % 0 % 6,288 0 0 0 0 0 0 0 0
SuM 0,00255 SuM 16,028 1,379 2,027 0,6684 0,3556 0,5227 14,4813 0,1634 Material damages (Table 14.4) Material damages
Operation Main category LOWC frequency per well
year in service (Table 17.4) (US GOM OCS frequencies)
Ignition probability per LOWC (Table
14.3)
Fatalities per LOWC
(Table 14.1)
Total Loss
Severe Damage Small /no Large spill probability
per LOWC (Section 17.1.4)
US GoM OCS activity level 2000-2015 (Table 17.16), no.
of well years in service
No. of LOWCs to
expect
No. of ignited events to
expect
No. of fatalities to expect
Total Loss
Severe Damage Small /no Large spill probability
Workover
Blowout surface flow 0.000116 14.8 % 0.22 7.4 % 3.7 % 5.6 % 83.3 % 1.80 % 77,843 9.000 1.332 2.000 0.6667 0.3333 0.5000 7.5000 0.1620 Blowout (underground flow) 0.00000 0.0 % 0.00 0.0 % 0.0 % 0.0 % 100.0 % 0 % 77,843 0 0 0 0 0 0 0 0 Diverted well release 0.00000 0.0 % 0.00 0.0 % 0.0 % 0.0 % 100.0 % 0 % 77,843 0 0 0 0 0 0 0 0 Well release 0.000154 4.3 % 0.02 0.0 % 2.1 % 2.1 % 95.7 % 0 % 77,843 12.000 0.516 0.255 0 0.2553 0 11.4894 0
SuM 0.000270 SuM 21.000 1.848 2.255 0.6667 0.5887 0.7553 18.9894 0.1620 Material damages (Table 14.4) Material damages
Operation Main category LOWC frequency per well
year in service (Table 17.3) (US GoM OCS frequencies)
Ignition probability per LOWC (Table
14.3)
Fatalities per LOWC
(Table 14.1)
Total Loss
Severe Damage Small /no Large spill probability
per LOWC (Section 17.1.4)
US GoM OCS activity level 2000-2015 (Table 17.16), no.
of completed wells
No. of LOWCs to
expect
No. of ignited events to
expect
No. of fatalities to expect
Total Loss
Severe Damage Small /no Large spill probability
Completion
Blowout surface flow 0.000200 14.8 % 0.22 7.4 % 3.7 % 5.6 % 83.3 % 4.50 % 5,004 1.000 0.148 0.222 0.0741 0.0370 0.0556 0.8333 0.0450 Blowout (underground flow) 0.000000 0.0 % 0.00 0.0 % 0.0 % 0.0 % 100.0 % 0 % 5,004 0 0 0 0 0 0 0 0 Diverted well release 0.000200 0.0 % 0.00 0.0 % 0.0 % 0.0 % 100.0 % 0 % 5,004 1.000 0 0 0 0 0 1.0000 0 Well release 0.000200 4.3 % 0.02 0.0 % 2.1 % 2.1 % 95.7 % 0 % 5,004 1.000 0.043 0.021 0 0.0213 0 0.9574 0
SuM 0.000600 SuM 3.000 0.191 0.243 0.0741 0.0583 0.0768 2.7908 0.0450 Material damages (Table 14.4) Material damages
Operation Main category LOWC frequency per well
year in service (Table 17.5) (US GOM OCS frequencies)
Ignition probability per
LOWC (Table 14.3)
Fatalities per LOWC
(Table 14.1)
Total Loss
Severe Damage Small /no Large spill probability
per LOWC (Section 17.1.4)
US GoM OCS activity level 2000-2015 (Table 17.16), no.
of well years in service
No. of LOWCs to
expect
No. of ignited events to
expect
No. of fatalities to expect
Total Loss
Severe Damage Small /no Large spill probability
Production
Blowout surface flow 0.000103 14.8 % 0.22 7.4 % 3.7 % 5.6 % 83.3 % 3.00 % 77,843 8.000 1.184 1.778 0.5926 0.2963 0.4444 6.6667 0.2400 Blowout (underground flow) 0.000000 0.0 % 0.00 0.0 % 0.0 % 0.0 % 100.0 % 0 % 77,843 0 0 0 0 0 0 0 0 Diverted well release 0.000000 0.0 % 0.00 0.0 % 0.0 % 0.0 % 100.0 % 0 % 77,843 0.000 0 0 0 0 0 0.0000 0 Well release 0.000051 4.3 % 0.02 0.0 % 2.1 % 2.1 % 95.7 % 0 % 77,843 4.000 0.172 0.085 0 0.0851 0 3.8298 0 SuM 0.000154 SuM 12.000 1.356 1.863 0.5926 0.3814 0.5296 10.4965 0.2400 Material damages (Table 14.4) Material damages
Operation Main category LOWC frequency per well
year in service (Table 17.6) (US GOM OCS frequencies)
Ignition probability per
LOWC (Table 14.3)
Fatalities per LOWC
(Table 14.1)
Total Loss
Severe Damage Small /no Large spill probability
per LOWC (Section 17.1.4)
US GoM OCS activity level 2000-2015 (Table 17.16), no.
of well years in service
No. of LOWCs to
expect
No. of ignited events to
expect
No. of fatalities to expect
Total Loss
Severe Damage Small /no Large spill probability
Wireline
Blowout surface flow 0.000000 14.8 % 0.22 7.4 % 3.7 % 5.6 % 83.3 % 1.80 % 77,843 0.000 0.000 0.000 0.0000 0.0000 0.0000 0.0000 0.0000 Blowout (underground flow) 0.000000 0.0 % 0.00 0.0 % 0.0 % 0.0 % 100.0 % 0 % 77,843 0 0 0 0 0 0 0 0 Diverted well release 0.000000 0.0 % 0.00 0.0 % 0.0 % 0.0 % 100.0 % 0 % 77,843 0.000 0 0 0 0 0 0.0000 0 Well release 0.000039 4.3 % 0.02 0.0 % 2.1 % 2.1 % 95.7 % 0 % 77,843 3.000 0.129 0.064 0 0.0638 0 2.8723 0 SuM 0.000039 SuM 3.000 0.129 0.064 0.0000 0.0638 0.0638 2.8723 0.0000
Material damages
US GoM OCS five year period risk
No of
LOWCs to expect
No. of ignited events to
expect
No. of fatalities to expect
Total Loss
Severe Damage Small /no Large spill probability
Total all 79.03 7.15 9.65 3.04 2.05 2.81 71.13 1.34
