looking towards a brighter tomorrowanalyticalreports.org/pdf/unfpa_pess_vol_3.pdf · pess leaves...
TRANSCRIPT

Educational Characteristics of the
Somali People
Volume 3
Looking towards a Brighter Tomorrow
Photocopies of all or part of this publication may be made, provided the source is acknowledged.
This report should be cited as: UNFPA (2016). Educational Characteristics of the Somali People
The report can be downloaded directly from http://somalia.unfpa.org/publications/Technical enquiries on the reports can be directed to: [email protected]
United Nations Population Fund Somalia,Block P, Level 2, UN Complex,UN Avenue, Gigiri.P.O. Box 28832 – 00200,Nairobi, Kenya.Tel: (+254) (0) 207 625 742 www.unfpa.org
MAPS AND DESIGNATIONSThe designations used for the maps in this report are the 1986 pre-war geographic regions and boundaries of Somalia. These do not imply any expression of opinion whatsoever on the part of UNFPA concerning the legal status of any administration and its authorities. It is important to note that regions and districts have changed and the newly established regions may have no link to the pre-war regional and district boundaries used in this analysis.
Copyright ©2016 UNFPA Somalia Country Office
Photo creditsCover page: ©UNFPA Somalia, Photo 1: ©AU/UN IST Photo/David Mutua, Introduction: ©Keisha Rukikaire/IRIN, Chapter Two: ©UNFPA Somalia, Chapter Three: ©UN, Chapter Four: ©UN Somalia/F. Juez, Chapter Five: ©UNFPA Somalia, Chapter Six: ©UN/Elfi Klabunde, Conclusion: ©UNFPA Somalia.
Design and layout by: UNON Publishing Services
The Federal Government of Somalia covers South-West, Juba-land, Galmudug and Puntland; Somaliland declared its unilateral independence in May 1991 and is yet to be recognised internationally.

VOLUME 3 : EDUCATIONAL CHARACTERISTICS OF THE PEOPLE OF SOMALIA
Educational Characteristics of the Somali people
Volume 3

2016
This report is part of a series of six analytical reports. Drawn from the Population Estimation Survey 2014, the reports present demographic and socio-economic information on the Somali people.
W. Edwards Deming
Without data, you’re just another person with an opinion.
Volume 3 offers information on educational characteristics of the population.
Volume 1 of the reports presents the methodological
approach used for the PESS.
Volume 2 presents the population composition and key
demographic characteristics.
Volume 4 provides information on employment.
Volume 5 offers information on the
housing characteristics and patterns
of ownership of household assets.
Volume 6 provides information on the dynamics of mobility of the Somali population.

ANALYTICAL REPORT TECHNICALLY SUPPORTED BY UNFPA (P&D UNIT)II

VOLUME 3 : EDUCATIONAL CHARACTERISTICS OF THE PEOPLE OF SOMALIA
III III
FOREWORD
On behalf of the UN Country Team, it is my pleasure to present this volume, which is part of a series of analytical reports based on 2014 Population Estimation Survey (PESS) data. These reports are expected to change the rhetoric on the absence of information about the lives of
Somalis. The PESS is the first large-scale household sample survey to be conducted to estimate the Somali population in more than three decades. Along with reliable population estimates, this series of analytical reports provides a comprehensive picture of Somalis and the lives they lead. It tells their story: how and where they live; how old their family members are; how many are men, women or children; how many have access to education; how many are employed; what kind of assets they own; their mobility patterns– among other crucial social and economic indicators. The United Nations Population Fund (UNFPA) took on this task jointly with the Somali authorities, and with the support from the United Kingdom (UK) Department for International Development (DfID) and the Swedish Government through its Embassy in Nairobi.
The aims of the series of the analytical reports are to provide a sound foundation of information for policymakers and political, economic and social actors to craft articulate strategies and to avail much-needed benchmark population data. The findings provide valuable insights into the challenges faced by the Somalis on the road to build a stable and peaceful future. For example, due to the high fertility, the proportion of children is very high, while that of the working age population (15-64 years) is relatively small. This creates a ‘burden’ for the working age population to cater for the needs of the young and the older persons. Somalis’ age dependency ratio (which measures this ‘demographic burden’) is higher than in most of the neighbouring countries. In addition, nearly half of the working age population is economically inactive which means that the economic dependency burden on the labour force (i.e. the employed and unemployed) is nearly doubled. Just under a quarter of the labour force is unemployed. The Somali unemployment rates are close to those of Ethiopia and Sudan.
In addition to the wealth of information that the analytical reports provide, the two years of meticulous planning, implementation of the survey, and analysis of information have left a great legacy for future generations, including a strengthened Somali statistical system and on increased capacity to conduct similar large-scale surveys. This is also a stepping stone towards a potential population and housing census in the future.
A mammoth task of this kind can only be the result of hard work, commitment and dedication of several individuals and institutions. They range from Somali authorities, who guided the undertakings, Somalis who allowed us to take a glimpse of their lives, enumerators walking from door to door at times under trying circumstances to collect information, to donor agencies providing support at every stage, among other partners.
I remain hopeful that Somalis and development and humanitarian agencies working to support them will be able to use this information to draw up effective plans and programmes that aim to improve the stories and lives of Somalis.
Peter de Clercq (signed) Deputy Special Representative of the UN Secretary-General,
UN Resident and Humanitarian Coordinator for Somalia,UNDP Somalia Resident Representative

ANALYTICAL REPORT TECHNICALLY SUPPORTED BY UNFPA (P&D UNIT)Iv
PREFACE
The United Nations Population Fund has the honour of unveiling a milestone for the Somali people: a series of analytical reports based on the data of the 2014 Population Estimation Survey .
It has been a privilege for UNFPA to work closely with and be guided by the Somali authorities and experts in the preparation of these reports. I would like to commend the hard work that went into their production. The analysis helped to uncover and present crucial information on the Somali population. This would not have been possible without the cooperation of the numerous Somali officials and experts who supported the process and shared information with us, and those who braved through various circumstances to collect and record information.
The publication of these reports would not have been possible without the generous contribution from the UK Department for International Development (DfID). DfID helped to turn a Somali dream into reality, through capacity building for the Somali experts involved in the writing of the reports, and promoting the widest possible use of the PESS data. I would also like to thank the Swedish Embassy for their invaluable support through all stages of the PESS project.
We now have much-awaited information about the lives and needs of the Somali people, such as how many women, youth and children there are; where they live; who the most vulnerable members of the society are; what kind of educational levels they have had access to; what household assets they own; how many are seeking employment; and how many are moving across national and international borders, among other indicators. This information serves as a reference for development and a benchmark to measure the progress made.
I would urge Somali authorities, and their national and international partners, including institutions of higher learning to use the PESS data and the information these analytical reports present. Every number tells a story about a Somali household, and the life it leads.
From the numbers presented, it is evident that the country is demographically very young, with three-quarters of the population under 30 years of age. Only two out of ten children of primary schoolgoing age are currently enrolled in school. Two out of ten households are headed by women, with a further two in a thousand households headed by children. One in ten under-eighteens has been married at least once in their lives. Two in ten households have no access to a human waste disposal facility. For every one thousand Somalis living in the country, twenty-one are living outside the country.
So far, numerous attempts have been made to make progress in the humanitarian conditions and overall development of the Somali people. However, we have lacked information that would help steer us in the right direction.
This series of reports brings new, credible promises for the Somali people. Using the information offered, government officials will be able to better address inequalities − between men and women, the wealthy and the underprivileged or vulnerable members of the society. Somali authorities will now be able to design and implement articulate, targeted and inclusive pro-poor policies and programmes. It will also enable development and humanitarian actors to plan, implement, and monitor activities in an effort to direct aid to areas with the greatest need. We have a window of opportunity, and collective responsibility, to improve the lives and realities of individuals, families and communities.

VOLUME 3 : EDUCATIONAL CHARACTERISTICS OF THE PEOPLE OF SOMALIA
v v
In addition to the invaluable data about the Somali people at a critical juncture of their history, PESS leaves another important legacy—a strengthened statistical system and an increased capacity to conduct large-scale surveys and population counts. It is thus a stepping stone towards a future population and housing census, which will help put in practice the “one person-one vote” principle that underlies every stable democracy.
It is my hope that Somali authorities and their partners will acknowledge that behind each number presented in the reports is a human face and story. Let us ensure we listen and do justice to these unheard voices.
Nikolai Botev (signed)UNFPA Representative

ANALYTICAL REPORT TECHNICALLY SUPPORTED BY UNFPA (P&D UNIT)vI
ACKNOWLEDGEMENTS
The efforts towards the successful production of the Analytical Thematic Reports 2016, from planning to data analysis and actualisation of the thematic reports, have been vigorous. This initiative has involved a number of organizations and individuals, both in the UN fraternity and
donor organizations. On behalf of the UN, we would like to express our heartfelt gratitude to those involved.
First and foremost, we would like to acknowledge the Somali authorities for steering the process in such a professional manner and creating consensus at every stage. Particularly, we extend our gratitude to the in-country team, including Ahmed Elmi Muhumad (former Director General, Statistics), Nur Ahmed Weheliye (Post-PESS Coordinator), Hashim Sheikh Abdinoor (Technical Support), Mohamed Abdinur Mohamed (Technical Support) and Hussein Elmi Gure (Technical Support).
Likewise, we would like to single out Leo Thomas, Results Advisor (DfID), and his core team, Hannah Chira and Maimuna Abdalla, for their technical support and consistent guidance. We remain grateful for the generous contribution from UK DfID, which helped turn the dream of the Somalis into reality, in terms of capacity building for Somalis in gathering and analysing information, writing of the analytical thematic reports and ensuring the delivery of the information to the various users. We would also like to acknowledge the valuable inputs and advice from Vincent Kutai, Programme Manager, Water, Sanitation and Hygiene (WASH) and Statistical Support from the Swedish Embassy, particularly through the input of Jean-Pierre Ntezimana and the team from Statistics Sweden.
It would not have been possible to bring these reports through to completion without the guidance from Nikolai Botev (Representative, UNFPA Somalia), as well as the steady support of Grace Kyeyune (Deputy Country Representative, UNFPA Somalia). Special efforts made by the Population and Development (P&D) Manager, Mariam Alwi, for her devotion and patience in steering this work, are highly appreciated.
The technical team involved did a commendable job in their professional capacities, and their passion, commitment and dedication has been much appreciated. Team members include: Felix Mulama (Consultant Technical Lead), Richard Ng’etich (Technical Lead), Sammy Oyombe (Statistician), Zena Lyaga (Consultant Demographer), Susan Maina (Consultant Demographer), Umikaltuma Mohamed (Geographical Information System (GIS) Consultant), Samwel Andati (Data Management Assistant), John Okongo (Programme Associate) and Jaafar Adon (Programme Assistant). The team also benefitted from the technical contribution of Per Schoning (Norway Statistics).
We also express our deep gratitude to the editorial team: Namita Mediratta (Editorial Consultant), who copy-edited the reports, and ensured that the language is in a readable format for the various users, Osman Hussein Warsame (P&D Consultant) who reviewed the applicability of the information in the context of the country, and Emily Denness (Midwifery Specialist), who provided kind support and time in editing and proofreading the reports. We would like to thank Scadden Orina (Graphic Designer), who created the info graphics and illustrations used both for print and web.
Our gratitude also extends to the UNFPA internal reviewers for providing the first in-depth scrutiny of the reports. They include: Bakhtior Kadirov (Head, Garowe sub-office), Ezekiel Kutto (Monitoring and Evaluation Analyst), Salada Robleh (Head, Mogadishu sub-office), Pilirani Semu-Banda (Communications Specialist), Salad H Dualle (National Programme Specialist), Anas Jabir Babikir (Head, Hargeisa sub-office) and Ahmed Mihile (P&D Specialist).

VOLUME 3 : EDUCATIONAL CHARACTERISTICS OF THE PEOPLE OF SOMALIA
vII vII
We are also privileged and grateful to have benefitted from the extensive knowledge and expertise of the external reviewers: Jeremiah Banda former Chief, Demographic and Social Statistics Branch, United Nations Statistics Division (UNSD) in New York and former PESS Team Leader, UNFPA Somalia, Werner Haug (Former Technical Director, Regional Office for Eastern Europe and Central Asia UNFPA) and Eric Jager (Former PESS Demographer UNFPA Somalia). We also thank the UN family, particularly United Nations Development Programme (UNDP), United Nations Children’s Emergency Fund (UNICEF), World Food Programme (WFP), Food and Agricultural Organization (FAO), United Nations High Commission for Refugees (UNHCR), International Organization for Migration (IOM) and United Nations Human Settlements Programme (UN-Habitat), and the donor community—in particular UK DfID and the Swedish Embassy—for their continued support.
These analytical reports would not have been a success without the contribution of several individuals and institutions, many of whom are acknowledged in the initial PESS 2014 report. We remain greatly indebted to each one of them.
ANALYTICAL REPORT TECHNICALLY SUPPORTED BY UNFPA (P&D UNIT)vIII
EXECUTIVE SUMMARY
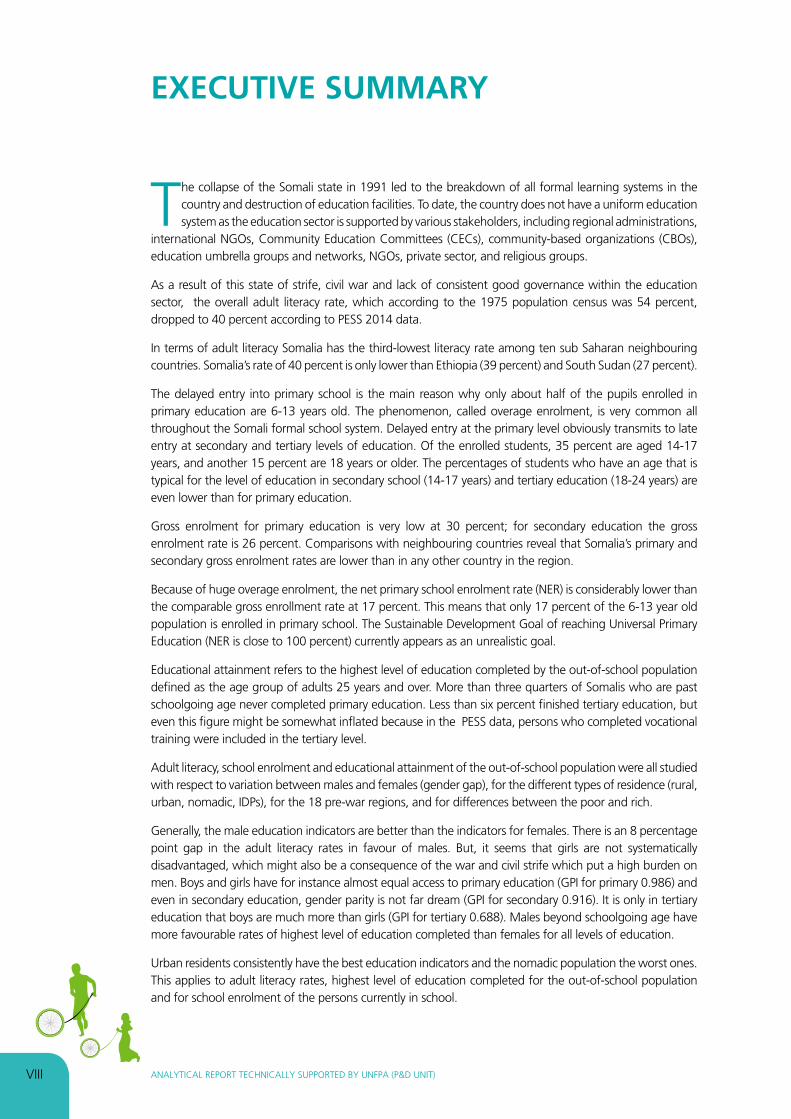
The collapse of the Somali state in 1991 led to the breakdown of all formal learning systems in the country and destruction of education facilities. To date, the country does not have a uniform education system as the education sector is supported by various stakeholders, including regional administrations,
international NGOs, Community Education Committees (CECs), community‐based organizations (CBOs), education umbrella groups and networks, NGOs, private sector, and religious groups.
As a result of this state of strife, civil war and lack of consistent good governance within the education sector, the overall adult literacy rate, which according to the 1975 population census was 54 percent, dropped to 40 percent according to PESS 2014 data.
In terms of adult literacy Somalia has the third-lowest literacy rate among ten sub Saharan neighbouring countries. Somalia’s rate of 40 percent is only lower than Ethiopia (39 percent) and South Sudan (27 percent).
The delayed entry into primary school is the main reason why only about half of the pupils enrolled in primary education are 6-13 years old. The phenomenon, called overage enrolment, is very common all throughout the Somali formal school system. Delayed entry at the primary level obviously transmits to late entry at secondary and tertiary levels of education. Of the enrolled students, 35 percent are aged 14-17 years, and another 15 percent are 18 years or older. The percentages of students who have an age that is typical for the level of education in secondary school (14-17 years) and tertiary education (18-24 years) are even lower than for primary education.
Gross enrolment for primary education is very low at 30 percent; for secondary education the gross enrolment rate is 26 percent. Comparisons with neighbouring countries reveal that Somalia’s primary and secondary gross enrolment rates are lower than in any other country in the region.
Because of huge overage enrolment, the net primary school enrolment rate (NER) is considerably lower than the comparable gross enrollment rate at 17 percent. This means that only 17 percent of the 6-13 year old population is enrolled in primary school. The Sustainable Development Goal of reaching Universal Primary Education (NER is close to 100 percent) currently appears as an unrealistic goal.
Educational attainment refers to the highest level of education completed by the out-of-school population defined as the age group of adults 25 years and over. More than three quarters of Somalis who are past schoolgoing age never completed primary education. Less than six percent finished tertiary education, but even this figure might be somewhat inflated because in the PESS data, persons who completed vocational training were included in the tertiary level.
Adult literacy, school enrolment and educational attainment of the out-of-school population were all studied with respect to variation between males and females (gender gap), for the different types of residence (rural, urban, nomadic, IDPs), for the 18 pre-war regions, and for differences between the poor and rich.
Generally, the male education indicators are better than the indicators for females. There is an 8 percentage point gap in the adult literacy rates in favour of males. But, it seems that girls are not systematically disadvantaged, which might also be a consequence of the war and civil strife which put a high burden on men. Boys and girls have for instance almost equal access to primary education (GPI for primary 0.986) and even in secondary education, gender parity is not far dream (GPI for secondary 0.916). It is only in tertiary education that boys are much more than girls (GPI for tertiary 0.688). Males beyond schoolgoing age have more favourable rates of highest level of education completed than females for all levels of education.
Urban residents consistently have the best education indicators and the nomadic population the worst ones. This applies to adult literacy rates, highest level of education completed for the out-of-school population and for school enrolment of the persons currently in school.

VOLUME 3 : EDUCATIONAL CHARACTERISTICS OF THE PEOPLE OF SOMALIA
Ix Ix
There exist huge differences between the regions on all education indicators. Without having applied advanced statistical techniques like multivariate analysis, it is not possible to assess the role of main determinants in explaining regional variations. However, in studying the patterns, two factors stand out: regions that have had relative peace appear to perform well on almost all education indicators. Another pattern is that the regions with large urban centres contain also the most reputable centres of higher learning in the country (Banadir-Mogadishu; Woqooyi Galbeed-Hargeisa, Awdal-Boorama and Bari-Bosaaso). They tend to do better, especially on indicators pertaining to tertiary education.

ANALYTICAL REPORT TECHNICALLY SUPPORTED BY UNFPA (P&D UNIT)x
CONTENTS1 INTRODUCTION 1
1.1 History of census taking 1
1.2 Rationale for conducting the Population Estimation Survey 1
1.3 Filling the data gap 1
1.4 Education system 2
2 SURVEY METHODOLOGY 4
2.1 Sampling frames 4
2.1.1 Urban sampling frame 4
2.1.2 Rural sampling frame 4
2.1.3 IDPs sampling frame 4
2.1.4 Water points’ frame 4
2.2 Stratification 4
2.2.1 Sample allocation to regions and sub-strata 5
2.3 Calculation of sampling errors 5
2.4 Fieldwork 5
2.5 Estimation 5
3 LITERACY 7
3.1 Adult literacy 7
4 School enrolment 12
4.1 Schoolgoing age population 14
4.2 Current school enrolment at different levels of education 14
4.2.1 Overage enrolment in primary and secondary education 15
4.3 Gross and Net Enrolment Ratios 16
5 Educational attainment 20
6 Gender Parity Index 25
7 CONCLUSION 28
REFERENCES 29
APPENDIX A – Adult literacy 30
APPENDIX B – School Enrolment 31
APPENDIX C – Educational Attainment 36
APPENDIX D – Glossary 37
APPENDIX E – Basemap 38

VOLUME 3 : EDUCATIONAL CHARACTERISTICS OF THE PEOPLE OF SOMALIA
xI xI
FIGURES
Figure 1: Adult literacy by sex 7
Figure 2: Adult literacy by type of residence 8
Figure 3: Adult literacy rate by age group 8
Figure 4: Adult literacy by wealth quintile 9
Figure 5: Adult literacy rates by region 10
Figure 6: School enrolment by sex 12
Figure 7: School enrolment by type of residence 12
Figure 8: School enrolment by age 13
Figure 9: School enrolment by wealth quintile 13
Figure 10: School enrolment by region 13
Figure 11: School enrolment by level 14
Figure 12: School enrolment by level and type of residence 15
Figure 13: Overage enrolment by levels of education 15
Figure 14: Gross and Net Enrolment Ratios by sex and level of education 17
Figure 15: Gross Enrolment Ratios by type of residence 18
Figure 16: Tertiary Gross Enrolment Ratios by wealth quintile 18
Figure 17: Educational attainment by sex for adults aged 25+ 20
Figure 18: Educational attainment by type of residence 21
Figure 19: Educational attainment by level 21
Figure 20: Population with some level of formal education completed (percent) 22
Figure 21: Educational attainment by wealth quintile 23
TABLES
Table 1: Adult literacy rates for selected sub-Saharan countries 9
Table 2: Gross Enrolment Ratio for selected sub-Saharan countries 17
Table 3: Gender Parity Index by selected background characteristics 26
Table A. 1: Adult literacy by selected background
characteristics for age 15+ (percent) 30
Table B. 1: School enrolment for age 6 and above by selected background
characteristics (percent) 31
Table B. 2: School age population by selected background characteristics (number) 32
Table B. 3: Level of school currently enrolled by selected background
characteristics (percent) 33
Table B. 4: Gross Enrolment Ratio (GER) by selected background characteristics 34
Table B. 5: Net Enrolment Ratio (NER) by selected background characteristics 35
Table C. 1: Education attained for persons aged 25+ by selected background
characteristics (percent) 36
ANALYTICAL REPORT TECHNICALLY SUPPORTED BY UNFPA (P&D UNIT)xII
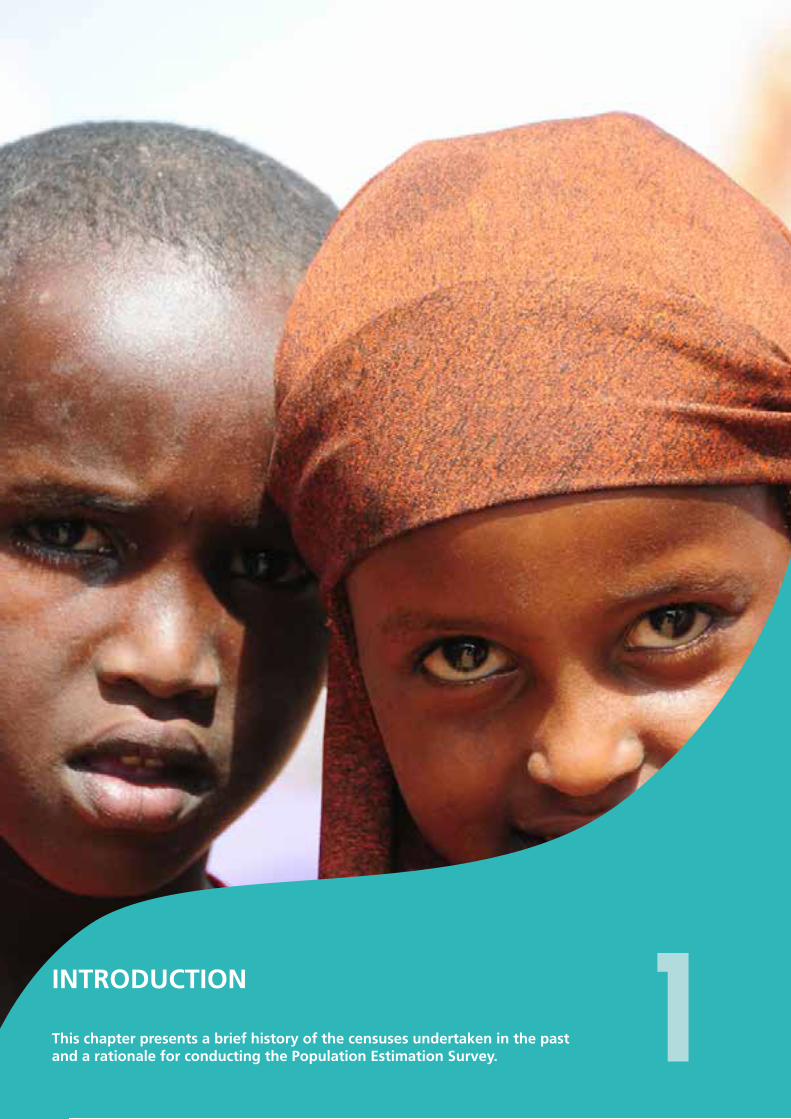
INTRODUCTION
This chapter presents a brief history of the censuses undertaken in the past and a rationale for conducting the Population Estimation Survey.

VOLUME 3 : EDUCATIONAL CHARACTERISTICS OF THE PEOPLE OF SOMALIA
1 1
1 INTRODUCTION
1.1 History of census taking
The first population and housing census for Somalia was conducted in 1975, which published limited results; the findings from a second population census conducted in 1986/87 were not published officially.
In the absence of census figures, efforts have been made over the years to estimate the size, age and sex distribution of the population, in addition to population projections. The most notable attempt was made by K.E. Vaidyanathan in his 1997 consultancy report ‘Population Statistics of Somalia’, and the estimates have been generally accepted as the most reliable population data available. His report provided projected population for 2005 of just over seven million. Development agencies have made several attempts to compile reliable data on the size and distribution of the population and social and economic characteristics. Such efforts however, did not receive sufficient support and recognition.
In 2005, UNDP prepared a report entitled ‘Population Estimates and Projection for Somalia, 2005-2010 (draft)’, which shows the estimated population for each year by sex and region. The estimates were based on a number of sources: information available from the 1975 census; a UNDP report on Population Statistics for Somalia, 1997; estimates made by UNHCR of the number of Somali refugees; and the various settlement surveys conducted by UNDP. These estimates were examined by a group of senior Somali professionals in the pre-war Ministry of National Planning, as well as members of the UN Thematic Group on Statistics. Both groups concurred with the population estimates presented for 2005. Their best estimate was a projection of population of just over 7.5 million in mid-2005. They projected the population based on an annual population growth rate of 3.0 percent, estimating a population of 8.4 million in mid-2010. They also estimated the distribution of the population by sex and region. These estimates were intended purely for planning purposes, as they were not based on the results of a full census. Currently, the official population estimates in use are derived from the ‘Population Estimation Survey, 2014’ supported by UNFPA.
1.2 Rationale for conducting the Population Estimation Survey
For more than three decades, Somalis and their humanitarian and development partners faced immense challenges in designing and implementing programmes because of the lack or paucity of basic demographic data. As earlier stated, not all of the census data was released or published. It is worth noting that the available limited data from the census is now obsolete due to the numerous changes that have taken place in the political, demographic and socio-economic spheres. Development agencies made numerous attempts to produce reliable population figures pertaining to size, distribution and associated socio-economic characteristics. However, such efforts were limited to producing sector specific datasets.
1.3 Filling the data gap
The absence or scarcity of information on the Somali population challenged planning and programming at all levels for years. To address this situation, Somali authorities conducted a Population Estimation Survey in 2013/2014, with support from the donor and international community. The survey was aimed at providing population and socio-economic information to policymakers; and political, economic and social actors to develop evidence-based strategies for planning and decision-making.
The PESS is the first extensive large-scale household sample survey to be carried out among the
ANALYTICAL REPORT TECHNICALLY SUPPORTED BY UNFPA (P&D UNIT)2
Somali population in more than three decades. The survey provided reliable and comprehensive population estimates, demographic, and socio-economic characteristics for Somalis, encompassing the demarcated 1986 pre-war regions and districts.
The Population Estimation Survey was designed to provide accurate and reliable estimates of the size and distribution of the Somali population, and its characteristics, including: population size; spatial distribution; and socio-economic attributes. In addition, the PESS serves as a first milestone towards conducting a full and comprehensive population and housing census in the future.
The main objectives of the Population Estimation Survey were:
• To establish reliable estimates of the population size by age and sex living in urban areas, camps for Internally Displaced Persons, rural areas, and of nomadic communities.
• To empower and develop the capacity and foundation of government institutions and personnel responsible for data collection, analysis and dissemination.
• To provide estimates of the number of households, their geographic distribution and structure, along with related demographic and socio-economic data for the population.
• To provide sampling frames for surveys and a potential future population census.
• To provide baseline data for socio-economic planning, policy development, facilitating the evaluation of effectiveness, outcomes and impact of development interventions.
1.4 Education system
The collapse of the Somali state in 1991 led to the breakdown of all formal learning systems in the country and destruction of education facilities. To date, there is no uniform education system as the education sector is largely managed and supported by stakeholders, including regional administrations, international NGOs, Community Education Committees (CECs), community-based organizations (CBOs), education umbrella groups and networks, NGOs, private sector, and religious groups. These stakeholders are responsible for the financing of salaries and infrastructural development in the education sector. Alternative education, or the Accelerated Basic Education (ABE) education model run by International Non-Governmental Organizations (NGOs), is a programme for children aged 8-14 years who, because of displacement, had missed the opportunity to join a formal primary school (UNICEF, 2013). There has been a significant drop in enrolment in ABEs; a significant number of school-aged children are enrolled in this system (Ministry of Education Puntland, 2012). There are other education systems borrowed from neighbouring countries including Kenya, Djibouti and Yemen among others. Almost all children in the country attend Koranic schools.
The ‘pastoral nomads’ form a substantial proportion of the entire population. In the late 1970s and early 1980s, the Somali government introduced an innovative three-year education programme for nomadic and pastoralist children. Depending on the season, parents were encouraged to allow their children to attend schools. The Somali community in general has more access to Koranic education compared to the formal education systems, as the Koranic teachers move with the nomads.
Findings presented in this report are based on the analysis of the data on enrolment in formal learning institutions.

VOLUME 3 : EDUCATIONAL CHARACTERISTICS OF THE PEOPLE OF SOMALIA
3 3
SURVEY METHODOLOGYThe methodology for the Population Estimation Survey was developed
through an all-inclusive and consultative process, led by Somali experts, supported by the UNFPA Technical Unit. This section provides the PESS
methodology and application
ANALYTICAL REPORT TECHNICALLY SUPPORTED BY UNFPA (P&D UNIT)4
2 SURVEY METHODOLOGY
2.1 Sampling frames
A sampling frame is a set of source materials about a target population from which a sample is selected. The sampling frames for PESS comprised defined clusters of enumeration areas for the urban areas, settlements for rural areas, camps for IDPs and water points for nomadic areas. These were the area Primary Sampling Units.
2.1.1 Urban sampling frame
The sampling frame for urban areas were Enumeration Areas with households ranging between 50 and 149. The survey used validated maps and satellite images to identify administrative boundaries. In order to enhance the quality of the urban frame, satellite images were validated in the field. The urban frame had 6,750 PSUs, out of which 868 were selected.
2.1.2 Rural sampling frame
Settlements with 50 to 149 households in rural settings formed the PSUs for the rural sample. Larger settlements were split into segments of approximately 50-149 households. The rural frame consisted of 6,519 PSUs out of which 1,104 were selected.
2.1.3 IDPs sampling frame
The sampling frame for IDPs consisted of settlements or camps. UNHCR provided information on the number of households in camps. The frame included 107 IDP camps of which a sample of 28 was selected.
2.1.4 Water points’ frame
The frame for water points was obtained from the 2005/2006 UNDP Community Census and was updated using the list of water points prepared by the UN Food and Agriculture Organization/Somalia Water and Land Information Management (FAO/SWALIM). The frame comprised of 5,332 water points, from which a 14 percent (735) sample was drawn.
2.2 Stratification
Stratification is a method of sampling that involves the classification of a population into homogenous groups. Stratification, if well constituted, facilitates the production of reliable estimates of different groups/strata.
Sample selection: The overall samples selected in the 18 regions were proportionate to the size of the strata (number of enumeration areas) vis-a-vis the total observations listed in the frame. For the urban enumeration areas, and rural settlements, the selection within the strata was based on probability proportional to size (PPS) taking into account the measures of size. The selection of water points was based on Simple Random Sampling (SRS).
The 1986 pre-war geographic regions have been used for the analyses of data in this series. It is important to note that currently there is a Federal government, comprising of Puntland, South West, Juba-land and Galmudug states. The Federal Government is in the process of forming new states for Hiraan and Middle Shabelle regions. Somaliland declared its unilateral independence in May 1991 and is yet to be recognized by the international community. As a result of these developments, regions and districts have changed. It is important to note that the newly established regions have no link to the pre-war regional and district boundaries used in this analysis.

VOLUME 3 : EDUCATIONAL CHARACTERISTICS OF THE PEOPLE OF SOMALIA
5 5
2.2.1 Sample allocation to regions and sub-strata
The sample was initially fixed at 2,535 PSUs. The total number of PSUs in the sample frames was 18,708. However, sample sizes were re-adjusted to boost representation for regions that had few PSUs in the initial allocation. Consequently, the overall sample size was 2,735 PSUs or 14 percent.
2.3 Calculation of sampling errors
Sampling errors for the selected key variables were calculated using WesVar software. WesVar uses the replication method of ‘Jack-knife technique’. Standard errors, confidence interval and coefficient of variations were produced (for a more detailed description, see Volume 1).
2.4 Fieldwork
The survey was conducted for the sedentary population (urban, rural and IDPs) between November and December 2013. The nomadic population was enumerated during the dry season in February and March 2014.
2.5 Estimation
The sample results were extrapolated to achieve the estimates for the total population by multiplying the sample values by their respective weights (the inverse of the probability of selection).

ANALYTICAL REPORT TECHNICALLY SUPPORTED BY UNFPA (P&D UNIT)6
LITERACY
This chapter describes the literacy rates of the Somali population.

VOLUME 3 : EDUCATIONAL CHARACTERISTICS OF THE PEOPLE OF SOMALIA
7 7
3 LITERACY
3.1 Adult literacy
Literacy is a set of tangible skills, particularly the cognitive skills of reading and writing, that are independent of the context in which they are acquired and the background of the person who acquires them. Literacy distinguishes those who have the ability to read and write as ‘literate,’ and those who do not have the ability to read and write as ‘illiterate’. UNESCO defines literacy as the ability to identify, understand, interpret, create, communicate, compute and use printed and written materials associated with varying contexts. Literacy is one of the intended outcomes of schooling, as well as a measure of a person’s ability to function in society and to continue to learn (UNESCO Institute for Statistics, 2013).
Literacy is a basic, fundamental human right. Without good literacy skills, individuals have less opportunities for success (UNESCO, 2006). Literacy serves as a stepping stone, offering people the confidence to improve their lives. Research shows that people equipped with good literacy skills are more likely to have higher self-esteem, better health and employment opportunities, and earn higher wages than those with poor literacy skills. They can pursue better jobs, and have a voice and place in modern society. They are better equipped to take advantage of the opportunities that life may present to them. Illiterate adults, particularly women, struggle to find a voice in their communities, paving the way for gender discrimination. Without some levels of education and critical thinking, people are highly susceptible to deception and manipulation to things like working in odd jobs with low pay and child labour (Flynt, 2014).
Literacy is usually measured in terms of adult and youth literacy rates. Adult literacy is defined as the percentage of the population aged 15 years and over who are both able to read and write, with an understanding of a short simple statement on their everyday lives. The youth literacy rate is defined as the percentage of the youth population aged 15-24 who are both able to read and write with an understanding of a simple statement (UNESCO Institute for Statistics, 2013).
To estimate the population’s literacy rates, household respondents were asked whether each of the household members aged ten years and above was able to read and write. The question was meant to check the ability of a person to read and write a text in any one language. The analysis, however, presents literacy rates for persons aged 15 and above.
The adult literacy rate for Somalia stands at 40 percent. Figure 1 shows the literacy status for persons aged 15 and above by sex. The 1975 census reported a literacy rate of 54.8 percent for both sexes. This plunge in literacy levels can be attributed to the effects of conflict on the education system.
Perc
ent
Perc
ent
Perc
ent
43.8
36.240.0
Male Female Total
27.5
52.2
Rural Urban IDP Camps Nomadic
12.1
32.8
64.2
44.3
34.231.6 29.5
22.8
16.5 14.5
15-19 20-29 30-39 40-49 50-59 60-69 70-79 80+
Figure 1: Adult literacy by sex
The adult literacy rate for Somalia stands at 40 percent.

ANALYTICAL REPORT TECHNICALLY SUPPORTED BY UNFPA (P&D UNIT)8
The gender gap is 7.4 percentage points. Similar to the general pattern observed in other developing countries, this may be due to the parents’ preference of sending the boy child to school while the girl child remains at home to support the mother or family in household chores. Low literacy reduces the ability of females to participate in formal employment thus increasing their vulnerability.
Findings presented in Figure 2 indicate that Somalis residing in urban areas are more literate (64.2 percent) than those in rural areas (27.5 percent) and other types of residence. The nomadic population have the lowest literacy rates, at 12.1 percent, which could be attributed to limited access to education due to their lifestyle.
Figure 2: Adult literacy by type of residence
Perc
ent
Perc
ent
Perc
ent
43.8
36.240.0
Male Female Total
27.5
52.2
Rural Urban IDP Camps Nomadic
12.1
32.8
64.2
44.3
34.231.6 29.5
22.8
16.5 14.5
15-19 20-29 30-39 40-49 50-59 60-69 70-79 80+
Figure 3: Adult literacy rate by age group
Perc
ent
Perc
ent
Perc
ent
43.8
36.240.0
Male Female Total
27.5
52.2
Rural Urban IDP Camps Nomadic
12.1
32.8
64.2
44.3
34.231.6 29.5
22.8
16.5 14.5
15-19 20-29 30-39 40-49 50-59 60-69 70-79 80+
Figure 3 shows that Somalis’ adult literacy rates decreases with increase in age and the age gap is very substantial. The adult literacy rates among the youngest (15-19) age group (52.2 percent) are almost three times higher than the rates for the age group 80 years and above (14.5 percent). Given this steep drop in adult literacy rates with age, it is likely that literacy rates will increase in the future.
Somalis’ adult literacy rates decreases with increase in age.
The adult literacy rates among the youngest 15-19 age group (52.2 percent) are almost three times higher than the rates for the age group 80 years and above (14.5 percent).

VOLUME 3 : EDUCATIONAL CHARACTERISTICS OF THE PEOPLE OF SOMALIA
9 9
The literacy rates vary between 32.5 percent and 65.3 percent from the poorest to the richest quintiles (see Figure 4). Therefore, literacy appears to be linked to wealth.
On comparing the most recent data for selected sub-Saharan countries (Table 1), it can be seen that Somalis have the third-lowest literacy rate (40 percent), higher than only South Sudan (27 percent) and Ethiopia (39 percent). The South Sudanese also have a larger gender gap in literacy than the Somalis.
Figure 4: Adult literacy by wealth quintile
Adult literacy rate
Country Year Male Female Total
Djibouti 2009 78.0 58.4 67.9
Eritrea 2011 79.5 59 68.9
Ethiopia 2007 49.1 28.9 39.0
Kenya 2010 90.6 84.2 87.4
Rwanda 2010 74.8 67.5 71.1
Somalia* 2014 43.8 36.2 40.0
South Sudan 2009 40.0 16.0 27.0
Sudan 2011 80.7 63.2 71.9
Tanzania 2010 75.5 60.8 67.8
Uganda 2010 82.6 64.6 73.2
Source: http://www.indexmundi.com/
*PESS 2014
Table 1: Adult literacy rates for selected sub-Saharan countries
There are regional differentials in literacy rates, which are possibly due to variations in access to educational facilities across regions. Generally, regions that experienced relative security in the recent past prior to the survey have higher literacy rates (see Figure 5).
There are regional
differentials in literacy rates,
which are possibly due to variations in access to educational
facilities across regions.
Literacy appears to be linked to
wealth.

ANALYTICAL REPORT TECHNICALLY SUPPORTED BY UNFPA (P&D UNIT)10
Figure 5: Adult literacy rates by region
ADULT LITERACY
´0 200 400100
KilometresSource: PESS 2014The boundaries on this map are the pre-war regions of Somalia and do not imply any official endorsement or acceptance by the United Nations Population Fund.
LegendAdult Literacyin percent
11 - 2425 - 3738 - 5152 - 64

VOLUME 3 : EDUCATIONAL CHARACTERISTICS OF THE PEOPLE OF SOMALIA
11 11
SCHOOL ENROLMENT
This chapter highlights the enrolment of the population for various levels of education.

ANALYTICAL REPORT TECHNICALLY SUPPORTED BY UNFPA (P&D UNIT)12
Figure 6: School enrolment by sex
38.1
35.0
36.6
Rural Urban IDP Camps Nomadic
Figure 7: School enrolment by type of residence
38.1
35.0
36.6
Rural Urban IDP Camps Nomadic
4 School enrolment
Information on enrolment was obtained on all household members aged six and above who were acquiring any level of education at the time the survey was conducted. The analysis includes enrolment in recognised levels of formal education.
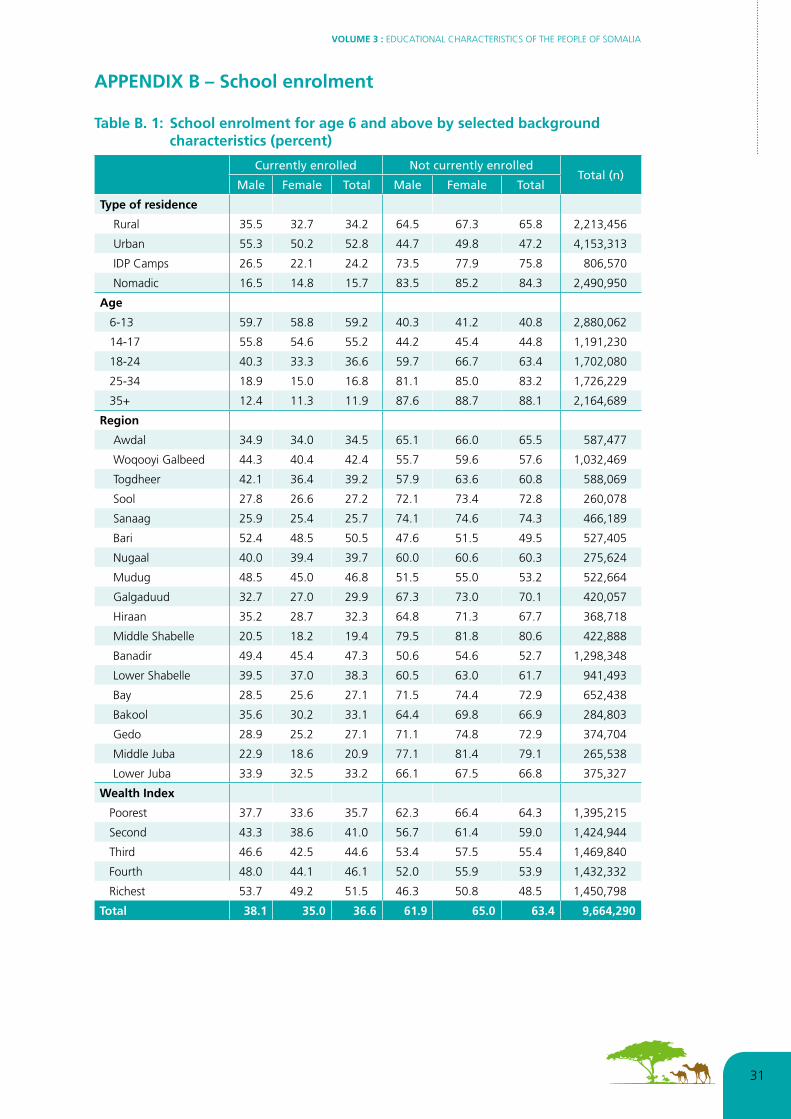
Over a third (36.6 percent) of the population aged six years and above are currently enrolled in school (see Figure 6). Access to education is skewed slightly in favour of male children, with enrolment rates of 38.1 percent for males and 35.0 percent for females.
Enrolment for urban populations is almost double that of rural and triple that of nomadic populations (see Figure 7), possibly because of accessibility of schools in urban areas. The mobile nature of the nomadic population makes it difficult for them to participate continuously in schooling, with the analysis showing 15.7 percent enrolment.
There is a minimal difference of 4.0 percent in enrolment of the age groups 6-13 and 14-17 years. Figure 8 presents the distribution of the population currently enrolled by age. A significant proportion of the population aged 25 and above (16.8 percent for ages 25-34, and 11.9 percent for age 35 and above) is currently enrolled in education.
Over a third (36.6 percent) of the population aged six years and above are currently enrolled in school.

VOLUME 3 : EDUCATIONAL CHARACTERISTICS OF THE PEOPLE OF SOMALIA
13 13
Figure 9 shows a positive relationship between wealth status and school enrolment. The majority of educational institutions are privately owned or operated by the private sector, international and local NGOs, most of which charge some fee. This relationship should be explored further to establish whether fees are a barrier to education access.
Figure 8: School enrolment by age
38.1
35.0
36.6
Rural Urban IDP Camps Nomadic
Figure 9: School enrolment by wealth quintile
Tertiary,11.4 percent
Secondary,22.7 percent Primary,
65.8 percent
Figure 10: School enrolment by region
Tertiary,11.4 percent
Secondary,22.7 percent Primary,
65.8 percent
A significant proportion of
the population aged 25
and above is currently enrolled in education.

ANALYTICAL REPORT TECHNICALLY SUPPORTED BY UNFPA (P&D UNIT)14
All regions except Bari have less than 50 percent enrolment in education. Low enrolment rates can be related to the country still being in the reconstruction phase, following the devastating civil war that destroyed infrastructure. Heavy investment in the education sector is the key to increasing enrolment in all levels of education (See Figure 10, previous page).
4.1 Schoolgoing age population
The schoolgoing age population refers to the number of children who should be in school (UNESCO Institute for Statistics 2005). It is important to determine this age group for sound educational planning and resource allocation. The lack of this information leads to inappropriate resource allocation and depriving children of a basic need—education.
Education levels in this report are classified as primary, secondary and tertiary. Tertiary level includes university, college and vocational/technical training. The inclusion of vocational training in the analysis tends to inflate the enrolment ratio and attainment for tertiary (university and college) level. It should be noted that persons who attend vocational training mainly are primary incomplete or primary complete.
According to the survey, 26 percent of the population (3,163,540) is of primary schoolgoing age (6-13 years). The secondary schoolgoing age (14-17 years) population forms 10.0 percent of the population (1,239,602). The majority of this population resides in urban areas: 40.4 percent of the primary schoolgoing age, and 44.4 percent of secondary schoolgoing age.
Banadir has the highest population of children of both primary and secondary schoolgoing ages (primary school age: 464,303, secondary school age: 167,825 children). Detailed statistics are presented in Appendix B, Table B.2.
4.2 Current school enrolment at different levels of education
Data on the level of enrolment at different levels of education is useful, including for assessing the educational levels of the future labour force.
Among the total number of pupils/students in schools, almost two-thirds (65.8 percent) are in primary school; 22.7 percent are in secondary school, and 11.4 percent are attending tertiary educational institutions (see Figure 11).
Figure 11: School enrolment by level
Tertiary,11.4 percent
Secondary,22.7 percent Primary,
65.8 percent
The drop in the percentages of population transitioning from primary to secondary and from secondary to tertiary is slightly indicative, but not a reliable indicator of the extent to which pupils progress through the school system. Further data would be needed to study the progression within and transition between different levels of education.
According to the survey, 26 percent of the population is of primary schoolgoing age (6-13 years). The secondary schoolgoing age (14-17 years) population forms 10.0 percent of the population.

VOLUME 3 : EDUCATIONAL CHARACTERISTICS OF THE PEOPLE OF SOMALIA
15 15
Figure 12 shows how the total enrolment at all levels of education is distributed among the urban, rural, nomadic and IDP populations that are currently enrolled in school. The composite bar charts clearly illustrate that urban areas have much higher percentages of persons enrolled in secondary and tertiary education compared to all other types of residence. This is particularly the case for the nomadic population, among whom only 9.5 percent of all those currently in school are enrolled in secondary and tertiary education.
Perc
ent
43.8
15.0
6.0
17.0
77.0
.0
50.1
35.9
11.2 2.9 0.2
31.5
64.2
4.0 0.1 1.8
20.3
77.8
6-13 14-17 18-24 25+
13.0
Tertiary
Tertiary
Rural Urban IDP Camps Nomadic
GER
/NER
4.2.1 Overage enrolment in primary and secondary education
One indicator of the success of an education system is the extent to which students start a given level of education at the typical age (age six for primary education, and 14 years for secondary education) and the extent to which they progress smoothly through the school system without having to repeat certain grades, among other obstacles. Ideally, very few students attend levels of education that are not typical for their age. In many developing countries, pupils enter primary education at a higher age than the typical age. For the Somali population, this is likely due to availability, affordability and accessibility, especially for the rural and nomadic communities. The enrolment at an age that is not typical for the level and grade within that level of education will be referred to as ‘overage enrolment’. Figure 13 illustrates the extent to which overage enrolment occurs in the Somali school system.
Figure 13: Overage enrolment by levels of education
Perc
ent
43.8
15.0
6.0
17.0
77.0
.0
50.1
35.9
11.2 2.9 0.2
31.5
64.2
4.0 0.1 1.8
20.3
77.8
6-13 14-17 18-24 25+
13.0
Tertiary
Tertiary
Rural Urban IDP Camps Nomadic
GER
/NER
Figure 12: School enrolment by level and type of residence Urban areas have much
higher percentages of
persons enrolled in secondary and tertiary
education compared to all
other types of residence.

ANALYTICAL REPORT TECHNICALLY SUPPORTED BY UNFPA (P&D UNIT)16
In primary schools, 50.1 percent of pupils are between 6-13 years old, 35.9 percent are of secondary school age, and another 14.0 percent are 18 years or older. Fifty percent of the primary school enrolment is overage.
In secondary schools, 32 percent of the enrolled students are aged 14-17. No students in secondary school are ‘underage’, i.e. of primary school age. More than two-thirds (68 percent) of the enrolled students in secondary school are overage. Among this group, four percent are 25 years or older.
At the tertiary level, 20.2 percent of the enrolled students are within the typical age range of 18-24 years. The majority of the tertiary-level enrolled students (78 percent) are overage, at 25 years or older, but two percent of those enrolled at college/university level are of an age typical for secondary school.
The data for overage enrolment at the tertiary level should be interpreted with caution. It is likely that anyone enrolled in adult education or vocational training programmes may have been classified under tertiary education.
Overall, it is evident that there are significant delays in the Somali education system. Far less than half of the total number of students enrolled in Somali schools are at an age that is typical for their level of education.
Without additional information from school records, it is not possible to reach conclusions on the impact that overage enrolment has on the education system. However, given the relatively low educational and literacy levels in the adult population, enrolment and continuation of education should be encouraged for all age groups. Additional information from school records and first-hand ‘field’ experience will be necessary to find out whether age differences in classrooms influence the quality of education.
4.3 Gross and Net Enrolment Ratios
The Gross Enrolment Ratio (GER) is the total enrolment within the given education level, regardless of age, expressed as a percentage of the eligible official school-age population for that level in a given school year (UNESCO Institute for Statistics, 2009).
The GER is widely used to show the general level of participation in education, but has a disadvantage that the maximum value of the GER is not fixed. The GER can sometimes exceed 100 percent due to the inclusion of overaged and underaged pupils and repeaters. In this case, a rigorous interpretation of GER needs additional information on the extent of repetition, early and late entrants, etc. (UNESCO Institute for Statistics, 2009). A high GER indicates a high degree of participation, regardless of age. A GER that is equal to or more than 100 percent indicates that a country is, in principle, able to accommodate all of its primary school-age population, but does not indicate the proportion of that population is actually enrolled (UNESCO, 2003).
The Net Enrolment Ratio (NER) is defined as the total enrolled persons who have an age that is within the age range typical for the level of education they are enrolled in. The NER is expressed as a percentage of the eligible official school-age population for that level in a given school year corresponding population. The NER reaches its maximum value of 100 when all children of primary school age are enrolled in primary education. Values below 100 alert policymakers on the need for policies that increase primary school enrolment. As a guide, This is because the percentage of children that are not enrolled in primary education (‘out-of- school children’) is estimated by subtracting the NER from 100. Therefore, the NER is used to monitor progress towards the goal of achieving universal primary education, identified in both the Sustainable Development Goals (SDGs) and Education for All initiatives.
The difference between GER and NER is a measure of the extent of overage enrolment at the given level of education.
Fifty percent of the primary school enrolment is overage.
More than two-thirds (68 percent) of the enrolled students in secondary school are overage.
Anyone enrolled in adult education or vocational training programmes may have been classified under tertiary education.
VOLUME 3 : EDUCATIONAL CHARACTERISTICS OF THE PEOPLE OF SOMALIA
17 17
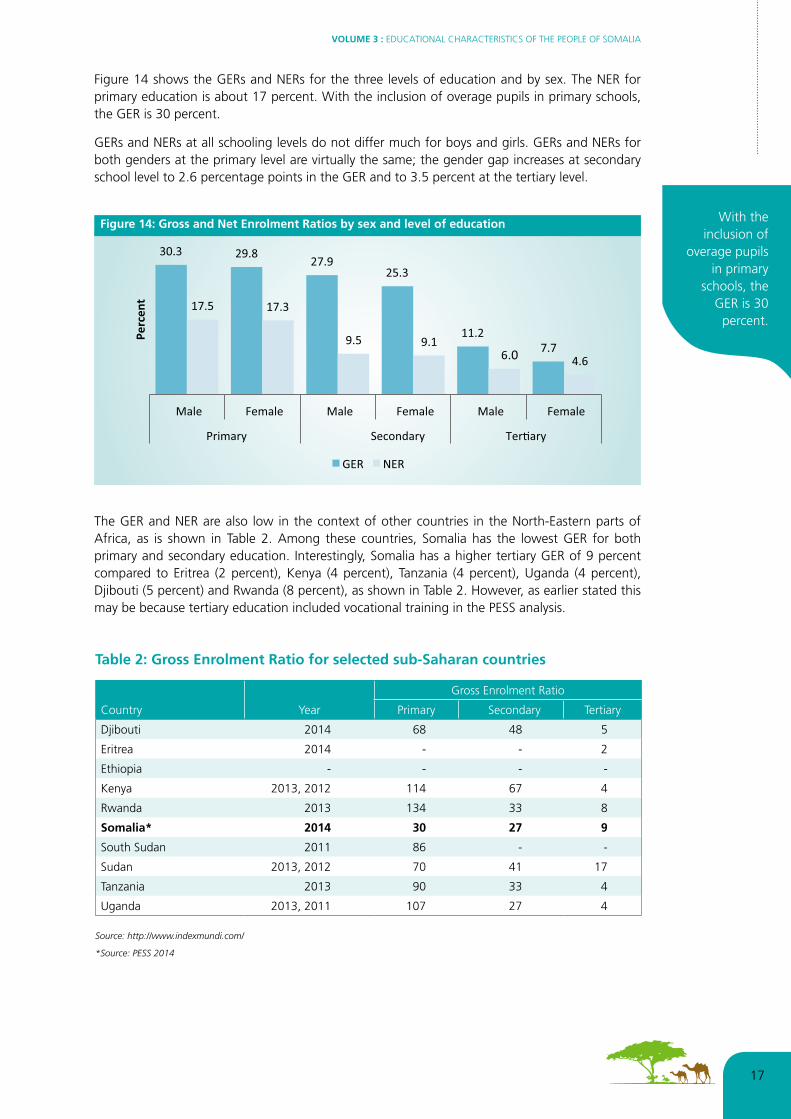
Figure 14 shows the GERs and NERs for the three levels of education and by sex. The NER for primary education is about 17 percent. With the inclusion of overage pupils in primary schools, the GER is 30 percent.
GERs and NERs at all schooling levels do not differ much for boys and girls. GERs and NERs for both genders at the primary level are virtually the same; the gender gap increases at secondary school level to 2.6 percentage points in the GER and to 3.5 percent at the tertiary level.
The GER and NER are also low in the context of other countries in the North-Eastern parts of Africa, as is shown in Table 2. Among these countries, Somalia has the lowest GER for both primary and secondary education. Interestingly, Somalia has a higher tertiary GER of 9 percent compared to Eritrea (2 percent), Kenya (4 percent), Tanzania (4 percent), Uganda (4 percent), Djibouti (5 percent) and Rwanda (8 percent), as shown in Table 2. However, as earlier stated this may be because tertiary education included vocational training in the PESS analysis.
Figure 14: Gross and Net Enrolment Ratios by sex and level of education
Perc
ent
43.8
15.0
6.0
17.0
77.0
.0
50.1
35.9
11.2 2.9 0.2
31.5
64.2
4.0 0.1 1.8
20.3
77.8
6-13 14-17 18-24 25+
13.0
Tertiary
Tertiary
Rural Urban IDP Camps Nomadic
GER
/NER
Country Year
Gross Enrolment Ratio
Primary Secondary Tertiary
Djibouti 2014 68 48 5
Eritrea 2014 - - 2
Ethiopia - - - -
Kenya 2013, 2012 114 67 4
Rwanda 2013 134 33 8
Somalia* 2014 30 27 9
South Sudan 2011 86 - -
Sudan 2013, 2012 70 41 17
Tanzania 2013 90 33 4
Uganda 2013, 2011 107 27 4
Source: http://www.indexmundi.com/
*Source: PESS 2014
Table 2: Gross Enrolment Ratio for selected sub-Saharan countries
With the inclusion of
overage pupils in primary
schools, the GER is 30
percent.
ANALYTICAL REPORT TECHNICALLY SUPPORTED BY UNFPA (P&D UNIT)18
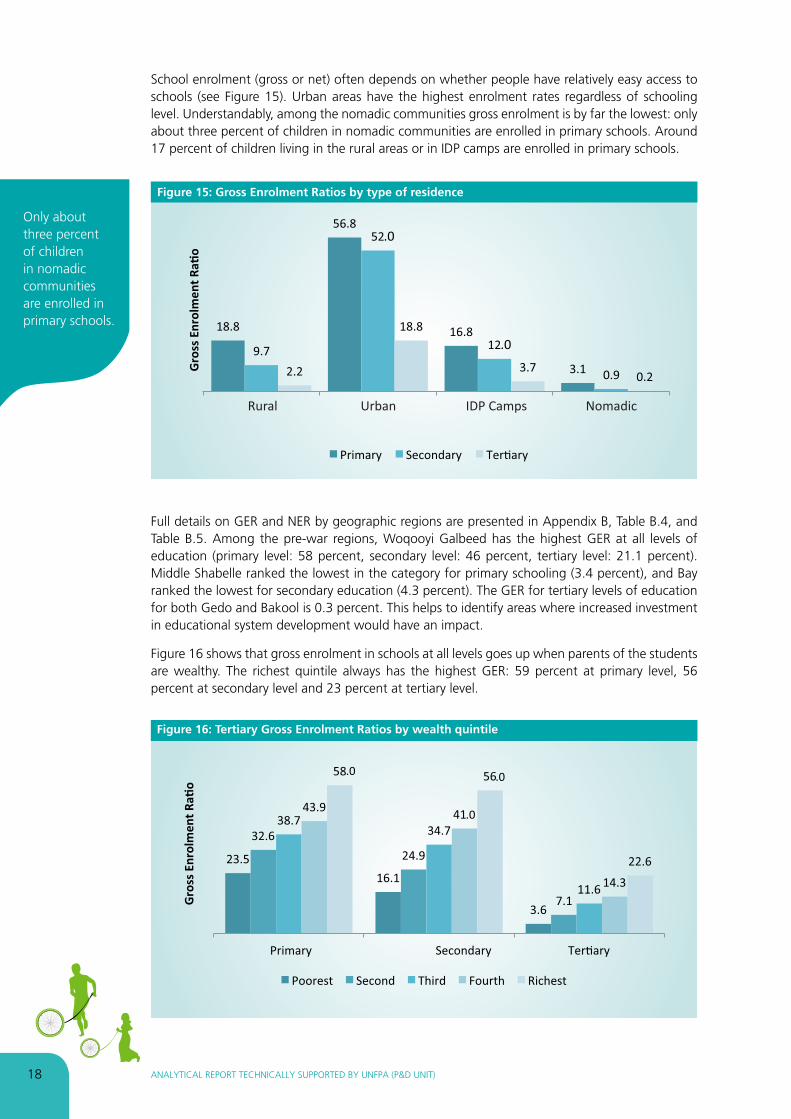
School enrolment (gross or net) often depends on whether people have relatively easy access to schools (see Figure 15). Urban areas have the highest enrolment rates regardless of schooling level. Understandably, among the nomadic communities gross enrolment is by far the lowest: only about three percent of children in nomadic communities are enrolled in primary schools. Around 17 percent of children living in the rural areas or in IDP camps are enrolled in primary schools.
Full details on GER and NER by geographic regions are presented in Appendix B, Table B.4, and Table B.5. Among the pre-war regions, Woqooyi Galbeed has the highest GER at all levels of education (primary level: 58 percent, secondary level: 46 percent, tertiary level: 21.1 percent). Middle Shabelle ranked the lowest in the category for primary schooling (3.4 percent), and Bay ranked the lowest for secondary education (4.3 percent). The GER for tertiary levels of education for both Gedo and Bakool is 0.3 percent. This helps to identify areas where increased investment in educational system development would have an impact.
Figure 16 shows that gross enrolment in schools at all levels goes up when parents of the students are wealthy. The richest quintile always has the highest GER: 59 percent at primary level, 56 percent at secondary level and 23 percent at tertiary level.
Figure 16: Tertiary Gross Enrolment Ratios by wealth quintile
.0
.0
.0 .0
.0
Rural Urban IDP Camps Nomadic
Figure 15: Gross Enrolment Ratios by type of residence
.0
.0
.0 .0
.0
Rural Urban IDP Camps Nomadic
Only about three percent of children in nomadic communities are enrolled in primary schools.

VOLUME 3 : EDUCATIONAL CHARACTERISTICS OF THE PEOPLE OF SOMALIA
19 19
EDUCATIONAL ATTAINMENT
This chapter discusses the education levels completed by the population.

ANALYTICAL REPORT TECHNICALLY SUPPORTED BY UNFPA (P&D UNIT)20
5 Educational attainment
Policymakers and development agencies value information on educational attainment, as key decisions on improving the educational status of Somalis can be made based on this analysis. Employment opportunities and entrepreneurship generally hinge on educational attainment. The higher the levels of educational attainment, the more self-confidence or psychological advanced people tend to feel.
The UN defines educational attainment as either the highest grade completed or the highest grade attended, in the educational system of the country where the education was received. According to the International Standard Classification of Education (ISCED), education includes all deliberate and systematic activities designed to meet learning needs (OECD, European Union, UNESCO-Institute of Statistics, 2015).
To compute the level of education attained, respondents were asked about the highest level of formal education completed by household members aged six years and above who were not currently enrolled in school. However, since the official age for completing the lowest level of schooling (primary school) is 13 years, only household members aged 14 years and above who met the criteria of no longer being enrolled in schooling were included in the analysis.
In Figure 17, educational attainment rates are only computed with reference to the adult population, aged 25 years and older. The significance of 25 years is that if everybody attending schools would complete their training within the age span typical for each of the three levels of education, no one aged 25 years or over would still be earning education; as discussed earlier, the typical age range for the highest tertiary level of education is 18-24 years. The figure shows that only 24.4 percent of the Somali population aged 25 and above have completed at least primary level of education; among males, this proportion is 28.2 and among females it is 20.5 percent.
Almost 44.0 percent of the adult population currently living in urban areas has completed at least the primary level of education (see Figure 18). This measure is much lower for people currently residing in IDP camps (18 percent) and rural areas (15 percent). Among the nomadic adult population, 25 years or older, who are no longer in school, only four percent ever completed education at any level.
.0
.0
Rural Urban IDP Camps Nomadic
Figure 17: Educational attainment by sex for adults aged 25+

VOLUME 3 : EDUCATIONAL CHARACTERISTICS OF THE PEOPLE OF SOMALIA
21 21
Figure 19 shows that 75.6 percent have not completed any level of education, 10.0 percent have completed primary level, 8.6 percent have completed secondary level and 5.8 percent have completed tertiary education. Figure 20 shows that there are significant differences between the regions in terms of educational attainment reached by the population 25 years or older that are no longer in school. The populations in Banadir (40.6 percent) and Bari (37.2 percent) regions have the highest levels of attainment, whereas Bay (5.1 percent) and Middle Shabelle (5.6 percent) have the lowest rates. The PESS has not collected significant information on the root causes of the regional differences, but it does appear that security and proximity to urban centres are among the key factors to explain the regional variation.
There are regional differences in educational attainment at the primary, secondary and tertiary levels. The ‘top’ regions with an adult population who has completed tertiary education are Banadir (12 percent), Bari (11 percent), Woqooyi Galbeed (10 percent) and Awdal (8 percent). These four regions contain the towns of Mogadishu, Bossaso, Hargeisa and Borama that are hosts to the major Somali centres of higher learning. Banadir has the largest percentage of people who have attained secondary education (18 percent). Full details are provided in Appendix C.
Figure 18: Educational attainment by type of residence
.0
.0
Rural Urban IDP Camps Nomadic
Figure 19: Educational attainment by level
.0
.0
Rural Urban IDP Camps Nomadic
75.6 percent have not
completed any level of
education, 10.0 percent have
completed primary level,
8.6 percent have completed secondary level
and 5.8 percent have completed
tertiary education.
The ‘top’ regions with
an adult population who
has completed tertiary
education are Banadir,
Bari, Woqooyi Galbeed and Awdal. These four regions contain the
towns of Mogadishu,
Bossaso, Hargeisa and Borama that
are hosts to the major Somali
centres of higher learning.

ANALYTICAL REPORT TECHNICALLY SUPPORTED BY UNFPA (P&D UNIT)22
Figure 20: Population with some level of formal education completed (percent)
POPULATION WITH SOME FORMAL EDUCATION COMPLETED
´0 180 36090
Kilometres
Source: PESS 2014
The boundaries on this map are the pre-war regions of Somalia and do not imply any official endorsement or acceptance by the United Nations Population Fund.
5 - 14
15 - 23
24 - 32
33 - 41
LegendPopulation 25+in percent

VOLUME 3 : EDUCATIONAL CHARACTERISTICS OF THE PEOPLE OF SOMALIA
23 23
Educational attainment increases with an increase in the status of wealth (Figure 21). The proportion of Somalis who have attained some level of education ranged from 16 percent within the poorest category to 49.6 percent within the wealthiest population category. The gap between levels of education in the poorest and second-poorest quintiles, as well as between the fourth and fifth quintiles, are large compared to the disparities in the middle quintiles. This may be indicative of low transition rates from one level to the next.
Figure 21: Educational attainment by wealth quintile
.0
Educational attainment
increases with an increase in the status of
wealth.

ANALYTICAL REPORT TECHNICALLY SUPPORTED BY UNFPA (P&D UNIT)24
GENDER PARITY INDEX
This chapter describes the ratio of the number of female students enrolled at a particular level of education to the number of male students in the same level.
VOLUME 3 : EDUCATIONAL CHARACTERISTICS OF THE PEOPLE OF SOMALIA
25 25
6 Gender Parity Index
The Gender Parity Index (GPI) is the ratio of the number of female students enrolled at a particular level of education to the number of male students in the same level. To standardise the effects of the population structure of the appropriate age groups on the GPI, the GPI of the GER is computed for each level of education. A GPI of 1 indicates parity or equal access to a particular level of education between the sexes. A GPI that varies between 0 and 1 means a disparity in favour of males, whereas a GPI greater than 1 indicates that more females are enrolled at a specific level of education (UNESCO Institute for Statistics, 2013). The international community has continually pledged its commitment to eliminate gender disparities in the country, at all levels of education. Under the international Sustainable Development Goals (SDGs)1, Goal 4, Target 1 aims to meet this goal by 2030.
Families may perceive the value of education differently for boys and girls. In situations of scarce resources, girls are more likely to suffer from limited access to education, especially in rural areas (Raley & Bianchi, 2006). However, where basic education is widely accepted and overall enrolment is high, girls’ enrolment tends to be equal or higher than boys’ enrolment. The GPI highlights and monitors these differences.
Table 3 highlights the varying rate in gender parity at different education levels across the enumeration areas covered, regions and wealth quintiles. Overall, gender disparity increases as one moves to higher education levels (primary level: 0.986, secondary level: 0.916, and tertiary level: 0.688). Despite efforts to bridge gender gaps with regard to access to education, persistent inequalities remain in several regions and at different levels of education. According to the PESS, gender disparities show that men have more access to education. In primary schools, the ratio of girls to boys enrolled is equal in rural areas (GPI: 1) and in IDP camps (GPI: 1.002). However, among the urban and nomadic populations, the gender disparity is in favour of boys (urban GPI: 0.950 and nomadic population: 0.887). The gender disparities further illustrate that boys generally have more access to education at secondary level (rural GPI: 0.874, urban GPI: 0.872, IDP GPI: 0.786, nomadic populations’ GPI: 0.688) and tertiary levels (rural GPI: 0.722, urban GPI: 0.659, IDP GPI: 0.579, nomadic communities’ GPI: 1.065). Gender disparity is the highest in Sool region, where the GPI is 0.883. The distribution of gender disparity between the wealth quintiles within each level of schooling does not vary significantly. However, there is generally more disparity across the board at the tertiary level compared to primary and secondary levels.
1 https://sustainabledevelopment.un.org/topics/sustainabledevelopmentgoals
Gender disparity increases as one moves to higher
education levels.
Despite efforts to bridge
gender gaps with regard to access to education, persistent
inequalities remain in
several regions and at different
levels of education. According
to the PESS, gender
disparities show that men have more access to
education.

ANALYTICAL REPORT TECHNICALLY SUPPORTED BY UNFPA (P&D UNIT)26
Background characteristic Primary Secondary Tertiary
Type of residence
Rural 1.000 0.874 0.722
Urban 0.950 0.872 0.659
IDP Camps 1.002 0.786 0.579
Nomadic 0.887 0.688 1.065
Region
Awdal 0.920 0.979 0.861
Woqooyi Galbeed 0.944 0.873 0.701
Togdheer 0.934 0.773 0.589
Sool 0.883 1.106 0.763
Sanaag 0.984 0.911 0.909
Bari 0.940 0.813 0.664
Nugaal 1.007 0.834 0.905
Mudug 1.067 0.946 0.700
Galgaduud 0.924 0.716 0.373
Hiraan 0.886 0.917 0.603
Middle Shabelle 1.126 0.845 0.567
Banadir 0.972 0.881 0.619
Lower Shabelle 1.024 0.983 0.792
Bay 1.026 0.748 0.813
Bakool 0.710 0.796 0.675
Gedo 0.887 0.675 0.125
Middle Juba 1.010 0.454 0.860
Lower Juba 0.908 1.026 0.488
Wealth Index
Poorest 0.985 0.854 0.621
Second 0.949 0.819 0.597
Third 0.967 0.899 0.615
Fourth 0.953 0.935 0.681
Richest 0.989 0.864 0.682
Total 0.986 0.916 0.688
Table 3: Gender Parity Index by selected background characteristics

VOLUME 3 : EDUCATIONAL CHARACTERISTICS OF THE PEOPLE OF SOMALIA
27 27
CONCLUSION
This chapter presents conclusions based on the findings in this report.

ANALYTICAL REPORT TECHNICALLY SUPPORTED BY UNFPA (P&D UNIT)28
7 CONCLUSION
Education is key to improving lifestyles and advancing self-esteem. Increases in the access to and improved quality of educational provision have been associated with a wide range of benefits including enhanced productivity, reduced poverty and income inequality, improved health and economic growth.
The PESS findings depict dismally low enrolment rates at all levels of education, low educational attainment at all levels and discrepancies by region, residence and wealth status. The rate at which young Somalis progress from lower educational levels to higher ones is low.
The country’s overall GER is below 100 percent, which means Somalia is not able to accommodate all of its population of schoolgoing ages. This presents a looming threat, with the dawn of a new ‘lost’ generation being raised in a world where innovation and education are the order of survival. Overage enrolment is very common all throughout the Somali formal school system. In primary schools, only just over half of the pupils are aged 6-13 years (the age span that is typical for the eight-grade primary education system), resulting in a net enrolment rate of 17 percent. As delayed entry at the primary level obviously transmits to late entry at secondary education and tertiary levels of education, the percentages of students who have an age that is typical for the level of education (secondary school: 14-17 years; tertiary education 18-24 years) is even lower than for primary education.
In spite of this rather bleak picture, girls are not seriously disadvantaged in access to schooling compared to boys. Whereas there is still an 8 percentage point gap in the adult literacy rates between men and women, the gap in access to primary education is smaller: the Gender Parity Index for primary education that measures the degree of equal access to primary schooling is 0.986, close to 1 which indicate no disparity in access.
Several factors may have contributed to the gloomy education status witnessed in the country. These include protracted insecurity, collapse of the public education sector, the cost of private education locking out several families, poor quality of education, and the lack of school infrastructure and resources, among others. Policies to address these factors are critical to increasing enrolment rates across the board.

VOLUME 3 : EDUCATIONAL CHARACTERISTICS OF THE PEOPLE OF SOMALIA
29 29
REFERENCES
Flynt, J. (2014, June 2). The Importance of Adult Literacy in Today’s Society. Retrieved from http://blog.alfalit.org/the-importance-of-adult-literacy-in-todays-society
Ministry of Education Puntland. (2012). Primary School Census Statistics Year Book 2011/2012.
Raley, S., & Bianchi, S. (2006). SONS, DAUGHTERS, AND FAMILY PROCESSES: Does Gender of Children Matter? Annual Review of Sociology, 32, 401–421.
UNESCO. (2003). Can there be Alternative Indicators of Enrolment: A Critical Review of Frequently used Indicators (Regional Workshop on Education Statistics 2003). New Delhi, India. Retrieved from http://www.educationforallinindia.com/New%20Modules/Enrolment%20Ratio%20to%20Attendance%20Rate.pdf
UNESCO. (2006). Education for All Global Monitoring Report. UNESCO.
UNESCO Institute for Statistics. (2004). Guide to the Analysis and Use of Household Survey and Census Education Data.
UNESCO Institute for Statistics. (2009, November). Education Indicators: Technical guidelines. Retrieved from http://www.uis.unesco.org/Library/Documents/eiguide09-en.pdf
UNESCO Institute for Statistics. (2013). Adult and Youth Literacy.
UNICEF. (2013). Somalia Federal Republic G2S Initiative: Educating for Resilience (2013‐2016) Strategy

ANALYTICAL REPORT TECHNICALLY SUPPORTED BY UNFPA (P&D UNIT)30
Document.
APPENDIX A – Adult literacyNot literate Literate
Total (n) Male Female Total Male Female Total
Type of residence
Rural 68.9 76.2 72.5 31.1 23.8 27.5 1,441,316
Urban 29.5 41.9 35.8 70.5 58.1 64.2 2,889,356
IDP Camps 61.4 72.4 67.2 38.6 27.6 32.8 497,793
Nomadic 86.4 89.5 87.9 13.6 10.5 12.1 1,731,443
Age
15-19 46.9 48.7 47.8 53.1 51.3 52.2 1,452,624
20-29 50.7 59.8 55.7 49.3 40.2 44.3 2,099,798
30-39 60.1 70.8 65.8 39.9 29.2 34.2 1,378,638
40-49 63.2 75.0 68.4 36.8 25.0 31.6 890,545
50-59 64.2 80.3 70.5 35.8 19.7 29.5 373,532
60-69 71.1 86.2 77.2 28.9 13.8 22.8 204,703
70-79 79.2 90.0 83.5 20.8 10.0 16.5 104,945
80+ 83.1 89.2 85.5 16.9 10.8 14.5 55,123
Region
Awdal 59.1 64.3 61.6 40.9 35.7 38.4 448,908
Woqooyi Galbeed 44.0 56.5 50.3 56.0 43.5 49.7 746,851
Togdheer 46.2 57.7 52.1 53.8 42.3 47.9 415,181
Sool 70.9 73.6 72.1 29.1 26.4 27.9 189,256
Sanaag 72.5 72.9 72.7 27.5 27.1 27.3 343,521
Bari 44.5 51.1 47.8 55.5 48.9 52.2 412,740
Nugaal 66.4 66.5 66.4 33.6 33.5 33.6 199,759
Mudug 42.8 47.0 44.9 57.2 53.0 55.1 354,364
Galgaduud 45.9 58.3 52.3 54.1 41.7 47.7 260,102
Hiraan 66.2 75.5 70.7 33.8 24.5 29.3 234,220
Middle Shabelle 87.6 91.3 89.4 12.4 8.7 10.6 270,304
Banadir 29.2 42.7 36.1 70.8 57.3 63.9 827,809
Lower Shabelle 65.4 75.5 70.4 34.6 24.5 29.6 571,504
Bay 79.9 84.7 82.3 20.1 15.3 17.7 425,219
Bakool 66.0 70.6 68.2 34.0 29.4 31.8 172,745
Gedo 59.9 66.9 63.4 40.1 33.1 36.6 235,412
Middle Juba 73.4 85.0 79.0 26.6 15.0 21.0 189,980
Lower Juba 66.0 71.3 68.7 34.0 28.7 31.3 262,033
Wealth index
Poorest 62.1 73.0 67.5 37.9 27.0 32.5 896,371
Second 51.2 62.8 57.1 48.8 37.2 42.9 939,814
Third 43.4 53.4 48.5 56.6 46.6 51.5 988,373
Fourth 39.4 50.0 44.8 60.6 50.0 55.2 969,277
Richest 29.5 39.6 34.7 70.5 60.4 65.3 1,034,490
Total 56.2 63.8 60.0 43.8 36.2 40.0 6,559,909
Table A. 1: Adult literacy by selected background characteristics for age 15+ (percent)
VOLUME 3 : EDUCATIONAL CHARACTERISTICS OF THE PEOPLE OF SOMALIA
31 31
APPENDIX B – School enrolment
Currently enrolled Not currently enrolledTotal (n)
Male Female Total Male Female Total
Type of residence
Rural 35.5 32.7 34.2 64.5 67.3 65.8 2,213,456
Urban 55.3 50.2 52.8 44.7 49.8 47.2 4,153,313
IDP Camps 26.5 22.1 24.2 73.5 77.9 75.8 806,570
Nomadic 16.5 14.8 15.7 83.5 85.2 84.3 2,490,950
Age
6-13 59.7 58.8 59.2 40.3 41.2 40.8 2,880,062
14-17 55.8 54.6 55.2 44.2 45.4 44.8 1,191,230
18-24 40.3 33.3 36.6 59.7 66.7 63.4 1,702,080
25-34 18.9 15.0 16.8 81.1 85.0 83.2 1,726,229
35+ 12.4 11.3 11.9 87.6 88.7 88.1 2,164,689
Region
Awdal 34.9 34.0 34.5 65.1 66.0 65.5 587,477
Woqooyi Galbeed 44.3 40.4 42.4 55.7 59.6 57.6 1,032,469
Togdheer 42.1 36.4 39.2 57.9 63.6 60.8 588,069
Sool 27.8 26.6 27.2 72.1 73.4 72.8 260,078
Sanaag 25.9 25.4 25.7 74.1 74.6 74.3 466,189
Bari 52.4 48.5 50.5 47.6 51.5 49.5 527,405
Nugaal 40.0 39.4 39.7 60.0 60.6 60.3 275,624
Mudug 48.5 45.0 46.8 51.5 55.0 53.2 522,664
Galgaduud 32.7 27.0 29.9 67.3 73.0 70.1 420,057
Hiraan 35.2 28.7 32.3 64.8 71.3 67.7 368,718
Middle Shabelle 20.5 18.2 19.4 79.5 81.8 80.6 422,888
Banadir 49.4 45.4 47.3 50.6 54.6 52.7 1,298,348
Lower Shabelle 39.5 37.0 38.3 60.5 63.0 61.7 941,493
Bay 28.5 25.6 27.1 71.5 74.4 72.9 652,438
Bakool 35.6 30.2 33.1 64.4 69.8 66.9 284,803
Gedo 28.9 25.2 27.1 71.1 74.8 72.9 374,704
Middle Juba 22.9 18.6 20.9 77.1 81.4 79.1 265,538
Lower Juba 33.9 32.5 33.2 66.1 67.5 66.8 375,327
Wealth Index
Poorest 37.7 33.6 35.7 62.3 66.4 64.3 1,395,215
Second 43.3 38.6 41.0 56.7 61.4 59.0 1,424,944
Third 46.6 42.5 44.6 53.4 57.5 55.4 1,469,840
Fourth 48.0 44.1 46.1 52.0 55.9 53.9 1,432,332
Richest 53.7 49.2 51.5 46.3 50.8 48.5 1,450,798
Total 38.1 35.0 36.6 61.9 65.0 63.4 9,664,290
Table B. 1: School enrolment for age 6 and above by selected background characteristics (percent)

ANALYTICAL REPORT TECHNICALLY SUPPORTED BY UNFPA (P&D UNIT)32
6 to 13 year olds 14-17 year olds 18-24 year olds
Male Female Total Male Female Total Male Female Total
Type of residence
Rural 414,215 353,986 768,201 154,218 124,473 278,691 184,236 200,567 384,803
Urban 654,816 622,452 1,277,269 280,428 269,949 550,377 381,057 437,415 818,472
IDP Camps 170,680 164,245 334,925 51,999 51,171 103,170 52,067 66,306 118,374
Nomadic 418,445 364,699 783,144 166,384 140,980 307,364 220,884 220,287 441,171
Region
Awdal 69,034 69,207 138,241 45,378 40,120 85,498 71,052 64,003 135,055
Woqooyi
Galbeed142,650 138,217 280,867 68,271 66,205 134,476 91,851 102,379 194,230
Togdheer 88,002 80,871 168,873 41,295 39,859 81,154 55,059 62,394 117,453
Sool 41,350 36,173 77,523 21,398 17,405 38,803 29,151 26,460 55,610
Sanaag 59,956 58,406 118,362 37,666 35,516 73,182 50,359 47,220 97,579
Bari 81,534 75,652 157,186 35,838 33,271 69,109 56,991 62,703 119,694
Nugaal 49,746 44,609 94,354 19,123 17,879 37,002 24,653 28,785 53,438
Mudug 101,229 90,834 192,063 37,598 33,297 70,894 45,975 52,329 98,304
Galgaduud 84,229 75,432 159,661 26,329 24,176 50,505 31,231 38,477 69,708
Hiraan 84,203 61,585 145,787 19,326 13,656 32,982 24,967 31,105 56,072
Middle Shabelle 79,406 64,305 143,711 26,212 21,415 47,627 28,477 29,283 57,760
Banadir 233,835 230,469 464,303 82,813 85,011 167,825 101,714 120,848 222,562
Lower Shabelle 184,927 175,899 360,825 76,162 64,234 140,395 69,673 75,802 145,475
Bay 121,672 100,616 222,287 38,913 30,210 69,123 51,426 58,120 109,546
Bakool 60,774 48,619 109,393 20,825 13,568 34,393 21,017 20,382 41,399
Gedo 76,977 67,652 144,629 18,751 19,388 38,139 25,082 36,671 61,753
Middle Juba 42,989 33,199 76,188 13,849 12,822 26,671 25,953 30,013 55,966
Lower Juba 55,645 53,640 109,285 23,283 18,543 41,826 33,613 37,601 71,214
Wealth Index
Poorest 259,508 229,761 489,268 96,754 80,586 177,339 111,355 117,356 228,711
Second 260,043 232,014 492,057 96,868 87,278 184,146 117,425 133,980 251,405
Third 253,488 236,212 489,701 98,462 91,207 189,669 122,494 145,752 268,246
Fourth 243,953 230,820 474,773 99,355 89,890 189,244 125,468 144,920 270,388
Richest 222,600 211,694 434,295 95,206 96,634 191,840 140,617 162,282 302,899
Total 1,658,157 1,505,383 3,163,540 653,028 586,574 1,239,602 838,243 924,576 1,762,820
Table B. 2: School age population by selected background characteristics (number)
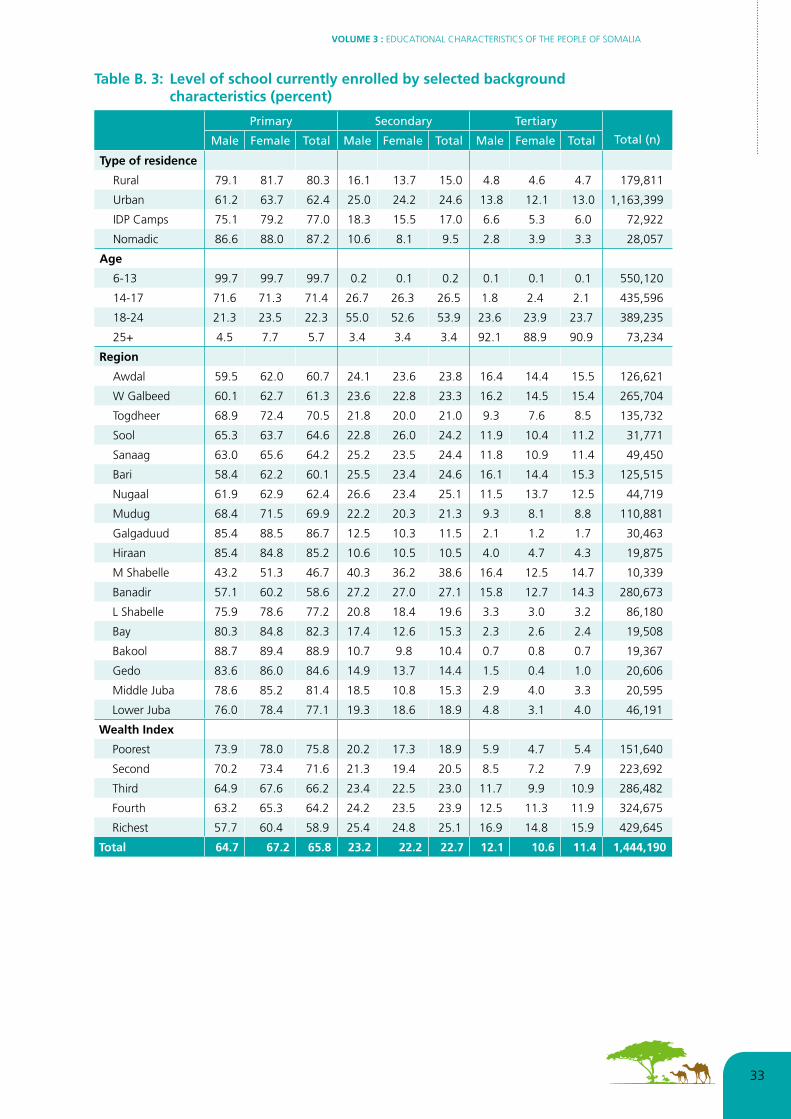
VOLUME 3 : EDUCATIONAL CHARACTERISTICS OF THE PEOPLE OF SOMALIA
33 33
Primary Secondary Tertiary Total (n)Male Female Total Male Female Total Male Female Total
Type of residence
Rural 79.1 81.7 80.3 16.1 13.7 15.0 4.8 4.6 4.7 179,811
Urban 61.2 63.7 62.4 25.0 24.2 24.6 13.8 12.1 13.0 1,163,399
IDP Camps 75.1 79.2 77.0 18.3 15.5 17.0 6.6 5.3 6.0 72,922
Nomadic 86.6 88.0 87.2 10.6 8.1 9.5 2.8 3.9 3.3 28,057
Age
6-13 99.7 99.7 99.7 0.2 0.1 0.2 0.1 0.1 0.1 550,120
14-17 71.6 71.3 71.4 26.7 26.3 26.5 1.8 2.4 2.1 435,596
18-24 21.3 23.5 22.3 55.0 52.6 53.9 23.6 23.9 23.7 389,235
25+ 4.5 7.7 5.7 3.4 3.4 3.4 92.1 88.9 90.9 73,234
Region
Awdal 59.5 62.0 60.7 24.1 23.6 23.8 16.4 14.4 15.5 126,621
W Galbeed 60.1 62.7 61.3 23.6 22.8 23.3 16.2 14.5 15.4 265,704
Togdheer 68.9 72.4 70.5 21.8 20.0 21.0 9.3 7.6 8.5 135,732
Sool 65.3 63.7 64.6 22.8 26.0 24.2 11.9 10.4 11.2 31,771
Sanaag 63.0 65.6 64.2 25.2 23.5 24.4 11.8 10.9 11.4 49,450
Bari 58.4 62.2 60.1 25.5 23.4 24.6 16.1 14.4 15.3 125,515
Nugaal 61.9 62.9 62.4 26.6 23.4 25.1 11.5 13.7 12.5 44,719
Mudug 68.4 71.5 69.9 22.2 20.3 21.3 9.3 8.1 8.8 110,881
Galgaduud 85.4 88.5 86.7 12.5 10.3 11.5 2.1 1.2 1.7 30,463
Hiraan 85.4 84.8 85.2 10.6 10.5 10.5 4.0 4.7 4.3 19,875
M Shabelle 43.2 51.3 46.7 40.3 36.2 38.6 16.4 12.5 14.7 10,339
Banadir 57.1 60.2 58.6 27.2 27.0 27.1 15.8 12.7 14.3 280,673
L Shabelle 75.9 78.6 77.2 20.8 18.4 19.6 3.3 3.0 3.2 86,180
Bay 80.3 84.8 82.3 17.4 12.6 15.3 2.3 2.6 2.4 19,508
Bakool 88.7 89.4 88.9 10.7 9.8 10.4 0.7 0.8 0.7 19,367
Gedo 83.6 86.0 84.6 14.9 13.7 14.4 1.5 0.4 1.0 20,606
Middle Juba 78.6 85.2 81.4 18.5 10.8 15.3 2.9 4.0 3.3 20,595
Lower Juba 76.0 78.4 77.1 19.3 18.6 18.9 4.8 3.1 4.0 46,191
Wealth Index
Poorest 73.9 78.0 75.8 20.2 17.3 18.9 5.9 4.7 5.4 151,640
Second 70.2 73.4 71.6 21.3 19.4 20.5 8.5 7.2 7.9 223,692
Third 64.9 67.6 66.2 23.4 22.5 23.0 11.7 9.9 10.9 286,482
Fourth 63.2 65.3 64.2 24.2 23.5 23.9 12.5 11.3 11.9 324,675
Richest 57.7 60.4 58.9 25.4 24.8 25.1 16.9 14.8 15.9 429,645
Total 64.7 67.2 65.8 23.2 22.2 22.7 12.1 10.6 11.4 1,444,190
Table B. 3: Level of school currently enrolled by selected background characteristics (percent)

ANALYTICAL REPORT TECHNICALLY SUPPORTED BY UNFPA (P&D UNIT)34
Primary Secondary Tertiary
Male Female Total Male Female Total Male Female Total
Type of residence
Rural 18.8 18.8 18.8 10.2 9.0 9.7 2.6 1.9 2.2
Urban 58.2 55.3 56.8 55.5 48.4 52.0 22.6 14.9 18.5
IDP Camps 16.8 16.8 16.8 13.4 10.5 12.0 4.8 2.8 3.7
Nomadic 3.3 2.9 3.1 1.0 0.7 0.9 0.2 0.2 0.2
Region
Awdal 57.9 53.3 55.6 35.7 34.9 35.3 15.5 13.4 14.5
Woqooyi Galbeed
59.7 56.3 58.0 49.0 42.8 46.0 25.0 17.5 21.1
Togdheer 58.5 54.6 56.6 39.5 30.5 35.1 12.6 7.4 9.9
Sool 28.0 24.7 26.5 18.9 20.9 19.8 7.2 5.5 6.4
Sanaag 27.0 26.6 26.8 17.2 15.7 16.5 6.0 5.5 5.8
Bari 49.4 46.5 48.0 49.0 39.8 44.6 19.5 12.9 16.1
Nugaal 29.5 29.7 29.6 33.0 27.5 30.4 11.0 10.0 10.5
Mudug 39.1 41.7 40.4 34.2 32.4 33.4 11.8 8.2 9.9
Galgaduud 17.2 15.9 16.6 8.0 5.8 7.0 1.2 0.4 0.8
Hiraan 12.2 10.8 11.6 6.6 6.0 6.4 2.0 1.2 1.5
Middle Shabelle 3.2 3.6 3.4 9.0 7.6 8.4 3.4 1.9 2.6
Banadir 35.9 34.9 35.4 48.2 42.5 45.3 22.8 14.1 18.1
Lower Shabelle 18.2 18.7 18.4 12.1 11.9 12.0 2.1 1.7 1.9
Bay 7.1 7.3 7.2 4.8 3.6 4.3 0.5 0.4 0.4
Bakool 18.1 12.8 15.7 6.3 5.1 5.8 0.4 0.3 0.3
Gedo 12.7 11.3 12.1 9.3 6.3 7.8 0.7 0.1 0.3
Middle Juba 21.9 22.1 22.0 16.0 7.3 11.8 1.3 1.1 1.2
Lower Juba 34.1 31.0 32.6 20.7 21.2 20.9 3.6 1.7 2.6
Wealth Index
Poorest 23.6 23.3 23.5 17.3 14.8 16.1 4.4 2.7 3.6
Second 33.4 31.7 32.6 27.2 22.3 24.9 9.0 5.4 7.1
Third 39.3 38.0 38.7 36.5 32.8 34.7 14.7 9.0 11.6
Fourth 44.9 42.8 43.9 42.3 39.5 41.0 17.3 11.8 14.3
Richest 58.6 58.0 58.3 60.4 52.2 56.3 27.2 18.6 22.6
Total 30.3 29.8 30.1 27.6 25.3 26.5 11.2 7.7 9.4
Table B. 4: Gross Enrolment Ratio (GER) by selected background characteristics

VOLUME 3 : EDUCATIONAL CHARACTERISTICS OF THE PEOPLE OF SOMALIA
35 35
Primary Secondary Tertiary
Male Female Total Male Female Total Male Female Total
Type of residence
Rural 10.5 11.0 10.7 3.3 3.1 3.2 1.3 1.0 1.1
Urban 34.5 32.7 33.6 19.5 17.8 18.6 12.3 9.0 10.5
IDP Camps 8.0 7.9 8.0 3.0 3.0 3.0 1.1 1.1 1.1
Nomadic 1.5 1.3 1.4 0.3 0.2 0.2 0.1 0.1 0.1
Region
Awdal 28.7 27.9 28.3 9.5 9.4 9.5 7.5 7.0 7.3
W. Galbeed 38.4 36.5 37.4 18.2 16.9 17.5 13.3 10.6 11.9
Togdheer 35.3 32.7 34.1 10.9 9.5 10.2 5.0 4.2 4.6
Sool 14.3 13.0 13.7 5.3 7.7 6.4 2.8 3.2 3.0
Sanaag 13.6 13.0 13.3 5.2 4.4 4.8 2.9 2.7 2.8
Bari 30.8 28.5 29.7 15.9 12.8 14.4 10.8 7.8 9.2
Nugaal 19.7 19.5 19.6 12.3 10.9 11.7 5.0 5.8 5.4
Mudug 23.9 24.8 24.3 10.4 10.2 10.3 5.4 3.7 4.5
Galgaduud 8.6 7.2 7.9 2.5 2.5 2.5 0.5 0.2 0.3
Hiraan 7.2 5.8 6.6 1.5 1.6 1.6 1.1 0.6 0.8
M. Shabelle 1.8 2.0 1.9 4.1 3.4 3.8 1.2 0.9 1.0
Banadir 20.4 19.9 20.1 20.2 18.4 19.3 14.8 9.9 12.1
L. Shabelle 9.4 10.3 9.8 3.7 4.0 3.9 1.0 1.0 1.0
Bay 3.0 3.7 3.3 1.9 1.0 1.5 0.2 0.1 0.2
Bakool 8.0 6.3 7.3 1.5 1.4 1.5 0.3 0.1 0.2
Gedo 5.6 5.2 5.4 2.2 1.6 1.9 0.3 0.0 0.1
M. Juba 13.6 13.3 13.5 5.7 2.6 4.2 0.9 0.2 0.5
L. Juba 20.5 18.4 19.5 6.7 7.4 7.0 1.7 0.9 1.3
Wealth Index
Poorest 13.2 13.4 13.3 5.6 5.4 5.5 2.1 1.4 1.7
Second 19.1 18.6 18.8 10.0 8.0 9.0 4.9 3.3 4.1
Third 23.2 22.4 22.8 13.5 12.6 13.1 8.0 5.5 6.6
Fourth 25.9 25.2 25.6 14.3 13.9 14.1 9.4 7.3 8.2
Richest 34.5 33.1 33.8 19.8 18.6 19.2 14.4 10.8 12.5
Total 17.4 17.3 17.3 9.5 9.1 9.3 6.0 4.6 5.2
Table B. 5: Net Enrolment Ratio (NER) by selected background characteristics

ANALYTICAL REPORT TECHNICALLY SUPPORTED BY UNFPA (P&D UNIT)36
None Primary Secondary TertiaryTotal (n)
Male Female Total Male Female Total Male Female Total Male Female Total
Type of Residence
Rural 81.9 87.9 85.0 9.8 7.5 8.6 5.9 3.5 4.7 2.4 1.1 1.7 751,297
Urban 49.1 63.5 56.3 14.2 15.3 14.8 19.8 13.6 16.7 16.9 7.7 12.3 1,506,312
IDP Camps 78.8 84.3 81.7 12.4 11.1 11.7 5.6 3.5 4.5 3.2 1.1 2.1 293,139
Nomadic 95.7 96.5 96.1 3.5 2.8 3.2 0.5 0.4 0.4 0.4 0.2 0.3 995,870
Age
25-34 65.9 75.2 70.9 11.6 11.5 11.6 12.9 8.6 10.5 9.7 4.7 7.0 1,578,732
35+ 75.8 83.7 79.4 9.0 8.2 8.7 8.4 5.4 7.0 6.9 2.7 4.9 1,967,886
Region
Awdal 74.7 79.5 77.0 7.4 7.1 7.3 8.5 7.3 7.9 9.4 6.1 7.9 241,341
W Galbeed 61.6 75.7 68.6 10.9 10.2 10.6 13.6 7.6 10.6 13.9 6.4 10.2 421,568
Togdheer 66.1 78.5 72.4 11.8 11.2 11.5 13.4 7.1 10.2 8.7 3.1 5.9 224,104
Sool 78.7 83.9 81.1 7.1 7.7 7.4 8.9 5.5 7.3 5.3 2.8 4.1 101,378
Sanaag 81.4 82.7 82.0 6.7 7.1 6.9 6.6 6.2 6.4 5.3 4.0 4.6 180,400
Bari 58.9 66.9 62.8 13.3 14.9 14.1 14.1 10.5 12.3 13.8 7.7 10.8 225,803
Nugaal 76.5 78.3 77.4 8.0 10.0 8.9 7.9 6.9 7.4 7.5 4.8 6.2 110,443
Mudug 60.6 67.9 64.3 14.7 16.4 15.6 14.6 10.0 12.3 10.0 5.6 7.8 180,885
Galgaduud 77.9 86.3 82.3 14.8 9.6 12.1 6.1 3.7 4.8 1.2 0.4 0.8 130,077
Hiraan 78.5 82.7 80.6 15.0 13.4 14.2 5.1 3.4 4.3 1.4 0.6 1.0 129,673
M Shabelle 93.5 95.4 94.4 2.6 2.4 2.5 2.0 1.6 1.8 1.9 0.7 1.3 167,548
Banadir 52.9 66.1 59.4 9.7 11.3 10.5 19.5 15.9 17.7 17.9 6.6 12.3 436,407
L Shabelle 77.4 88.1 83.3 11.3 7.3 9.1 8.7 3.9 6.0 2.6 0.7 1.6 255,566
Bay 94.5 95.3 94.9 2.6 2.7 2.7 1.8 1.3 1.6 1.0 0.7 0.9 244,257
Bakool 82.1 83.5 82.8 14.3 13.3 13.8 2.7 2.4 2.5 0.9 0.8 0.8 91,878
Gedo 79.1 82.1 80.5 16.5 15.7 16.1 3.4 2.1 2.8 1.0 0.1 0.6 136,251
M Juba 81.5 91.6 86.1 5.9 4.2 5.1 7.4 2.5 5.1 5.1 1.8 3.6 110,384
L Juba 71.2 75.5 73.3 11.8 14.8 13.3 12.7 8.3 10.6 4.3 1.3 2.9 158,655
Wealth Index
Poorest 80.3 87.7 84.1 10.3 7.7 9.0 6.3 3.3 4.8 3.1 1.3 2.2 478,283
Second 68.9 79.8 74.4 12.7 10.5 11.6 11.9 6.9 9.4 6.4 2.8 4.6 493,278
Third 62.3 73.9 68.1 12.4 12.2 12.3 15.6 9.8 12.7 9.8 4.1 6.9 527,272
Fourth 57.3 69.6 63.5 12.7 13.5 13.1 16.8 11.1 13.9 13.2 5.8 9.5 510,123
Richest 44.4 56.4 50.4 15.2 18.0 16.5 19.0 15.3 17.2 21.4 10.3 15.9 541,752
Total 71.8 79.5 75.6 10.0 9.9 10.0 10.2 7.0 8.6 8.0 3.7 5.8 3,546,618
Table C. 1: Education attained for persons aged 25+ by selected background characteristics (percent)
APPENDIX C – Educational Attainment
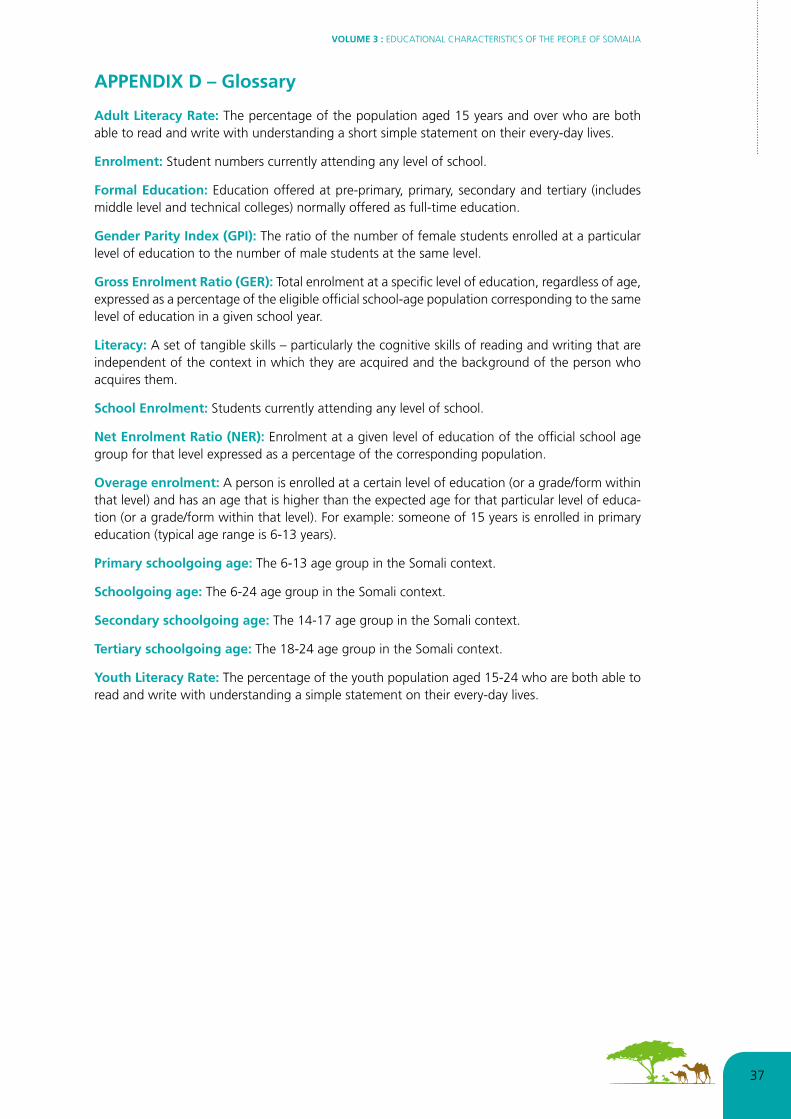
VOLUME 3 : EDUCATIONAL CHARACTERISTICS OF THE PEOPLE OF SOMALIA
37 37
APPENDIX D – Glossary
Adult Literacy Rate: The percentage of the population aged 15 years and over who are both able to read and write with understanding a short simple statement on their every-day lives.
Enrolment: Student numbers currently attending any level of school.
Formal Education: Education offered at pre-primary, primary, secondary and tertiary (includes middle level and technical colleges) normally offered as full-time education.
Gender Parity Index (GPI): The ratio of the number of female students enrolled at a particular level of education to the number of male students at the same level.
Gross Enrolment Ratio (GER): Total enrolment at a specific level of education, regardless of age, expressed as a percentage of the eligible official school-age population corresponding to the same level of education in a given school year.
Literacy: A set of tangible skills – particularly the cognitive skills of reading and writing that are independent of the context in which they are acquired and the background of the person who acquires them.
School Enrolment: Students currently attending any level of school.
Net Enrolment Ratio (NER): Enrolment at a given level of education of the official school age group for that level expressed as a percentage of the corresponding population.
Overage enrolment: A person is enrolled at a certain level of education (or a grade/form within that level) and has an age that is higher than the expected age for that particular level of educa-tion (or a grade/form within that level). For example: someone of 15 years is enrolled in primary education (typical age range is 6-13 years).
Primary schoolgoing age: The 6-13 age group in the Somali context.
Schoolgoing age: The 6-24 age group in the Somali context.
Secondary schoolgoing age: The 14-17 age group in the Somali context.
Tertiary schoolgoing age: The 18-24 age group in the Somali context.
Youth Literacy Rate: The percentage of the youth population aged 15-24 who are both able to read and write with understanding a simple statement on their every-day lives.

ANALYTICAL REPORT TECHNICALLY SUPPORTED BY UNFPA (P&D UNIT)38
APPENDIX E – Basemap

VOLUME 3 : EDUCATIONAL CHARACTERISTICS OF THE PEOPLE OF SOMALIA
39 39

UNFPA


United Nations Population Fund Somalia
Block P, Level 2, UN Complex,
UN Avenue, Gigiri.
P.O. Box 28832 – 00200 Nairobi, Kenya.
Tel: (+254) (0) 207 625 742
www.unfpa.org
This publication was made possible through the technical and financial support provided by the United Nations Population Fund (UNFPA), the UK Department for International Development (DFID) and the Swedish Government through the Embassy in Nairobi.