look at those two! the precuneus role in unattended third...
TRANSCRIPT
1
Look at those two! The precuneus role in unattended third-person
perspective of social interactions
Abbreviated title: Precuneus and third-person interaction
Karin Petrini1, Lukasz Piwek
2, Frances Crabbe
2, Frank E Pollick
2, Simon Garrod
2
1Institute of Ophthalmology, University College London, London, United Kingdom
2School of Psychology, University of Glasgow, Glasgow, United Kingdom
Words (Abstract, Introduction, Materials & Methods, Results, Discussion, References
and Figure Legends): 6718
Figures: 5
Tables: 1
Corresponding Author:
Dr Karin Petrini
Postdoc Research Associate
UCL Institute of Ophthalmology
11-43 Bath Street
London EC1V 9EL
United Kingdom
tel: +44 (0)20 76084015
Email: [email protected]

2
Abstract: Human beings often observe other people’s social interactions without being a
part of them. Whereas the implications of some brain regions (e.g. amygdala) have been
extensively examined, the implication of the precuneus remains yet to be determined.
Here we examined the implication of the precuneus in third-person perspective of social
interaction using functional magnetic resonance imaging (fMRI). Participants performed
a socially irrelevant task while watching the biological motion of two agents acting in
either typical (congruent to social conventions) or atypical (incongruent to social
conventions) ways. When compared to typical displays, the atypical displays elicited
greater activation in the central and posterior bilateral precuneus, and in frontoparietal
and occipital regions. Whereas the right precuneus responded with greater activation also
to upside down than upright displays, the left precuneus did not. Correlations and
effective connectivity analysis added consistent evidence of an interhemispheric
asymmetry between the right and left precuneus. These findings suggest that the
precuneus reacts to violations of social expectations, and plays a crucial role in third-
person perspective of others’ interaction even when the social context is unattended.
Keywords: biological motion, fMRI, granger causality, precuneus, social interaction

3
INTRODUCTION
Being able to understand the interaction of others is necessary to have a successful social
life. Healthy humans can use different kinds of non-verbal social cues to read others’
behaviour; for example, they can use facial expressions, voice intonation and body
gestures (e.g. Belin et al., 2004; de Gelder et al., 2010; Fecteau et al., 2007; Puce and
Perrett, 2003; Sinke et al., 2010). Depending on the social situation, human beings are
either faced with a condition in which the self is part of the on-going social interaction or
one where it is not (e.g. Schilbach et al., 2006). In the latter situation, a person assumes a
third-person perspective. In recent years, few studies have examined which brain areas
support the ability to read the behaviour of others from a third-person perspective
(Centelles et al., 2011; Kujala et al., 2012; Sinke et al., 2010). These studies have used
visual stimuli depicting the interaction between two humans and have identified, with
different frequency, a group of areas (e.g. amygdala, superior temporal sulcus,
dorsomedial prefrontal cortex, temporoparietal junction, precuneus) which respond more
to interacting than non-interacting agents. While the role of the amygdala, the
temporoparietal junction and medial prefrontal cortex in third-person perspective of
social interaction has received more attention (Centelles et al., 2011; Kujala et al., 2012;
Sinke et al., 2010), the role of the precuneus is still uncertain, due to lack of studies
specifically examining its functions. However, a growing body of evidence from
neuroimaging studies (e.g. Cherkassky et al., 2006; Groen et al., 2010; Kennedy et al.,
2006) point to an essential involvement of this area in clinical conditions such as
schizophrenia and autism. Defining the role of the precuneus in healthy humans when
processing the non-verbal, social behaviour of others will provide a baseline for its
normal activity. This is crucial for future investigations of mental disorders,
developmental disabilities, or cortical injury extending to this area.
The reasons why the precuneus has been neglected, despite its strategic location and
widespread connections, probably reside in its location (i.e. hidden between the
somatosensory and visual cortex) and consequent lack of confined lesion studies
(Cavanna and Trimble, 2006). Modern neuroimaging techniques such as functional
magnetic resonance imaging (fMRI), however, have enabled the characterisation of the
precuneus’ function in many different high-level cognitive tasks and of its connectivity-

4
based subdivision (Margulies et al., 2009). Studies in monkeys and humans have
consistently suggested that different parts of the precuneus subtend different functions
(e.g. Kobayashi and Amaral, 2007; Margulies et al., 2009; Parvizi et al., 2006). For
example, a distinct pattern of functional connectivity suggests the anterior part of the
precuneus has mostly sensorimotor functions, the central part has cognitive/associative
functions, and the posterior part has visual functions (Margulies et al., 2009).
In a very parsimonious review of the precuneus’ functions and behavioural correlates
Cavanna and Trimble (2006) describe a series of studies in which the precuneus was
activated more for self-relevant than self-irrelevant personal traits (Kircher et al., 2000;
Kjaer et al., 2002; Lou et al., 2004), and more for a first-person than a third-person
perspective (den Ouden et al., 2005; Vogeley et al., 2001; Vogeley and Fink, 2003). At
first glance, these converging results suggest that the precuneus is specifically involved in
self-representation and first-person perspective of social interaction (Cavanna and
Trimble, 2006). However, other studies have shown a greater activation of the precuneus
for third-person perspective than for first-person perspective of social interaction and for
third-person perspective of social interaction than for non-social interaction (Farrer and
Frith, 2002; Kujala et al., 2012; Ruby and Decety, 2001; Vogeley et al., 2004). Due to
these inconsistent results, the role of the precuneus in social perspective taking remains to
be determined. Recently, Schilbach et al. (2013) suggested an alternative paradigm to
study social cognition that, in contrast to those studying passive first- and third-person
perspective, involves actively the observer in the social interaction. This ‘second-person’
approach (Schilbach, 2010) to look at social cognition could be the key to resolve the
existing inconsistent results on the role of precuneus when active interaction is involved.
However, a third-person perspective approach appears more appropriate to examine the
precuneus role when the viewer experiences others’ social interaction without being
actively involved.
Here, we focus specifically on the role of precuneus in third-person perspective of social
interaction and ask whether the involvement of the precuneus would change with the
degree of congruency of others’ interaction, since recent studies reported greater
precuneus activation for incongruent than congruent social information (Bruneau and
Saxe, 2010; Cloutier et al., 2011; Reid et al., 2009). Additionally, it is unknown whether

5
the precuneus would show a similar involvement in social perspective taking when the
viewer is not attending to the social context portrayed in the displays.
Here we examined the role of the precuneus in processing unattended third-person
perspective of others’ interaction using functional magnetic resonance imaging (fMRI)
and non-verbal social cues. In order to control for the physical aspects of the others’
actions while changing the degree of congruency of their interaction we used displays
representing the biological motion (e.g. Pavlova, 2011; Saygin et al., 2004; Sevdalis and
Keller, 2011) of two human agents (i.e. the typical displays). Displays derived from
point-lights (Johansson, 1973) attached to the major joints of two human agents are
especially effective for studying action understanding and its neural substrates from a
third-person perspective (Centelles et al., 2011; Neri et al., 2006; Rose and Clarke, 2009).
We created the atypical displays by altering the original interaction between the two
agents in the typical social displays, while maintaining the same low-level information
overall. This was achieved by combining the motion data of one agent from one of the
typical displays with the motion data of the other agent from a different typical display.
In this way we obtained displays for which the social congruency of the agents’
interaction was atypical when compared to the original (typical) displays, although the
action performed by each individual agent was always the same. We also included a
visually inverted condition for each one of the socially typical and atypical displays as a
further control condition. Inverting the displays reduce the overall level of perceived
coherence (Pavlova and Sokolov, 2000; Petrini et al., 2010; Shipley, 2003; Sumi, 1984;
Troje and Westhoff, 2006) while maintaining the same low-level visual information and
level of congruency of the social interaction. To examine whether the precuneus would
be involved without any explicit reflection about the goals and intentions of the two
agents (Brass et al., 2007; de Lange et al., 2008), we asked participants to carry out an
unrelated task.
We hypothesised that presentation of atypical social interaction (incongruent displays)
would elicit greater activation in the precuneus (next to frontal and occipital areas) than
that of typical social interaction, based on evidences of greater precuneus activity as a
results of violations of social expectations (Cloutier et al., 2011). We also expected, based
on connectivity studies (Margulies et al., 2009) and the nature of the present task, that the

6
precuneus activation would be mostly located in its central and posterior part and
correlate and/or being functionally connected with cognitive and visual cortical regions.
MATERIALS AND METHODS
Pre-behavioural phase: stimulus selection
Thirty-two English native speaker participants (16 females and 16 males with an
average age of 23.5) were recruited for the experiment. The study had been approved by
the Ethics Committee of the Faculty of Information and Mathematical Sciences,
University of Glasgow, and all participants gave informed consent to participate.
Participants received a monetary incentive for their participation.
For the display creation we acquired 3D motion capture data from two people
interacting in different ways, using a Vicon FX40 system (Centelles et al., 2011; Neri et
al., 2006; Rose and Clarke, 2009). The dyadic point-light displays showing three
‘original’ interactions (swinging, clapping and lifting) were manipulated to obtain six
‘backward’ conditions (where one agent moved forward as in the original display, while
the other agent moved backward), six ‘desynchronised’ conditions (where one agent was
put out of phase with respect to the other by 1s) and six ‘incongruent’ conditions (where
one agent from one original display was combined with the other agent from a different
original display).
The visual stimuli were presented on a Sony Trinitron screen with resolution 1280 x
1024 pixels and a refresh rate of 60 Hz, by a Dell laptop running Windows XP. The
resulting displays were presented in randomised order to participants using Presentation
13.1 (Neurobehavioral Systems, Albany, CA). Participants had to judge whether the two
agents in the displays were interacting or not. After each display presentation participants
gave their response and a written description of the display before viewing the next
stimulus. Each display was repeated twice in two separate blocks where participants were
asked to respond either immediately after the display ended, or 2s after it ended. A beep
informed participants when to give their response. This further experimental condition
was introduced to control for any effects of time on detection of social interaction, and
was called ‘response time’ in the analysis.
7
A model selection log linear analysis (n=32) was run on the obtained binary responses of
social interaction to test which categorical factors, and associations between categorical
factors, best explained the data. The backward elimination statistics gave as output the
final model that best fit the data (Likelihood Ratio for goodness of fit: χ² = 13.621, P =
.849, the closer the P value is to 1 the better the model fitting) showing that gender (χ² =
11.317, p = .001), display (χ² = 328.082, p < .001), and response time (χ² = 4.160, p =
.021) significantly affect the number of interaction responses. The incongruent displays
received the lower number of interaction responses, and the number of responses given
by the male (original = 96%; backward = 60%; desynchronised = 56%; incongruent =
20%) and female (original = 100%; backward = 66%; desynchronised = 65%;
incongruent = 34%) participants for the incongruent displays was different. Female
participants still responded to social interaction at a level above chance (the chance level
was calculated by considering that the chance of an original interaction display to appear
was 17
) and gave twice the number of interaction responses as the males for these
incongruent displays. To check this observation we carried out a model selection log
linear analysis separately for the four display categories (original, backward,
desynchronised, and incongruent). The backward elimination statistics indicated that
gender, but not response time, significantly affected the number of interaction responses
for the incongruent display (χ² = 10.437, p = .004, after applying Bonferroni correction
for four comparisons). Females gave a percentage of interaction responses at a level
above chance (Binomial test: P < .001) for the incongruent displays, while males did not
(Binomial test: P = .117). Finally, no differences between the two groups were found in
the social interpretation of the displays.
Selection criteria for fMRI study
Based on the findings of the behavioural experiment only males were recruited for the
fMRI experiment, because males were found to be significantly better in discriminating
between socially typical (original) and atypical (incongruent) displays. Furthermore, we
selected two out of the three original displays (i.e. the swinging and clapping displays) to
increase the statistical power by maintaining a ratio 1:1 between typical and atypical

8
(incongruent) displays. The atypical displays depicted one agent from the swinging
display with the other agent from the clapping display.
fMRI experiment: Participants, Stimuli and Task
Ten right-handed males (mean age 25 years, range 22-32 years), with normal or corrected
to normal vision, participated in the functional magnetic resonance imaging (fMRI)
experiment. Participants were in good health with no past history of psychiatric or
neurological disease and gave informed written consent to the protocol, which had been
approved by the Ethics Committee of the Faculty of Information and Mathematical
Sciences, University of Glasgow.
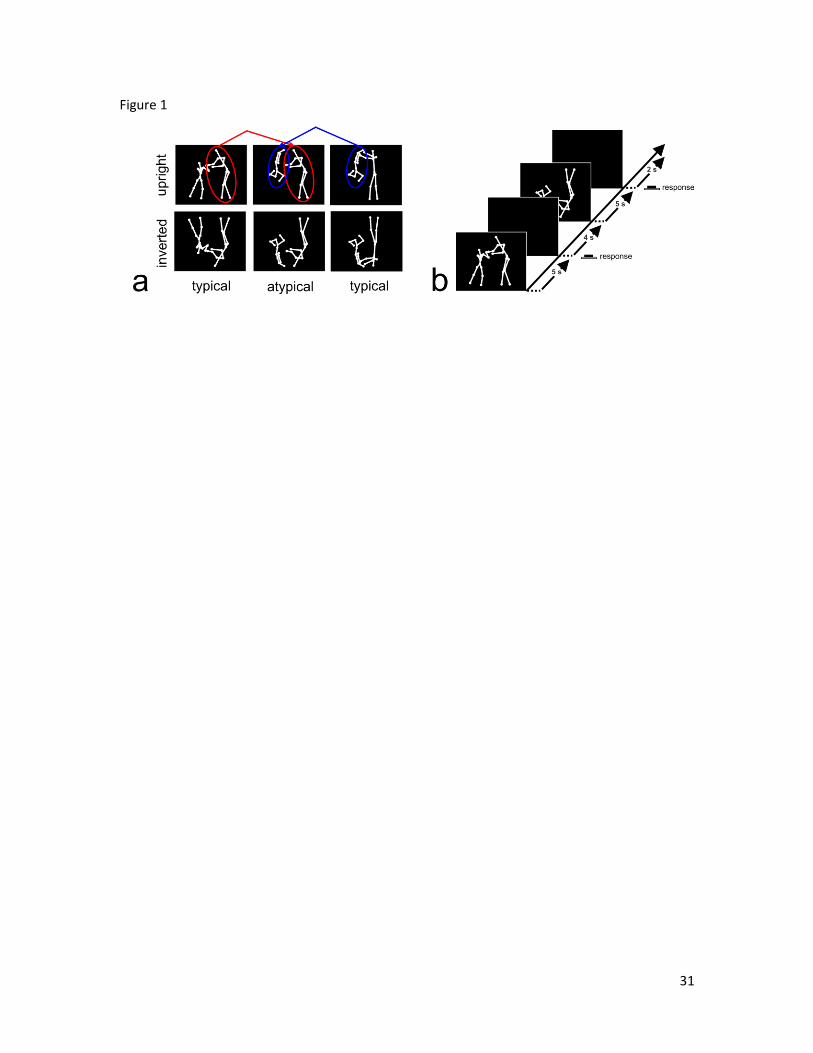
We scanned participants while they watched four kinds of point-light dyadic displays
representing the movements of two human agents (Figure 1a). The four display categories
used in the fMRI study included: upright typical displays (the two agents were swinging
or clapping: Supplementary Movie 1 and 2); upright atypical displays (one agent was
swinging and the other clapping: Supplementary Movie 3 and 4); inverted typical
displays (same clip of upright typical displays but shown upside and down:
Supplementary Movie 5 and 6); inverted atypical displays (same clip of upright atypical
displays but shown upside and down: Supplementary Movie 7 and 8). The visual stimuli
had duration of 5s and consisted of 60 fps displays with a resolution of 376 X 376 pixels.
Visual clips were projected onto a screen at the back of the participant’s head using a
video projector (Panasonic PT-D7700E DLP). The participant lay supine in the MRI
scanner and viewed the display through a mirror mounted on a 32 channel quadrature
head coil.
The fMRI event-related design is described in Figure 1b. After each stimulus
presentation (which lasted 5s) participants had to judge whether the display they just saw
was the same or different from the previous one. The task was not relevant to the aim of
the experiment and its purpose was to maintain the participants’ attention on the dyadic
displays throughout the whole experiment. Participants were asked, while lying in the
scanner, to respond by pressing one of two buttons on an fMRI compatible button pad.
The order of stimulus presentation and the duration of the inter stimulus interval (ISI)
was randomised for each participant within each run. The ISI was a blank screen
9
presented for an average of four seconds, with this duration varying randomly between
two and six seconds. During the experiment participants were scanned twice in two 18-
minute runs each showing the 8 stimuli (2 upright typical displays, 2 upright atypical
displays, 2 inverted typical displays, and two inverted atypical displays) 15 times, for a
total of 120 presentations. Hence, each display category was presented 30 times in each
run, for a total of 60 presentations during the overall experiment.
------- Figure 1 -------
Data Acquisition and Pre-processing Analysis
T1 and T2* weighted scans were acquired using a 3T Tim Trio Siemens scanner. The
functional scan consisted of two runs (TR = 2000ms; TE = 30ms; 32 Slices; 3mm3
isovoxel; 70x70 image resolution; 540 Volumes). The anatomical scan of whole brain
structure was acquired using a 3D MP-RAGE T1-weighted sequence (192 slices; 1mm3
isovoxel; Sagittal Slice; TR = 1900ms; TE = 2.52; 256x256 image resolution).
The data were analysed by using Brain Voyager QX 2.2
(http://www.BrainVoyager.com). The functional data (DICOM format) were loaded and
converted into Brain Voyager’s internal FMR data format. A standard pipeline of pre-
processing of the data was performed for each participant (Goebel et al., 2006). Slice scan
time correction was performed using sinc interpolation based on information about the
TR and the order of slice scanning. In addition, 3-D motion correction was performed to
detect and correct for small head movements by spatial alignment of all the volumes of a
participant to the first volume by rigid body transformations. Estimated translation and
rotation parameters never exceeded 3mm. The anatomical data (DICOM format) of each
participant were loaded and converted into Brain Voyager’s internal VMR data format
(Goebel et al., 2006). The data were then aligned with the AC-PC (anterior commissure -
posterior commissure plane) and transformed into Talairach standard space. To transform
the functional data into Talairach space, the functional time series data of each participant
was first co-registered with the participant’s 3-D anatomical data, followed by the same
transformations of 3-D anatomical data applied to the functional data. This step results in
normalised 4-D volume time course (VTC) data. Normalisation was performed

10
combining a functional-anatomical affine transformation matrix, a rigid-body AC-PC
transformation matrix, and an affine Talairach grid scaling step. The alignment of the
functional and anatomical data was then optimised by manual adjustment to reduce as
much as possible the geometrical distortions of the images.
Analysis
First level analysis: Analyses were performed on the data of individual participants using
multiple linear regression of the BOLD-response time course in each voxel using four
predictors (typical-upright, atypical-upright, typical-inverted, atypical-inverted). For each
run of each participant’s event-related data, a BrainVoyager protocol file (PRT) was
derived, representing the onset and 3s duration of the events for the different conditions.
Predictors’ time courses were adjusted for the haemodynamic response delay by
convolution with a haemodynamic response function.
Second level analysis: Statistical evaluation of group data was based on a second-level
GLM random effects analysis. To detect the areas responding to social interaction we
contrasted the brain activity of participants when viewing the upright and inverted
atypical displays with the brain activity when viewing upright and inverted typical
displays. The obtained statistical map was corrected for multiple comparisons using
cluster-size thresholding (Forman et al., 1995; Goebel et al., 2006). In this method, for
each statistical map the uncorrected voxel-level threshold was set at P < 0.001
(uncorrected), and then was submitted to a whole-brain correction criterion based on the
estimate of the map’s spatial smoothness and on an iterative procedure (Monte Carlo
simulation) for estimating cluster-level false-positive rates (i.e. the theoretical number of
“false” positive voxels that are activated in each random map). After 1000 iterations the
minimum cluster-size that yielded a cluster-level false-positive rate of 5% was used to
threshold the statistical map. The minimum cluster-size for P < .05 is reported according
to the original table (in voxels) and the interpolated table (in mm³).
To examine in detail the effect size for social valence (typical, atypical) and stimulus
orientation (upright, inverted) factors within the assessed regions, the average β-estimates
were subjected to a two-way ANOVA for repeated measures. Additionally, we measured
the correlation between the average β-estimates of the defined regions of interest (ROIs)

11
separately for each condition (typical-upright, atypical-upright, typical-inverted, and
atypical-inverted).
Correlations and Granger causality: after assessing the ROIs we explored the correlation
between the levels of activity in the precuneus with those in the other assessed regions
using linear regression analysis. We also examined the directional influences between the
bilateral precuneus and the other ROIs using Granger causality mapping (GCM), which
has recently been used to map effective connectivity in the human brain (Jabbi and
Keysers, 2008; McKay et al., 2012; Roebroeck et al., 2005; Schippers et al., 2010). We
calculated GCM between the bilateral precuneus and the entire brain for the duration of
the experiment, and then overlapped the granger causality map onto the ROIs map to
investigate whether the precuneus was influenced by or influenced the other regions of
interest during the experiment. Granger causality is a linear autoregressive model of time
series that is based on the concept that each data point Xt (the measured value at time t)
can be modelled as a linear combination of k previous data points, starting from a lag l
≥1. Granger (1969) then proposed that if the amount of variance explained by this new
model is significantly higher than that of the purely autoregressive model, it is said that Y
“Granger causes” X. GCM adds information about directionality and causation to the
correlation analysis, by examining the effective connectivity between the two seed
regions (left and right precuneus) and the other experimentally defined regions of interest.
Although several researchers have hypothesised that Granger causality might give rise to
spurious results in response to differences in haemodynamic response functions between
brain areas (e.g. Roebroeck et al., 2005), a recent study demonstrated that spurious
findings at the group level of analysis are actually rare, and that GCM is a valid method
to determine the dominant direction of information flow (Schippers et al., 2011).
However, as Smith et al. (2012) indicate even at the group level of analysis the GCM
results could be driven by systematic differences in haemodynamic lag between different
brain areas. As we cannot completely exclude this possibility, we will interpret the GCM
results as an extension of the contrast and correlation analyses.
RESULTS
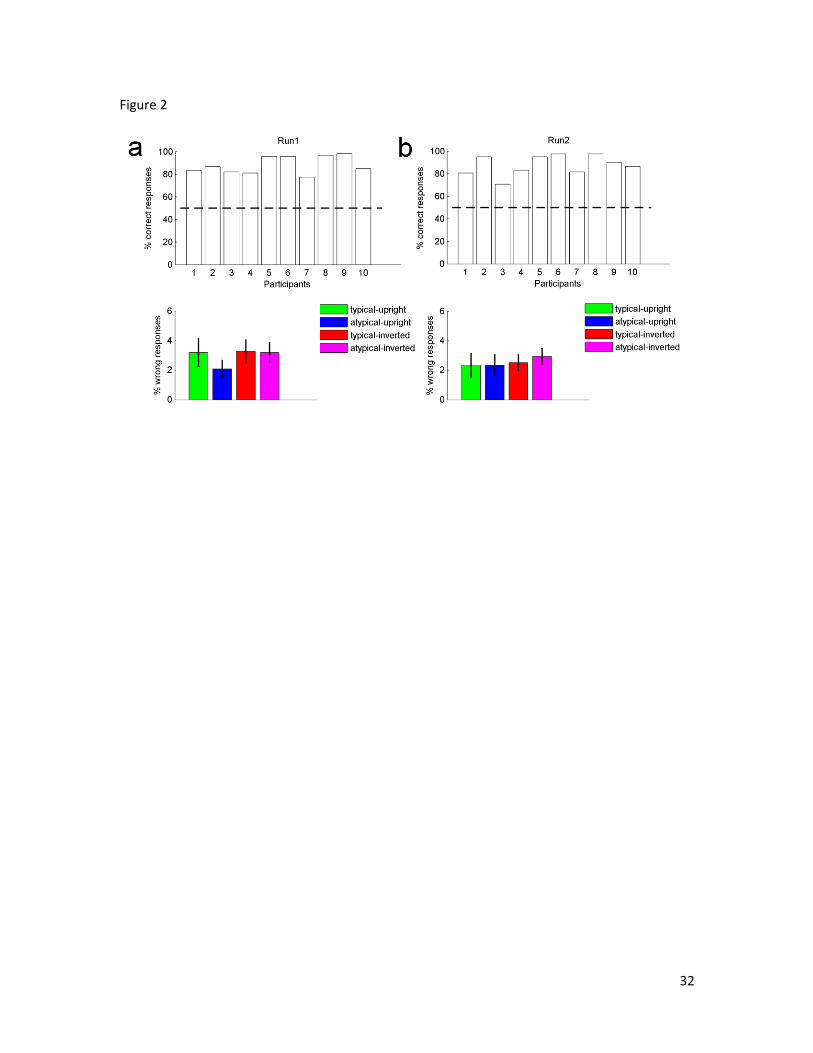
Behavioural results

12
The aim of the behavioural task was to keep participants attention monitored during the
scan and make sure that the social context was unattended. Participants had to judge
whether the display presented was the same or different from the one presented just
before. Thus the task was unrelated to the social context displayed in the clips, but
looking at the participants responses was important to establish whether they were able to
detect the displays differences at a level above chance, and whether the task difficulty
changed with the display type (typical-upright, atypical-upright, typical-inverted, and
atypical-inverted). Indeed, if task difficulty changed with the type of display then this
might have affected the data when contrasting the brain activity elicited by atypical vs.
typical. To this end we examined the percentage of correct responses for each participant
(Figure 2 top diagrams), and we compared the percentage of wrong responses received by
the four different kind of displays (Figure 2 bottom diagrams) by carrying out a one
sample t-test analysis and 2(runs) x 4(displays) repeated measures ANOVA respectively.
Figure 2 shows that all participants were able to do the task at a level above chance (run1:
all t(118) ≥ 7.084, p < 0.001; run2: all t(118) ≥ 2.596, p < 0.05), and that the amount of
wrong responses did not depend neither on the kind of display presented (F(3, 7) = 3.671,
p = 0.071) nor on the experimental run (F(1, 9) = .976, p = 0.349). It also did not depend
on an interaction between these two factors (F(3, 7) = 1.071, p = 0.421).
------- Figure 2 -------
fMRI results
The contrast (atypical-upright + atypical-inverted) - (typical-upright + typical-inverted)
returned nine different regions: right middle frontal gyrus (rMFG), right cuneus (rC),
right frontal sub-gyral (rSG), right precuneus (rPR), left middle frontal gyrus (lMFG)
extending to the right hemisphere, left precuneus (lPR), two distinct regions in the left
middle occipital gyrus (lMOG- brodmann area19- and lMOG- brodmann area 37), and
left superior parietal lobule (lSPL). The minimum cluster threshold that yielded a cluster-
level false-positive rate of 5% was k = 3, 81mm³. The anatomical location and details of
the activated foci are listed in Table 1a.
------- Table 1 -------

13
In 2009 Kriegeskorte and colleagues discussed the 'double dipping' issue, by
demonstrating that the use of the same dataset for selection and selective analysis might
give distorted descriptive statistics and invalid statistical inference whenever the results
statistics are not inherently independent of the selection criteria under the null hypothesis.
In other words, and more specifically to our case, using the same data for detecting the
regions of interest (ROIs) and for carrying out further regions of interest analyses might
give rise to spurious significant results. Kriegeskorte et al. (2009) provided a few options
for overcoming this ‘circularity’ problem. Here we applied one of these options and
divided the data into two subsets, one to detect the ROIs using the contrast of interest,
and the other to perform the additional ROI analysis. To account for the temporal
dependencies within experimental runs the two data subsets were created by randomly
selecting the first run for half of the subjects and the second run for the other half of the
subjects. The contrast (atypical-upright + atypical-inverted) - (typical-upright + typical-
inverted) carried out on the first data subset returned seven out of the nine regions we
obtained when including all the data: right middle/inferior frontal gyrus (rM/IFG), right
middle frontal gyrus (rMFG), right precuneus, left precuneus (lPR), two distinct regions
in the left middle occipital gyrus (lMOG- brodmann area19 and lMOG- brodmann area
37), and left superior parietal lobule (lSPL). The locus of activation and peak of
activation for each one of these seven regions are shown in the supplemental figures by
using brain voyager and SPM Anatomy toolbox, respectively. To control for multiple
comparisons, the obtained map was adjusted to an initial P value of <.001 (uncorrected)
and then submitted to a volume-based cluster-threshold algorithm yielding a new map
thresholded at P<0.05 (corrected) with a minimum cluster threshold. The minimum
cluster threshold that yielded a cluster-level false-positive rate of 5% was k = 3, 81mm³.
The anatomical location and details of the activated foci are listed in Table 1b. The
results of the contrast analysis obtained when using all the data and when using only a
subset of data are very consistent suggesting that the used number of participants,
although small, is sufficient. As the size of the data sample did not affected the results
significantly. This conclusion is further reinforced by the low within-subjects variability
in beta estimates as shown in Figure 3.
14
The selective analyses were carried out only on the ROIs obtained from this second
detection analysis (Figure 3b and Table 1b), because they were found in the total and
subsets data detection analysis and thus we could exclude that they depended on the
randomisation criteria used when dividing the data into two subsets. A two-way ANOVA
with social valence (typical, atypical) and stimulus orientation (upright, inverted) as
within-subject factors was carried out on the average β-estimates of the assessed clusters
as derived from the second subset of data. A significant main effect of social valence was
found for all the ROIs (all F(1, 9) ≥ 4.987, all p ≤ 0.05), whereas a significant main effect
of stimulus orientation was found for the right middle frontal gyrus (F(1, 9) = 6.761, p =
0.029), the right precuneus (F(1, 9) = 30.434, p < 0.001; Figure 3b), and the left middle
occipital gyrus-BA19- (F(1, 9) = 15.047, p = 0.004). No significant interaction between
social valence and stimulus orientation was found.
------- Figure 3 -------
The correlation between the ROIs β-estimates was assessed by performing a linear
regression analysis separately for the four experimental conditions. Figure 4 summarises
the significant correlations in the form of a half-matrix, by graphically displaying the
level of correlation for the typical (on the left hand side) and atypical (on right hand side)
conditions, and for the upright (top diagrams) and inverted (bottom diagrams) conditions.
Visual inspection of Figure 4 immediately reveals some consistent findings. For example,
the activity in the right precuneus negatively correlated with that of the two ROIs in the
left middle occipital gyrus (BA19 and BA37) for the typical upright, and with that of left
precuneus, middle occipital gyrus (BA19), and superior parietal lobule for the typical-
inverted. This result is interesting not only because the right precuneus is the only region
to negatively correlate with the activity in other obtained regions of interest, but also
because this negative correlation is restricted to the typical displays, that is, no correlation
between the right precuneus and any other region was found for the atypical displays. The
activity of the left precuneus correlated with a greater number of ROIs when going from
the upright to the inverted conditions. For example, the activity in the left precuneus was
found to correlate with that of the left middle occipital gyrus (BA19) for all the different

15
display conditions, but was found to correlate also with the activity in the superior
parietal lobule only for the inverted display conditions.
------- Figure 4 -------
In order to examine the direction of information flow within the revealed network,
effective connectivity analyses were conducted using GCM (Roebroeck et al., 2005)
across the ten participants using a fixed effect approach. This produced cortical maps
depicting effective connectivity, consisting of source and target activations. Source
activations represent regions whose activation consistently preceded that of the seed
region and thus are hypothesised to have exerted task-related causal influence on the
cortical activation of the seed region. Target activations on the other hand represent
regions that are consistently activated after the seed region and thus are hypothesised to
be causally influenced by the seed region. Due to the aim of the present study we focused
on two seeds, the left and right precuneus. Effective connectivity analyses revealed that
the left precuneus receives neural input from the right middle/inferior frontal gyrus, the
middle frontal gyrus, and the superior parietal lobule, and in turn projects neural input to
the right precuneus, and the middle occipital gyrus (BA37). The middle occipital gyrus
(BA19), in contrast, appeared to both receive and project neural inputs from and to the
left precuneus (Figure 5a). The same analysis was carried out over the right precuneus,
which was consistently receiving neural inputs from all the defined ROIs (Figure 5b), but
did not project to any of them. This confirmed that the flow of neuronal information was
going from the left precuneus to the right precuneus (Figure 5a), since the right precuneus
was a target activation for both GCM analyses.
------- Figure 5 -------
DISCUSSION
Everyday we are surrounded by people engaging in social interaction, and often we are
not actively involved in said interactions or do not pay much attention to them. Still we
can understand the social meaning of the observed interactions even just by looking at

16
how people move in conjunction. In the present study we examined the role of the
precuneus in unattended third-person perspective of others’ social interaction, and show
that its activation was greater for atypical (representing the incongruent biological motion
of two people) than typical (representing the congruent motion of two people) displays.
Our findings support previous studies showing that this region plays a central role in
social cognition (e.g. Adolph, 2009; Amodio and Frith, 2006; Decety and Lamm, 2007;
Frith and Frith, 2006; Mitchell et al., 2006a; Saxe and Wexler, 2005; Spreng et al., 2009),
and in third-person perspective of others’ social interaction (Iacoboni et al., 2004; Ruby
& Decety, 2001; Farrer & Frith, 2002; Vogeley et al., 2004). We also showed that the
right precuneus, but not the left precuneus, responded with significantly greater activation
to upside-down than upright displays, indicating that this area is sensitive not only to the
social context portrayed in the displays, but also to a decrease in biological motion
recognisability and coherency (McKay et al., 2012). The involvement of the precuneus
which we have shown does not depend on differences in low-level features and
complexity of the visual displays, or on explicit reflection about the goals and intentions
of the two agents (Brass, Schmitt, Spengler, & Gergely, 2007; de Lange, Spronk,
Willems, Toni, & Bekkering, 2008). Indeed, we matched as closely as possible the low-
level information and the complexity of the typical and atypical displays (i.e. we created
the atypical displays interchanging the agents’ motion data from the typical displays), and
asked participants to perform a socially unrelated (orthogonal) task.
Even if it would have been informative to compare the precuneus involvement in
conditions of attended and unattended social meaning, the reasons why we did not
include the attended condition are several. First of all, we would have been forced to have
the attended condition always following the unattended (Iacoboni et al., 2004). Indeed,
once the viewers paid attention to the social meaning we were concerned that participants
could not refrain from paying attention to it also during the unattended. The same would
apply if we chose to add a condition in which participants actively participated to the
observed interactions, in that the active condition should have always followed the
passive. We wanted to avoid using a fixed order within design, as the results would have
been difficult to interpret. For example, it would have been difficult to disentangle the
response of the precuneus elicited by the attentional shift from that elicited purely by
17
changes in social interaction. And introducing an active participation of the viewer during
fMRI scanning is not straight forward, as the motor activity possible in the scanner is
very limited. However, in future it would be important to find the optimal way to
compare these conditions in one experiment while avoiding these methodological
constrains. A possibility would be to use a between-subjects design, although it might be
difficult to account for inter-groups variability and differences. Finally, in the present
study we scanned only male participants. This decision was taken based on the pre-
behavioural study results, which showed that males and females significantly differ in the
degree of interaction perceived in our displays. That is, females perceived social
interaction in the atypical displays to a much higher degree than males. This behavioural
difference may reflect sex-specific functional neuroanatomy of the precuneus as shown
recently by Zhang and Li (2012). This is a very interesting possibility that should be
specifically addressed in future studies as it could elucidate sex-related differences in
neurological disorders that result in social impairment.
The stronger activation of the precuneus for incongruent than congruent social cues has
been previously reported when contrasting static pictures of politicians with incongruent
and congruent political views (Cloutier et al., 2011), sentences with incongruent and
congruent information about voice-based speakers’ identity (Reid et al., 2009), statements
with incongruent and congruent information about the beliefs towards an out-group
(Bruneau and Saxe, 2010), and actions with incongruent (e.g. cutting up bank notes) and
congruent functional meaning towards money (Becchio et al., 2011). That is, the
precuneus shows significantly stronger activation when social expectations are violated,
at least in typical population, because no difference in activity was found within this
region in a group of high-functioning autistics (Reid et al., 2009). The stronger activation
of the precuneus elicited by our atypical displays may have a similar explanation, because
the actions of the two human agents in these displays was clearly mismatched, thus
violating the social expectation of the observer. Here we show that explicitly attending to
the social context is not a pre-requisite of the precuneus activation in response to
incongruent social behaviour.
Based on the connectivity partition drawn by Margulies et al. (2009) we can confine the
preferential recruitment of the precuneus for atypical as opposed to typical social displays

18
to its central and posterior part. This is what we would expect, in this task, since the
central part of the precuneus has been described as having connection with cognitive and
associative cortical regions and its posterior part with visual cortical regions (e.g.
Margulies et al., 2009). In support of this interpretation we have found that the other
ROIs showing stronger activation for atypical than typical displays were part of
frontoparietal (cognitive) and occipital (visual) regions. The precuneus is strongly
connected to regions such as the superior parietal lobule/Intraparietal sulcus (SPL/ITS),
middle/inferior frontal gyrus (MFG/IFG) and occipital regions found here (Cavanna and
Trimble, 2006; Margulies et al., 2009). Our effective connectivity analysis shows that
both the right and left precuneus receive neural information from left SPL/ITS and right
MFG/IFG. In their review Cavanna and Trimble (2006) indicate how the posterior part of
the precuneus subserve episodic memory retrieval. Participants’ tentative to retrieve
episodic information when viewing people interacting could explain why greater activity
was found in response to atypical (incongruent) social displays. Episodic memories of
such interactions are probably not easily available. A coordinates-based research using
the Brede database (http://neuro.imm.dtu.dk/services/brededatabase/) indicates that
similar peaks of activity to ours in the precuneus have been mostly reported for
visuospatial and attention tasks (e.g. Buchel et al., 1998; Frankenstein et al., 2001;
Gitelman et al., 2002) for tasks involving actions, emotions and perspective taking
(Aalto et al., 2002; Decety et al., 1997; Ruby and Decety, 2001) and for retrieval tasks
(e.g. Fink et al., 1996; Henke et al., 2003; McDermott et al., 1999; Tsukiura et al., 2002).
The variety of the precuneus functions identified in these studies (i.e. visuospatial,
attentional, social, and memory) may all be fundamental to explain the greater activation
we found in the present study for atypical social interactions. That is, the precuneus
through its widespread connectivity may act as cortical hub (similarly to the posterior
cingulate; e.g. Fransson and Marrelec, 2008; Leech and Sharp, 2014) gathering any
useful information to make sense of social situations that violate the observer
expectations. In simpler words, the precuneus may have to work harder and gather more
information through its widespread connections, when the meaning of the social
interaction is not easily interpretable. This conclusion is supported by studies indicating
how abnormalities in precuneus/posterior cingulate and their functional connectivity are

19
present in a variety of attentional and cognitive deficits (Bonnelle et al., 2011;
Castellanos et al., 2008; Sharp et al., 2011) as well as psychiatric and
neurodevelopmental disorders that result in social impairments (Bluhm et al., 2007;
Bluhm et al., 2009; Kennedy and Courchesne, 2008).
MFG/IFG is known to process the meaning of human actions (i.e. in terms of intentions
and goals), and to activate in conjunction with the precuneus when behaviorally relevant
though unattended stimuli are presented (Corbetta et al., 2008). Both IFG functions are of
relevance here and may both contribute to explain the area greater activity for atypical
social displays. For example, the peak of activation we found in the right MFG/IFG (44,
11, 33) is very similar to that found by Iacoboni et al. (2005; peak activation coordinates:
44, 10, 34) when contrasting ‘intention’ (e.g. drinking) with ‘action’ (e.g. grasping a cup)
displays in their fMRI experiment. Another, similar, peak of activation that very closely
resembles the activation we found in MFG/IFG was found by Gobbini, Koralek, Bryan,
Montgomery, & Haxby (2007) when contrasting social animations to animations with
random movements (45, 7, 33). The SPL/ITS processes biological motion and peak
activation coordinates similar to what we found were previously reported by Saygin et al.
(2004) when contrasting biological motion to stationary point-light displays (-27, -47, 43)
as well as scrambled biological motion to stationary point-light displays (-29, -48, 42).
Interestingly in the same study Saygin et al. (2004) also obtained a very similar peak of
activation (36, -4, 49) to our frontal middle frontal gyrus when comparing the brain
activation elicited by point-light displays against that elicited by stationary point-lights.
However, the middle frontal gyrus, in contrast to the MFG/IFG and SPL/ITS, in the
present study, seems to send neural information only to the right precuneus, while it
receives information from the left precuneus. Intriguingly, this asymmetry between left
and right precuneus also emerges in relation to the assessed occipital regions, with the
right precuneus receiving neural information and the left sending neural information to
these regions, respectively. Peaks of activation resembling ours in the two middle
occipital gyrus areas were found in a study by Thompson, Clarke, Stewart, & Puce (2005)
when comparing brain activation for fragmented body parts in motion to activation for
intact body parts in motion (-26, -80, 22), and when comparing activation for upright to

20
upside down displays (-46, -70, 6). Thus, these two occipital regions appear to work
together to make sense of atypical biological displays.
Notably, the different analyses consistently point to a functional asymmetry between
the left and right precuneus. That is, whilst the left precuneus was found to respond with
greater activation to atypical than typical displays, the right precuneus was found also to
respond with greater activity to upside down than upright displays. Whereas the level of
activity in the right precuneus correlated negatively with activity in the occipital regions
responding to atypical interaction, the level of activity in the left precuneus correlated
positively with these same areas. Finally, while the right precuneus received neural
information from all other assessed ROIs, the left precuneus received neural information
from some of them but also sent information to some others. The idea that the right and
left precuneus might have different functions is suggested by previous studies comparing
first- and third-person perspective taking. For example, Ruby & Decety (2001) found an
increase in regional cerebral blood flow (rCBF) in the right precuneus when contrasting
first-person perspective with the control condition, and in the left and right precuneus
when contrasting third-person perspective with the control condition and with the first-
person perspective. The same can be said also for Farrer & Frith (2002) who found
increased BOLD signal in the right precuneus during an ‘other-attribution’ condition
compared to control, and in the left and right precuneus during ‘other-attribution’ when
compared to ‘self-attribution’. Thus these results point to a more general function of the
right precuneus when compared to the left precuneus, and our study provides evidence of
the precuneus’ interhemispheric asymmetry. Future studies should aim to further test this
functional lateralisation, in order to refine our understanding of the precuneus’ functional
attributes.
According to previous studies, which used similar stimuli to ours (Centelles et al.,
2011), we assessed the conjoint implication of the ‘mentalizing’ (e.g. precuneus) and
‘mirror neuron’ or ‘action observation’ network (e.g. MFG/IFG and SPL/ITS). When
both observing and performing actions the mirror neuron system (Gallese et al., 2004;
Iacoboni et al., 2005; Rizzolatti and Craighero, 2004) or more generally the action
observation network (Calvo-Merino et al., 2006; Cross et al., 2009a; Cross et al., 2009b;
Grafton, 2009) is recruited. This system allows the observer to understand others’ actions

21
and goals through the action represented in the observer's own behavioral repertoire. On
the other hand, the mentalizing system (Amodio and Frith, 2006; Uddin et al., 2007; Van
Overwalle and Baetens, 2009), also known as theory of mind (ToM), enables the observer
to understand the goals of others’ intentions and beliefs as though the observer could read
the other's mind. A meta-analysis showed that when participants attend to human actions
that are unexpected these two systems are both recruited (Van Overwalle and Baetens,
2009). Although our study was not designed to tackle this issue, it shows that when we
need to understand atypical interactions between others, brain areas from different
networks are recruited. This might be because these interactions are out of our acquired
repertoire (Calvo-Merino, Glaser, Grezes, Passingham, & Haggard, 2005; Calvo-Merino,
Grezes, Glaser, Passingham, & Haggard, 2006; Cross, Hamilton, & Grafton, 2006;
Petrini et al., 2011). In this case, both the action observation and mentalizing networks
need to work together to concomitantly form a representation of the novel observed
interactions and achieve an understanding of its meaning (i.e. understanding the
intentions of the two human agents). Alternatively, the level of conjoint participation of
the action observation and mentalizing networks during social interaction could depend
on how much the observer of such interaction feels part of it (Schilbach, 2010; Schilbach
et al., 2013). Because here the observer maintained the same level of agency during the
whole experiment, it is unlikely that the participation of regions from the two networks
can be explained by a change in the observer’s sense of agency. However, the limited
number of brain regions (representative of the action observation and mentalizing system)
assessed in the present study could be a consequence of the low level of agency
experienced by the observer. Still, interactions out of the observer’s acquired repertoire
may also imply a different degree of the observer’s sense of agency. As Schilbach (2010)
already underlined, new experimental paradigms need to be developed to investigate the
contribution of these different factors and fully understand how our brain processes social
interaction.
CONCLUSION
We investigated brain activation during unattended third-person perspective of social
interaction. As hypothesised, we demonstrated the involvement of the central and

22
posterior precuneus and other brain regions known for processing social cues, goals and
meanings of humans’ actions. The precuneus discriminated between displays in which
the two agents were interacting in atypical ways from those in which they were
interacting in typical ways. Only the left precuneus, however, showed a more specific
response to incongruency in the social information, whereas the right precuneus showed a
more general response to less coherent visual displays. These results suggest, that
although the precuneus plays a crucial role in processing any violation of social
expectations, its right and left regions might have distinct roles. The reasons behind these
distinctions remain to be explored in future studies. Using similar stimuli and paradigm to
the present study would be also ideal to compare the precuneus activity in humans with
and without developmental disorders so to elucidate the role of this area, and its many
functional subdivisions, in social impairments.
AKNOWLEDGEMENTS
This study was supported by a grant from the ESRC (RES-060-25-0010).

23
Table 1a
Clusters of activation for (atypical-upright + atypical-inverted) - (typical-upright +
typical-inverted) assessed by using all data.
Table 1b
Clusters of activation for (atypical-upright + atypical-inverted) - (typical-upright +
typical-inverted) assessed by using two separate subsets of data.
Anatomical region Hemisphere Talairach Number of voxels
Effect sizea
t(9) P BA
b
Middle/Inferior frontal gyrus
right 45,11,33 950 5.42 0.0005 9 Cuneus right 26,-78,20 604 5.26 0.0005 18
Frontal sub-gyral right 23,-7,54 360 5.53 0.0004 6
Precuneus right 13,-68,47 551 5.24 0.0005 7
Middle frontal gyrus left 0,16,48 620 5.45 0.0005 6
Precuneus left -19,-67,46 364 5.49 0.0004 7
Middle occipital gyrus left -27,-82,16 395 5.64 0.0004 19
Superior parietal lobule left -30,-57,41 383 5.38 0.0005 7
Middle occipital gyrus left -45,-68,5 2310 5.44 0.0004 37 aEffect size = average F value for all voxels in the ROI.
bBrodmann area
Anatomical region Hemisphere Talairach Number
of voxels Effect size
a
t(9) P BA
b
Middle/Inferior frontal
gyrus
right 44,11,33 599 5.25 0.0005 9 Middle frontal gyrus right 32,-4,56 119 5.32 0.0005 6
Precuneus right 13,-70,46 417 5.69 0.0004 7
Precuneus left -19,-64,46 90 5.32 0.0005 7
Middle occipital gyrus left -26,-82,18 149 5.12 0.0006 19
Superior parietal lobule left -29,-56,40 236 5.84 0.0004 7
Middle occipital gyrus left -48,-67,6 329 5.61 0.0004 37 aEffect size = average F value for all voxels in the ROI.
bBrodmann area
24
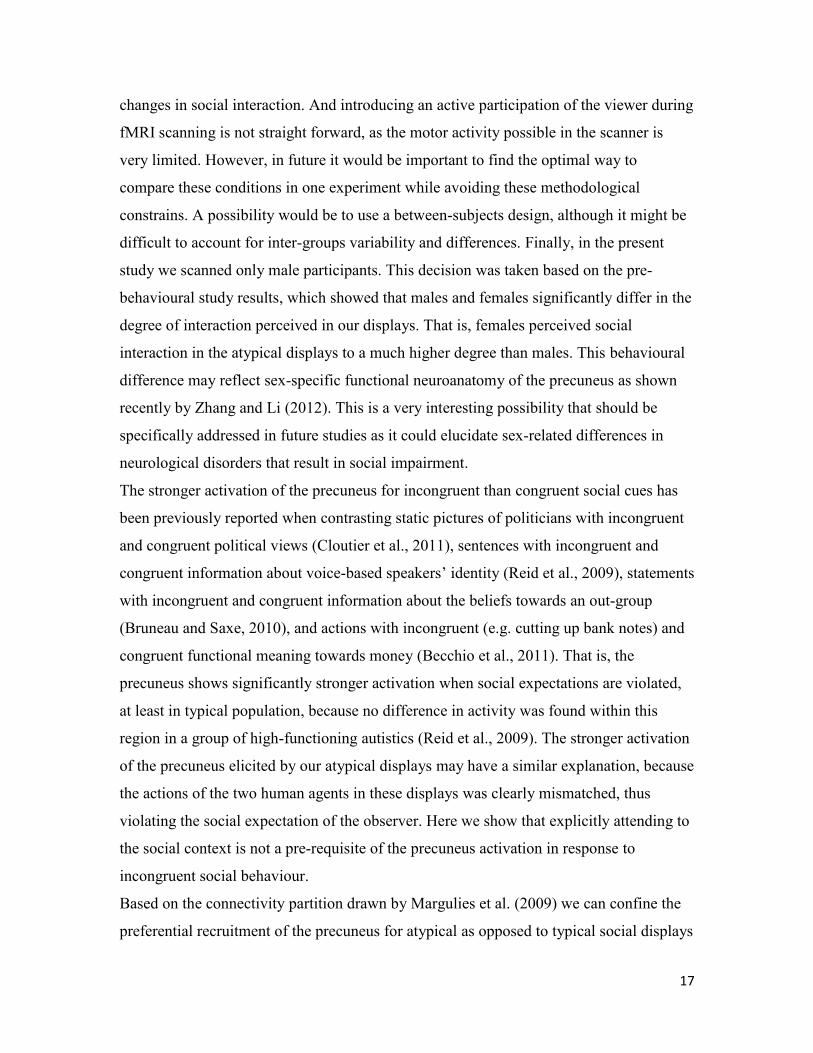
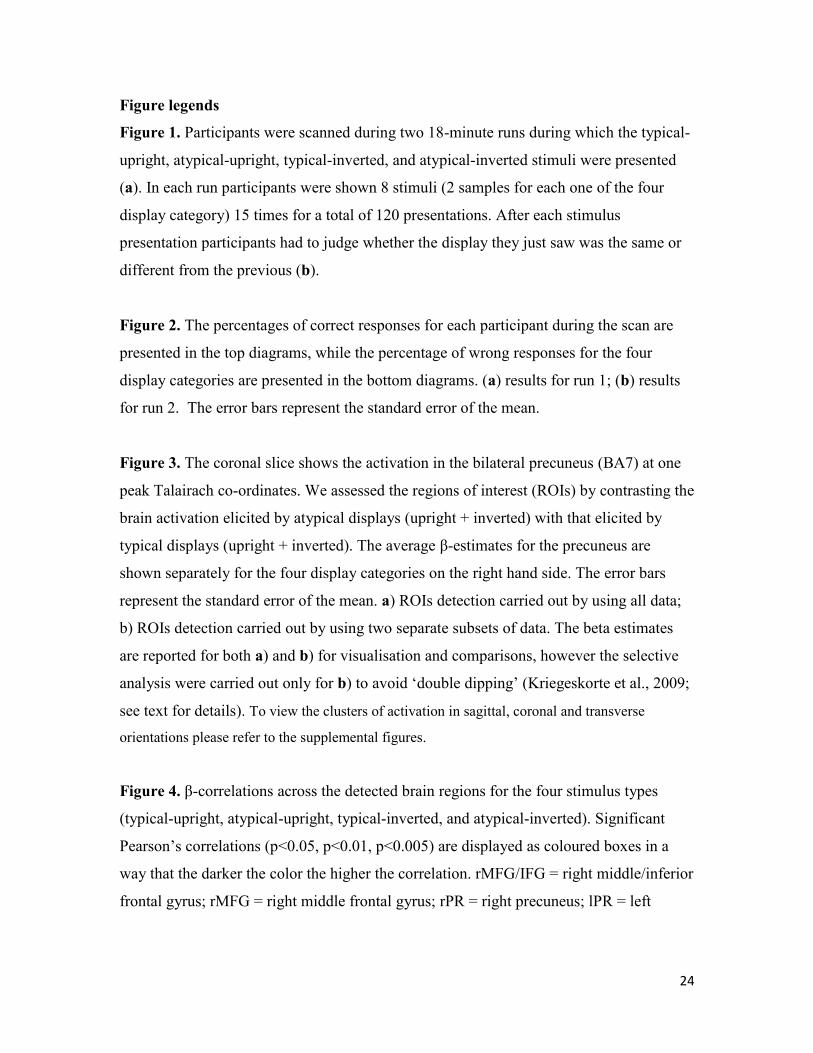
Figure legends
Figure 1. Participants were scanned during two 18-minute runs during which the typical-
upright, atypical-upright, typical-inverted, and atypical-inverted stimuli were presented
(a). In each run participants were shown 8 stimuli (2 samples for each one of the four
display category) 15 times for a total of 120 presentations. After each stimulus
presentation participants had to judge whether the display they just saw was the same or
different from the previous (b).
Figure 2. The percentages of correct responses for each participant during the scan are
presented in the top diagrams, while the percentage of wrong responses for the four
display categories are presented in the bottom diagrams. (a) results for run 1; (b) results
for run 2. The error bars represent the standard error of the mean.
Figure 3. The coronal slice shows the activation in the bilateral precuneus (BA7) at one
peak Talairach co-ordinates. We assessed the regions of interest (ROIs) by contrasting the
brain activation elicited by atypical displays (upright + inverted) with that elicited by
typical displays (upright + inverted). The average β-estimates for the precuneus are
shown separately for the four display categories on the right hand side. The error bars
represent the standard error of the mean. a) ROIs detection carried out by using all data;
b) ROIs detection carried out by using two separate subsets of data. The beta estimates
are reported for both a) and b) for visualisation and comparisons, however the selective
analysis were carried out only for b) to avoid ‘double dipping’ (Kriegeskorte et al., 2009;
see text for details). To view the clusters of activation in sagittal, coronal and transverse
orientations please refer to the supplemental figures.
Figure 4. β-correlations across the detected brain regions for the four stimulus types
(typical-upright, atypical-upright, typical-inverted, and atypical-inverted). Significant
Pearson’s correlations (p<0.05, p<0.01, p<0.005) are displayed as coloured boxes in a
way that the darker the color the higher the correlation. rMFG/IFG = right middle/inferior
frontal gyrus; rMFG = right middle frontal gyrus; rPR = right precuneus; lPR = left

25
precuneus; lMOG-19 = left middle occipital gyrus (BA19); lSPL = left superior parietal
gyrus; lMOG-37 = left middle occipital gyrus (BA37). N = negative correlation.
Figure 5. Axial slices showing the overlaps between the regions of interest and the map
returned by the GCM for two seeds: a) left precuneus; b) right precuneus. The map
differentiates between the cases in which the precuneus is the ‘source’ of neural
information for other brain regions (blue) and when is the ‘target’ of neural information
from other regions (green).

26
REFERENCES
Aalto S, Naatanen P, Wallius E, Metsahonkala L, Stenman H, Niem PM, Karlsson H. (2002): Neuroanatomical substrata of amusement and sadness: a PET activation study using film stimuli. Neuroreport 13(1):67-73.
Amodio DM, Frith CD. (2006): Meeting of minds: the medial frontal cortex and social cognition. Nat Rev Neurosci 7(4):268-77.
Becchio C, Skewes J, Lund ET, Frith U, Frith C, Roepstorff A. (2011): How the Brain Responds to the Destruction of Money. Journal of Neuroscience, Psychology, and Economics 4(1):1-10.
Belin P, Fecteau S, Bedard C. (2004): Thinking the voice: neural correlates of voice perception. Trends Cogn Sci 8(3):129-35.
Bluhm RL, Miller J, Lanius RA, Osuch EA, Boksman K, Neufeld RW, Theberge J, Schaefer B, Williamson P. (2007): Spontaneous low-frequency fluctuations in the BOLD signal in schizophrenic patients: anomalies in the default network. Schizophr Bull 33(4):1004-12.
Bluhm RL, Williamson PC, Osuch EA, Frewen PA, Stevens TK, Boksman K, Neufeld RW, Theberge J, Lanius RA. (2009): Alterations in default network connectivity in posttraumatic stress disorder related to early-life trauma. J Psychiatry Neurosci 34(3):187-94.
Bonnelle V, Leech R, Kinnunen KM, Ham TE, Beckmann CF, De Boissezon X, Greenwood RJ, Sharp DJ. (2011): Default mode network connectivity predicts sustained attention deficits after traumatic brain injury. J Neurosci 31(38):13442-51.
Brass M, Schmitt RM, Spengler S, Gergely G. (2007): Investigating action understanding: inferential processes versus action simulation. Curr Biol 17(24):2117-21.
Bruneau EG, Saxe R. (2010): Attitudes towards the outgroup are predicted by activity in the precuneus in Arabs and Israelis. Neuroimage 52(4):1704-11.
Buchel C, Josephs O, Rees G, Turner R, Frith CD, Friston KJ. (1998): The functional anatomy of attention to visual motion. A functional MRI study. Brain 121 ( Pt 7):1281-94.
Calvo-Merino B, Grezes J, Glaser DE, Passingham RE, Haggard P. (2006): Seeing or doing? Influence of visual and motor familiarity in action observation. Curr Biol 16(19):1905-10.
Castellanos FX, Margulies DS, Kelly C, Uddin LQ, Ghaffari M, Kirsch A, Shaw D, Shehzad Z, Di Martino A, Biswal B and others. (2008): Cingulate-precuneus interactions: a new locus of dysfunction in adult attention-deficit/hyperactivity disorder. Biol Psychiatry 63(3):332-7.
Cavanna AE, Trimble MR. (2006): The precuneus: a review of its functional anatomy and behavioural correlates. Brain 129(Pt 3):564-83.
Centelles L, Assaiante C, Nazarian B, Anton JL, Schmitz C. (2011): Recruitment of both the mirror and the mentalizing networks when observing social interactions depicted by point-lights: a neuroimaging study. PLoS One 6(1):e15749.
Cherkassky VL, Kana RK, Keller TA, Just MA. (2006): Functional connectivity in a baseline resting-state network in autism. Neuroreport 17(16):1687-90.
Cloutier J, Gabrieli JD, O'Young D, Ambady N. (2011): An fMRI study of violations of social expectations: when people are not who we expect them to be. Neuroimage 57(2):583-8.
Corbetta M, Patel G, Shulman GL. (2008): The reorienting system of the human brain: from environment to theory of mind. Neuron 58(3):306-24.
Cross ES, Hamilton AF, Kraemer DJ, Kelley WM, Grafton ST. (2009a): Dissociable substrates for body motion and physical experience in the human action observation network. Eur J Neurosci 30(7):1383-92.
Cross ES, Kraemer DJ, Hamilton AF, Kelley WM, Grafton ST. (2009b): Sensitivity of the action observation network to physical and observational learning. Cereb Cortex 19(2):315-26.

27
de Gelder B, Van den Stock J, Meeren HK, Sinke CB, Kret ME, Tamietto M. (2010): Standing up for the body. Recent progress in uncovering the networks involved in the perception of bodies and bodily expressions. Neurosci Biobehav Rev 34(4):513-27.
de Lange FP, Spronk M, Willems RM, Toni I, Bekkering H. (2008): Complementary systems for understanding action intentions. Curr Biol 18(6):454-7.
Decety J, Grezes J, Costes N, Perani D, Jeannerod M, Procyk E, Grassi F, Fazio F. (1997): Brain activity during observation of actions. Influence of action content and subject's strategy. Brain 120 ( Pt 10):1763-77.
den Ouden HE, Frith U, Frith C, Blakemore SJ. (2005): Thinking about intentions. Neuroimage 28(4):787-96.
Farrer C, Frith CD. (2002): Experiencing oneself vs another person as being the cause of an action: the neural correlates of the experience of agency. Neuroimage 15(3):596-603.
Fecteau S, Belin P, Joanette Y, Armony JL. (2007): Amygdala responses to nonlinguistic emotional vocalizations. Neuroimage 36(2):480-7.
Fink GR, Markowitsch HJ, Reinkemeier M, Bruckbauer T, Kessler J, Heiss WD. (1996): Cerebral representation of one's own past: neural networks involved in autobiographical memory. J Neurosci 16(13):4275-82.
Forman SD, Cohen JD, Fitzgerald M, Eddy WF, Mintun MA, Noll DC. (1995): Improved assessment of significant activation in functional magnetic resonance imaging (fMRI): use of a cluster-size threshold. Magn Reson Med 33(5):636-47.
Frankenstein UN, Richter W, McIntyre MC, Remy F. (2001): Distraction modulates anterior cingulate gyrus activations during the cold pressor test. Neuroimage 14(4):827-36.
Fransson P, Marrelec G. (2008): The precuneus/posterior cingulate cortex plays a pivotal role in the default mode network: Evidence from a partial correlation network analysis. Neuroimage 42(3):1178-84.
Gallese V, Keysers C, Rizzolatti G. (2004): A unifying view of the basis of social cognition. Trends Cogn Sci 8(9):396-403.
Gitelman DR, Parrish TB, Friston KJ, Mesulam MM. (2002): Functional anatomy of visual search: regional segregations within the frontal eye fields and effective connectivity of the superior colliculus. Neuroimage 15(4):970-82.
Goebel R, Esposito F, Formisano E. (2006): Analysis of functional image analysis contest (FIAC) data with brainvoyager QX: From single-subject to cortically aligned group general linear model analysis and self-organizing group independent component analysis. Hum Brain Mapp 27(5):392-401.
Grafton ST. (2009): Embodied cognition and the simulation of action to understand others. Ann N Y Acad Sci 1156:97-117.
Granger CWJ. (1969): Investigating Causal Relations by Econometric Models and Cross-Spectral Methods. Econometrica 37(3):414-&.
Groen WB, Tesink C, Petersson KM, van Berkum J, van der Gaag RJ, Hagoort P, Buitelaar JK. (2010): Semantic, factual, and social language comprehension in adolescents with autism: an FMRI study. Cereb Cortex 20(8):1937-45.
Henke K, Mondadori CR, Treyer V, Nitsch RM, Buck A, Hock C. (2003): Nonconscious formation and reactivation of semantic associations by way of the medial temporal lobe. Neuropsychologia 41(8):863-76.
Iacoboni M, Lieberman MD, Knowlton BJ, Molnar-Szakacs I, Moritz M, Throop CJ, Fiske AP. (2004): Watching social interactions produces dorsomedial prefrontal and medial parietal BOLD fMRI signal increases compared to a resting baseline. Neuroimage 21(3):1167-73.

28
Iacoboni M, Molnar-Szakacs I, Gallese V, Buccino G, Mazziotta JC, Rizzolatti G. (2005): Grasping the intentions of others with one's own mirror neuron system. PLoS Biol 3(3):e79.
Jabbi M, Keysers C. (2008): Inferior frontal gyrus activity triggers anterior insula response to emotional facial expressions. Emotion 8(6):775-80.
Johansson G. (1973): Visual perception of biological motion and a model for its analysis. Perception & Psychophysics 14(2):201-211.
Kennedy DP, Courchesne E. (2008): Functional abnormalities of the default network during self- and other-reflection in autism. Soc Cogn Affect Neurosci 3(2):177-90.
Kennedy DP, Redcay E, Courchesne E. (2006): Failing to deactivate: resting functional abnormalities in autism. Proc Natl Acad Sci U S A 103(21):8275-80.
Kircher TT, Senior C, Phillips ML, Benson PJ, Bullmore ET, Brammer M, Simmons A, Williams SC, Bartels M, David AS. (2000): Towards a functional neuroanatomy of self processing: effects of faces and words. Brain Res Cogn Brain Res 10(1-2):133-44.
Kjaer TW, Nowak M, Lou HC. (2002): Reflective self-awareness and conscious states: PET evidence for a common midline parietofrontal core. Neuroimage 17(2):1080-6.
Kobayashi Y, Amaral DG. (2007): Macaque monkey retrosplenial cortex: III. Cortical efferents. J Comp Neurol 502(5):810-33.
Kriegeskorte N, Simmons WK, Bellgowan PS, Baker CI. (2009): Circular analysis in systems neuroscience: the dangers of double dipping. Nat Neurosci 12(5):535-40.
Kujala MV, Carlson S, Hari R. (2012): Engagement of amygdala in third-person view of face-to-face interaction. Hum Brain Mapp 33(8):1753-62.
Leech R, Sharp DJ. (2014): The role of the posterior cingulate cortex in cognition and disease. Brain 137(Pt 1):12-32.
Lou HC, Luber B, Crupain M, Keenan JP, Nowak M, Kjaer TW, Sackeim HA, Lisanby SH. (2004): Parietal cortex and representation of the mental Self. Proc Natl Acad Sci U S A 101(17):6827-32.
Margulies DS, Vincent JL, Kelly C, Lohmann G, Uddin LQ, Biswal BB, Villringer A, Castellanos FX, Milham MP, Petrides M. (2009): Precuneus shares intrinsic functional architecture in humans and monkeys. Proc Natl Acad Sci U S A 106(47):20069-74.
McDermott KB, Ojemann JG, Petersen SE, Ollinger JM, Snyder AZ, Akbudak E, Conturo TE, Raichle ME. (1999): Direct comparison of episodic encoding and retrieval of words: an event-related fMRI study. Memory 7(5-6):661-78.
McKay LS, Simmons DR, McAleer P, Marjoram D, Piggot J, Pollick FE. (2012): Do distinct atypical cortical networks process biological motion information in adults with Autism Spectrum Disorders? Neuroimage 59(2):1524-33.
Neri P, Luu JY, Levi DM. (2006): Meaningful interactions can enhance visual discrimination of human agents. Nat Neurosci 9(9):1186-92.
Parvizi J, Van Hoesen GW, Buckwalter J, Damasio A. (2006): Neural connections of the posteromedial cortex in the macaque. Proc Natl Acad Sci U S A 103(5):1563-8.
Pavlova M, Sokolov A. (2000): Orientation specificity in biological motion perception. Perception & Psychophysics 62(5):889-899.
Pavlova MA. (2011): Biological Motion Processing as a Hallmark of Social Cognition. Cereb Cortex.
Petrini K, Holt SP, Pollick F. (2010): Expertise with multisensory events eliminates the effect of biological motion rotation on audiovisual synchrony perception. Journal of Vision 10(5).
Puce A, Perrett D. (2003): Electrophysiology and brain imaging of biological motion. Philos Trans R Soc Lond B Biol Sci 358(1431):435-45.

29
Reid VM, Hoehl S, Grigutsch M, Groendahl A, Parise E, Striano T. (2009): The neural correlates of infant and adult goal prediction: evidence for semantic processing systems. Dev Psychol 45(3):620-9.
Rizzolatti G, Craighero L. (2004): The mirror-neuron system. Annu Rev Neurosci 27:169-92. Roebroeck A, Formisano E, Goebel R. (2005): Mapping directed influence over the brain using
Granger causality and fMRI. Neuroimage 25(1):230-42. Rose D, Clarke TJ. (2009): Look who's talking: visual detection of speech from whole-body
biological motion cues during emotive interpersonal conversation. Perception 38(1):153-6.
Ruby P, Decety J. (2001): Effect of subjective perspective taking during simulation of action: a PET investigation of agency. Nat Neurosci 4(5):546-50.
Saygin AP, Wilson SM, Hagler DJ, Jr., Bates E, Sereno MI. (2004): Point-light biological motion perception activates human premotor cortex. J Neurosci 24(27):6181-8.
Schilbach L. (2010): A second-person approach to other minds. Nat Rev Neurosci 11(6):449. Schilbach L, Timmermans B, Reddy V, Costall A, Bente G, Schlicht T, Vogeley K. (2013): Toward a
second-person neuroscience. Behav Brain Sci 36(4):393-414. Schilbach L, Wohlschlaeger AM, Kraemer NC, Newen A, Shah NJ, Fink GR, Vogeley K. (2006):
Being with virtual others: Neural correlates of social interaction. Neuropsychologia 44(5):718-30.
Schippers MB, Renken R, Keysers C. (2011): The effect of intra- and inter-subject variability of hemodynamic responses on group level Granger causality analyses. Neuroimage 57(1):22-36.
Schippers MB, Roebroeck A, Renken R, Nanetti L, Keysers C. (2010): Mapping the information flow from one brain to another during gestural communication. Proc Natl Acad Sci U S A 107(20):9388-93.
Sevdalis V, Keller PE. (2011): Captured by motion: Dance, action understanding, and social cognition. Brain Cogn.
Sharp DJ, Beckmann CF, Greenwood R, Kinnunen KM, Bonnelle V, De Boissezon X, Powell JH, Counsell SJ, Patel MC, Leech R. (2011): Default mode network functional and structural connectivity after traumatic brain injury. Brain 134(Pt 8):2233-47.
Shipley TF. (2003): The effect of object and event orientation on perception of biological motion. Psychol Sci 14(4):377-380.
Sinke CB, Sorger B, Goebel R, de Gelder B. (2010): Tease or threat? Judging social interactions from bodily expressions. Neuroimage 49(2):1717-27.
Smith SM, Bandettini PA, Miller KL, Behrens TE, Friston KJ, David O, Liu T, Woolrich MW, Nichols TE. (2012): The danger of systematic bias in group-level FMRI-lag-based causality estimation. Neuroimage 59(2):1228-9.
Sumi S. (1984): Upside-down Presentation of the Johansson Moving Light-Spot Pattern. Perception 13(3):283-286.
Troje NF, Westhoff C. (2006): The inversion effect in biological motion perception: Evidence for a "life detector"? Current Biology 16(8):821-824.
Tsukiura T, Fujii T, Fukatsu R, Otsuki T, Okuda J, Umetsu A, Suzuki K, Tabuchi M, Yanagawa I, Nagasaka T and others. (2002): Neural basis of the retrieval of people's names: evidence from brain-damaged patients and fMRI. J Cogn Neurosci 14(6):922-37.
Uddin LQ, Iacoboni M, Lange C, Keenan JP. (2007): The self and social cognition: the role of cortical midline structures and mirror neurons. Trends Cogn Sci 11(4):153-7.
Van Overwalle F, Baetens K. (2009): Understanding others' actions and goals by mirror and mentalizing systems: a meta-analysis. Neuroimage 48(3):564-84.

30
Vogeley K, Bussfeld P, Newen A, Herrmann S, Happe F, Falkai P, Maier W, Shah NJ, Fink GR, Zilles K. (2001): Mind reading: neural mechanisms of theory of mind and self-perspective. Neuroimage 14(1 Pt 1):170-81.
Vogeley K, Fink GR. (2003): Neural correlates of the first-person-perspective. Trends Cogn Sci 7(1):38-42.
Vogeley K, May M, Ritzl A, Falkai P, Zilles K, Fink GR. (2004): Neural correlates of first-person perspective as one constituent of human self-consciousness. J Cogn Neurosci 16(5):817-27.
Zhang S, Li CS. (2012): Functional connectivity mapping of the human precuneus by resting state fMRI. Neuroimage 59(4):3548-62.
31
Figure 1
32
Figure 2

33
Figure 3

34
Figure 4

35
Figure 5