longitudinal data: an introduction to some conceptual issues vernon gayle
TRANSCRIPT

Longitudinal Data: An introduction to some conceptual
issues
Vernon Gayle

A glib claim that longitudinal data analysis is important because it permits insights into the processes of change is inadequate and certainly fails to convince many social science researchers who are concerned with substantive rather than methodological challenges... What is required is an understanding on the limitations of cross-sectional analysis.
Four Main Issues
• Age and Cohort Effects
• Direction of Causality
• State Dependence
• Residual Heterogeneity
• COHORT = A common group being studied.
• AGE = Amount of time since cohort was constituted.
• PERIOD = Moment of observation.
THINKING ABOUT CHANGE

AGE 21
AGE 19
AGE 17
A CROSS-SECTIONAL YOUTH STUDY

AGE 16 17 18 19 20 21 (COHORT 1)
AGE 16 17 18 19 (COHORT 2)
AGE 16 17 (COHORT 3)
THREE YOUTH COHORT STUDIES
We can study the effects of ‘age’ or ageing.
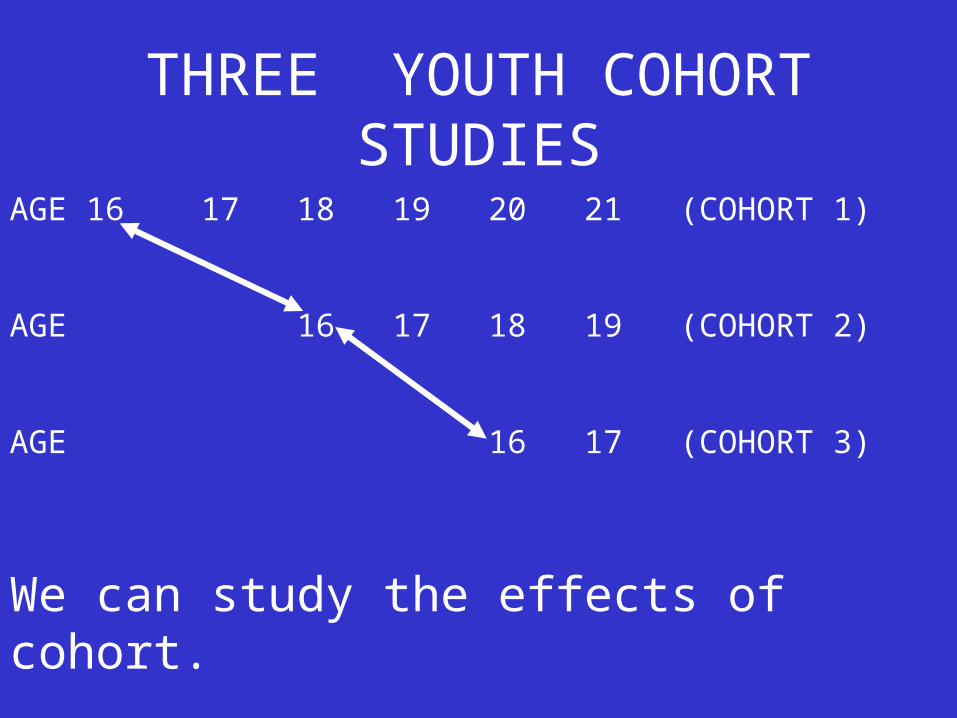
THREE YOUTH COHORT STUDIES
AGE 16 17 18 19 20 21 (COHORT 1)
AGE 16 17 18 19 (COHORT 2)
AGE 16 17 (COHORT 3)
We can study the effects of cohort.

THREE YOUTH COHORT STUDIES
AGE 16 17 18 19 20 21 (COHORT 1)
AGE 16 17 18 19 (COHORT 2)
AGE 16 17 (COHORT 3)
We can study the effects of period.
Period of high unemployment
Period of low unemployment
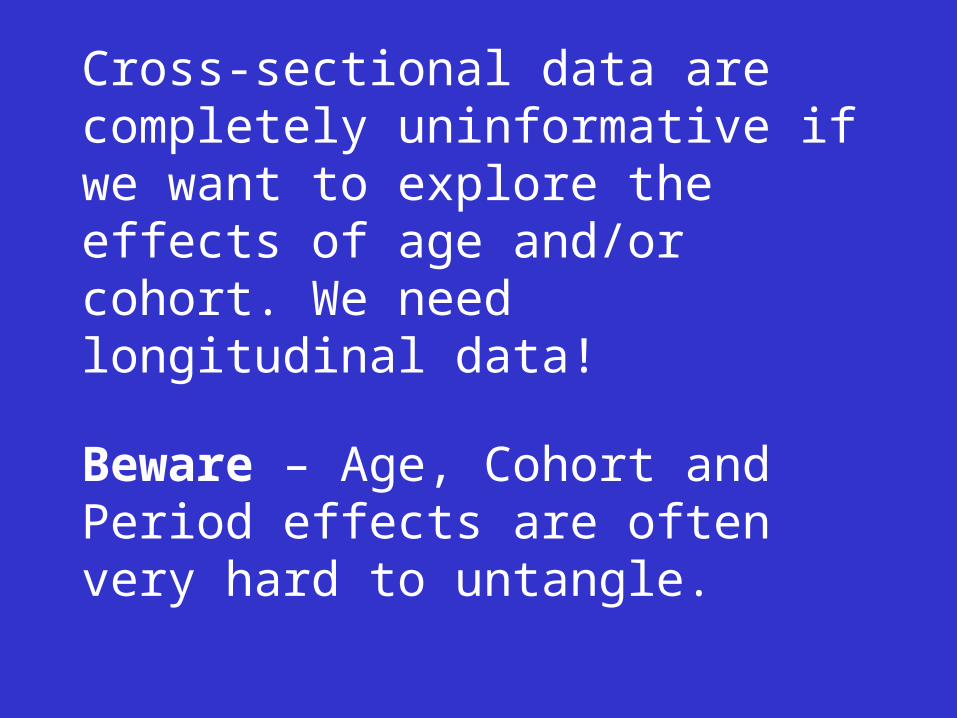
Cross-sectional data are completely uninformative if we want to explore the effects of age and/or cohort. We need longitudinal data!
Beware – Age, Cohort and Period effects are often very hard to untangle.
Direction Of CausalityDirection Of Causality
There is unequivocal evidence from cross-sectional data that, overall, the unemployed have poorer health.
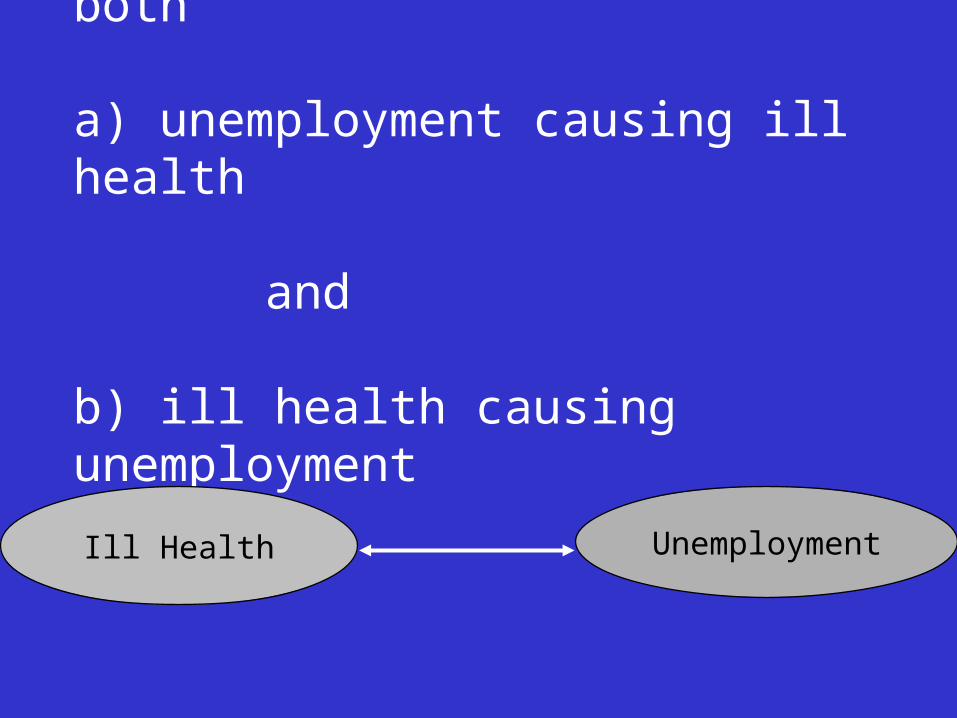
This is consistent with both
a) unemployment causing ill health
and
b) ill health causing unemployment
Ill Health Unemployment

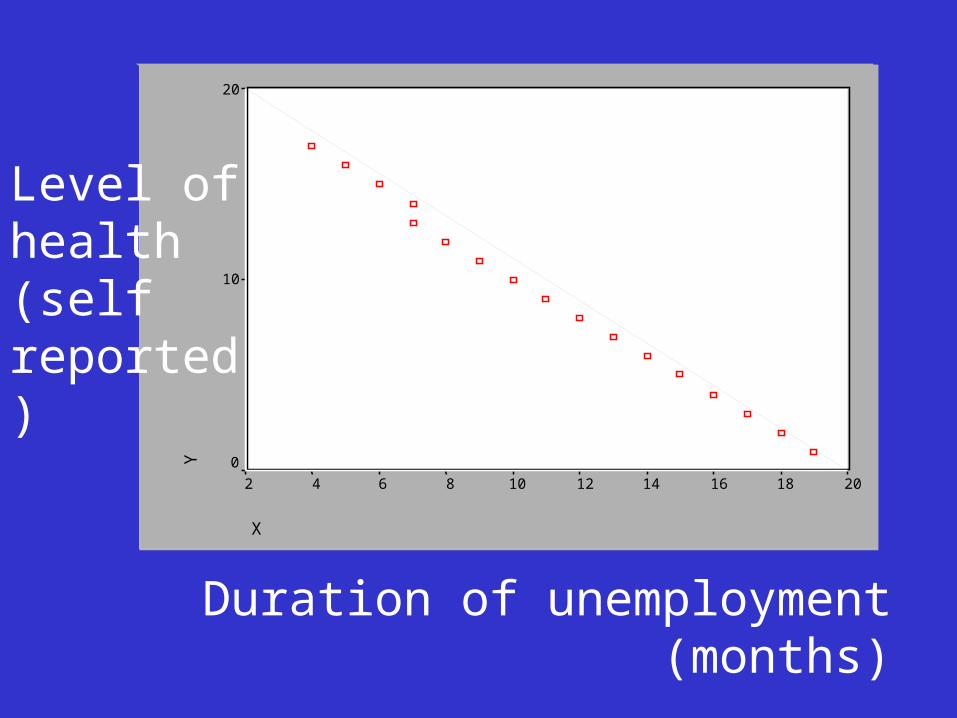
If we had a cross-sectional survey that asked how long people had been unemployed and also their level of health, generally, we would find a negative relationship.
X
2018161412108642
Y
20
10
0
Duration of unemployment (months)
Level of health (self reported)
Negative – Lower levels of health for people who had been unemployed for longer.

This is consistent with
a) unemployment causing ill health
Ill Health Unemployment

HOWEVER………….
If ill health causes unemployment…
then people with comparatively modest levels of ill health will tend to recover more quickly and return to work.

This is consistent with
b) ill health causing unemployment
Ill Health Unemployment

With the increasing duration of unemployment those with less severe ill health will be progressively under represented while those with more severe ill health will be over represented.
With the increasing duration of unemployment those with less severe ill health will be progressively under represented while those with more severe ill health will be over represented.

This is known as a‘sample selection bias’ and could therefore explain the cross-sectional picture of declining ill health with duration of unemployment.
This is known as a‘sample selection bias’ and could therefore explain the cross-sectional picture of declining ill health with duration of unemployment.

It is not possible to untangle this conundrum with cross-sectional data.
Longitudinal data are required!

State Dependence State Dependence
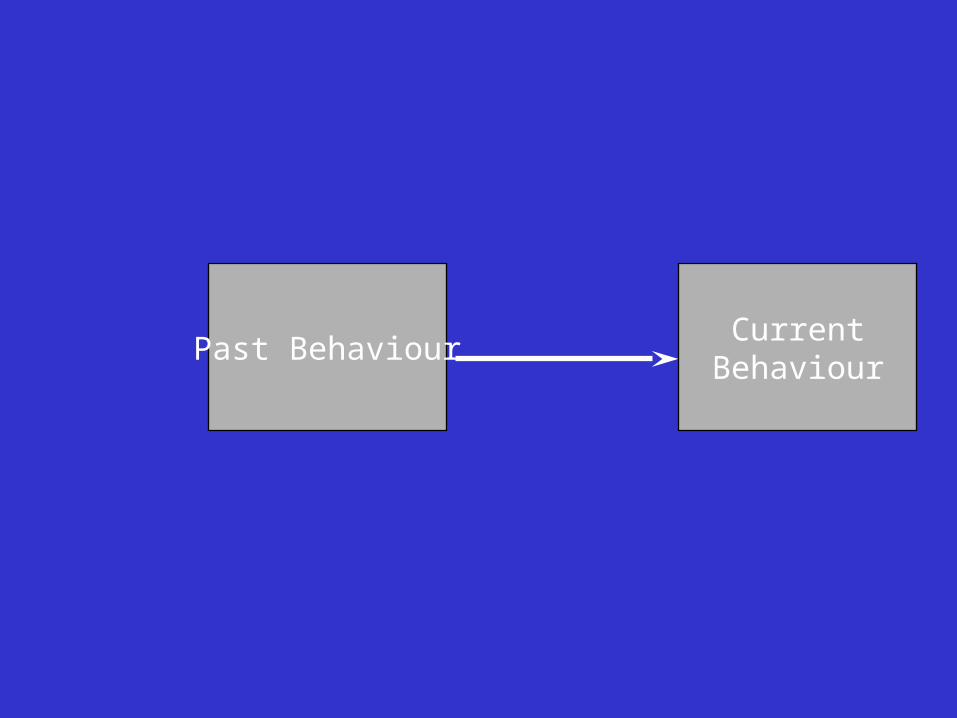
Past BehaviourCurrent
Behaviour

UnemployedEmployed
Employed
Young People Aged 19
MAYAPRIL

Residual Heterogeneity(Omitted Explanatory Variables)
Can be explained fully over a large dram in the Rusacks bar!

The possibility of substantial variation between similar individuals due to unmeasured and possibly unmeasureable variables is known as ‘residual heterogeneity’.
There is no way of accounting for omitted explanatory variables in cross-sectional analysis.
There are techniques for ‘improving’ control for omitted explanatory variables if we have data at more than one time point.
FRAILTY!

Because surveys fail to capture the detailed nature of social life there is, almost inevitably, considerable heterogeneity in response variables even amongst respondents that share the same characteristics across all of the explanatory variables.
BEWARE
We can now probably guess why cross-sectional analysis might incorrectly estimate the effects of explanatory variables, and therefore result in misleading conclusions being drawn.

Cross-sectional V Longitudinal
0 4

END

Four Main Issues
• Age and Cohort Effects
• Direction of Causality
• State Dependence
• Residual Heterogeneity
Age And Cohort EffectsAge And Cohort Effects

Should I buy a new car?
An example…..

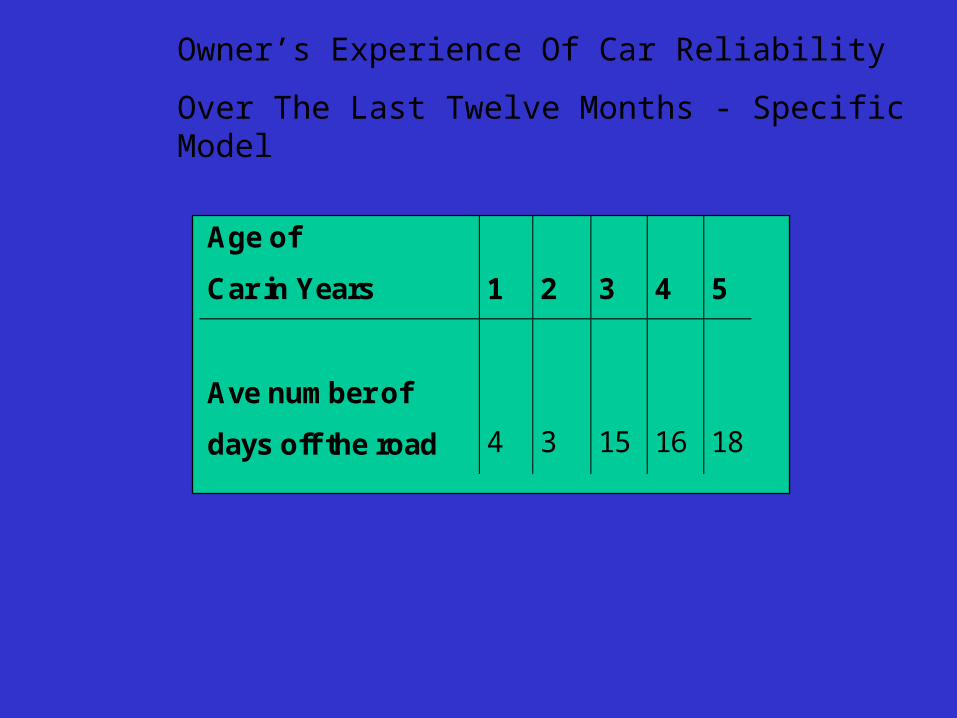
Owner’s Experience Of Car Reliability
Over The Last Twelve Months - Specific Model
Age of
Car in Years
1
2
3
4
5
Ave number of
days off the road
4
3
15
16
18

What happens when these cars get older (ageing effects)?
Owner’s Experience Of Car Reliability
Over The Last Twelve Months - Specific Model
Age of
Car in Years
1
2
3
4
5
Ave number of
days off the road
4
3
15
16
18

The manufacture tells me that there is a cohort effect – The more recently made cars are now much more reliable than the ones made five years ago.
Could this be true?

Owner’s Experience Of Car Reliability
Over The Last Twelve Months - Specific Model
Age of
Car in Years
1
2
3
4
5
Ave number of
days off the road
4
3
15
16
18
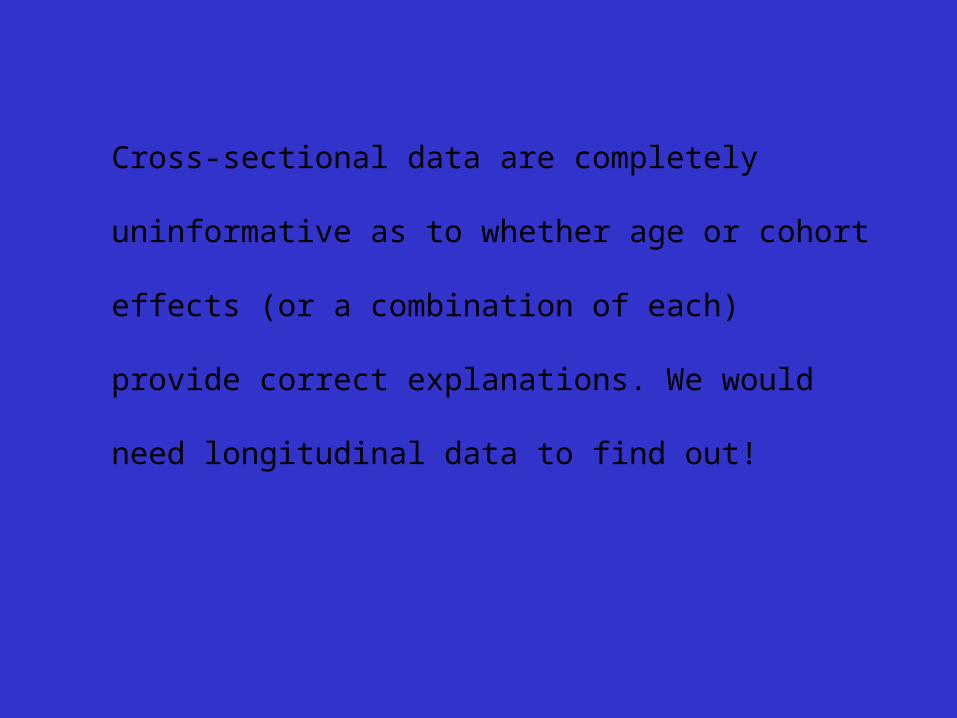
Cross-sectional data are completely uninformative
as to whether age or cohort effects (or a
combination of each) provide correct explanations.
We would need longitudinal data to find out!

Person A
OUTCOME
Person B
CROSS-SECTIONAL EXPLANATORY VARIABLES

My two hypothetical identical twin daughters – The Gayle sisters.