longitudinal changes of blood pressure after weight loss: factors involved
TRANSCRIPT

Author's Accepted Manuscript
LONGITUDINAL CHANGES OF BLOOD PRES-SURE AFTER WEIGHT LOSS: FACTORS IN-VOLVED.
L Flores PhD, J Vidal PhD, I Núñez PhD, S RuedaMD, J Viaplana MD, E Esmatjes PhD
PII: S1550-7289(14)00198-1DOI: http://dx.doi.org/10.1016/j.soard.2014.04.028Reference: SOARD1994
To appear in: Surgery for Obesity and Related Diseases
Cite this article as: L Flores PhD, J Vidal PhD, I Núñez PhD, S Rueda MD, J ViaplanaMD, E Esmatjes PhD, LONGITUDINAL CHANGES OF BLOOD PRESSURE AFTERWEIGHT LOSS: FACTORS INVOLVED., Surgery for Obesity and Related Diseases,http://dx.doi.org/10.1016/j.soard.2014.04.028
This is a PDF file of an unedited manuscript that has been accepted for publication. As aservice to our customers we are providing this early version of the manuscript. Themanuscript will undergo copyediting, typesetting, and review of the resulting galley proofbefore it is published in its final citable form. Please note that during the production processerrors may be discovered which could affect the content, and all legal disclaimers that applyto the journal pertain.
www.elsevier.com/locate/buildenv

1
LONGITUDINAL CHANGES OF BLOOD PRESSURE AFTER WEIGHT LOSS:
FACTORS INVOLVED.
Authors: L Flores, PhD1,2
, J Vidal, PhD1,2,3
, I Núñez, PhD4, S Rueda, MD
1, J Viaplana, MD
3,
E Esmatjes, PhD2,3,5
.
Affiliations:
1 Obesity Unit, Department of Endocrinology and Nutrition, Hospital Clinic.
2 CIBERDEM: Spanish Biomedical Research Centre in Diabetes and Associated Metabolic
Disorders.
3 IDIBAPS:Institut d’Investigacions Biomèdiques August Pi i Sunyer.
4 Diagnostic Imaging Center, Hospital Clinic.
5 Diabetes Unit, Department of Endocrinology and Nutrition. Hospital Clinic i Provincial,
Barcelona, Spain.
Short title: Obesity: effect of weight loss on blood pressure.
Source of funding: This study received a grant (PI07/0124) from the Fondo de Investigación
Sanitaria (FIS) del Instituto de Salud Carlos III.
Correspondence to:
Dr Lilliam Flores, PhD, MD;
Obesity Unit; Department of Endocrinology and Nutrition;
Hospital Clinic i Universitari;
Villarroel, 170, Escalera 11, 2º piso. CP 08036, Barcelona, Spain.
Phone: 0034658023562; Fax: 0034934516638; e-mail: [email protected]
Word Count: 2962; Tables: 5
Material Supplementary: Tables 4

2
LONGITUDINAL CHANGES OF BLOOD PRESSURE AFTER WEIGHT LOSS:
FACTORS INVOLVED.
Abstract
Background: The combination of obesity and hypertension (HT) places patients at a higher
risk for adverse cardiovascular outcomes and raises the need to establish the pathogenic
mechanisms of this relationship.
Objective: The aim of this study was to assess the effects of important weight loss on
longitudinal changes in blood pressure (BP) and investigate the pathogenic factors associated
with these changes.
Settings: Prospective study in patients undergoing bariatric surgery (BS) in 2010 at the
Hospital Clinic of Barcelona, Spain.
Material and Methods: We performed a prospective, open-label study including 37 obese
hypertensive patients (28 females, mean age 52±8 years) undergoing BS. Before BS, and at 4
and 12 months post-operatively, the body mass index (BMI), 24-h ambulatory BP, renin-
angiotensin-aldosterone system (RAAS: plasma rennin activity, aldosterone, angiotensin II,
angiotensin converting enzyme), sympathetic nervous system (SNS: metanephrines,
normetanephrines, norepinephrine) components, leptin, insulin and abdominal fat were
measured.
Results: Prior to BS, HT-duration was 6±6 years, the BMI 45±5 kg/m2 and excess body
weight (EBW) was 53±12 kg. At 12 months the EBMI loss was 14 kg/m2 and the EBW loss
was 70 %; HT remission was observed in 70 %; 24-h [systolic 19±13/diastolic 7±9 mmHg],
day and night BP levels and aldosterone, norepinephrine, leptin, insulin, subcutaneous and
visceral abdominal fat (VAT) significantly decreased (p<0.05). Mixed models for repeated

3
measures revealed that HT-duration, baseline BP, BMI and VAT area were the main variables
associated with longitudinal changes in BP.
Conclusions: These results demonstrate that the hypotensive response after weight loss in
severely hypertensive obese patients is mainly regulated by HT-duration, baseline BP, BMI
and VAT area, independently of suppression of hyperinsulinemia or changes in RAAS and
SNS components.
Keywords: Bariatric surgery, hypertension, dysfunctional adipose tissue, renin-angiotensin-
aldosterone system, sympathetic nervous system, visceral adipose tissue.

4
Introduction
The combination of obesity and hypertension (HT) places patients at a higher risk for adverse
cardiovascular outcomes and raises the need to establish the pathogenic mechanisms of this
relationship. The mechanisms through which obesity leads to HT are still an area of research,
although several overlapping mechanisms have been proposed. One of these mechanisms is
an alteration in the profile of adipokine secretion from dysfunctional adipose tissue present in
obesity. This change in adipokine secretion has important metabolic consequences such as a
chronic inflammatory state(1)
and hyperleptinemia(2-4)
that have been related to HT in the
obese. Other relevant mechanisms proposed include increased renin-angiotensin-aldosterone
system (RAAS)(5;6)
and sympathetic nervous system (SNS) activity(7-10)
, the development of
insulin resistance(6;8)
and endothelial dysfunction(11;12)
. However, none of these mechanisms
has been shown to fully explain this association, thereby suggesting that the mechanism of
obesity-related HT is multifactorial.
A number of studies have shown that non surgical weight reduction is associated with a
significant improvement or remission of HT(13;14)
. Therefore, the current guidelines related to
HT recommend a reduction in body weight to control BP(15)
. On the other hand, bariatric
surgery (BS) is currently the most effective therapy to achieve significant and long-term
weight loss in severely obese individuals. Several series of BS in hypertensive patients have
reported a remission or improvement in HT in more than 60% of the patients(16-21)
. However,
there is a dearth of data regarding the mechanisms by which BS induces HT remission.
Indeed, only 2 studies (using office BP as the reference method for diagnosing HT) on the
effect of BS on RAAS in hypertensive patients have been performed, showing a reduction in
plasma renin activity (PRA), aldosterone and angiotensin-converting enzyme (ACE) levels
after weight loss(22;23)
. Thus, the aim of this study was to determine the factors associated with
the longitudinal changes in BP obtained by 24 h ambulatory BP monitoring (ABPM) after BS.

5
Methods
Subjects
Patients with severe obesity and HT undergoing BS [laparoscopic Roux-en-Y gastric bypass
(LRYGB) or sleeve gastrectomy (SG)] in 2010 were invited to participate in this prospective,
open-label, 12-month study. The following inclusion criteria were used: age between 18 and
65 years, fulfillment of criteria for BS defined as body mass index (BMI) > 40 kg/m2 or 35-40
kg/m2 with major obesity-associated co-morbidities, anti-hypertensive treatment with 3 or less
hypotensor drugs and normal renal function (creatinine < 1.4 mg/dl in males or < 1.3 mg/dl in
females). Subjects were excluded if they had secondary HT or established cardiovascular
disease.
Study design
All patients were evaluated three times: before BS and at 4 and 12 months post-operatively.
All evaluations were performed after withdrawal of all antihypertensive treatment one week
before the clinical work up. The preoperative information obtained included: age, height (cm),
body weight [(kg), BW], BMI: (kg/m2), waist circumference (WC) gender, full medication
list, medical history and the percentage of excess BW (EBW), which was calculated
according to the ideal BW for a BMI of 25 kg/m2. Postoperatively, BW was measured and the
BMI, BW loss (BWL), excess BWL (EBWL) and excess BMI (EBMI) loss with excess > 25
kg/m2 were calculated.
Plasma and serum samples were collected under fasting conditions after 1 hour of rest in the
supine position to determine the different components of RAAS [PRA, aldosterone,
angiotensin II (Ang II), ACE] and SNS [metanephrine, normetanephrine, norepinephrine
(NE)]. In addition, glucose, insulin and leptin levels were also determined. BP was measured
by ABPM with an appropriate sized cuff (Spacelabs 90207) on a usual working day. All
patients underwent non-invasive 24-h ABPM using an oscillometric recorder (Spacelabs

6
90207, Redmond, WA, USA). They were asked to go to bed no later than 23:00 h and to arise
no earlier than 07:00 h. The device was programmed to measure BP every 20 min. over a 24-
h period. Only 24-h recordings including more than 80% of successful recordings were
accepted as valid. Finally, abdominal fat was evaluated by means of computed tomography to
assess visceral adipose tissue (VAT) and subcutaneous adipose tissue (SAT).
LRYGB and SG were performed as previously described(24;25)
. SG was mainly performed in
individuals with a BMI > 50 kg/m2, with an estimated operative risk, or the presence of an
enlarged liver, and the remaining patients underwent GB.
Definitions
Hypertension was defined as the permanent use of antihypertensive treatment and confirmed
by ABPM when the mean 24 h SBP and DBP were > 130/80 mmHg and remission of HT was
defined as a mean 24 h SBP and DBP < 130/80 mmHg associated with a discontinuation of
all antihypertensive drugs26
.
No protocol was established for the reduction or discontinuation of antihypertensive
medications. These drug adjustments were made at the discretion at the primary care
physician of each patient. The study was approved by the institutional review board. All
patients provided written informed consent to participate.
Analytical Determination
Plasma renin activity was measured by the RIA method (gamma Coat plasma renin activity,
Diasorin, Vercelli, Italy); Ang II was measured by RIA method (Angiotensin II RIA,
Búhlmann, Baseltrasse, Switzerland); aldosterone was measured by the RIA method (Coat A
count aldosterone, Siemens, Los Angeles, Ca); NE was measured by the RIA method
noradrenalin RIA, IBL-America, Minneapolis, USA); ACE was measured by enzymatic assay
(LTA); and nephrines were measured by ELISA (nephrines plasma ELISA fast-tract,

7
Diasource ImmunoAssay S.A, Louvain-La Neuve, Belgium). Plasma leptin was measured by
enzyme immunoassay (DBC Diagnostics, Biochem Canada, Inc; intraassay CV= 4.6%;
interassay CV=5.1%; sensitivity= 1 ng/ml).
Statistical Analysis
All analyses were performed using the SAS package (version 9.2 SAS Institute Inc., Cary,
North Caroline). The sample size was calculated based on an improvement of the SBP of 10
mmHg at 12 months. An error of 0.05 with a power of 90% was assumed. The final sample
size was calculated to be 37 patients. Data are expressed as means ± SD. Means of
anthropometric and biochemical parameters were compared with the paired and unpaired
Student’s t test as appropriate. Changes from baseline variables ( ) were calculated by
subtracting baseline from follow-up values.
To evaluate longitudinal changes in BP after BS, mixed models for repeated measures
(MMRM) were employed. Separate models were constructed for each of the SBP and DBP
baseline-adjusted measurements (24 h, day and night) obtained by ABPM. We first fitted a
univariate MMRM to estimate the coefficients ( ) and their 95% CI. Variables with P values
lower than 0.10 in this univariate analysis were selected for the final model using a forward
stepwise strategy selection.

8
Results
Participant characteristics
A total of 37 subjects were included in the study. The entire group was Caucasian, 31 patients
used ACE inhibitors or angiotensin receptor antagonists, 4 calcium channel blockers and 2
beta blockers, combined with diuretic treatment in 22 patients. Table 1 shows the clinical and
demographic characteristics of the study population at baseline.
Effect of BS on weight variables, HT remission, gender and type of surgery
Over the 12-month period after surgery, the BW decreased by a mean of 37 kg, the EBMI
decreased by 14 kg/m2, the WC decreased by 25 cm and the EBWL was 70%. Sixteen (43%)
patients reached a BMI ≤ 30 Kg/m2.
HT remission was observed in 26 (70%) patients. Prior to surgery, patients with HT remission
had a higher BMI, EBMI and EBW, used fewer antihypertensive drugs, and all BP parameters
were significantly lower compared to those without HT remission (Table 1). At the end of
follow-up the subjects with and without HT remission showed similar BMI values: 32 ± 4 vs.
30 ± 4 kg /m2, BWL: 39 ± 14 vs. 33 ± 7 kg and EBWL 69 ± 19 vs. 74 ± 17 %. Only in
patients without HT remission was the EBMI loss significantly lower: 15 ± 5 vs. 12 ± 2
kg/m2, p= 0.03, respectively.
With regard to gender, HT remission was achieved in 82 % of the women compared to only
33% of the males. Prior to BS, the only difference was that males had a higher WC than
females (137 ± 9 vs. 127 ± 10, p= 0.015). No further analyses were performed to attempt to
elucidate the mechanisms to explain the difference in HT resolution due to the small sample
size.
In relation to the type of surgery performed, before BS both age (50 ± 7 vs. 56 ± 9, p= 0.035)
as well as HT duration (5 ± 4 vs. 9 ± 7, p= 0.033) were significantly higher in those receiving
SG. After BS the BP response (24 h SBP 19 ± 14 vs. 15 ± 10 and 24 h DBP 7 ± 9 vs. 4 ± 6

9
mmHg] and weight loss achieved [BMI 31 ± 4 vs. 31 ± 5 kg/m2; BWL 39 ± 12 vs. 35 ± 12 kg
and EBWL 71 ± 17 vs. 70 ± 20 % in LRYGB and SG, respectively] were similar between the
two surgical approaches. In addition, we did not observe differences in HT remission between
the two types of surgery.
Effect of BS on BP, metabolic and hormonal parameters and body composition
All the BP parameters evaluated decreased significantly. With an EBWL of 51% (-26 Kg) at 4
months after surgery, the 24 h SBP and DBP decline was -18 and -7 mmHg, respectively,
representing a fall of 0.70 and 0.27 mmHg when expressed per kg of BWL. At 12 months
after BS, with an EBWL of 70% (-37 kg) the total 24 h SBP and DBP decline was -19 and -7
mmHg, respectively, representing a fall of 0.51 and 0.19 when expressed per kg of BWL. The
effect of weight loss on the BP parameters is presented in Table S1. The prevalence of non
dippers was similar prior to and 12 months after surgery (50 vs. 50 %), as was the mean night
SBP (9 vs. 9 mmHg) and DBP (14 vs. 11 mmHg) decline. After BS the nocturnal
hypertension (night SBP and DBP > 120/70 mmHg) decreased from 75 to 39% and the
pressure pulse (difference between the SBP and DBP readings) fell from 60 (7) to 47 (7)
mmHg, p <0.001.
As expected, all the metabolic parameters improved: glucose fell from 131 ± 55 to 95 ± 28
mg/dl, p< 0.001; fasting insulin from 30 ± 21 to 10 ± 4 mU/L, p< 0.001 and leptin: in males
from 43 ± 27 to 7 ± 9 and in females from 77 ± 23 to 25 ± 13 ng/ml, p< 0.001. Regarding
RAAS, all the components decreased as a mean, but only the reduction in aldosterone reached
statistical significance. In relation to SNS parameters only the decline in NE achieved
statistical significance (Table S2). Regarding adiposity measures, VAT and SAT areas
significantly decreased after surgery [211 ± 80 vs. 84 ± 46 cm2 p< 0.001 and 655 ± 186 vs.
375 ± 153 cm2, p<0.001, respectively].

10
Factors associated with the longitudinal changes in SBP and DBP
The exploratory analyses revealed that age and HT-duration were associated with higher
levels of 24-h, day and night SBP, whereas BW, BMI, WC, and EBW were associated with
lower levels of 24-h, day and night SBP. In relation to the RASS none of the components
achieved statistical significance in the univariate model. In relation to SNS components, only
NE showed an association with 24-h and night SBP levels, and concerning body composition,
the SAT area was associated with lower 24-h, day and night SBP levels whereas the VAT
area was associated with higher day-SBP levels (table 2). When we studied the follow-up
variables we observed that ∆ BMI and ∆ EBW were associated with lower 24-h SBP levels,
BWL with lower day SBP levels, and ∆ BMI, ∆ EBW and EBWL were associated with lower
night SBP levels (Table S3). None of the changes in the RASS and SNS components achieved
statistical significance to enter in the multivariate model.
In relation to DBP levels, the univariate analysis showed that the VAT area was associated
with higher 24-h and day DBP levels whereas BMI, EBW and SAT area were associated with
lower night DBP levels (Table 3). The analysis with the follow-up variables showed that ∆
BMI and ∆ EBW were associated with lower 24-h and night DBP levels whereas EBWL was
associated with higher 24-h and night DBP levels (Table S4). Again, none of the changes in
the RASS and SNS components achieved statistical significance to enter in the multivariate
model.
The results of the multivariate analysis showed that baseline factors associated with higher
SBP levels were HT-duration, SBP levels and VAT area whereas BMI was associated with
lower SBP levels (Table 4). In addition, baseline DBP levels and VAT area were associated
with higher DBP levels while the only factor associated with lower night DBP level was BMI.
No longitudinal changes in predictor variables were associated with longitudinal changes in
BP (Table 5).

11
Discussion:
We used a prospective design to measure the serial parameters related to different systems
reportedly involved in the obesity-HT relationship in an attempt to investigate the pathogenic
mechanisms involved in this relationship. In addition, we took advantage of the repeated
measurements of BP at each follow-up visit to characterize the longitudinal changes in BP
over time. Establishment of the pathophysiological modification that accompanies the
changes in BP after weight loss might indicate the sequence of alterations that leads to the
association of HT and obesity. In this sense, hypertensive patients undergoing BS represent an
ideal clinical model in which a significant weight loss is expected within a relatively short
time, thereby allowing evaluation of the changes in BP and the study of the pathogenic
mechanisms involved in these changes.
The present study has three main findings. First, the beneficial effect of weight loss on BP and
metabolic parameters in hypertensive severely obese subjects is confirmed, and similar to
other authors the remission rate of HT was 70%(17;18)
.
Second, we observed a sizeable decline in SBP and DBP after weight loss. This drop in BP
took place at an early stage following surgery (at 4 months). Further reductions in BW
occurred up to the last follow-up (at 12 months), albeit not accompanied by any notable
additional reductions in BP. Thus, the initial weight loss produced a greater fall in BP than
that observed after continued weight reduction. In concordance with prior results, in a group
of overweight and obesity young, stage 1, never-treated hypertensive patients followed for
more than 6 years Winnicki et al described that the association between long-term weight loss
and a subsequent decrease in BP is not linear and is limited to a decrease of up to 13% of the
initial BW. In agreement with these authors, our data indicate that 1 kg of weight loss is
associated with a decrease of approximately 0.70 mmHg for SBP and 0.27 mmHg for DBP,
but in our case the relationship held true for up to a 50% decrease of the initial BW(27)
. After

12
BS, Ahmed et al reported reductions in SBP (9 mmHg) and DBP (7 mmHg) as early as 1
week after surgery before presenting any significant weight loss (EBWL of 7%)(16)
and, in a
retrospective study Hinojosa et al reported that the maximal early BP fall occurred at 1
month(20)
. In our study BP was not monitored until 4 months after BS to avoid possible
confounders such as post-operative fluid status, severe caloric restriction and sodium intake.
Therefore, the maximal fall in BP might have been obtained earlier with even less BWL.
Indeed, our findings suggest that the impact of weight loss on BP does not require
achievement of an ideal body weight and that the target of BWL may even be set at a more
modest range of 50% of initial weight to achieve maximum benefits in BP.
Lastly, the novelty of the present study was to establish the factors associated with the
longitudinal changes in BP after weight loss, which we found to be HT-duration, baseline
levels of BP, BMI and VAT area. Interestingly, these variables are well known clinical risk
factors which, with the exception of VAT area, are easy to obtain with a simple clinical work
up. Indeed, we expected the VAT area to remain significantly associated with BP changes
since it has traditionally been considered the most pathogenic adipose tissue compartment and
in agreement with our findings, several authors have also shown a relationship between VAT
and HT even after adjustment for BMI and WC(28;29)
. Nonetheless, the relationship observed
between BMI and the changes in longitudinal BP deserves special mention; we observed that
patients with a higher BMI reached lower BP levels after weight loss suggesting that the
relationship between BP and BMI changes at very high degrees of obesity. In fact, at the end
of follow-up the BP in subjects with a high baseline BMI tertile (> 47.65 kg/m2) was 121.14
[116.55 to 125.72] mmHg compared to those with a lower BMI tertile (< 42.5 kg/m2) of
135.23 [130.61 to 139.86] mmHg. While it is true that a higher BMI is related to higher BP
levels, no studies have reported the rate of BP response after weight loss within different
ranges of BMI at these higher degrees of obesity. Mechanisms linking obesity and HT have

13
mainly emerged from studies including overweight subjects and individuals with obesity
grade 1, and thus, well-designed studies exploring how an increasing BMI modifies the
relationship of BP with different cardiovascular risk factors in severe obesity are necessary.
This study has limitations; one limitation of the study was that the sample size was calculated
for the expected changes in BP, which were achieved. This may represent a limitation for the
statistical power in the analysis of the data since other variables also involved in BP
regulation were analyzed and should have been taken into account. However, this sample size
was chosen because BP is the key parameter of our evaluation and it can be better ascertained
from the literature. Second, 24-h urinary excretion determination of many of the hormones
measured in this study could have been more representative than the plasma determination in
only one point in order to avoid circadian secretion and pulsatile problems which may be
frequent in plasma hormone determination. Finally, in this study we performed a wide range
of outcome measurements to achieve a better insight into the possible pathogenic mechanisms
of obesity-related HT. However, we did not address other mechanisms that could be
important, such as oxidative stress and endothelial dysfunction, and we did not measure other
adipokines such as adiponectin, the measurement of which could have helped to understand
the role of these mediators in obesity-related HT or how the decrease in the flow of free fatty
acid to the liver can influence hypotensive response after BS. As a consequence, our
conclusion is only one of the many hypotheses to explain the multifactorial nature of obesity-
related HT. Therefore, our results suggest that the mechanism responsible for the fall in BP
after weight loss should be sought in the early stages after BS before a significant weight loss
occurs (excess body weight loss 50%) and the maximum effect of BP has already taken place
(previous to 4 months after BS).

Conclusions
We observed that the hypotensive response after weight loss in hypertensive severely obese
subjects is mainly regulated by HT-duration, baseline BP, BMI and VAT area, independently
of the suppression of hyperinsulinemia or changes in RAAS and SNS components observed
after weight loss. Advances in the knowledge of the mechanisms associated with obesity-
related HT are important because of the relevance of HT as the most frequent co-morbidity of
obesity and the large healthcare costs involved.
Disclosure Statement: None

15
Reference List
1. Pou KM, Massaro JM, Hoffmann U et al. Visceral and subcutaneous adipose tissue
volumes are cross-sectionally related to markers of inflammation and oxidative stress:
the Framingham Heart Study. Circulation 2007;116:1234-41.
2. Bandaru P, Shankar A. Association between plasma leptin levels and diabetes mellitus.
Metab Syndr Relat Disord 2011;9:19-23.
3. Haynes WG, Morgan DA, Walsh SA, Mark AL, Sivitz WI. Receptor-mediated regional
sympathetic nerve activation by leptin. J Clin Invest 1997;100:270-8.
4. Shankar A, Xiao J. Positive relationship between plasma leptin level and hypertension.
Hypertension 2010;56:623-8.
5. Engeli S, Bohnke J, Gorzelniak K et al. Weight loss and the renin-angiotensin-
aldosterone system. Hypertension 2005;45:356-62.
6. Goodfriend TL, Kelley DE, Goodpaster BH, Winters SJ. Visceral obesity and insulin
resistance are associated with plasma aldosterone levels in women. Obes Res
1999;7:355-62.
7. Alvarez GE, Beske SD, Ballard TP, Davy KP. Sympathetic neural activation in visceral
obesity. Circulation 2002;106:2533-6.
8. Dorresteijn JA, Visseren FL, Spiering W. Mechanisms linking obesity to hypertension.
Obes Rev 2012;13:17-26.

16
9. Kalil GZ, Haynes WG. Sympathetic nervous system in obesity-related hypertension:
mechanisms and clinical implications. Hypertens Res 2012;35:4-16.
10. Scherrer U, Randin D, Tappy L, Vollenweider P, Jequier E, Nicod P. Body fat and
sympathetic nerve activity in healthy subjects. Circulation 1994;89:2634-40.
11. Meyers MR, Gokce N. Endothelial dysfunction in obesity: etiological role in
atherosclerosis. Curr Opin Endocrinol Diabetes Obes 2007;14:365-9.
12. Steinberg HO, Chaker H, Leaming R, Johnson A, Brechtel G, Baron AD.
Obesity/insulin resistance is associated with endothelial dysfunction. Implications for
the syndrome of insulin resistance. J Clin Invest 1996;97:2601-10.
13. Aucott L, Poobalan A, Smith WC, Avenell A, Jung R, Broom J. Effects of weight loss
in overweight/obese individuals and long-term hypertension outcomes: a systematic
review. Hypertension 2005;45:1035-41.
14. Neter JE, Stam BE, Kok FJ, Grobbee DE, Geleijnse JM. Influence of weight reduction
on blood pressure: a meta-analysis of randomized controlled trials. Hypertension
2003;42:878-84.
15. Mancia G, Fagard R, Narkiewicz K et al. 2013 ESH/ESC Guidelines for the
management of arterial hypertension: the Task Force for the management of arterial
hypertension of the European Society of Hypertension (ESH) and of the European
Society of Cardiology (ESC). J Hypertens 2013;31:1281-1357.

17
16. Ahmed AR, Rickards G, Coniglio D et al. Laparoscopic Roux-en-Y gastric bypass and
its early effect on blood pressure. Obes Surg 2009;19:845-9.
17. Adams TD, Davidson LE, Litwin SE et al. Health benefits of gastric bypass surgery
after 6 years. JAMA 2012;308:1122-31.
18. Buchwald H, Avidor Y, Braunwald E et al. Bariatric surgery: A systematic review and
meta-analysis. JAMA 2004;292:1724-37.
19. Carson JL, Ruddy ME, Duff AE, Holmes NJ, Cody RP, Brolin RE. The effect of gastric
bypass surgery on hypertension in morbidly obese patients. Arch Intern Med
1994;154:193-200.
20. Hinojosa MW, Varela JE, Smith BR, Che F, Nguyen NT. Resolution of systemic
hypertension after laparoscopic gastric bypass. J Gastrointest Surg 2009;13:793-7.
21. Sugerman HJ, Wolfe LG, Sica DA, Clore JN. Diabetes and hypertension in severe
obesity and effects of gastric bypass-induced weight loss. Ann Surg 2003;237:751-6.
22. Dall'Asta C, Vedani P, Manunta P et al. Effect of weight loss through laparoscopic
gastric banding on blood pressure, plasma renin activity and aldosterone levels in
morbid obesity. Nutr Metab Cardiovasc Dis 2009;19:110-14.
23. Ruano M, Silvestre V, Castro R et al. Morbid obesity, hypertensive disease and the
renin-angiotensin-aldosterone axis. Obes Surg 2005;15:670-6.

18
24. Ortega E, Morinigo R, Flores L et al. Predictive factors of excess body weight loss 1
year after laparoscopic bariatric surgery. Surg Endosc 2012;26:1744-50.
25. Vidal J, Ibarzabal A, Nicolau J et al. Short-term effects of sleeve gastrectomy on type 2
diabetes mellitus in severely obese subjects. Obes Surg 2007;17:1069-74.
26. Mancia G, De BG, Dominiczak A et al. 2007 Guidelines for the Management of Arterial
Hypertension: The Task Force for the Management of Arterial Hypertension of the
European Society of Hypertension (ESH) and of the European Society of Cardiology
(ESC). J Hypertens 2007;25:1105-87.
27. Winnicki M, Bonso E, Dorigatti F et al. Effect of body weight loss on blood pressure
after 6 years of follow-up in stage 1 hypertension. Am J Hypertens 2006;19:1103-9.
28. Hayashi T, Boyko EJ, Leonetti DL et al. Visceral adiposity and the prevalence of
hypertension in Japanese Americans. Circulation 2003;108:1718-23.
29. Hayashi T, Boyko EJ, Leonetti DL et al. Visceral adiposity is an independent predictor
of incident hypertension in Japanese Americans. Ann Intern Med 2004;140:992-1000.

19
Table 1. Demographic and clinical characteristics of the patients at baseline and according to
remission or not of hypertension after bariatric surgery.
Whole group HT remission HT no remission
Nº of patients 37 26 11
Age (years) 52 ± 8 52 ± 8 55 ±8
Sex (male/female) 9/28 3/23 6/5*
Weight (kg) 120 ± 16 121 ± 16 118 ± 16
BMI ( kg/m2) 45 ± 5 46 ± 4 41 ± 4*
EBW (kg) 53 ± 12 56 ± 12 47 ± 12*
WC (cm) 129 ± 11 130 ± 12 128 ± 9
HT evolution (years) 6 ± 6 6 ± 5 8 ± 8
Anti-HT treatment (1/2/3 drugs) 14/21/2 13/12/1 1/9/1*
Type 2 diabetes (yes/no) 14/23 8/18 6/5
Current smoker (yes/no) 7/30 4/22 3/8
Bariatric surgery (GBP/SG) 21/16 16/10 5/6
24 h SBP ( mmHg) 142 ± 8 134 ± 12 146 ± 6*
24 h DBP ( mmHg) 82 ± 9 76 ± 7 86 ± 10*
Abbreviations: HT: Hypertension; BMI: body mass index; EBW: excess body weight, WC:
waist circumference; GBP: gastric bypass; SG: sleeve gastrectomy; SBP: systolic blood
pressure; DBP: diastolic blood pressure.* p< 0.05 HT remission vs. HT not remission.

20
Table 2: Univariate baseline predictor estimates of change over follow-up in baseline-adjusted
SBP levels
24-h SBP
(mmHg)
p-
value
Day-SBP
(mmHg)
p-
value
Night-SBP
(mmHg)
p-
value
Gender (men)
3.01 [-5.41 to
11.43] 0.472
3.03 [-5.7 to
11.76] 0.485
2.65 [-6.79 to
12.08] 0.572
Age ( year)
0.48 [0.07 to
0.88] 0.024
0.53 [0.12 to
0.94] 0.014
0.5 [0.04 to
0.96] 0.035
HT-duration
(years)
0.65 [0.09 to
1.21] 0.024
0.73 [0.17 to
1.28] 0.012
0.66 [0.01 to
1.31] 0.046
Type of surgery
(GB)
4.75 [-2.37 to
11.86] 0.184
5 [-2.28 to
12.28] 0.172
3.19 [-4.9 to
11.29] 0.428
BMI (kg/m2)
-1.38 [-2.03 to -
0.73] 0.000
-1.27 [-2 to -
0.54] 0.001
-1.91 [-2.49 to -
1.32] 0.000
BW (kg)
-0.26 [-0.47 to -
0.05] 0.019
-0.27 [-0.48 to -
0.05] 0.018
-0.3 [-0.53 to -
0.06] 0.014
WC (cms)
-0.37 [-0.69 to -
0.05] 0.023
-0.33 [-0.66 to
0.01] 0.047
-0.43 [-0.79 to -
0.07] 0.020
EBW (kg)
-0.49 [-0.74 to -
0.24] 0.000
-0.48 [-0.74 to -
0.21] 0.001
-0.61 [-0.86 to -
0.36] 0.000
Aldosterone
(ng/dl)
0.65 [-0.63 to
1.93] 0.307
0.57 [-0.75 to
1.88] 0.386
0.82 [-0.57 to
2.22] 0.237
NE (pg/ml)
-0.05 [-0.11 to
0.01] 0.081
-0.04 [-0.1 to
0.02] 0.164
-0.07 [-0.13 to -
0.01] 0.035
VAT ( 100 cm2) 0.03 [-0.01 to 0.102 0.05 [0 to 0.09] 0.032 0.01 [-0.04 to 0.619

21
0.08] 0.06]
SAT (100 cm2)
-0.02 [-0.04 to
0] 0.040
-0.02 [-0.04 to
0] 0.068
-0.03 [-0.05 to
0] 0.018
The predictor variables were all measured at the baseline visit. The predictor estimates
indicate the estimated change [95%CI] in mmHg per either 1-unit change for continuous
variables or for being in the category referred in parenthesis. GB: gastric bypass vs. sleeve
gastrectomy; BMI: body mass index; BW: body weight; WC: waist circumference; EBW:
excess body weight; NE: norepinephrine; VAT: visceral adipose tissue; SAT: subcutaneous
adipose tissue. Values in red are statistically significant.

22
Table 3: Univariate baseline predictors estimates of change over follow-up in baseline-
adjusted DBP levels
24-h DBP
(mmHg)
p-
value
Day- DBP
(mmHg)
p-
value
Night- DBP
(mmHg)
p-
value
Gender (men)
2.76 [-2.42 to
7.93] 0.286
2.53 [-3.57 to
8.62] 0.405
2.3 [-2.77 to
7.36] 0.363
Age (years)
0.17 [-0.1 to
0.44] 0.212
0.19 [-0.13 to
0.51] 0.244
0.13 [-0.12 to
0.39] 0.297
Type of surgery
(GB)
2.21 [-2.22 to
6.65] 0.318
1.45 [-3.83 to
6.73] 0.580
0.86 [-3.44 to
5.17] 0.686
HT-duration
(years)
0.25 [-0.1 to
0.61] 0.160
0.33 [-0.09 to
0.74] 0.118
0.1 [-0.26 to
0.45] 0.578
BMI (kg/m2)
-0.31 [-0.78 to
0.16] 0.193
-0.35 [-0.91 to
0.21] 0.213
-0.53 [-0.97 to -
0.1] 0.017
WC (cms)
-0.1 [-0.31 to
0.1] 0.316
-0.11 [-0.35 to
0.14] 0.373
-0.16 [-0.36 to
0.04] 0.104
BW ( kg)
-0.03 [-0.17 to
0.11] 0.674
-0.04 [-0.2 to
0.12] 0.639
-0.04 [-0.17 to
0.09] 0.538
EBW (kg)
-0.09 [-0.27 to
0.09] 0.307
-0.1 [-0.31 to
0.1] 0.321
-0.14 [-0.31 to
0.03] 0.095
Aldosterone
(ng/dl)
0.49 [-0.35 to
1.32] 0.246
0.43 [-0.57 to
1.43] 0.389
0.61 [-0.13 to
1.35] 0.103
NE (pg/ml)
-0.01 [-0.05 to
0.02] 0.453
-0.01 [-0.05 to
0.03] 0.569
-0.02 [-0.06 to
0.01] 0.209
VAT (cm2) 0.03 [0.01 to 0.012 0.04 [0.01 to 0.015 0.02 [-0.01 to 0.247

23
0.06] 0.06] 0.04]
SAT (cm2)
-0.01 [-0.02 to
0] 0.135
-0.01 [-0.02 to
0] 0.173 -0.01 [-0.02 to 0] 0.055
The predictor variables were all measured at the baseline visit. The predictor estimates
indicate the estimated change [95%CI] in mmHg per either 1-unit change for continuous
variables or for being in the category referred between parentheses. GB: gastric bypass vs.
sleeve gastrectomy; BMI: body mass index; BW: body weight; WC: waist circumference;
EBW: excess body weight; NE: norepinephrine; VAT: visceral adipose tissue; SAT:
subcutaneous adipose tissue. Values in red are statistically significant.

24
Table 4. Baseline and follow-up multivariate* predictors of change over follow-up in
baseline-adjusted SBP levels.
24-h SBP
(mmHg)
p-
valu
e
Day- SBP (
mmHg)
p-
valu
e
Night-SBP
(mmHg)
p-
valu
e
Baseline SBP, per 1
mmHg increase
0.27 [0.03 to
0.51]
0.03
0
0.23 [0 to
0.46]
0.04
8
0.34 [0.13 to
0.55]
0.00
2
HT-duration, per 1 year
increase
0.47 [0.06 to
0.89]
0.02
5
0.53 [0.1 to
0.96]
0.01
7
0.43 [0.01 to
0.86]
0.04
3
BMI, per 1-unit increase
-1.49 [-2.06 to
-0.92]
0.00
0
-1.36 [-1.97 to
-0.75]
0.00
0
-1.94 [-2.5 to
-1.37]
0.00
0
VAT, per 100 cm2
increase
4.76 [1.78 to
7.75]
0.00
3
5.37 [2.26 to
8.48]
0.00
1
3.17 [0.11 to
6.23]
0.04
3
The model was constructed on a forward stepwise basis, including only variables significant
at the 10% two-sided alpha level. BMI: body mass index; VAT: visceral adipose tissue.
25
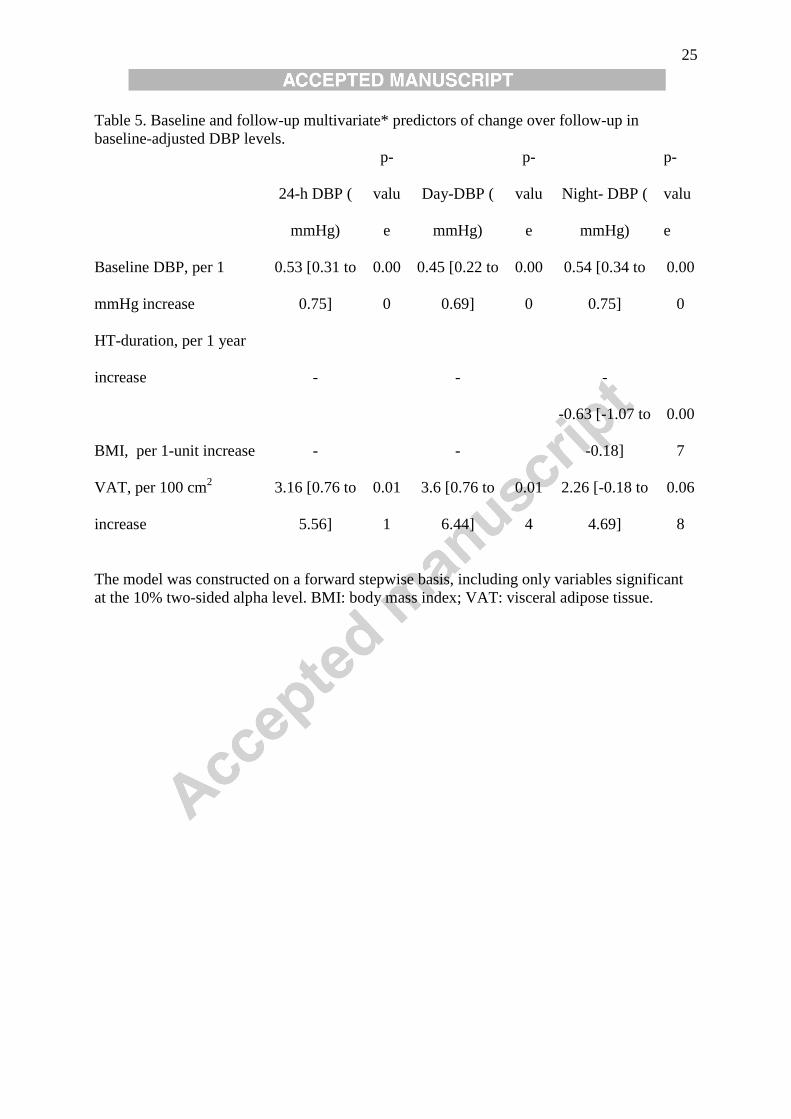
Table 5. Baseline and follow-up multivariate* predictors of change over follow-up in
baseline-adjusted DBP levels.
24-h DBP (
mmHg)
p-
valu
e
Day-DBP (
mmHg)
p-
valu
e
Night- DBP (
mmHg)
p-
valu
e
Baseline DBP, per 1
mmHg increase
0.53 [0.31 to
0.75]
0.00
0
0.45 [0.22 to
0.69]
0.00
0
0.54 [0.34 to
0.75]
0.00
0
HT-duration, per 1 year
increase - - -
BMI, per 1-unit increase - -
-0.63 [-1.07 to
-0.18]
0.00
7
VAT, per 100 cm2
increase
3.16 [0.76 to
5.56]
0.01
1
3.6 [0.76 to
6.44]
0.01
4
2.26 [-0.18 to
4.69]
0.06
8
The model was constructed on a forward stepwise basis, including only variables significant
at the 10% two-sided alpha level. BMI: body mass index; VAT: visceral adipose tissue.