long-term services and supports state scorecard 2020 edition
TRANSCRIPT

Susan Reinhard, Ari Houser, Kathleen Ujvari, Claudio Gualtieri, Rodney Harrell, Paul Lingamfelter, Julia Alexis
Long-Term Services and Supports State Scorecard 2020 Edition
AARP Public Policy Institute longtermscorecard.org
A State Scorecard on Long-Term Services and Supports for Older Adults, People with Physical Disabilities, and Family Caregivers
2
ADVANCING ACTION | LONGTERMSCORECARD.ORG
AARP Foundation’s mission is to serve vulnerable people ages 50+ by creating and advancing effective solutions that help them secure the essentials. AARP Foundation helps millions of older Americans who struggle to meet their basic need for nutritious food, safe and affordable housing, adequate income, and much-needed personal connections.
The Commonwealth Fund, among the first private foundations started by a woman philanthropist—Anna M. Harkness—was established in 1918 with the broad charge to enhance the common good. The mission of The Commonwealth Fund is to promote a high-performing health care system that achieves better access, improved quality, and greater efficiency, particularly for society’s most vulnerable, including low-income people, the uninsured, and people of color. The Fund carries out this mandate by supporting independent research on health care issues and making grants to improve health care practice and policy.
The SCAN Foundation is an independent public charity devoted to advancing a coordinated and easily navigated system of high-quality services for older adults that preserve dignity and independence. For more information, visit http://www.TheSCANFoundation.org.

3
ADVANCING ACTION | LONGTERMSCORECARD.ORG
Preface
From the Authors: The Scorecard’s Release in a 2020 ContextAdvancing Action: A State Scorecard on Long-Term Services and Supports for Older Adults, People with Physical Disabilities, and Family Caregivers is the fourth edition in a series that began in 2011.
This report is a compilation of state data and analysis that is based on a vision of a high-performing system of long-term services and supports (LTSS). By using reliable, consistent, available data, it is designed to spark conversations that can result in actionable solutions at the local, state, and national levels—solutions that help older adults, people with physical disabilities, and their family caregivers live their best lives possible. Making that happen is the responsibility of both the public and private sectors, with advocates playing crucial roles. And consumers’ choices and actions ultimately affect a state’s LTSS system as well.
The 2020 Scorecard in Context of a PandemicClearly, context matters. As we release this Scorecard, the nation is in the midst of a coronavirus pandemic (COVID-19) that is highly contagious and has particular severity for older people, those with multiple health conditions, and the direct care workers and family caregivers who support them. At the time of this writing, COVID-19 is perhaps the single greatest global concern, affecting every sector of life, including the economy, social interaction, health care, and—directly related to this Scorecard—LTSS system performance. Yet as a result of the sudden arrival and ongoing impact of the virus, it is outside the scope of this edition of the Scorecard. The most current available data, collected for this Scorecard, generally cover the period 2016–2019. These data were collected and analyzed in 2019, and so the Scorecard paints a picture of comprehensive LTSS system performance before the outbreak began. LTSS system performance in the areas of affordability and access, choice of setting and provider, quality of life and quality of care, support for family caregivers, and effective transitions remain both highly variable between states and critically important.
Scorecard Findings and COVID-19: Setting ExpectationsIt is important to consider certain elements of the Scorecard as it relates to the current pandemic.
First, the Scorecard does not contain any measures that are directly relevant to COVID-19 preparedness, impact, or response. This is not merely because the Scorecard data predate the emergence of the virus. Currently available COVID-19 measures are not complete or consistently comparable across states, LTSS settings, and source of payment. If it were possible to include COVID-19 preparedness or response measures in the Scorecard, they would be included in the Quality of Life and Quality of Care dimension. We have long called for better and more comparable data on LTSS users, services, outcomes, and especially quality—even considering the quality dimension to be incomplete in the last two Scorecards. The recent outbreak shines a stronger light on why more and better data are needed.

4
ADVANCING ACTION | LONGTERMSCORECARD.ORG
Second, the prevalence of COVID-19 cases, deaths, and other adverse outcomes in LTSS settings depends not only on LTSS system performance but also on a number of public health and societal factors, and the rate of community spread. Where there is significant community spread of COVID-19, there will be a significant impact on the LTSS system. That does not mean, however, that LTSS providers, policy makers, and other stakeholders are helpless in affecting the spread and lethality of COVID-19. Their role is crucial, even if the impact cannot be adequately measured at this time.
Third, the COVID-19 pandemic has put a national spotlight on one particular LTSS setting: nursing homes. With good reason, both the public and policy makers are concerned about the disproportionate impact on vulnerable individuals with underlying health conditions living in congregate care settings. However, most people receiving LTSS are not in nursing homes. LTSS users and providers in other settings are also highly vulnerable, and should similarly get special attention and public scrutiny. As states begin to rethink congregate care settings after COVID-19, other sources of LTSS, including home- and community-based services (HCBS) and family caregiving, may increase in importance.
The Scorecard’s Appeal: Reimagining Policy SolutionsThe pandemic has drawn attention to LTSS challenges, especially in residential settings. We will need to learn from COVID-19 experiences, but it is the data in the Scorecard that will provide the foundation for understanding LTSS system reform today and tomorrow. State LTSS systems may look very different in a post-pandemic world, in ways that we cannot yet know. The Scorecard offers policy ideas and best practices that can help states achieve high performance as they rebuild and reimagine their LTSS systems going forward.
Some of the policies tracked in the Scorecard are particularly critical as the nation moves to relief and recovery post-COVID. For example, having paid sick leave and being able to use it for family caregiving becomes even more important, so that individuals can tend to their own health and the health of their family members without the risk of losing a paycheck. Similarly, states with policies enabling them to fully utilize their health care workforce offer consumers greater access to health care services and preventative screenings that can help individuals live healthy independent lives. Policies that promote direct patient access to nurse practitioners, working to the full extent of their education and training, also expands the health care workforce capacity to manage a future health crisis.
Lessons Learned and Policy Efforts Linked to Scorecard FindingsA fundamental shift to more consumer options for HCBS will be both essential to keep consumers safe and a financial necessity for states struggling with post-COVID budget deficits. Once the public health emergency is over, states will likely face enormous budget shortfalls and an arduous economic recovery. This will put new pressure on policy makers to offer consumers choices that keep them safe at home and, from the budget-conscious policy-maker perspective, at a fraction of the cost of institutional care.
Independent living options also require a robust health care and LTSS workforce. Several states took emergency action to expand health care access by enabling nurse practitioners to work to the full extent of their education and training during the pandemic. States that temporarily provided direct patient access to nurse practitioners will need to consider permanent policy solutions that ensure patients receive care when and where they need it. Additional emergency actions, such as creating centralized referral and information services or toll-free hotlines, can become the basis of a robust “No Wrong Door” system that helps individuals and family caregivers navigate LTSS options, including nursing home alternatives, regardless of where they first seek help.

5
ADVANCING ACTION | LONGTERMSCORECARD.ORG
Information Informs ImprovementEmergencies can illuminate the vulnerabilities in local, state, and national systems, for people of all ages. They can also present a renewed interest in data, trends, and best practices that can inform evidence-based decisions. This in turn can spark reflection and reassessment of long-standing policies and create the opportunity for an intentional redesign of a high-performing LTSS system.
Good data and accurate measurements are the foundation for meaningful improvement. The deadly consequences of COVID-19 in nursing homes add new urgency and demand for relevant and reliable data on infection, quality, and preparedness. These and other data are essential to inform evidence-based solutions and raise the level of LTSS system performance. The Scorecard remains committed to capturing the best available, reliable data on LTSS quality, including relevant and appropriate infection measures arising from the COVID-19 pandemic.
Historically we have envisioned the LTSS Scorecards, including this latest edition, as a tool to identify opportunities and catalyze improvement of state LTSS systems to meet growing future demand for long-term services and supports. Now more than ever, the 2020 Scorecard calls for advancing action to improve the lives of older adults, people with disabilities, and family caregivers.
6
ADVANCING ACTION | LONGTERMSCORECARD.ORG
Table of ContentsList of Exhibits ........................................................................................................................................ 6Purpose ................................................................................................................................................... 7About the Scorecard .............................................................................................................................. 7The Vision ............................................................................................................................................... 9How Different Stakeholders Can Use the Scorecard ............................................................................ 9State Rankings ..................................................................................................................................... 12Major Findings ...................................................................................................................................... 15Key Findings by Dimension .................................................................................................................. 24
Dimension 1 Affordability and Access .......................................................................................... 24Dimension 2 Choice of Setting and Provider ................................................................................ 27Dimension 3 Quality of Life and Quality of Care ............................................................................ 30Dimension 4 Support for Family Caregivers ................................................................................. 33Dimension 5 Effective Transitions ................................................................................................. 37
Reflections ............................................................................................................................................ 39Appendices ........................................................................................................................................... 41
List of ExhibitsExhibit 1 Framework for Assessing LTSS System Performance ................................................... 8Exhibit 2 National Heat Map: Overall Ranking ............................................................................ 12Exhibit 3 Matrix Heat Map: Overall Ranking ................................................................................ 13Exhibit 4 Change in State Performance by Indicator: Percentage of States ............................. 15Exhibit 5 Top Five States and Improvements Needed ................................................................ 16Exhibit 6 Number of Indicators Improved and Declined by State .............................................. 17Exhibit 7 Top- and Bottom-Ranked States in Overall System Performance ............................... 18Exhibit 8 Number of Private LTCI Policies in Effect, 2015 and 2018 ......................................... 21Exhibit 9 Demand Outpaces Supply for Subsidized Housing Opportunities ............................. 22Exhibit 10 State Ranking on Affordability and Access Dimension ............................................... 24Exhibit 11 State Performance: Low-Income PWD with Medicaid ................................................. 25Exhibit 12 State Ranking on Choice of Setting and Provider Dimension ..................................... 27Exhibit 13 State Ranking on Quality of Life and Quality of Care Dimension ............................... 30Exhibit 14 State Ranking on Support for Family Caregivers Dimension ...................................... 33Exhibit 15 State Ranking on Effective Transitions Dimension ...................................................... 37

7
ADVANCING ACTION | LONGTERMSCORECARD.ORG
A State Scorecard on Long-Term Services and Supports for Older Adults, People with Physical Disabilities, and Family Caregivers
PurposeThe 2020 Long-Term Services and Supports (LTSS) State Scorecard aims to empower state and federal policy makers, the private sector, and consumers with information they need to do the following:
• Effectively assess their state’s performance across multiple dimensions and indicators.
• Learn from other states.
• Improve the lives of older adults, people with disabilities, and their families.
The Scorecard is guided by the belief that, in order to meaningfully manage and improve performance, one must measure it. Unlike many other rankings that focus on a particular aspect of LTSS system performance, the Scorecard compares state LTSS systems across multiple dimensions of performance, reflecting the importance and interconnectedness each has on the overall LTSS system. The goal is to spark conversations, galvanize broad-based coalitions, and focus stakeholders’ attention on the factors that most directly impact consumers and their families.
About the ScorecardLTSS affects everyone. LTSS includes a continuum of services provided in the home and community or an institutional setting. These supports help older people and adults with physical disabilities manage tasks that would be difficult or impossible to perform on their own, such as personal care (e.g., bathing, dressing, and toileting); complex care (e.g., medication administration, wound care); home care (e.g., help with housekeeping and meal preparation), and transportation. Although older people are more likely to need LTSS, people of all ages rely on the LTSS system. In 2018, more than half (56 percent) of American adults who needed LTSS were ages 65 or older, while 44 percent were ages 18 to 64.1 The LTSS system can also be a source of support for approximately 41 million family caregivers who help family and close friends with daily tasks.2 In 2017, collectively about $235 million was spent on formal (paid) LTSS across all settings.3
As the country ages and adults with physical disabilities seek more options to remain independent, the need for LTSS will continue to grow. States have the opportunity to act now in strengthening LTSS systems and identifying new ways to maximize the use of limited resources to account for these demographic shifts.
The Scorecard offers accurate, reliable, and comparable data that can serve as the basis for evidence-based solutions so that older people and adults with disabilities in all states can exercise choice and control over their lives, thereby maximizing their independence and well-being. High-performing LTSS systems also ensure that family caregivers have the support they need when caring for close relatives and friends.
1 Edem Hado and Harriet Komisar, “Long-Term Services and Supports,” Fact Sheet, AARP Public Policy Institute, Washington, DC, August 2019, https://www.aarp.org/content/dam/aarp/ppi/2019/08/long-term-services-and-supports.doi.10.26419-2Fppi.00079.001.pdf.
2 Susan C. Reinhard et al., Valuing the Invaluable: 2019 Update: Charting a Path Forward (Washington, DC: AARP Public Policy Institute, November 2019), https://www.aarp.org/content/dam/aarp/ppi/2019/11/valuing-the-invaluable-2019-update-charting-a-path-forward.doi.10.26419-2Fppi.00082.001.pdf.
3 Hado and Komisar (2019).

8
ADVANCING ACTION | LONGTERMSCORECARD.ORG
HIGH-PERFORMING LTSS SYSTEM
Five dimensions of LTSS performance, constructed from 26 individual indicators.
ADRC/NWD - Aging and Disability Resource Center/No Wrong DoorHCBS - Home- and Community-Based ServicesLTSS - Long-Term Services and SupportsPWD - People with Disabilities*Support for Family Caregivers Dimension evaluated across 12 individual policies, which are grouped into four broad categories.
Source: Long-Term Services and Supports State Scorecard, 2020.
AFFORDABILITY AND ACCESS
1. Nursing Home Cost2. Home Care Cost3. Long-Term Care Insurance4. Low-Income PWD with Medicaid5. PWD with Medicaid LTSS6. ADRC/NWD Functions
CHOICE OF SETTING AND
PROVIDER
1. Nursing Home Residents with Low Care Needs2. Home Health Hospital Admissions3. Nursing Home Hospital Admissions4. Burdensome Transitions5. Successful Discharge to Community
EFFECTIVE TRANSITIONS
SUPPORT FOR FAMILY
CAREGIVERS*
1. Supporting Working Family Caregivers2. Person- and Family-Centered Care3. Nurse Delegation and Scope of Practice4. Transportation Policies
1. Medicaid LTSS Balance: Spending2. Medicaid LTSS Balance: Users3. Self-Direction4. Home Health Aide Supply5. Assisted Living Supply6. Adult Day Services Supply7. Subsidized Housing Opportunities
1. PWD Rate of Employment2. Nursing Home Residents with Pressure Sores3. Nursing Home Antipsychotic Use4. HCBS Quality Benchmarking
QUALITY OF LIFE AND QUALITY
OF CARE
EXHIBIT 1 Framework for Assessing LTSS System Performance
Furthermore, the Scorecard strives to present a complete and comprehensive assessment of LTSS system performance across five key characteristics; but the Scorecard can only be as complete and comprehensive as the data that are available to measure performance, and data availability continues to fall short of where it ought to be. From the beginning of the Scorecard project, a key finding has been that better data are needed to assess state LTSS system performance. In the first Scorecard, released in September 2011, six specific data gaps were identified, and others have subsequently been noted.
In the decade since that initial assessment, there have been some successes in addressing these gaps, particularly in the area of effective transitions, and measures of subsidized housing and transportation policies. However, there have been some retreats in data quality and availability as well: quality of life in the community, staffing turnover, and basic Medicaid LTSS participant and spending data. In the last Scorecard, continued erosion of data availability to measure quality of life and quality of care resulted in the dimension being considered “incomplete.” That continues to be the case in this Scorecard, and better data are still needed, such as prevention of infection in all LTSS settings (e.g., nursing homes, assisted living, adult day care, and home care).

9
ADVANCING ACTION | LONGTERMSCORECARD.ORG
The VisionBy definition, a vision is aspirational. Guided by the Scorecard National Advisory Panel, our vision of LTSS system performance is composed of five characteristics that are approximated in the Scorecard by dimensions for which LTSS performance can be measured where data are available. Each dimension is constructed from individual indicators that are interpretable and show variation across states (see Exhibit 1). Achieving this vision takes concerted action, as well as data to measure the extent to which states reach the vision.
1. Affordability and AccessConsumers are able to easily find, pay for, and receive the services they need in the setting they choose. Medicaid public safety nets are sufficient to provide peace of mind and security to those who cannot afford services.
2. Choice of Setting and ProviderConsumers are at the center of care and have the choice of setting and control over their services and who provides them.
3. Quality of Life and Quality of CareConsumers are treated with dignity and respect. Their personal preferences and aspirations are honored whenever possible. The services they receive are effective and quality is measured and compared both within and across states for continuous improvement.
4. Support for Family Caregivers Family caregivers are recognized as the backbone of the LTSS system. Caregivers’ own needs are identified and supported.
5. Effective TransitionsConsumers experience seamless coordination across LTSS and health care systems with minimal disruption and unnecessary hospitalizations.
How Different Stakeholders Can Use the Scorecard State Agencies/Policy MakersThe Scorecard is a useful tool to benchmark and compare LTSS performance across states and identify innovative and promising practices. Here are some ways state agencies and policy makers can use the Scorecard to advance action:
• Ensure effective implementation. State agencies play a critical role in implementing policy decisions in their state. Areas of weakness identified by the Scorecard may signal the need for additional quality oversight or monitoring. In the absence of sufficient data to guide decisions, policy makers should seek more data as part of any plan of action.
• Influence policy debates. Agency officials and program managers can look within their own state data to understand what the Scorecard is measuring and how those measurements reflect performance against other states. State agency officials can refer to Scorecard findings to inform policy decisions, evaluate funding proposals, and shape public debate.
• Discover promising practices. The Scorecard highlights a handful of states that stand out in performance. Examples of innovative solutions are documented in Promising Practices and Emerging Innovations reports available at http://www.longtermscorecard.org. Policy makers may choose to adopt successful strategies from other states to improve their LTSS system.
• Engage the public and private sectors. Consider sharing the information about state rankings with community partners, advocates, the private sector, and other stakeholders to assess what is or is not working. The Scorecard measurements can help guide those conversations and drive consensus on action steps.

10
ADVANCING ACTION | LONGTERMSCORECARD.ORG
AdvocatesThe Scorecard can serve as a road map to improve the lives of individuals who use LTSS and increase efficiencies in state LTSS systems. Here are some ways that advocates can use the Scorecard to advance action:
• Seek robust quality data and public reporting. In order to ensure consumers are well-informed and prepared to advocate for themselves and their family members, they must have access to reliable and current LTSS data for both institutional and community settings. Where public reporting and data collection is inconsistent, advocates should seek more data and transparency.
• Identify opportunities. Advocates can consider how recent initiatives and strategies have impacted state performance across various indicators over time. If there are links between recent policy or budget decisions and improvements in performance, advocates may choose to celebrate that progress. Advocates can apply the information available in the Scorecard to tackle needs and leverage opportunities locally.
• Evaluate legislative and budget proposals against Scorecard measurements. Scorecard data, charts, state fact sheets, and state comparisons can provide advocates with an evidence-based rationale to support policy changes and enactment of model legislation. Advocates may wish to refer to Scorecard findings when delivering public testimony before legislative committees or making presentations to relevant stakeholders.
• Draw comparisons to similar states. Advocates may wish to adopt successful strategies from high-performing states and seed those ideas with key policy makers and legislators. When looking for other state examples, it may be useful to start with neighboring states or those with similar population size or demographics.
• Spark conversation. The Scorecard can be a useful resource to build bridges with other organizations and spark conversation with the public so that those and other stakeholders can understand state results, assess common priorities, and identify opportunities for action.
• Capture the attention of key influencers. Advocates may wish to leverage the Scorecard to draw attention to the findings and implications for local residents. Advocates can help identify points of intersection between state policy priorities and the Scorecard findings. Additionally, advocates can help contextualize the data by sharing personal stories and experiences with policy makers.
Family CaregiversThe Scorecard provides family caregivers with a high-level scan of policies in place to assist and support them. Availability of these supports varies considerably across states.
• Find available resources. The Scorecard may alert family caregivers about a new resource or an underutilized benefit in their own state. For example, a family caregiver may learn that their state or locality guarantees family caregivers workplace protections against discrimination or flexible leave to help balance work and family responsibilities.

11
ADVANCING ACTION | LONGTERMSCORECARD.ORG
Fourth Edition of the ScorecardThis 2020 Long-Term Services and Supports State Scorecard is the fourth edition in an ongoing series. The previous Scorecards were published in 2011, 2014, and 2017. The 2020 Scorecard ranks all 50 states and the District of Columbia on a set of 26 indicators across 5 dimensions. Ten indicators in the 2020 Scorecard differ from the previous edition: 2 indicators are entirely new; 2 indicators are replaced with similar constructs; and 6 have revised definitions, owing to changes in data sources or data availability.
New Indicators (2):• Adult day services total licensed capacity per 10,000 population ages 65 and older• Home- and community-based services (HCBS) quality cross-state benchmarking capability
Replaced Indicators (2): • Estimated percentage of Medicaid aged/disabled LTSS users receiving HCBS • Percentage of short-stay residents who were successfully discharged to the community
Revised Indicators (6):• Private long-term care insurance policies in effect per 1,000 population ages 40+• Estimated Medicaid LTSS users per 100 population with ADL disability• Percentage of high-risk nursing home residents with pressure sores • Percentage of nursing home residents with low care needs• Percentage of home health patients with a hospital admission• Percentage of nursing home residents with one or more potentially burdensome transitions at
end of life
Tools to UseFind full results and more on the LTSS State Scorecard website. Go to http://www.longtermscorecard.org for the following:
1. State Data and Fact SheetsGet state-specific data, compare state performance and/or rankings, and download fact sheets for each state.
2. Maps, Graphics, and ToolsExplore the data with easy-to-use maps and tools. Visualize the findings in each dimension.
3. VideosSee the impact of the Scorecard and programs for people with LTSS needs.
4. Promising Practices and Other ResourcesDownload, read, and share papers that provide concrete examples of programs and policies from states that have performed well in a specific area. Learn which LTSS innovations states are developing, piloting, or testing.

12
ADVANCING ACTION | LONGTERMSCORECARD.ORG
State RankingsHow Does Your State Rank?Exhibit 2 shows overall state LTSS system performance by quartile across all 50 states and the District of Columbia.4 Exhibit 3 presents all states in order of overall LTSS system performance and shows performance across all five key dimensions. High-performing state LTSS systems tend to perform well across all dimensions, while low-performing states have room for improvement in many areas. Complete results for every dimension and indicator are available in the Appendices.
Overall LTSS RankingTop QuartileSecond QuartileThird QuartileBottom Quartile
DE
MD
DC
HI
AK
AZ
UTNV
CA
NM
OR
WA
WY
ID
MT ND
SD
NE
COKS
OK
TX
MN
IA
MO
AR
LA
WI
MI
IL IN
KY
TN
MS AL GA
FL
SC
NC
VA
OH
WV
RI
NJPA
NY
ME
NH
VT
MACT
EXHIBIT 2 2020 State Scorecard Summary of LTSS System Performance Across Dimensions—National Heat Map of All States and the District of Columbia
Note: Rankings are not entirely comparable to previous Scorecard rankings. Changes in rank may not reflect changes in performance. Measures may be different and improved performance can result in a lower rank if other states experienced greater improvement.
Source: Long-Term Services and Supports State Scorecard, 2020.

13
ADVANCING ACTION | LONGTERMSCORECARD.ORG
Dimension Ranking1 Minnesota2 Washington3 Wisconsin4 Oregon5 Vermont6 Connecticut7 Hawaii8 Colorado9 California
10 Massachusetts11 New York12 New Jersey13 Maryland14 District of Columbia15 Texas16 Alaska17 New Mexico18 Illinois19 Virginia19 Ohio21 Pennsylvania22 Delaware23 Maine24 Rhode Island25 Nebraska26 Arizona27 Montana28 North Dakota29 Idaho30 Missouri30 Michigan32 Iowa33 Wyoming34 Utah35 New Hampshire36 South Dakota37 Kansas38 North Carolina39 Georgia40 Mississippi41 Nevada42 Louisiana43 Tennessee44 Indiana44 Arkansas46 Oklahoma47 Kentucky48 South Carolina49 Alabama50 West Virginia51 Florida
Top QuartileSecond QuartileThird QuartileBottom Quartile
StateOverall Rank
Affo
rdab
ility a
nd A
cces
s
Quali
ty of
Life
and Q
ualit
y of C
are
Supp
ort f
or Fa
mily
Car
egive
rs
Effe
ctive
Tran
sition
s
Prov
ider
Choic
e of S
ettin
g and
EXHIBIT 3 2020 State Scorecard Summary of LTSS System Performance Across Dimensions—Matrix Heat Map of All States and the District of Columbia
Source: Long-Term Services and Supports State Scorecard, 2020.

14
ADVANCING ACTION | LONGTERMSCORECARD.ORG
Measuring Change In Performance Over TimeOne of the main goals of this report is to assess how state LTSS systems improved or declined between the 2017 Scorecard and the 2020 Scorecard. However, state ranks at the dimension and overall levels should not be compared directly between the current Scorecard and prior Scorecards. There are significant changes in the methodology and indicator sets, so changes in rank may not reflect actual changes in relative performance.
Change in performance can be measured directly at the indicator level. Baseline year data (typically three years prior to the most current data) are available for 21 of the 26 indicators in the Scorecard. For these 21 indicators, the Scorecard reports both current and baseline data, and identifies meaningful change (either positive or negative). Note that the period of time covered by the data varies by indicator. Some measures have a significant data lag, so the change measured in the 2020 Scorecard may have occurred prior to the publication of the 2017 Scorecard.
To aid in the interpretation of indicator-level change, appendix data tables show current and baseline values for each trended indicator, and also indicate the magnitude of changes with a green check mark for a substantial improvement, a red X for a substantial decline, and a black, two-headed arrow for little or no change. For most measures, a threshold of 10 or 20 percent or more was used. More detail about how change over time is measured, including thresholds for each trended indicator, may be found in Exhibit B3 in Appendix B.
A Note On Methodology The scoring and ranking methodology in this Scorecard is based on the same methodology used in previous LTSS State Scorecards. As in the 2017 Scorecard, the Quality of Life and Quality of Care dimension is given half the weight of the other dimensions in determining the overall rank, and the Support for Family Caregivers dimension is calculated as a single composite.
Dimensions and Indicators: The Scorecard measures LTSS system performance using 26 indicators (or policy categories) across 5 dimensions:
• Affordability and Access (6 indicators) • Choice of Setting and Provider (7 indicators) • Quality of Life and Quality of Care (4 indicators) • Support for Family Caregivers (12 policy areas, grouped into 4 broad categories) • Effective Transitions (5 indicators)
Indicators had to be clear, important, and meaningful, and have comparable data available at the state level. These 26 indicators were selected because they represent the best available measures at the state level. While no single indicator can fully capture LTSS system performance, taken together they provide a useful measure of how state LTSS systems compare across a range of important dimensions.
Ranking Methodology: The Scorecard ranks the states from highest to lowest performance on each indicator in the Affordability and Access, Choice of Setting and Provider, Quality of Life and Quality of Care, and Effective Transitions dimensions. Within each of these four dimensions, individual indicator ranks are averaged and those averages are then re-ranked for dimension-level ranks. The Support for Family Caregivers dimension is a single composite across all 12 policy areas, and dimension rank is based on the total composite score. The dimension ranks are then averaged (with the Quality dimension given half weight) and re-ranked to compute the overall ranking of LTSS system performance. In the case of missing data or ties in rank, minor adjustments are made to values used in calculating the average. See Exhibit B2 in Appendix B for more detail.

15
ADVANCING ACTION | LONGTERMSCORECARD.ORG
Major FindingsStates Made Modest Progress, but the Status Quo Dominates State performance remained largely flat across most of the indicators. As demonstrated by the gray bars in Exhibit 4, among the 21 indicators for which performance could be measured over time, at least 60 percent of states (more than 30 states) showed little or no change for 15 indicators. With only incremental improvement across indicators at a time when demographic trends portend a rapid increase in LTSS demand, the Scorecard results suggest that many states may not be well prepared to offer affordable, accessible LTSS choices for individuals in the future.
EXHIBIT 4 Change in State Performance by Indicator: Percentage of States
Nursing Home Cost
Home Care Cost
Long-Term Care Insurance
Low-Income PWD with Medicaid
PWD with Medicaid LTSS
ADRC/NWD Functions
Medicaid LTSS Balance: Spending
Medicaid LTSS Balance: Users
Home Health Aide Supply
Assisted Living Supply
Adult Day Services Supply
Subsidized Housing Opportunities
PWD Rate of Employment
Nursing Home Antipsychotic Use
Supporting Working Family Caregivers
Person- and Family-Centered Care
Nurse Delegation and Scope of Practice
Transportation Policies
Home Health Hospital Admissions
Nursing Home Hospital Admissions
Burdensome Transitions
No Significant ChangeSignificant Improvement Significant Decline
Indicator
Percentage of States with a Significant Change in Performance
Affordability and Access
Choice of Setting and Provider
Quality of Life and Quality of Care
Support for Family Caregivers
Effective Transitions
0% 10% 20% 30% 40% 50% 60% 70% 80% 90% 100%
Improvement or decline means a significant change (usually +/- 10% or equivalent) since a reference data year (usually three years prior). For some measures, a revised baseline is used, as the indicator definition or data source may have changed since the last Scorecard. ADRC/NWD = Aging and Disability Resource Center/No Wrong Door.PWD = People with Disabilities.
Source: Long-Term Services and Supports State Scorecard, 2020.

16
ADVANCING ACTION | LONGTERMSCORECARD.ORG
On some elements of LTSS system performance, however, some states did pick up the pace of change. Specifically, at least 40 percent of states (more than 20 states) showed significant improvement in performance in five indicators:
• Aging and Disability Resource Center (ADRC)/No Wrong Door (NWD) Functions
• Medicaid LTSS Balance: Spending
• Nursing Home Antipsychotic Use
• Supporting Working Family Caregivers
• Person- and Family-Centered Care
The Long-Term Care Insurance indicator was the only measure with 20 or more states showing a significant decline in performance.
Even the Highest-Performing States Have Room for ImprovementMinnesota and Washington have been ranked either 1 or 2 in every edition of the Scorecard. In this fourth edition, Minnesota ranked 1, followed by Washington, Wisconsin, Oregon, and Vermont.
The four editions of the Scorecard each used slightly different methodologies and indicator sets, based primarily on data availability. Therefore, ranks are not directly comparable between years, but the results across all four Scorecard editions nevertheless indicate that Minnesota and Washington are consistently on top.
The leading states tend to do well across multiple dimensions; however, all states can improve on one or more of the five dimensions of performance. Only Minnesota scored in the top quartile across all five dimensions. In no case did a state score in the top 10 across all dimensions.
Exhibit 5 highlights that the top-performing states still have an opportunity to improve in specific indicators.
"State performance remained largely flat across most of the indicators."
EXHIBIT 5 Top Five States and Improvements Needed
Rank State Improvement Needed
1 Minnesota #11 in Effective Transitions
2 Washington # 27 in Quality of Life and Quality of Care
3 Wisconsin #17 in Support for Family Caregivers
4 Oregon# 24 in Affordability and Access
# 23 in Quality of Life and Quality of Care
5 Vermont# 23 in Affordability and Access
#16 in Effective Transitions
Source: Long-Term Services and Supports State Scorecard, 2020.

17
ADVANCING ACTION | LONGTERMSCORECARD.ORG
States with the Greatest Number of Improved Indicators As shown in Exhibit 6, one-third of states (17) improved significantly in six or more of the 21 indicators for which trend data are available in this Scorecard. These states ranged from six in the top quartile of performance to two states that ranked in the bottom quartile, demonstrating that states at all levels of LTSS system performance can show significant improvement based on the specific elements of this Scorecard.
Among the 17 states having the greatest number of indicators with significant improvement, seven states showed significant improvement in six or more indicators and a decline in none. The other 10 states declined significantly in one or more indicators.
"The leading states tend to do well across multiple dimensions; however, all states can improve on one or more of the five dimensions of performance."
INDICATORS IMPROVED
INDICATORS DECLINED
Improved since last Scorecard Declined since last Scorecard
MDCT NJ PA RI
WY
CA ME
NY
ND LAOHMNMT NVNM TX VA IL OR
KS HI WI GA MSDE IN MANH OK SC WA AZ DC IA KY SD
MI TN NE AR CO VT WV IDMO UT AL FL
NC AK
EXHIBIT 6 Number of Indicators Improved and Declined by State
Notes: Each block represents one significantly changed indicator.States are arranged in order of greatest to least number of indicators showing improvement. Improvement or decline means a significant change (usually +/- 10% or equivalent) since a reference data year (usually three years prior). For some measures, a revised baseline is used, as the indicator definition or data source may have changed since the last Scorecard.
Source: Long-Term Services and Supports State Scorecard, 2020.

18
ADVANCING ACTION | LONGTERMSCORECARD.ORG
Top- and Bottom-Ranked States Have Remained ConsistentAlthough the indicator set has been different for each Scorecard, and ranks are not directly comparable, the same states have generally ranked near the top and near the bottom over the past decade. As shown in Exhibit 7, six states have consistently ranked in the top 10 and seven states have consistently ranked in the bottom 10 across all four editions of the Scorecard.
States Showed the Most Progress in Five AreasADRC/NWD Functions. In many states and communities, LTSS is fragmented and administered across multiple agencies and providers. The process of navigating a complex LTSS system can put unnecessary strain on those who need services and their families. To help address this, all states have created ADRCs that function as a single point of access or an NWD system to help streamline access to LTSS for older adults and people with disabilities.
ADRCs can serve as the gateway for helping individuals of all ages, abilities, and income levels and their families find and access LTSS, including light housekeeping, transportation, and respite care. An NWD system can provide counseling on options for individuals and families to help them make informed decisions based on individual circumstances.
However, the function and capabilities of ADRCs differ significantly among states, and so do their level of support for consumers and family caregivers. High-performing ADRCs can help individuals determine their LTSS needs, understand the full range of options available to them,
Top10 states in all ScorecardsBottom10 states in all Scorecards
OR
WA
CO
OK
MNWI
KY
AL
FL
INWV
TN
HI
EXHIBIT 7 Top- and Bottom-Ranked States in Overall System Performance Across All Four LTSS State Scorecards
Source: Long-Term Services and Supports State Scorecard, 2020.

19
ADVANCING ACTION | LONGTERMSCORECARD.ORG
and connect individuals to the services that are right for them. Nine of the top 10 states have fully operational NWD systems that conduct nursing facility preadmission screenings. The prescreening function helps expedite HCBS eligibility and avoid nursing home placement for those who wish to receive services in the community.
Of the 21 indicators for which performance could be measured over time, the ADRC/NWD indicator had the greatest number of states showing improvement. Thirty-three states demonstrated meaningful improvement, 13 of which improved by 11 percent or more (Alabama, Arizona, District of Columbia, Georgia, Hawaii, Indiana, Kentucky, Mississippi, New York, Oregon, South Dakota, Tennessee, and Wisconsin). The states with the most improvement focused on expanding training for person-centered counseling, implementing Lifespan respite grants,5 and strengthening their public outreach.
Medicaid LTSS Balance: Spending. Most adults ages 50 and older prefer to remain in their homes and communities for as long as possible.6 Appropriate Medicaid balance between nursing homes and HCBS helps ensure this. Half the states improved their spending to reflect consumer demand for more care support in their homes, and communities and nearly a quarter spend a majority on HCBS.
However, improvement was uneven across states. The spread between high- and low-performing states is widening as a result of both stronger performance among high-performing states and regression in some of the lowest-performing states.
Of the 13 states in the top quartile, eight saw significant improvement and only one saw a significant decline. By comparison, of the 12 states in the bottom quartile, four saw significant improvement but five saw significant decline.
Inappropriate Use of Antipsychotic Medication in Nursing Homes. For the second Scorecard in a row, most of the states experienced a significant decrease in the inappropriate use of antipsychotic medications in nursing homes. While this is a potentially promising trend, more research is needed to understand how improved performance was accomplished. Stakeholders should consider whether the change coincides with a higher rate of diagnosis for schizophrenia among the population ages 65 and older, the impact of staff training and staffing ratios, and how occupancy rates and resident population mix may impact this measure.
Supporting Working Family Caregivers. The Scorecard also found significant progress in the enactment of public policies that support working family caregivers. More states and localities are recognizing the competing pressures on family caregivers and offering flexibility to use accrued sick time for family caregiving responsibilities. States are also enacting paid family leave programs to ensure that family caregivers do not risk losing their paycheck when close family members need help. Since the last Scorecard, the number of states with paid family leave programs tripled from three states to nine states.
Person- and Family-Centered Care. Most states (29) improved significantly on this indicator, which measures performance on three types of policies: (a) state policies on financial protection for spouses of Medicaid beneficiaries who receive HCBS; (b) assessment of family caregivers’ own needs; and (c) enactment of the Caregiver Advise, Record, Enable (CARE) Act. The biggest factor driving improvement was the number of states conducting assessments of family caregivers for
5 Lifespan respite care programs are coordinated systems of accessible, community-based respite care services for family caregivers of children and adults of all ages with special needs. In 2006, Congress passed the Lifespan Respite Care Act, which authorized competitive grants to ADRCs in collaboration with public or private nonprofit state respite coalition organizations to make quality respite available and accessible to family caregivers regardless of age or disability. Lifespan respite care programs reduce duplication of effort and assist in the development of respite care infrastructures at the state and local levels. As of 2017, competitive grants of up to $200,000 each were awarded to eligible agencies in 37 states and the District of Columbia.
6 Joanne Binette and Kerri Vasold, “2018 Home and Community Preferences: A National Survey of Adults Ages 18-Plus,” AARP Research, Washington, DC, July 2019, https://www.aarp.org/research/topics/community/info-2018/2018-home-community-preference.html.

20
ADVANCING ACTION | LONGTERMSCORECARD.ORG
their own health needs and well-being. Twenty-four states saw significant improvement in this area, bringing the total number of states conducting family caregiver assessments to 41.
States also continue to make strong progress in enacting the CARE Act. Nine additional states have enacted the CARE Act since 2016, bringing the total to 41 states.7
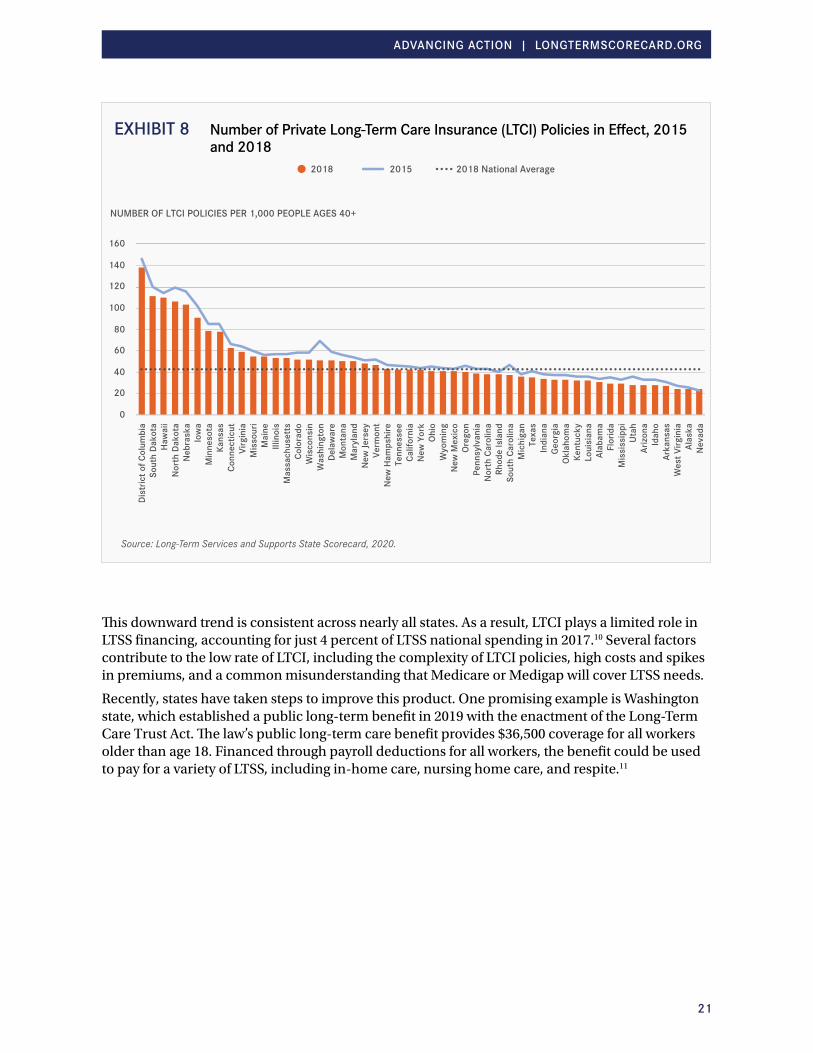
States Showed a Significant Decline in Long-Term Care Insurance PoliciesEveryone faces a risk, but not a certainty, of needing LTSS. A 2015 study using microsimulation modeling estimated that about 52 percent of people turning age 65 would develop needs that require LTSS.8 Long-term care insurance (LTCI) can provide a valuable benefit for those who have it. Most LTCI covers nursing home, assisted living, and in-home care services. Having LTCI also gives people more control over the care they receive and in the setting of their choice, as well as services to maintain independence. In 2018, LTCI carriers paid $10.3 billion in claims benefits, up from $6.6 billion in 2012 (a 56 percent increase).9
Despite the benefits and likelihood that more than half of Americans will need LTSS at some point in their lives, relatively few adults ages 40 and older purchase LTCI, and that number is steadily declining. The Scorecard found a decrease of 430,448 policies (6 percent) between 2015 and 2018.
Exhibit 8 shows a comparison by state of the number of active, private LTCI policies in effect in 2015 versus 2018 for people ages 40 and older. The average coverage rate in 2018 for the top five states (District of Columbia, Hawaii, Nebraska, North Dakota, and South Dakota) is 114 LTCI policies per 1,000, compared with 123 policies in 2015—a 7.3 percent decline. In contrast, the average coverage rate in 2018 for the bottom five performing states (Alaska, Arkansas, Idaho, Nevada, and West Virginia) is 25 policies per 1,000 people, compared with 28 policies in 2015—a 10.7 percent decline. The national average in 2018 is just 43 policies per 1,000 people ages 40 and older, compared with 47 policies in 2015—an 8.5 percent decline.
8 Melissa Favreault and Judith Dey, “Long-Term Services and Supports for Older Americans: Risks and Financing Research Brief,” US Department of Health and Human Services, Office of the Assistant Secretary for Planning and Evaluation, Washington, DC, 2015, https://aspe.hhs.gov/basic-report/long-term-services-and-supports-older-americans-risks-and-financing-research-brief.
9 “Long Term Care Insurance Industry Paid $10.3 Billion in Claims in 2018,” Facts, Statistics and Relevant Information, January 14, 2019, https://www.aaltci.org/news/long-term-care-insurance-associationnews/long-term-care-insurance-industry-paid-10-3-billion-in-claims-in-2018.
Specific provisions of the CARE Act vary by state, but generally require hospitals to do the following:*
ADVISE all patients of their opportunity to identify a family caregiver.
RECORD the family caregiver’s name and contact information in the health record with the patient’s permission.
ENABLE family caregivers by providing as much notice as possible about the discharge timing, consult with them on the discharge plan, discuss with them the family caregiver’s role in carrying out the discharge plan, and instruct them on any medical or nursing tasks family caregivers will handle at home.
*Susan C. Reinhard and Elaine Ryan, “The CARE Act Implementation: Progress and Promise,” AARP Public Policy Institute, Washington, DC, March 2019.
21
ADVANCING ACTION | LONGTERMSCORECARD.ORG
This downward trend is consistent across nearly all states. As a result, LTCI plays a limited role in LTSS financing, accounting for just 4 percent of LTSS national spending in 2017.10 Several factors contribute to the low rate of LTCI, including the complexity of LTCI policies, high costs and spikes in premiums, and a common misunderstanding that Medicare or Medigap will cover LTSS needs.
Recently, states have taken steps to improve this product. One promising example is Washington state, which established a public long-term benefit in 2019 with the enactment of the Long-Term Care Trust Act. The law’s public long-term care benefit provides $36,500 coverage for all workers older than age 18. Financed through payroll deductions for all workers, the benefit could be used to pay for a variety of LTSS, including in-home care, nursing home care, and respite.11
20152018
0
20
40
60
80
100
120
140
160
Dist
rict o
f Col
umbi
aSo
uth
Dako
taHa
wai
iN
orth
Dak
ota
Neb
rask
aIo
wa
Min
neso
taKa
nsas
Conn
ectic
utVi
rgin
iaM
isso
uri
Mai
neIll
inoi
sM
assa
chus
etts
Colo
rado
Wis
cons
inW
ashi
ngto
nDe
law
are
Mon
tana
Mar
ylan
dN
ew Je
rsey
Verm
ont
New
Ham
pshi
reTe
nnes
see
Calif
orni
aN
ew Y
ork
Ohio
Wyo
min
gN
ew M
exic
oOr
egon
Penn
sylv
ania
Nor
th C
arol
ina
Rhod
e Is
land
Sout
h Ca
rolin
aM
ichi
gan
Texa
sIn
dian
aGe
orgi
aOk
laho
ma
Kent
ucky
Loui
sian
aAl
abam
aFl
orid
aM
issi
ssip
piUt
ahAr
izona
Idah
oAr
kans
asW
est V
irgin
iaAl
aska
Nev
ada
NUMBER OF LTCI POLICIES PER 1,000 PEOPLE AGES 40+
2018 National Average
EXHIBIT 8 Number of Private Long-Term Care Insurance (LTCI) Policies in Effect, 2015 and 2018
Source: Long-Term Services and Supports State Scorecard, 2020.

22
ADVANCING ACTION | LONGTERMSCORECARD.ORG
Affordable and Accessible Housing Remains a Significant Unmet NeedHousing is a major factor in overall health and well-being. Individuals who are overburdened with housing costs have less disposable income to pay for their health care needs or other services, like transportation, which could help them stay connected to the community or maintain employment. The lack of safe, suitable, affordable housing can prevent individuals from being able to remain in their communities as their needs for LTSS grow.
As shown in Exhibit 9, although there has been a small increase in subsidized housing units nationwide, need continues to outpace supply. There are 18.9 million very low-income renter households across the country and only 8.6 million potentially available subsidized housing units. Very low-income is defined as family income that is less than or equal to 50 percent of the median family income in a metropolitan area. Moreover, the supply of affordable housing is not the only factor impacting individuals with substantial LTSS needs. Housing must also be accessible and coupled with supportive community services to meet the needs of people with physical disabilities.
2015 Potentially Subsidized Units
0%
5%
10%
15%
20%
25%
Dist
rict o
f Col
umbi
aN
ew Y
ork
Rhod
e Is
land
Mas
sach
uset
tsCo
nnec
ticut
Mis
siss
ippi
Loui
sian
aM
aryl
and
Sout
h Da
kota
Verm
ont
Min
neso
taOh
ioIll
inoi
sKe
ntuc
kyN
ew Je
rsey
Alab
ama
Arka
nsas
Haw
aii
Geor
gia
Mis
sour
iCa
lifor
nia
Indi
ana
Mai
neN
orth
Dak
ota
Was
hing
ton
Tenn
esse
eW
est V
irgin
iaN
ebra
ska
Kans
asOr
egon
Iow
aN
ew H
amps
hire
Virg
inia
Mic
higa
nDe
law
are
Texa
sW
isco
nsin
New
Mex
ico
Penn
sylv
ania
Okla
hom
aCo
lora
doN
orth
Car
olin
aFl
orid
aN
evad
aM
onta
naSo
uth
Caro
lina
Wyo
min
gUt
ahAl
aska
Idah
oAr
izona
PERCENTAGE OF ALL HOUSING UNITS
2017 Potentially Subsidized Units2012—16 Very Low-Income Renter Households
EXHIBIT 9 Demand Outpaces Supply for Subsidized Housing Opportunities in All States
Notes: Potentially subsidized units are place based units plus authorized housing choice vouchers. HUD defines very low-income as less than or equal to 50% HUD Area Median Family Income (HAMFI). Exhibit data arranged in descending order of 2017 potentially subsidized units percentage. Nationally, there were about 18.9 million renter households qualifying as very low-income and only 8.6 million subsidized housing opportunities, or less than 1 for every 2 low-moderate income renter households.
Source: Long-Term Services and Supports State Scorecard, 2020.

23
ADVANCING ACTION | LONGTERMSCORECARD.ORG
Two New Indicators Adult Day Services Supply (Choice of Setting and Provider Dimension). This indicator is one of several indicators that measure the capacity of various types of HCBS. In order for people with LTSS needs to have a choice of setting or provider, options must be available. This indicator measures the total licensed capacity of adult day service providers compared with the population ages 65 and older (about two-thirds of adult day services users are 65 and older12). The National Center for Health Statistics defines an adult day service center as “a community-based center, generally open on weekdays, that provides long-term care services, including structured activities, health monitoring, socialization, and assistance with ADLs (activities of daily living) to adults with disabilities.”13
HCBS Quality Benchmarking (Quality of Life and Quality of Care Dimension). High-performing LTSS systems should include the ability to benchmark results against other states; however, comparable cross-state measurement of HCBS quality is a long-standing gap in the Scorecard. This edition of the Scorecard begins to address this gap by introducing an HCBS Quality Cross-State Benchmarking Capability composite to assess states on their utilization of nationally available tools that enable state-to-state comparisons. Evidence suggests that robust and accurate quality reporting is a precursor to improving quality outcomes.14 Unlike state-specific quality monitoring tools, the standardized tools enable direct comparison across states. Quality monitoring programs that include the ability to benchmark and make cross-state comparisons offer the best opportunity to identify promising practices, detect deficiencies, and effectively monitor HCBS quality across the country.
Four quality monitoring tools were identified for inclusion in the composite measure:
1. National Core Indicators—Aging and Disabilities (NCI-AD)
2. Consumer Assessment of Healthcare Providers and Systems—Home and Community-Based Services Survey (HCBS-CAHPS)
3. National Committee for Quality Assurance (NCQA) Statewide Accreditation
4. Behavioral Risk Factor Surveillance System—Emotional Support and Quality of Life Support Module (BRFSS-ES-QOL)

24
ADVANCING ACTION | LONGTERMSCORECARD.ORG
Key Findings by Dimension
DIMENSION 1 Affordability and AccessThis dimension includes six indicators. These indicators for measuring affordability and access and the key findings are listed below. Exhibit 10 illustrates states’ rankings by quartile in this dimension.
INDICATOR 1: Nursing Home Cost • KEY FINDING. The cost of nursing home care is unaffordable for middle-income Americans in
every state. The average annual per person cost of nursing home care is more than $100,000 a year in a private room, about 2.5 times the typical income for an older family. Even in the five most affordable states (Kansas, Missouri, Oklahoma, Texas, and Utah), nursing home costs would consume 176 percent of the income of the typical older family. When the cost of care exceeds median income by that much, many people with LTSS needs will ultimately exhaust their life savings and eventually turn to the Medicaid public safety net for assistance.
INDICATOR 2: Home Care Cost • KEY FINDING. Home care services continue to be much more cost-effective than nursing
home care for individuals and families. On average, the annual per person cost of home care is roughly $35,000 a year (for 30 hours of weekly care at $23 per hour), compared with
State Ranking on Affordabilityand Access Dimension
Top QuartileSecond QuartileThird QuartileBottom Quartile
DE
MD
DC
HI
AK
AZ
UTNV
CA
NM
OR
WA
WY
ID
MT ND
SD
NE
COKS
OK
TX
MN
IA
MO
AR
LA
WI
MI
IL IN
KY
TN
MS AL GA
FL
SC
NC
VA
OH
WV
RI
NJPA
NY
ME
NH
VT
MACT
EXHIBIT 10 State Ranking on Affordability and Access Dimension
Source: Long-Term Services and Supports State Scorecard, 2020.
25
ADVANCING ACTION | LONGTERMSCORECARD.ORG
an average cost of $102,000 for nursing home care. Despite being relatively more affordable, home care still exceeds what many older households can afford to pay. Nationally, home care costs would consume more than three-quarters (80 percent) of the entire income of the typical, older middle-income family.
INDICATOR 3: Long-Term Care Insurance • KEY FINDING. Despite the high cost and growing demand for LTSS, relatively few adults ages
40 and older purchase LTCI, and that number is declining. There was a decrease of 430,448 policies (6 percent) between 2015 and 2018. This downward trend is consistent across nearly all states.
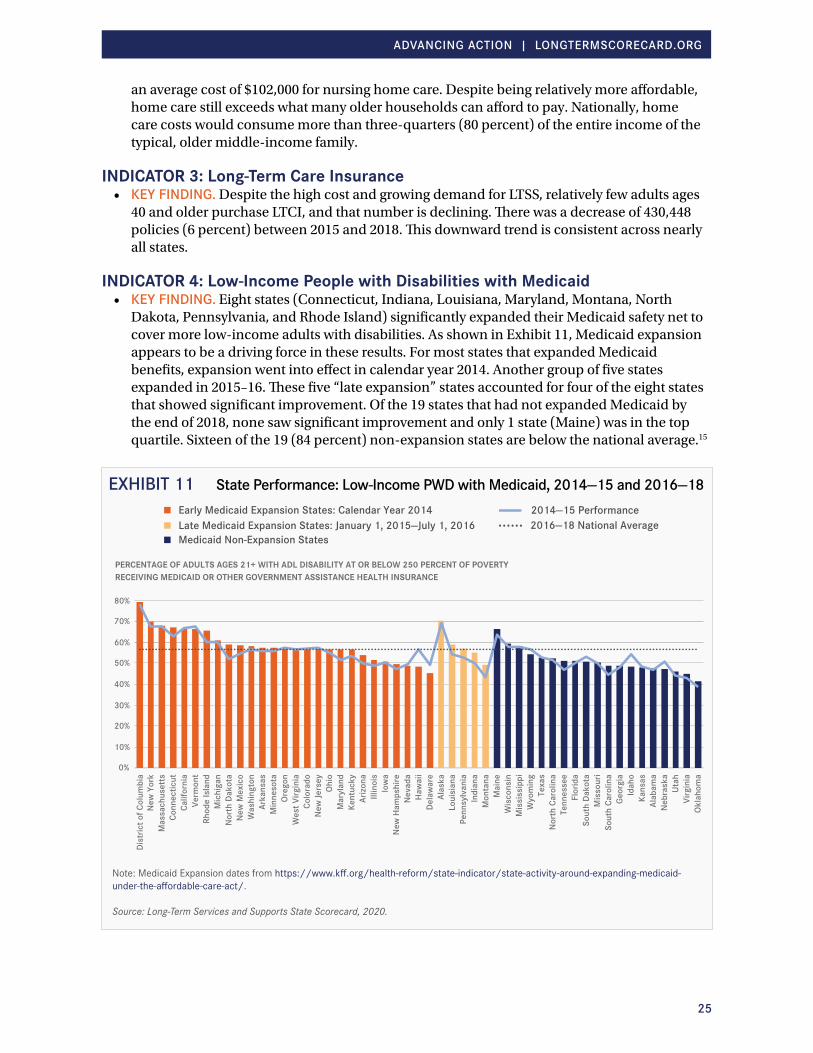
INDICATOR 4: Low-Income People with Disabilities with Medicaid • KEY FINDING. Eight states (Connecticut, Indiana, Louisiana, Maryland, Montana, North
Dakota, Pennsylvania, and Rhode Island) significantly expanded their Medicaid safety net to cover more low-income adults with disabilities. As shown in Exhibit 11, Medicaid expansion appears to be a driving force in these results. For most states that expanded Medicaid benefits, expansion went into effect in calendar year 2014. Another group of five states expanded in 2015–16. These five “late expansion” states accounted for four of the eight states that showed significant improvement. Of the 19 states that had not expanded Medicaid by the end of 2018, none saw significant improvement and only 1 state (Maine) was in the top quartile. Sixteen of the 19 (84 percent) non-expansion states are below the national average.15
Dist
rict o
f Col
umbi
a
0%
10%
20%
30%
40%
50%
60%
70%
80%
New
Yor
kM
assa
chus
etts
Conn
ectic
utCa
lifor
nia
Verm
ont
Rhod
e Is
land
Mic
higa
nN
orth
Dak
ota
New
Mex
ico
Was
hing
ton
Arka
nsas
Min
neso
taOr
egon
Wes
t Virg
inia
Colo
rado
New
Jers
eyOh
ioM
aryl
and
Kent
ucky
Arizo
naIll
inoi
sIo
wa
New
Ham
pshi
reN
evad
aHa
wai
iDe
law
are
Alas
kaLo
uisi
ana
Penn
sylv
ania
Indi
ana
Mon
tana
Mai
neW
isco
nsin
Mis
siss
ippi
Wyo
min
gTe
xas
Nor
th C
arol
ina
Tenn
esse
eFl
orid
aSo
uth
Dako
taM
isso
uri
Sout
h Ca
rolin
aGe
orgi
aId
aho
Kans
asAl
abam
aN
ebra
ska
Utah
Virg
inia
Okla
hom
a
PERCENTAGE OF ADULTS AGES 21+ WITH ADL DISABILITY AT OR BELOW 250 PERCENT OF POVERTY RECEIVING MEDICAID OR OTHER GOVERNMENT ASSISTANCE HEALTH INSURANCE
2014—15 Performance2016—18 National Average
Early Medicaid Expansion States: Calendar Year 2014Late Medicaid Expansion States: January 1, 2015—July 1, 2016 Medicaid Non-Expansion States
EXHIBIT 11 State Performance: Low-Income PWD with Medicaid, 2014—15 and 2016—18
Note: Medicaid Expansion dates from https://www.kff.org/health-reform/state-indicator/state-activity-around-expanding-medicaid-under-the-affordable-care-act/.
Source: Long-Term Services and Supports State Scorecard, 2020.
26
ADVANCING ACTION | LONGTERMSCORECARD.ORG
INDICATOR 5: People with Disabilities with Medicaid LTSS • KEY FINDING. Across the country, there is overall improvement in the percentage of Medicaid
consumers with self-care needs (defined as having difficulty bathing, dressing, or getting around inside the home) who receive Medicaid LTSS. Seven states significantly improved. However, the gap between the highest-performing states and lowest-performing states widened. There was roughly a fourfold difference between the average performance of the top five states and the bottom five states. The top five states had an average of 86 Medicaid LTSS participants for every 100 people with self-care disabilities. The average in the bottom five was just 22 participants.
INDICATOR 6: ADRC/NWD Functions • KEY FINDING. Two-thirds of states improved their ADRC or NWD access points to help
consumers and family caregivers navigate LTSS options. Overall, the greatest improvement occurred with addressing target populations, streamlined eligibility for public programs, and person-centered counseling. High-performing states are also building strong collaborative partnerships between state aging and disability and state Medicaid agencies.
Advancing Action in Affordability and AccessIn light of these findings, stakeholders can advance action through the following:
• Explore LTSS financing options. The cost of LTSS exceeds the income for most middle-income Americans. Private LTCI is an option to help pay for LTSS; however, market forces determine the reach of these policies, and currently the private market leaves too many without coverage. The cost of LTSS must be more affordable and equitably shared among individuals, the government, and the private sector. States may benefit from conducting a study on a range of financing options and considering such options that make sense for their residents.
• Enhance ADRC/NWD programs to ensure that consumers of all incomes can understand and navigate private and public services without delay. States can strengthen their ADRC functions by improving person-centered counseling training, public outreach, and better coordination across the LTSS systems. For examples of promising practices that states have implemented, please refer to No Wrong Door: Person- and Family-Centered Practices in Long-Term Services and Supports, http://longtermscorecard.org/promising-practices/no-wrong-door.
• Establish a robust safety net so that Medicaid and state-funded programs cover services for older people and adults with disabilities when they exhaust their personal resources.
27
ADVANCING ACTION | LONGTERMSCORECARD.ORG
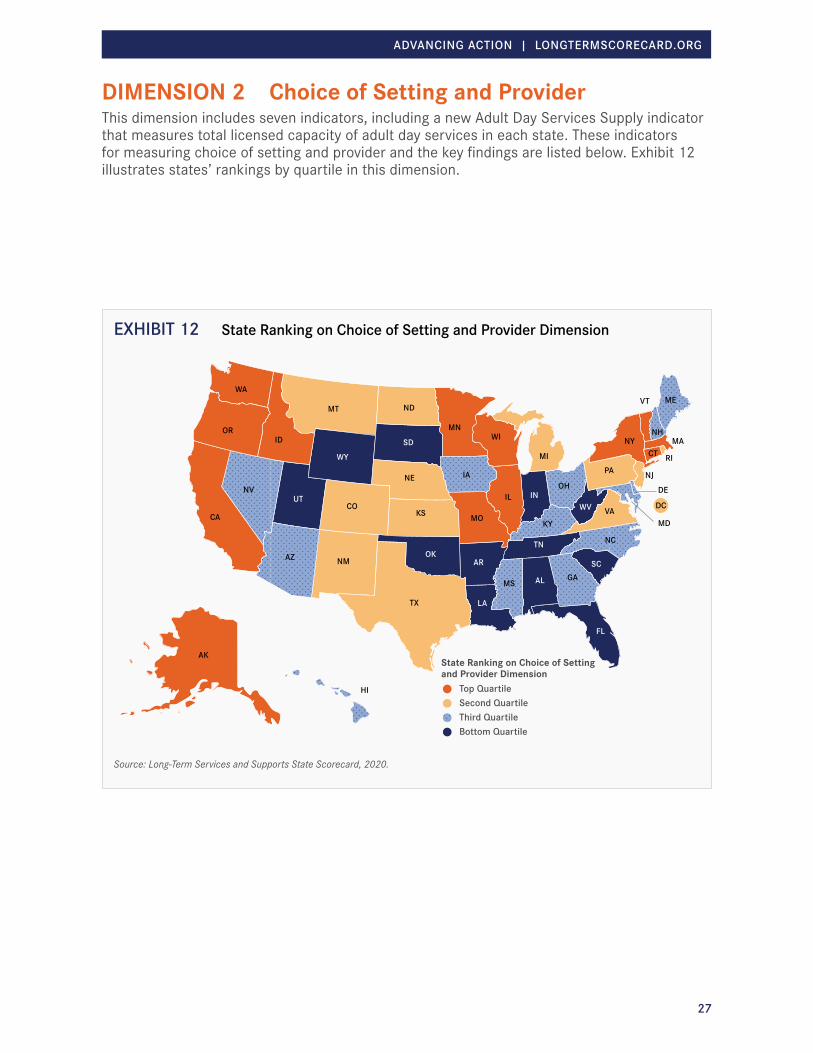
DIMENSION 2 Choice of Setting and ProviderThis dimension includes seven indicators, including a new Adult Day Services Supply indicator that measures total licensed capacity of adult day services in each state. These indicators for measuring choice of setting and provider and the key findings are listed below. Exhibit 12 illustrates states’ rankings by quartile in this dimension.
State Ranking on Choice of Setting and Provider Dimension
Top QuartileSecond QuartileThird QuartileBottom Quartile
DE
MD
DC
HI
AK
AZ
UTNV
CA
NM
OR
WA
WY
ID
MT ND
SD
NE
COKS
OK
TX
MN
IA
MO
AR
LA
WI
MI
IL IN
KY
TN
MS AL GA
FL
SC
NC
VA
OH
WV
RI
NJPA
NY
ME
NH
VT
MACT
EXHIBIT 12 State Ranking on Choice of Setting and Provider Dimension
Source: Long-Term Services and Supports State Scorecard, 2020.
28
ADVANCING ACTION | LONGTERMSCORECARD.ORG
INDICATOR 1: Percentage of Medicaid- and State-Funded LTSS Spending Going to HCBS for Older People and Adults with Physical Disabilities (Medicaid LTSS Balance: Spending)
• KEY FINDING. Given the strong preference of consumers to receive care in their own homes and communities as long as possible, it is encouraging that half of states improved the balance of Medicaid and state LTSS spending for older adults and people with physical disabilities toward more HCBS. Thirteen of those states had a significant shift of over 20 percent. Now, almost a quarter (12) of states spend the majority of Medicaid and state LTSS funding for older people and adults with physical disabilities on HCBS (up from seven states in 2009). The range of performance among states, however, varies dramatically—from a high of 73.5 percent in New Mexico to a low of 13.5 percent in Kentucky.
INDICATOR 2: Estimated Percentage of Medicaid Aged/Disabled LTSS Users Receiving HCBS (Medicaid LTSS Balance: Users)
• KEY FINDING. Since most people prefer to receive HCBS rather than nursing home care, this measure is also a reflection of whether a state offers the care people want in the setting they prefer. Twelve states made significant improvement in the percentage of Medicaid beneficiaries who receive services in home- and community-based settings compared with nursing homes. The percentage between high- and low-performing states varied dramatically on this indicator. Among the top five states, 81 percent of Medicaid beneficiaries receive services in their homes and communities. However, only 34 percent of Medicaid beneficiaries in the bottom five states are receiving services in their home or community. Unlike the indicator on Medicaid LTSS balanced spending, this measure compares the percentage of people, not money, going toward HCBS.
INDICATOR 3: Self-Direction• KEY FINDING. In 2019, there were more than 1.2 million participants in public programs
who were self-directing their own LTSS. California, the leading state in this area in the previous Scorecard, is the top-ranking state again, accounting for nearly half (49 percent) of the national total, but other states are catching up. The number of people enrolled in “self-directed” LTSS programs has grown by almost 500,000 (67 percent increase) since the first edition of the Scorecard. Minnesota and New York are two states to recently improve on this measure. In Minnesota, the proportion of people self-directing their LTSS services has doubled since 2016. In New York, the rate of self-direction has more than tripled since 2016, catapulting New York from a mid-tier state to the top 10.
INDICATOR 4: Home Health Aide Supply • KEY FINDING. The supply of direct care workers remains uneven among states. Home health
aides can provide a range of services, from administering medication to helping with bathing and dressing, that support independent living and can provide family caregivers a break. The
"Almost one-quarter of states (12) spend the majority of Medicaid funding on HCBS (up from 7 states in 2009). "

29
ADVANCING ACTION | LONGTERMSCORECARD.ORG
majority of states (43) had no significant change in home health aide or personal care worker supply. In five states, the supply of direct care workers increased by 20 percent or more, while three states reported a significant decline.
INDICATOR 5: Assisted Living Supply • KEY FINDING. The supply of assisted living and residential care units varies drastically, from
a high of 102 units per 1,000 people ages 75 and older (North Dakota) to a low of 20 units (Louisiana). The bottom five states averaged just 24 units per 1,000 people ages 75 and older, while the top five states averaged 93 units, a fourfold difference. While some Medicaid or state-funded programs cover assisted living and residential care, most residents pay out of pocket. Costs differ between location and individual communities, but the median cost is nearly $50,000 a year.
INDICATOR 6: Adult Day Services Supply (NEW)• KEY FINDING. Access to adult day services ranges widely and may be an issue depending
on where an individual lives. The total licensed capacity of adult day service providers (compared to the population ages 65 and older) ranges from a high of 171 in California to just six in Oregon and Utah.
INDICATOR 7: Subsidized Housing Opportunities• KEY FINDING. Nationally, there are 18.9 million very low-income renter households and only
8.6 million potentially available subsidized housing opportunities (including vouchers and place-based housing units). Only nine states have significantly increased the percentage of subsidized housing opportunities since 2015. Nationally, the small increase of 650,000 subsidized housing units since 2015 continues to fall short of current and future needs.
Advancing Action in Choice of Setting and ProviderIn light of these findings, stakeholders can advance action through the following:
• Address housing needs through interventions that make housing affordable for low-income people and those with high LTSS and health care needs. States and localities can invest in affordable housing units, fund housing vouchers, and use zoning laws to leverage private-sector investment. States should explore alternative sources for funding housing with supports to benefit LTSS users, and health insurance companies should explore options to help meet those housing needs.
• Support nursing home diversion initiatives so more new Medicaid LTSS beneficiaries first receive care in the community. Transitioning someone back into the community after a nursing home stay can be difficult and stressful.
• Dedicate a greater proportion of Medicaid and state funding to cost-effective home- and community-based services that consumers overwhelmingly prefer.
• Provide consumers and their families with more opportunities to self-direct and manage their own care needs. States have the flexibility to design programs that give people the option to manage their own care budget, hire their own care providers (including family members) if they choose, and decide when and how they receive services.
• Offer an array of home- and community-based options to suit personal preferences and family needs. Policy makers should consider “unbundling” LTSS services so that consumers have additional choice in how they receive care. Consider incentives and initiatives for nursing home redesign (e.g., private rooms or green house models that offer consumers a home-like setting).

30
ADVANCING ACTION | LONGTERMSCORECARD.ORG
DIMENSION 3 Quality of Life and Quality of CareThis dimension includes four indicators. A new HCBS Quality Benchmarking indicator scores states on their level of adoption of standardized tools that can be used to provide cross-state comparison to monitor HCBS quality. The indicators for measuring quality of life and quality of care and the key findings are listed below. Exhibit 13 illustrates states’ rankings by quartile in this dimension.
Due to persistent data gaps including in HCBS quality outcomes, quality of life other than employment, and staffing, this dimension is considered to be an incomplete measurement of the quality of life and quality of care construct. It therefore receives only one-half of the weight of the other four dimensions in determining states’ overall ranks on LTSS system performance. Going forward there is a need for robust, standardized, and comparable data on quality of life, quality of care, and safety across all institutional and community settings.
State Ranking on Quality of Life and Quality of Care Dimension
Top QuartileSecond QuartileThird QuartileBottom Quartile
DE
MD
DC
HI
AK
AZ
UTNV
CA
NM
OR
WA
WY
ID
MT ND
SD
NE
COKS
OK
TX
MN
IA
MO
AR
LA
WI
MI
IL IN
KY
TN
MS AL GA
FL
SC
NC
VA
OH
WV
RI
NJPA
NY
ME
NH
VT
MACT
EXHIBIT 13 State Ranking on Quality of Life and Quality of Care Dimension
Source: Long-Term Services and Supports State Scorecard, 2020.
31
ADVANCING ACTION | LONGTERMSCORECARD.ORG
INDICATOR 1: People with Disabilities’ Rate of Employment• KEY FINDING. For adults with disabilities, the ability to work is an important factor in
quality of life. Not only does employment provide income, but working often gives adults a sense of purpose, self-worth, and the ability to connect with others. Nationally, the rate of employment for working-age adults with disabilities who need assistance with personal care was just 21 percent of the rate of working-age adults without disabilities. Two states (Minnesota and Nevada) have consistently maintained relative employment rates (ratio of employment rate of working-age adults with ADL disability to those without) of 30 percent or more in recent years. Since the last reporting period, five states (Idaho, Mississippi, North Dakota, Vermont, and Virginia) increased their relative employment rates among working-age adults with disabilities by 20 percent or more, and two states (Alaska and Wyoming) declined by 20 percent or more.
INDICATOR 2: Nursing Home Residents with Pressure Sores • KEY FINDING. For the first time, the Scorecard measure of nursing home pressure sores
includes three levels of “unstageable” pressure sores, in addition to stage 2–4 pressure sores. Unstageable pressure sores may be open or closed wounds that are completely covered with eschar (hard, black, dead tissue) or a non-removable dressing or device, making them difficult to diagnose. The revised measure provides a more complete picture of the incidence of pressure sores, which were previously undercounted in the publicly reported measure on Nursing Home Compare. North Dakota has the lowest percentage (4.8 percent) of high-risk nursing home residents with pressure sores. At the other end of the spectrum, the percentage in the District of Columbia was nearly triple (13 percent). The average across all states was 7.3 percent.
INDICATOR 3: Inappropriate Use of Antipsychotic Medications for Nursing Home Residents (Nursing Home Antipsychotic Use)
• KEY FINDING. As many as one in seven long-stay nursing home residents without a psychiatric diagnosis are sedated with antipsychotic medications. Fortunately, states continue to make progress on this measure; a majority of states (28) have significantly reduced inappropriate use of antipsychotic medications since 2015. The 5 states (Arizona, Louisiana, New York, Ohio, and Texas) with the sharpest decline reported decreases ranging from 31 percent to 44 percent. Nationally, inappropriate use of antipsychotic medications has steadily declined by over 30 percent since 2013—from 21.3 percent to 14.6 percent.
"Nationally, inappropriate use of antipsychotic medications has steadily declined by over 30 percent since 2013—from 21.3 percent to 14.6 percent."

32
ADVANCING ACTION | LONGTERMSCORECARD.ORG
INDICATOR 4: HCBS Quality Benchmarking (NEW)• KEY FINDING. All states measure quality in their HCBS programs, yet each state uses a
unique HCBS quality monitoring system. Despite these variations, a state’s HCBS quality monitoring system should include the ability to benchmark results against other states. This new composite indicator scores states on their utilization of four standardized quality monitoring tools (NCI-AD, HCBS-CAHPS, NCQA, and BRFSS-ES-QOL) that can be used to benchmark HCBS quality and make cross-state comparisons. Three-quarters of states use at least one tool for cross-state benchmarking. Eleven states use multiple monitoring tools. The most commonly used of the four tools was NCI-AD,16 used by 26 states (as of December 2019). Eleven states that used more than one tool used NCI-AD as one of their four monitoring tools.
Advancing Action in Quality of Life and Quality of Care In light of these findings, stakeholders can advance action through the following:
• Seek consistent, state-level data on LTSS quality, the availability of affordable and accessible housing, family caregiver respite funding, and other measures of key concern to the public.
• Utilize HCBS quality outcome measures with cross-state benchmarking capabilities. With more consumers choosing to receive care in the community, policy makers should consider strategies to effectively measure HCBS quality across states.
• Consider employment initiatives to train, recruit, and help connect working-age adults with disabilities to job opportunities. These job opportunities should also provide a living wage and benefits that allow individuals to be self-sufficient.
• Enforce quality standards in nursing homes, with particular attention to the following: - Preventing pressure sores, which are painful injuries to the skin that can make basic
movements such as turning or lifting extremely painful. - Ending inappropriate prescribing of antipsychotic medication, which should never be used
to sedate nursing home residents with dementia. Nursing home staff should consider non-pharmacological approaches to dementia care, such as cultural arts, dance, and expressive movements to promote social and behavioral changes.
- Increasing focus on preventing the spread of infections and other quality concerns that can have serious harmful effects on the quality of life and quality of care of vulnerable nursing home residents.
- Strengthen ombudsman programs. Although all states operate ombudsman programs, states decide how frequently ombudsmen visit each facility, how they respond to complaints, and what methods are used to monitor quality. States should evaluate their state ombudsman programs and determine if design changes are needed to adequately protect consumers. States may also consider expanding the reach of these programs to cover HCBS.

33
ADVANCING ACTION | LONGTERMSCORECARD.ORG
DIMENSION 4 Support for Family CaregiversThis dimension includes policies that support family caregivers in four main indicators: Supporting Working Family Caregivers, Person- and Family-Centered Care, Nurse Delegation and Scope of Practice, and Transportation Policies. Key findings in each of the four areas are listed below. Exhibit 14 illustrates states’ rankings by quartile in this dimension.
INDICATOR 1: Supporting Working Family Caregivers This indicator measures performance on six types of policies: (a) protection of family caregivers from employment discrimination, (b) family medical leave, (c) paid family leave, (d) mandatory paid sick days, (e) flexible use of sick time, and (f) unemployment insurance for family caregivers. States and localities have made significant progress passing legislation for paid family leave, paid sick days, and greater flexibility to use sick time for family caregiving responsibilities.
• KEY FINDING. Protecting Caregivers from Employment Discrimination – Only two states (Delaware and the District of Columbia) have statewide laws that specifically protect family caregivers from workplace discrimination as a protected classification under law. Connecticut has a statewide law, but the provisions do not specifically define family responsibility or family status, and therefore it is not clear whether the protections extend to all family relationships. Localities across 21 states now have provisions addressing family responsibility; About half specifically define family responsibility as a protected classification: for the others, family responsibility and family status are undefined. In addition to providing help for family
State Ranking on Support for Family Caregivers Dimension
Top QuartileSecond QuartileThird QuartileBottom Quartile
DE
MD
DC
HI
AK
AZ
UTNV
CA
NM
OR
WA
WY
ID
MT ND
SD
NE
COKS
OK
TX
MN
IA
MO
AR
LA
WI
MI
IL IN
KY
TN
MS AL GA
FL
SC
NC
VA
OH
WV
RI
NJPA
NY
ME
NH
VT
MACT
EXHIBIT 14 State Ranking on Support for Family Caregivers Dimension
Source: Long-Term Services and Supports State Scorecard, 2020.

34
ADVANCING ACTION | LONGTERMSCORECARD.ORG
caregivers who live in these localities, local protections offer the opportunity to test and build momentum for statewide changes. See Exhibit B5 in Appendices for a list of states and localities that have laws protecting caregivers from employment discrimination.
• KEY FINDING. Federal FMLA – Ten states go beyond the federal minimum Family and Medical Leave Act (FMLA) by covering family members outside the scope of federal protections (e.g., grandparents and siblings), extending the length of leave, or covering smaller employers. The District of Columbia continues to have the most robust protections for family and medical leave. Two states that have paid family leave benefits (California and Washington) no longer have unpaid leave protections that exceed the federal FMLA requirements. However, New Jersey, which passed paid family medical leave legislation in 2008, has also recently expanded its state FMLA provisions to include smaller employers and cover extended family members.
• KEY FINDING. Paid Family Leave – Since 2016, the number of states with paid family leave legislation has tripled. Six additional states (Connecticut, District of Columbia, Massachusetts, New York, Oregon, and Washington) enacted paid family leave legislation, bringing the total number to nine. Of the six new states, paid family leave benefits are currently available in the District of Columbia, Massachusetts, New York, and Washington. Benefits in Connecticut and Oregon will become available after 2021. Among states with existing programs, New Jersey expanded its paid leave benefits to include smaller employers and permit employees longer lengths of leave.
• KEY FINDING. Paid Sick Days – More than one-third of states (20) have statewide or local laws mandating paid sick days to employees. Of those 20 states with either statewide or local paid sick leave laws, 13 enacted or expanded (e.g., covering additional employees or permitting longer lengths of leave) their policies in the past three years. See Exhibit B5 in Appendices for a list of states and localities that mandate paid sick days to employees.
• KEY FINDING. Flexible Use of Sick Time – More states and localities are allowing employees to use a portion of accrued sick time for purposes beyond their own illness. Workplace benefits that allow employees to use sick time for family caregiving responsibilities help employees manage work and family responsibilities. Nineteen states have statewide legislation and one state (New York) has locality legislation in New York City and Westchester County that now allows flexible use of sick time. See Exhibit B5 in Appendices for a list of states and localities that have provisions for flexible use of sick time.
• KEY FINDING. Unemployment Insurance for Family Caregivers – Family caregivers in half of states (25) can receive temporary financial assistance when returning to the workforce through state unemployment insurance programs if there is “good cause” for job loss due to an illness or disability of an immediate family member.
For more information on policies and practices in state unemployment insurance programs that provide potential temporary financial assistance to family caregivers, see the 2015 Scorecard research report, Access to Unemployment Insurance Benefits for Family Caregivers: An Analysis of State Rules and Practices. Source: Liz Ben-Ishai, Rick McHugh, and Kathleen Ujvari, “Access to Unemployment Insurance Benefits for Family Caregivers: An Analysis of State Rules and Practices,” AARP Public Policy Institute, Washington, DC, April 2015, http://www.longtermscorecard.org/publications/access-to-unemployment-insurance-benefits-for-family-caregivers.

35
ADVANCING ACTION | LONGTERMSCORECARD.ORG
INDICATOR 2: Person- and Family-Centered Care This indicator measures performance on three types of policies: (a) state policies on financial protection for spouses of Medicaid beneficiaries who receive HCBS, (b) assessment of family caregivers’ own needs, and (c) enactment of the CARE Act.
• KEY FINDING. Spousal Impoverishment Protections – There continues to be only a handful of states (7) that permit a spouse to keep the maximum amount of income and assets allowed under federal guidelines. This policy helps prevent married couples from falling into poverty or forcing a healthy spouse into Medicaid prematurely. By retaining more of the couples’ own resources, the spouse who is not on Medicaid has a better chance to remain independent, pay for basic necessities without additional state assistance, and manage his or her own health care needs.
• KEY FINDING. Family Caregiver Assessments – In a high-performing LTSS system, caregivers’ needs—including health, well-being, and work—are assessed and addressed with appropriate information, training, respite, and other services tailored to their individual preferences. The majority of states (41) conduct assessments of family caregivers for their own needs; however, most of these family caregiver assessments happen in smaller family caregiver support programs rather than in the broader Medicaid programs.
• KEY FINDING. CARE Act Legislation – States continue to make rapid progress on enactment of the CARE Act—model legislation that supports family caregivers when family members enter a hospital and transition back home. As of December 31, 2019, nine additional states have enacted the CARE Act, bringing the total to 41 states.
INDICATOR 3: Nurse Delegation and Scope of Practice This indicator measures performance on two types of policies: (a) number of health maintenance tasks that can be delegated to direct care workers, and (b) nurse practitioner scope of practice.
• KEY FINDING. Nurse Delegation – Family caregivers benefit from decision makers expanding the types of health maintenance tasks (e.g., giving medications, tube feedings, providing routine respiratory care) that registered nurses can delegate to home care aides. Nurse delegation helps family caregivers who may have to leave work during the day or hire a nurse to perform these routine tasks. Eighteen states (up from 16) allow registered nurses to delegate a full range of a sample set of 16 tasks to home care aides. In 2011, when the Scorecard first measured nurse delegation, only 12 states allowed delegation of 14 or more sample tasks. That number has more than doubled, and half of states (26) allow delegation of at least 14 sample tasks. Still, the bottom-performing states lag significantly on this measure. Four states (Florida,17 Indiana, Pennsylvania, and Rhode Island) do not permit delegation of any of the sample set of health maintenance tasks. Roughly a quarter of states (12) permit nurses to delegate only three or fewer tasks.
• KEY FINDING. Scope of Practice – Giving nurse practitioners authority to practice to the full extent of their education and training can ease the shortage of primary care providers. This can also help family caregivers by expanding options for care recipients to receive primary care services in the setting of their choice (e.g., medical offices, community health centers, adult day centers, at home). Twenty-three states allow patients to benefit from the full range of care nurse practitioners are educated and trained to provide.
17 On March 11, 2020, Florida enacted H.B. 607 (Direct Care Workers), which expands consumer access to nurse practitioners and certified nurse midwives and authorizes registered nurses to delegate certain clinical tasks to direct care workers (certified nursing assistants and home health aides). The law becomes effective July 1, 2020. These results are not reflected in the 2020 Scorecard because enactment occurred after December 31, 2019, the cut-off date for this measure. However, these results will be reported in future reporting.

36
ADVANCING ACTION | LONGTERMSCORECARD.ORG
INDICATOR 4: Transportation Policies • KEY FINDING. Transportation Policies – Many older people and adults with disabilities
depend on volunteer drivers who provide transportation to medical appointments or to get around town. In most states, however, these volunteer drivers face liability exposure, spikes in car insurance premiums, or other regulatory barriers.18 Although states can use policy options to protect volunteer drivers, relatively few states have done this. Only seven states (up from five in the last Scorecard) protect drivers from insurance cancelation or rate increases for volunteer driving activities. These policies make it easier to recruit volunteer drivers to help older adults and people with disabilities get around.
Advancing Action in Support for Family Caregivers In light of these findings, stakeholders can advance action through the following:
• Streamline and conduct universal family caregiver assessments to determine which supports family caregivers need for their own health and well-being. Family caregivers often experience physical and emotional strain; therefore, it is appropriate to consider their own needs as part of the care planning process.
• Strengthen flexible workplace policies and employment supports that help family caregivers balance competing demands from their job and family responsibilities. For example:- Federal, state, and local governments can increase baseline protections available under the
Family and Medical Leave Act (FLMA) by covering more employees, expanding the definition of family, and protecting family caregivers against job discrimination.
- States may want to establish paid family and medical leave or earned sick days, so family caregivers do not have to miss a paycheck when they provide care. Additionally, states may consider offering family caregivers access to short periods of leave to attend to caregiving duties, such as bringing a family member or close friend to a doctor’s appointment.
- Employers may wish to offer flexible workplace policies that provide employees the option to use their earned sick time for their own illness or the care of a family member. Additionally, employers may wish to offer family caregiving leave, a vacation donation program in which other employees donate unused vacation time to help colleagues in need, or add a subsidized caregiver backup benefit for employees.
• Enact and effectively implement the CARE Act to prepare family caregivers with the training and instruction they need to provide complex medical and nursing tasks upon a relative or close friend’s discharge from a hospital.
• Ensure community groups and nonprofits can inform and engage family caregivers so they fully understand the benefits and protections available in their state, community, and workplace. This is particularly important when a state, locality, or employer offers more generous protections than FMLA. Depending on where someone lives, he or she may be able to collect unemployment insurance if there is good cause for job loss due to an illness or disability of a family member, receive paid family medical leave benefits, or assert other legal protections.
• Expand access to health care by allowing nurse practitioners to care for people to the full extent of their education and training. Primary care shortages can delay care, hurting patients and adding pressure on family caregivers, who may have to wait longer or travel farther to bring a family member to medical appointments.
• Remove workforce barriers so nurses can delegate routine tasks, such as medication administration, to an aide. This saves family caregivers from having to leave work to perform basic health maintenance tasks.

37
ADVANCING ACTION | LONGTERMSCORECARD.ORG
DIMENSION 5 Effective TransitionsThis dimension includes five indicators. These indicators for measuring effective transitions and the key findings are listed below. Exhibit 15 illustrates states’ rankings by quartile in this dimension.
INDICATOR 1: Nursing Home Residents with Low Care Needs• KEY FINDING. The high-performing states significantly outpace the low-performing states
on this measure. On average, the bottom five states reported one out of five nursing home residents with low care needs, four times the average percentage of the top five states. In Missouri, which has the highest percentage of residents with low care needs, nearly one in four could potentially transition to a home- and community-based setting.
INDICATOR 2: Home Health Hospital Admissions • KEY FINDING. Hospital admissions for patients receiving home health care remained steady
in 47 states. On average, almost one out of every six (15.8 percent) home health patients were hospitalized. Three states (District of Columbia, North Dakota, and Wyoming) made significant improvements. Alaska was the only state with a significant decline but remained the top-performing state on this measure.
State Ranking on Effective Transitions Dimension
Top QuartileSecond QuartileThird QuartileBottom Quartile
DE
MD
DC
HI
AK
AZ
UTNV
CA
NM
OR
WA
WY
ID
MT ND
SD
NE
COKS
OK
TX
MN
IA
MO
AR
LA
WIMI
IL IN
KY
TN
MS AL GA
FL
SC
NC
VA
OH
WV
RI
NJPA
NY
ME
NH
VT
MACT
EXHIBIT 15 State Ranking on Effective Transitions Dimension
Source: Long-Term Services and Supports State Scorecard, 2020.

38
ADVANCING ACTION | LONGTERMSCORECARD.ORG
INDICATOR 3: Nursing Home Hospital Admissions • KEY FINDING. Nationally, one in six (16.8 percent) long-stay nursing home residents were
admitted to the hospital within six months of baseline assessment. Eight states (Arizona, Illinois, Michigan, New Mexico, New York, Ohio, Texas, and Virginia) significantly reduced hospital readmissions since the last edition of the Scorecard. On average, long-stay nursing home residents in the bottom 10 states are twice as likely to be admitted or readmitted to the hospital as residents in the top 10 states.
INDICATOR 4: Burdensome Transitions • KEY FINDING. Fifteen states achieved significant progress in reducing excessive
hospitalizations or other transitions for vulnerable nursing home residents at the end of life. Despite these improvements, more than a quarter of nursing home residents still experience a burdensome transition, and performance differs greatly among states. Roughly twice as many nursing home residents experience burdensome transitions in the bottom five performing states (35.2 percent) compared with the top five performing states (18.4 percent).
INDICATOR 5: Percentage of Short-Stay Residents Who Were Successfully Discharged to the Community (Successful Discharge to Community)
• KEY FINDING. Nationally, just over half (54 percent) of Medicare skilled nursing home residents were successfully discharged back to the community. The top five states for this indicator (Alaska, Arizona, Hawaii, Oregon, and Utah) successfully transitioned more than 60 percent of nursing home residents back to the community. Only Louisiana transitioned substantially fewer than 50 percent.
Advancing Action in Effective Transitions In light of these findings, stakeholders can advance action through the following:
• Reduce overreliance on nursing homes by doing the following: - Offering families options for counseling and diversion programs to direct first-time Medicaid
LTSS participants toward HCBS options. States can also consider implementing presumptive eligibility programs to fast-track eligibility for public HCBS programs that avoid unnecessary nursing home placement.
- Sustaining or creating transition programs like Money Follows the Person, so nursing home residents who wish to return to the community can do so.
• Eliminate barriers to home care services. The federal government should allow nurse practitioners, clinical nurse specialists, and physician assistants to order home health services under Medicare. The change would improve access and potentially prevent the need for hospital or nursing home care.
• Expand home- and facility-based palliative care to provide dignity and comfort to individuals who want to avoid overly aggressive treatment or burdensome transitions across different care providers at the end of life.

39
ADVANCING ACTION | LONGTERMSCORECARD.ORG
ReflectionsBetter Data Are Needed to Assess State LTSS System PerformanceData gaps and data quality issues make it difficult to completely and comprehensively measure LTSS system performance. Improving consistent state-level data collection is a critical need, particularly in the domains of quality of life and quality of care. The main idea of a Scorecard is that measurement, tracking, transparency, and accountability are essential to sustained performance. Gaps in data are not just gaps in measurement: they will eventually manifest as gaps in system performance as well.
LTSS quality remains the most significant and persistent data gap in the Scorecard. This gap and others in the Quality of Life and Quality of Care dimension are so significant that they are reflected in the Scorecard’s core structure. The entire quality dimension is given only half weight in terms of assessing overall LTSS system performance, not because it is any less important, but because we consider it to be incomplete due to a lack of available data to measure multiple important aspects of quality of life and quality of care in institutional and community based settings.
The United States spent $235 billion in 2017 on LTSS services, and increasingly those services are delivered in home and community-based settings. This positive development aligns with people’s stated values and preferences for remaining in the community. However, the lack of comparable sources of data limits cross-state comparisons and national progress.
Absent an accepted nationwide standard to measure HCBS quality, this Scorecard has included—for the first time—a measurement on cross-state benchmarking capacity. This measurement is not a substitute for HCBS quality outcome measures. Instead, it measures a state’s potential capacity to learn from cross-state comparisons and emerging practices—a first step in advancing quality outcomes.
Major Progress on HCBS Spending Proves Progress Is Achievable Nearly a quarter of states achieved a major milestone on LTSS balanced spending and now devote half or more of their Medicaid LTSS spending to HCBS (for older adults and people with physical disabilities). This achievement was unimaginable just nine years ago, when the 2011 Scorecard reported that the average proportion of spending nationwide was just 37 percent for HCBS.
The dramatic shift, especially among higher-performing states, shows that progress is achievable when states collect data, measure and compare progress, and galvanize support among the public and private sectors.
High Performance Does Not Mean High CostHigh-performing LTSS systems that efficiently leverage the private and public sectors can be affordable and effective. For example, when family caregivers, who provide the largest share of help, are well supported with resources, care options, and workplace flexibility, they are better positioned to care for close family and friends and keep those individuals out of costly nursing homes. This in turn helps individuals preserve their resources and delay the need for public assistance and Medicaid.
Supporting family caregivers also has economic benefits. Most of the 41 million family caregivers in the United States are employed in the workforce.19 A strong LTSS system is critical to making sure those caregivers can continue to fully participate in the workforce and contribute to the local economy.
40
ADVANCING ACTION | LONGTERMSCORECARD.ORG
Implementation MattersEffective implementation requires coordination across different sectors. This is particularly true when public policy solutions are designed to influence private-sector action.
The CARE Act, for example—which sets standards and training requirements during a hospital stay—is most effective when hospitals commit to preparing their staff for working with family caregivers as members of their care team as well as helping inform the public of the related benefits and building trust with patients and families during a hospitalization.
Similarly, flexible workplace policies depend on employers for effective implementation. While states and localities can enact various policies, the ultimate test of performance is not just passing a law but ensuring that working caregivers are aware of those benefits and can easily access them.
Transportation Is a Major NeedThis year, the Scorecard features just one transportation policy because of the lack of reliable data to evaluate transportation needs and opportunities across all states. Having only one transportation policy in this Scorecard does not minimize the important role transportation plays in LTSS systems. On the contrary, stakeholders at all levels should learn from, scale, and replicate emerging practices so communities can more systemically meet the transportation needs of older people and adults with disabilities in the community.
Adequate transportation services make it possible for individuals to fully engage in the community and stay healthy. The lack of transportation in some communities makes it more difficult for individuals to get to doctor appointments, shop for groceries and other basic necessities, attend religious services, and participate in social events. Individuals who are cut off from communities and interactions can feel socially isolated, impacting their health and well-being.
Significant and Widespread Performance Improvement across Two Dimensions—Choice of Setting and Provider, and Effective Transitions—Is Needed to Advance Person-Centered CareThe Effective Transitions dimension considers whether consumers within a system can meaningfully exercise their preferences on how and where to receive care. It is not uncommon for people who need LTSS to transition between care settings. While an individual may require periods of hospitalization or a short-term nursing home stay, disruptive transitions may make it difficult or impossible for those who wish to return home to do so.
Person-centered care also requires an adequate supply of HCBS. Consumer choices are only as good as the options available in their community. When a community does not have adequate HCBS, people must choose among the options that are available, not necessarily those they prefer. This impacts people of all incomes. Inadequate HCBS supply also adds pressure on family caregivers to fill in the gaps when services are not available.
“About 40 percent of caregivers spend at least five hours a week providing or arranging transport.” Source: AARP, “Transportation: What Caregivers Need to Know,” AARP, Washington, DC, January 17, 2020, https://www.aarp.org/caregiving/home-care/info-2020/transportation-services.html.

APPENDICES
Long-Term Services and Supports State Scorecard 2020 Edition

ADVANCING ACTION | LONGTERMSCORECARD.ORG
Appendices
Exhibit A1 Matrix Heat Map: Overall Ranking ................................................................................ 43
Exhibit A2 Matrix Heat Map: Affordability and Access ................................................................. 44
Exhibit A3 Matrix Heat Map: Choice of Setting and Provider ...................................................... 45
Exhibit A4 Matrix Heat Map: Quality of Life and Quality of Care ................................................. 46
Exhibit A5 Matrix Heat Map: Support for Family Caregivers ....................................................... 47
Exhibit A6 Matrix Heat Map: Effective Transitions ....................................................................... 48
Exhibit A7 Change in State Performance: Number of States ....................................................... 49
Exhibit A8 Indicator Data: Affordability and Access ..................................................................... 50
Exhibit A9 Indicator Data: Choice of Setting and Provider ........................................................... 52
Exhibit A10 Indicator Data: Quality of Life and Quality of Care ...................................................... 54
Exhibit A11 Indicator Data: Support for Family Caregivers (Policy-Level Scores) ......................... 56
Exhibit A12 Indicator Data: Support for Family Caregivers (Category Totals) ............................... 58
Exhibit A13 Indicator Data: Effective Transitions ............................................................................ 60
Exhibit A14 Detailed Indicator Data: Private Pay Affordability ......................................................... *
Exhibit A15 Detailed Indicator Data: ADRC/NWD Functions ............................................................ *
Exhibit A16 Detailed Indicator Data: Subsidized Housing ................................................................ *
Exhibit A17 Detailed Indicator Data: HCBS Cross-State Quality Benchmarking ............................. *
Exhibit A18 Detailed Indicator Data: Medical/Nurse Delegation and Scope of Practice ................ *
Exhibit A19 Summary of Indicator Rankings by State ...................................................................... *
Exhibit A 20 Summary of Change in Performance by State............................................................... *
Exhibit A21 Matrix Heat Maps for Four LTSS State Scorecards, 2011 to 2020 .............................. *
Exhibit A22 State Ranking on LTSS System Performance by Dimension ......................................... *
Exhibit B1 Acknowledgements ....................................................................................................... 62
Exhibit B2 Methodology Overview ................................................................................................... *
Exhibit B3 Measuring Change over Time ......................................................................................... *
Exhibit B4 Detailed Indicator Descriptions ...................................................................................... *
Exhibit B5 Detailed Indicator Data: Supporting Working Caregivers ............................................. *
*These exhibits are not included in this document. The full set of appendices listed here is included in the Reference Edition of the Scorecard and is available online at www.longtermscorecard.org.

ADVANCING ACTION | LONGTERMSCORECARD.ORG
43
How to Read the Heat MapsMatrix heat maps are our preferred method to visualize LTSS system performance multiple indicators or multiple dimensions in one image.
Like the geographic heat maps used within the report, the data are broken down into color-coded tiers of performance (usually quartiles, except for the Support for Family Caregivers dimension matrix heat map in Exhibit A5). Multiple columns show performance across indicators or dimension, and states are ordered from highest to lowest overall performance.
These heat maps use a divergent color scheme with two colors. This calls attention to both high and low performance. Dark shades identify the extremes of the performance spectrum (orange for high performance, and blue for poor), while light shades indicate an intermediate level of performance.
EXHIBIT A1 Matrix Heat Map: Overall Ranking
Dimension Ranking1 Minnesota2 Washington3 Wisconsin4 Oregon5 Vermont6 Connecticut7 Hawaii8 Colorado9 California
10 Massachusetts11 New York12 New Jersey13 Maryland14 District of Columbia15 Texas16 Alaska17 New Mexico18 Illinois19 Virginia19 Ohio21 Pennsylvania22 Delaware23 Maine24 Rhode Island25 Nebraska26 Arizona27 Montana28 North Dakota29 Idaho30 Missouri30 Michigan32 Iowa33 Wyoming34 Utah35 New Hampshire36 South Dakota37 Kansas38 North Carolina39 Georgia40 Mississippi41 Nevada42 Louisiana43 Tennessee44 Indiana44 Arkansas46 Oklahoma47 Kentucky48 South Carolina49 Alabama50 West Virginia51 Florida
Top QuartileSecond QuartileThird QuartileBottom Quartile
StateOverall Rank
Affo
rdab
ility a
nd A
cces
s
Quali
ty of
Life
and Q
ualit
y of C
are
Supp
ort f
or Fa
mily
Car
egive
rs
Effe
ctive
Tran
sition
s
Prov
ider
Choic
e of S
ettin
g and
Source: Long-Term Services and Supports State Scorecard, 2020.

ADVANCING ACTION | LONGTERMSCORECARD.ORG
44
Rank State
Nurs
ing
Hom
e Cos
tHo
me C
are C
ost
Long
-Term
Car
e Ins
uran
ce
Low-In
com
e PW
D with
Med
icaid
PWD
with M
edica
id LT
SS
ADRC
/NW
D Fu
nctio
ns
District of ColumbiaConnecticut
MissouriMassachusetts
TexasMarylandCalifornia
MinnesotaWisconsin
OhioWashington
VirginiaNew Jersey
ColoradoIllinois
MississippiNew YorkLouisiana
KansasHawaii
IowaSouth Dakota
VermontOregon
ArkansasDelawareAlabama
PennsylvaniaNebraskaMichigan
North DakotaNew Mexico
GeorgiaKentucky
New HampshireTennessee
Rhode IslandWyoming
North CarolinaMontana
IndianaOklahoma
ArizonaMaineAlaskaIdaho
FloridaUtah
West VirginiaSouth Carolina
Nevada
Indicator Ranking
Top QuartileSecond QuartileThird QuartileBottom Quartile
123456789
101112131415161618192021222324252627282930303233343535373839404142434445464748495051
EXHIBIT A2 Matrix Heat Map: Affordability and Access
PWD = People with Disabilities. ADRC/NWD = Aging and Disability Resource Center/No Wrong Door.
Source: Long-Term Services and Supports State Scorecard, 2020.
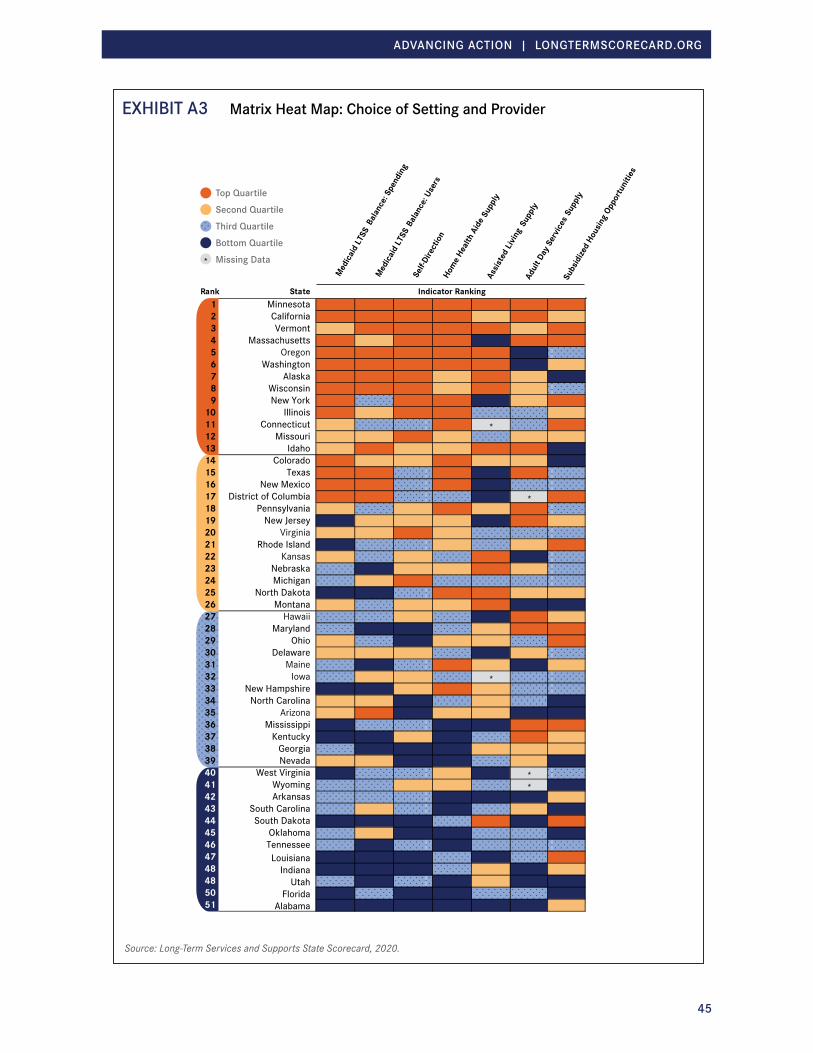
ADVANCING ACTION | LONGTERMSCORECARD.ORG
45
EXHIBIT A3 Matrix Heat Map: Choice of Setting and Provider
1 Minnesota2 California3 Vermont4 Massachusetts5 Oregon6 Washington7 Alaska8 Wisconsin9 New York
10 Illinois11 Connecticut *12 Missouri13 Idaho14 Colorado15 Texas16 New Mexico17 District of Columbia *18 Pennsylvania19 New Jersey20 Virginia21 Rhode Island22 Kansas23 Nebraska24 Michigan25 North Dakota26 Montana27 Hawaii28 Maryland29 Ohio30 Delaware31 Maine32 Iowa *33 New Hampshire34 North Carolina35 Arizona36 Mississippi37 Kentucky38 Georgia
Nevada3940 West Virginia *41 Wyoming *42 Arkansas43 South Carolina44 South Dakota45 Oklahoma46 Tennessee47 Louisiana48 Indiana48 Utah50 Florida51 Alabama
Indicator Ranking
Med
icaid
LTSS
Bala
nce:
Spen
ding
Med
icaid
LTSS
Bala
nce:
User
s
Self-
Dire
ctio
nHo
me H
ealth
Aid
e Sup
ply
Assis
ted
Livin
g Su
pply
Adul
t Day
Ser
vices
Sup
ply
Subs
idize
d Ho
usin
g Opp
ortu
nitie
s
Rank State
Top QuartileSecond QuartileThird QuartileBottom QuartileMissing Data*
Source: Long-Term Services and Supports State Scorecard, 2020.

ADVANCING ACTION | LONGTERMSCORECARD.ORG
46
EXHIBIT A4 Matrix Heat Map: Quality of Life and Quality of Care
PWD = People with Disabilities
Source: Long-Term Services and Supports State Scorecard, 2020.
Rank State
PWD
Rate
of E
mpl
oym
ent
Nurs
ing
Hom
e Res
iden
ts
with
Pre
ssur
e Sor
esNu
rsin
g Ho
me A
ntip
sych
otic
Use
HCBS
Qua
lity B
ench
mar
king
123456789
101112131415161718192021222324242627282830313233343536373839404142434445464748495051
Indicator Ranking
Top QuartileSecond QuartileThird QuartileBottom Quartile
MinnesotaWisconsin
HawaiiDelawareColorado
New JerseyUtah
VermontSouth Dakota
KansasNebraska
OhioWyoming
TexasConnecticut
MontanaIowa
New HampshireIndiana
North DakotaPennsylvania
VirginiaOregon
TennesseeCalifornia
NevadaWashington
North CarolinaAlaska
MarylandIdaho
FloridaMaine
MassachusettsDistrict of Columbia
ArizonaRhode Island
New YorkSouth Carolina
IllinoisOklahoma
West VirginiaMichigan
GeorgiaAlabama
MississippiArkansasMissouri
LouisianaNew Mexico
Kentucky

ADVANCING ACTION | LONGTERMSCORECARD.ORG
47
EXHIBIT A5 Matrix Heat Map: Support for Family Caregivers
Source: Long-Term Services and Supports State Scorecard, 2020.
Rank StateSUPPORTING WORKING FAMILY CAREGIVERS
NURSE DELEGATION AND SCOPE OF PRACTICE
TRANSPORTATION POLICIES
PERSON- AND FAMILY- CENTERED CARE
Level of Policy Adoption
HighModerateLowNone or Minimal
Fam
ily R
espo
nsibi
lity P
rote
cted
Clas
sifica
tion
Exce
eds F
eder
al FM
LAPa
id Fa
mily
Leav
eM
anda
tory
Paid
Sick
Day
s
Flexib
le Si
ck D
ays
Unem
ploym
ent I
nsur
ance
for F
amily
Car
egive
rs
Spou
sal Im
pove
rishm
ent P
rote
ction
s
Havin
g Car
egive
r Ass
essm
ent
CARE
Act
Legis
lation
Nurs
ing Ta
sks A
ble to
be D
elega
ted
Nurs
e Pra
ctiti
oner
Sco
pe of
Pra
ctice
Volu
ntee
r Driv
er P
rote
ction
Level of Policy AdoptionDistrict of Columbia
WashingtonOregon
New JerseyNew York
MinnesotaVermont
CaliforniaHawaii
Rhode IslandConnecticutNew Mexico
ArizonaMaryland
MassachusettsMaineIllinois
WisconsinNevada
ColoradoTexas
New HampshireMichigan
AlaskaOklahomaNebraska
UtahGeorgia
WyomingMontana
LouisianaDelaware
IowaNorth Dakota
ArkansasPennsylvania
MississippiSouth Dakota
MissouriWest Virginia
KentuckyOhio
IdahoNorth Carolina
FloridaSouth Carolina
KansasVirginia
TennesseeAlabama
Indiana
123456788
101112131414161717192021222324242627282930313133343436373839404142434345464748495051

ADVANCING ACTION | LONGTERMSCORECARD.ORG
48
Nurs
ing H
ome R
esid
ents
with
Low C
are N
eeds
Hom
e Hea
lth H
ospi
tal A
dmiss
ions
Nurs
ing H
ome H
ospi
tal A
dmiss
ions
Burd
enso
me T
rans
ition
s Su
cces
sful
Disc
harg
e to
Com
mun
ity
1122 *33445566778899
1100111111221133114411551166117711881199220022112222223322332255226622772288228833003311332233333344335533553377338833994400441144224433 *44444455446644774488449955005511
HawaiiAlaska
UtahOregon
IdahoMaine
WashingtonArizona
WisconsinColorado
MinnesotaMarylandWyoming
VirginiaMontanaVermont
New MexicoOhio
North CarolinaPennsylvania
New YorkNorth Dakota
South CarolinaDelaware
IndianaConnecticut
MichiganRhode Island
South DakotaMassachusetts
TennesseeIowa
NebraskaNew Hampshire
CaliforniaNew Jersey
GeorgiaAlabama
FloridaTexas
West VirginiaIllinois
District of ColumbiaKentucky
NevadaOklahoma
KansasMissouri
LouisianaArkansas
Mississippi
Indicator RankingStateOverall Rank
Missing Data
Top Quartile
Second Quartile
Third Quartile
Bottom Quartile
EXHIBIT A6 Matrix Heat Map: Effective Transitions
Source: Long-Term Services and Supports State Scorecard, 2020.

ADVANCING ACTION | LONGTERMSCORECARD.ORG
49
EXHIBIT A7 Change in State Performance: Number of States
IndicatorPerformance Improvement
Performance Decline
No Significant Change Missing Data
Affordability and AccessNursing Home Cost 1 6 44 0Home Care Cost 0 6 45 0Long-Term Care Insurance 0 24 27 0Low-Income PWD with Medicaid 8 2 41 0PWD with Medicaid LTSS 7 0 44 0ADRC/NWD Functions 33 4 12 2
Choice of Setting and ProviderMedicaid LTSS Balance: Spending 25 9 17 0Medicaid LTSS Balance: Users 12 1 31 7Home Health Aide Supply 5 3 43 0Assisted Living Supply 3 1 43 4Adult Day Services Supply 4 8 33 6Subsidized Housing Opportunities 9 2 40 0
Quality of Life and Quality of CarePWD Rate of Employment 5 2 44 0Nursing Home Antipsychotic Use 28 1 22 0
Support for Family CaregiversSupporting Working Family Caregivers 23 0 28 0Person- and Family-Centered Care 29 5 17 0Nurse Delegation and Scope of Practice 6 0 45 0Transportation Policies 2 0 49 0
Effective TransitionsHome Health Hospital Admissions 3 1 47 0Nursing Home Hospital Admissions 8 1 42 0Burdensome Transitions 15 3 33 0
Improvement or decline means a significant change (usually +/- 10% or equivalent) since a reference data year (usually three years prior). For some measures, a revised baseline is used, as the indicator definition or data source may have changed since the last Scorecard.
Source: Long-Term Services and Supports State Scorecard, 2020.

ADVANCING ACTION | LONGTERMSCORECARD.ORG
50
EXHIBIT A8 Indicator Data: Affordability and Access
Median Annual Nursing Home Private Pay Cost as a Percentage
of Median Household Income Ages 65+
Median Annual Home Care Private Pay Cost as a Percentage of
Median Household Income Ages 65+
Private Long-Term Care Insurance Policies in Effect per 1,000
Population Ages 40+State 2015—16 2018—19 Rank Change 2015—16 2018—19 Rank Change 2015 2018 Rank ChangeUnited States 243% 245% ↔ 79% 80% ↔ 47 43 ↔ Alabama 205% 208% 11 ↔ 72% 72% 9 ↔ 34 31 42 ↔ Alaska 475% 638% 51 X 71% 82% 25 X 26 24 49 ↔ Arizona 220% 224% 20 ↔ 76% 85% 32 X 33 28 45 XArkansas 204% 202% 9 ↔ 83% 82% 25 ↔ 31 27 48 XCalifornia 249% 232% 25 ↔ 77% 71% 7 ↔ 45 42 24 ↔ Colorado 206% 216% 14 ↔ 78% 82% 25 ↔ 58 52 15 XConnecticut 334% 324% 45 ↔ 71% 70% 6 ↔ 66 63 9 ↔ Delaware 265% 254% 32 ↔ 76% 76% 11 ↔ 59 51 17 XDistrict of Columbia 199% 196% 8 ↔ 46% 51% 1 X 146 138 1 ↔ Florida 273% 281% 39 ↔ 78% 79% 18 ↔ 35 29 43 XGeorgia 202% 222% 18 ↔ 72% 76% 11 ↔ 37 33 38 XHawaii 225% 241% 30 ↔ 64% 67% 3 ↔ 114 110 3 ↔ Idaho 233% 248% 31 ↔ 83% 78% 16 ↔ 33 28 45 XIllinois 209% 218% 15 ↔ 84% 81% 22 ↔ 57 53 13 ↔ Indiana 237% 232% 25 ↔ 83% 85% 32 ↔ 38 34 37 XIowa 171% 194% 7 X 88% 91% 39 ↔ 102 91 6 XKansas 174% 172% 2 ↔ 77% 81% 22 ↔ 85 78 8 ↔ Kentucky 231% 239% 29 ↔ 85% 81% 22 ↔ 36 32 40 XLouisiana 191% 187% 6 ↔ 75% 71% 7 ↔ 36 32 40 XMaine 312% 325% 47 ↔ 102% 105% 50 ↔ 56 55 11 ↔ Maryland 230% 222% 18 ↔ 59% 64% 2 ↔ 54 50 19 ↔ Massachusetts 319% 311% 43 ↔ 89% 87% 35 ↔ 57 53 13 ↔ Michigan 243% 267% 34 ↔ 81% 87% 35 ↔ 38 36 35 ↔ Minnesota 224% 287% 40 X 97% 103% 47 ↔ 85 79 7 ↔ Mississippi 238% 229% 24 ↔ 84% 77% 13 ↔ 33 29 43 XMissouri 170% 168% 1 ↔ 80% 84% 30 ↔ 60 55 11 ↔ Montana 222% 226% 21 ↔ 93% 89% 38 ↔ 56 50 19 XNebraska 199% 209% 12 ↔ 93% 93% 41 ↔ 116 103 5 XNevada 257% 236% 28 ↔ 74% 77% 13 ↔ 23 24 49 ↔ New Hampshire 268% 280% 38 ↔ 83% 91% 39 ↔ 47 43 23 ↔ New Jersey 290% 310% 42 ↔ 72% 78% 16 ↔ 51 48 21 ↔ New Mexico 243% 270% 36 X 85% 87% 35 ↔ 43 41 27 ↔ New York 374% 324% 45 89% 84% 30 ↔ 44 42 24 ↔ North Carolina 233% 226% 21 ↔ 76% 77% 13 ↔ 43 38 32 XNorth Dakota 333% 328% 48 ↔ 97% 99% 46 ↔ 119 106 4 XOhio 237% 234% 27 ↔ 83% 82% 25 ↔ 45 41 27 ↔ Oklahoma 164% 177% 3 ↔ 85% 82% 25 ↔ 37 33 38 XOregon 254% 269% 35 ↔ 84% 93% 41 X 46 40 30 XPennsylvania 305% 301% 41 ↔ 88% 86% 34 ↔ 43 39 31 ↔ Rhode Island 303% 321% 44 ↔ 102% 104% 48 ↔ 40 38 32 ↔ South Carolina 212% 226% 21 ↔ 77% 79% 18 ↔ 47 37 34 XSouth Dakota 205% 220% 16 ↔ 95% 116% 51 X 120 111 2 ↔ Tennessee 201% 220% 16 ↔ 76% 79% 18 ↔ 46 42 24 ↔ Texas 184% 182% 5 ↔ 71% 73% 10 ↔ 41 35 36 XUtah 174% 181% 4 ↔ 69% 69% 4 ↔ 36 28 45 XVermont 300% 338% 49 X 99% 104% 48 ↔ 52 47 22 ↔ Virginia 208% 211% 13 ↔ 61% 69% 4 X 64 59 10 ↔ Washington 252% 258% 33 ↔ 86% 94% 43 ↔ 69 51 17 XWest Virginia 275% 354% 50 X 73% 80% 21 ↔ 27 24 49 XWisconsin 258% 277% 37 ↔ 89% 97% 45 ↔ 58 52 15 XWyoming 197% 205% 10 ↔ 92% 96% 44 ↔ 44 41 27 ↔
Key for Change: Performance improvement ↔ Little or no change in performance X Performance decline * No trend available
Source: Long-Term Services and Supports State Scorecard, 2020.

ADVANCING ACTION | LONGTERMSCORECARD.ORG
51
EXHIBIT A8 Indicator Data: Affordability and Access (continued)
Percentage of Adults Ages 21+ with ADL Disability at or Below 250% of
Poverty Receiving Medicaid or Other Government Assistance
Health Insurance
Estimated Medicaid LTSS Users per 100 Population with ADL
Disability
ADRC/No Wrong Door Functions (Composite Indicator, scale
0-100%)State 2014—15 2016—18 Rank Change 2014 2017 Rank Change 2016 2019 Rank ChangeUnited States 55.2% 56.7% ↔ 44 46 ↔ 60% 66% Alabama 46.9% 47.7% 46 ↔ 21 21 49 ↔ 78% 89% 8 Alaska 69.1% 70.4% 2 ↔ 49 42 21 ↔ 46% 41% 46 XArizona 49.9% 53.8% 29 ↔ 30 34 34 ↔ 51% 64% 28 Arkansas 55.8% 57.5% 17 ↔ 45 42 21 ↔ 56% 57% 34 ↔ California 66.8% 66.5% 6 ↔ 57 60 8 ↔ 0% 37% 47 *Colorado 57.2% 56.9% 22 ↔ 45 49 16 ↔ 45% 52% 39 Connecticut 62.8% 67.1% 5 71 80 4 ↔ 87% 90% 7 Delaware 49.2% 45.2% 49 ↔ 36 36 32 ↔ 73% 77% 22 District of Columbia 78.1% 79.2% 1 ↔ 97 88 2 ↔ 74% 86% 10 Florida 50.1% 51.1% 34 ↔ 24 24 47 ↔ 82% 82% 15 ↔ Georgia 47.9% 48.7% 41 ↔ 24 27 45 ↔ 70% 81% 19 Hawaii 56.6% 48.4% 43 X 16 28 43 68% 79% 20 Idaho 54.1% 48.4% 43 X 44 46 17 ↔ 38% 43% 44 Illinois 48.7% 51.5% 32 ↔ 46 58 10 47% 46% 41 ↔ Indiana 49.8% 55.2% 27 32 36 32 ↔ 41% 57% 34 Iowa 50.5% 50.8% 35 ↔ 48 51 14 ↔ 0% 43% 44 *Kansas 48.6% 48.2% 45 ↔ 36 34 34 ↔ 60% 63% 29 Kentucky 53.4% 56.5% 25 ↔ 29 28 43 ↔ 72% 83% 12 Louisiana 54.4% 59.0% 13 32 33 38 ↔ 52% 56% 36 Maine 63.6% 66.2% 7 ↔ 33 31 40 ↔ 51% 52% 39 ↔ Maryland 51.4% 56.5% 25 29 30 41 ↔ 80% 84% 11 Massachusetts 67.7% 67.8% 4 ↔ 70 77 5 ↔ 88% 93% 3 Michigan 60.0% 60.9% 10 ↔ 37 37 30 ↔ 70% 70% 26 ↔ Minnesota 55.9% 57.5% 17 ↔ 81 83 3 ↔ 88% 92% 5 Mississippi 57.9% 58.0% 16 ↔ 40 38 29 ↔ 72% 83% 12 Missouri 50.0% 50.2% 37 ↔ 57 61 7 ↔ 81% 82% 15 ↔ Montana 43.4% 49.4% 39 33 40 26 41% 44% 43 Nebraska 50.9% 47.3% 47 ↔ 41 39 27 ↔ 48% 53% 38 Nevada 49.6% 48.7% 41 ↔ 19 25 46 56% 66% 27 New Hampshire 47.4% 49.6% 38 ↔ 32 34 34 ↔ 88% 95% 2 New Jersey 57.4% 56.9% 22 ↔ 46 51 14 ↔ 82% 82% 15 ↔ New Mexico 54.7% 58.6% 14 ↔ 53 55 11 ↔ 29% 33% 48 New York 67.4% 70.1% 3 ↔ 57 54 12 ↔ 50% 75% 23 North Carolina 51.4% 52.4% 31 ↔ 34 34 34 ↔ 30% 24% 50 XNorth Dakota 51.8% 59.1% 12 43 41 24 ↔ 52% 54% 37 ↔ Ohio 55.0% 56.6% 24 ↔ 45 45 18 ↔ 86% 96% 1 Oklahoma 38.8% 41.4% 51 ↔ 36 33 38 ↔ 59% 60% 32 ↔ Oregon 57.3% 57.2% 19 ↔ 37 42 21 ↔ 77% 88% 9 Pennsylvania 52.6% 57.2% 19 37 39 27 ↔ 79% 82% 15 Rhode Island 60.1% 65.7% 9 54 54 12 ↔ 56% 62% 30 South Carolina 44.7% 49.0% 40 ↔ 19 24 47 44% 46% 41 ↔ South Dakota 53.2% 50.8% 35 ↔ 38 41 24 ↔ 51% 78% 21 Tennessee 47.0% 51.2% 33 ↔ 22 21 49 ↔ 33% 58% 33 Texas 52.9% 52.9% 30 ↔ 73 71 6 ↔ 72% 74% 24 Utah 44.3% 46.0% 48 ↔ 21 19 51 ↔ 30% 28% 49 ↔ Vermont 67.4% 66.2% 7 ↔ 93 100 1 ↔ 79% 73% 25 XVirginia 43.1% 45.1% 50 ↔ 29 29 42 ↔ 73% 83% 12 Washington 56.8% 58.2% 15 ↔ 39 44 19 ↔ 92% 93% 3 West Virginia 56.7% 57.0% 21 ↔ 30 37 30 61% 62% 30 ↔ Wisconsin 57.7% 59.2% 11 ↔ 59 60 8 ↔ 79% 92% 5 Wyoming 56.7% 54.4% 28 ↔ 35 43 20 21% 13% 51 X
Key for Change: Performance improvement ↔ Little or no change in performance X Performance decline * No trend available
Source: Long-Term Services and Supports State Scorecard, 2020.

ADVANCING ACTION | LONGTERMSCORECARD.ORG
52
EXHIBIT A9 Indicator Data: Choice of Setting and Provider
Percentage of Medicaid- and State-Funded LTSS Spending Going to HCBS
for Older People and Adults with Physical Disabilities
Estimated Percentage of Medicaid Aged/Disabled LTSS Users
Receiving HCBS
Number of People Self-Directing Services per 1,000 Population with Disabilities
State 2013 2016 Rank Change 2014 2017 Rank Change 2019 Rank ChangeUnited States 41.3% 45.1% 61.7% 64.2% ↔ 30.4 *Alabama 15.2% 14.8% 49 ↔ 31.2% 31.9% 50 ↔ 2.6 44 *
Alaska 63.2% 63.4% 6 ↔ 86.3% 83.9% 1 ↔ 35.2 12 *
Arizona 44.9% 44.7% 16 ↔ 76.6% 78.2% 10 ↔ 3.5 40 *
Arkansas 33.0% 33.9% 28 ↔ 52.4% 53.2% 31 ↔ 5.7 34 *
California 57.4% 57.0% 8 ↔ 78.7% 80.2% 7 ↔ 149.1 1 *
Colorado 47.8% 58.7% 7 65.2% 68.5% 16 ↔ 15.0 19 *
Connecticut 29.8% 41.1% 20 53.0% 54.6% 26 ↔ 8.0 30 *
Delaware 24.7% 35.6% 26 * 55.5% 24 * 12.9 23 *
District of Columbia 57.7% 49.7% 13 X 77.9% 80.4% 5 ↔ 8.0 30 *
Florida 25.6% 23.6% 44 X 42.6% 47.0% 38 ↔ 1.7 47 *
Georgia 26.2% 29.6% 32 49.7% 46.8% 39 ↔ 2.7 41 *
Hawaii 23.6% 27.8% 36 * 54.3% 28 * 23.1 16 *
Idaho 44.1% 44.6% 17 ↔ 71.4% 80.0% 8 11.6 26 *
Illinois 42.9% 54.6% 10 58.9% 69.8% 13 46.5 8 *
Indiana 20.0% 18.4% 47 ↔ 34.9% 38.1% 47 ↔ 0.4 51 *
Iowa 30.7% 26.4% 39 X 51.8% 59.5% 21 26.5 14 *
Kansas 40.8% 39.5% 21 ↔ 50.6% 54.2% 29 ↔ 24.4 15 *
Kentucky 15.6% 13.5% 51 X 41.5% 41.1% 44 ↔ 13.7 21 *
Louisiana 30.2% 24.1% 43 X 46.7% 40.0% 46 X 1.9 46 *
Maine 34.2% 28.5% 34 X 37.7% 36.8% 49 ↔ 5.5 36 *
Maryland 24.6% 28.5% 34 38.5% 42.4% 43 ↔ 1.6 48 *
Massachusetts 52.0% 64.2% 5 65.4% 68.6% 15 ↔ 49.2 6 *
Michigan 24.8% 31.5% 29 63.2% 61.6% 19 ↔ 36.1 11 *
Minnesota 66.8% 69.9% 3 77.4% 80.5% 4 60.6 3 *
Mississippi 23.1% 25.5% 41 51.0% 50.7% 34 ↔ 6.8 33 *
Missouri 39.3% 42.7% 18 63.8% 65.2% 18 ↔ 47.2 7 *
Montana 36.8% 38.2% 24 ↔ 47.5% 54.4% 27 16.2 18 *
Nebraska 27.7% 29.6% 32 ↔ 44.9% 45.5% 42 ↔ 12.8 24 *
Nevada 37.8% 38.4% 22 ↔ 67.0% 69.2% 14 ↔ 2.7 41 *
New Hampshire 19.0% 14.0% 50 X 33.8% 41.0% 45 12.6 25 *
New Jersey 18.2% 21.0% 46 55.8% 65.3% 17 20.6 17 *
New Mexico 64.4% 73.5% 1 * 81.3% 2 * 10.9 27 *
New York 47.6% 53.3% 11 43.9% 51.0% 33 38.0 10 *
North Carolina 46.2% 41.9% 19 X 64.8% 61.5% 20 ↔ 2.6 44 *
North Dakota 17.1% 17.3% 48 ↔ 29.1% 27.7% 51 ↔ 5.6 35 *
Ohio 33.3% 37.1% 25 48.3% 49.3% 36 ↔ 1.5 50 *
Oklahoma 28.1% 30.4% 31 54.2% 55.1% 25 ↔ 2.7 41 *
Oregon 62.1% 64.7% 4 79.7% 80.3% 6 ↔ 49.6 5 *
Pennsylvania 28.9% 38.3% 23 42.6% 47.7% 37 13.3 22 *
Rhode Island 21.8% 24.4% 42 * 50.6% 35 * 10.8 28 *
South Carolina 27.8% 31.2% 30 55.5% 56.3% 23 ↔ 4.0 38 *
South Dakota 19.5% 21.9% 45 35.2% 37.4% 48 ↔ 1.6 48 *
Tennessee 33.3% 35.0% 27 ↔ * 46.2% 40 * 4.0 38 *
Texas 55.5% 55.8% 9 ↔ * 79.4% 9 * 4.4 37 *
Utah 25.6% 26.6% 38 ↔ 46.1% 45.6% 41 ↔ 8.9 29 *
Vermont 44.5% 45.7% 15 ↔ * 81.1% 3 * 51.3 4 *
Virginia 45.6% 48.6% 14 55.3% 57.0% 22 ↔ 27.0 13 *
Washington 62.6% 71.5% 2 73.5% 77.0% 11 43.2 9 *
West Virginia 30.1% 26.3% 40 X 49.8% 54.2% 29 ↔ 8.0 30 *
Wisconsin 51.9% 52.5% 12 ↔ 71.4% 75.5% 12 64.0 2 *
Wyoming 21.8% 27.5% 37 45.8% 51.3% 32 14.5 20 *
Key for Change: Performance improvement ↔ Little or no change in performance X Performance decline * No trend available
Source: Long-Term Services and Supports State Scorecard, 2020.

ADVANCING ACTION | LONGTERMSCORECARD.ORG
53
EXHIBIT A9 Indicator Data: Choice of Setting and Provider (continued)
Home Health and Personal Care Aides per 100 Population Ages
18+ with an ADL Disability
Assisted Living and Residential Care Units per 1,000 Population
Ages 75+
Adult Day Services Total Licensed Capacity per
10,000 Population Ages 65+
Subsidized Housing Opportunities
as a Percentage of All Housing Units
State 2013—15 2016—18 Rank Change 2014 2016 Rank Change 2014 2016 Rank Change 2015 2017—18 Rank ChangeUnited States 22 22 ↔ 51 49 ↔ 64 61 ↔ 5.9% 6.2% ↔ Alabama 10 8 51 X 31 26 45 ↔ 10 9 43 ↔ 6.5% 6.5% 16 ↔ Alaska 24 22 21 ↔ 80 89 4 ↔ 62 52 16 ↔ 3.9% 4.0% 49 ↔ Arizona 20 20 23 ↔ 56 51 24 ↔ 11 8 44 X 2.8% 2.9% 51 ↔ Arkansas 13 14 41 ↔ 29 35 37 24 14 41 X 6.6% 6.5% 16 ↔ California 28 29 5 ↔ 59 60 14 ↔ 178 171 1 ↔ 5.8% 6.1% 21 ↔ Colorado 21 24 14 ↔ 54 52 22 ↔ 71 53 15 X 4.4% 4.9% 41 Connecticut 30 33 2 ↔ * * * * 42 34 25 ↔ 7.4% 8.6% 5 Delaware 14 19 30 33 30 43 ↔ 39 39 21 ↔ 5.4% 5.3% 35 ↔ District of Columbia 17 16 37 ↔ 21 23 48 ↔ * * * * 17.7% 18.6% 1 ↔ Florida 13 13 43 ↔ 44 47 27 ↔ 30 31 29 ↔ 4.3% 4.7% 43 ↔ Georgia 11 11 47 ↔ 52 55 20 ↔ 38 38 22 ↔ 5.9% 6.2% 19 ↔ Hawaii 13 15 39 ↔ * 26 45 * 78 98 6 5.8% 6.3% 18 ↔ Idaho 31 23 17 X 88 82 8 ↔ * 71 8 * 4.4% 3.8% 50 XIllinois 23 24 14 ↔ 39 41 30 ↔ 28 21 34 X 6.2% 6.6% 13 ↔ Indiana 15 15 39 ↔ 50 52 22 ↔ 15 17 39 ↔ 5.7% 6.1% 21 ↔ Iowa 19 16 37 ↔ * * * * 23 21 34 ↔ 5.8% 5.6% 31 ↔ Kansas 21 19 30 ↔ 64 87 5 * 8 44 * 5.6% 5.7% 29 ↔ Kentucky 10 9 50 ↔ 47 39 32 ↔ 94 72 7 X 5.9% 6.6% 13 Louisiana 21 19 30 ↔ 20 20 49 ↔ 35 34 25 ↔ 6.8% 7.7% 7 Maine 23 26 10 ↔ 63 61 13 ↔ 27 16 40 X 6.5% 6.1% 21 ↔ Maryland 14 18 33 51 58 17 ↔ 128 122 4 ↔ 6.8% 7.6% 8 Massachusetts 25 28 6 ↔ 30 34 39 ↔ 90 99 5 ↔ 9.0% 10.1% 4 Michigan 17 18 33 ↔ 56 48 26 ↔ 20 23 32 ↔ 5.2% 5.5% 34 ↔ Minnesota 34 33 2 ↔ 88 90 3 ↔ 79 66 10 ↔ 6.0% 6.9% 11 Mississippi 10 10 49 ↔ 36 33 41 ↔ 120 67 9 X 7.9% 7.8% 6 ↔ Missouri 22 23 17 ↔ 49 43 29 ↔ 44 44 20 ↔ 6.0% 6.2% 19 ↔ Montana 20 23 17 ↔ 83 80 9 ↔ 6 7 46 ↔ 4.8% 4.6% 45 ↔ Nebraska 16 20 23 90 73 10 ↔ 72 59 14 ↔ 6.0% 5.9% 28 ↔ Nevada 13 12 45 ↔ 28 38 34 40 36 24 ↔ 4.3% 4.7% 43 ↔ New Hampshire 29 26 10 ↔ 55 59 15 ↔ 24 23 32 ↔ 5.3% 5.6% 31 ↔ New Jersey 19 20 23 ↔ 36 35 37 ↔ 123 134 2 ↔ 6.0% 6.6% 13 New Mexico 34 32 4 ↔ 32 34 39 ↔ 13 20 36 4.9% 5.2% 38 ↔ New York 42 47 1 ↔ 28 27 44 ↔ 40 45 19 ↔ 10.2% 10.5% 2 ↔ North Carolina 16 17 35 ↔ 65 53 21 ↔ 33 31 29 ↔ 4.8% 4.9% 41 ↔ North Dakota 16 25 12 105 102 1 ↔ 10 48 17 6.2% 6.1% 21 ↔ Ohio 21 20 23 ↔ 54 59 15 ↔ 30 26 31 ↔ 6.7% 6.9% 11 ↔ Oklahoma 14 12 45 ↔ 44 39 32 ↔ 33 34 25 ↔ 5.0% 5.1% 40 ↔ Oregon 23 25 12 ↔ 121 95 2 X 5 6 47 5.7% 5.7% 29 ↔ Pennsylvania 22 27 7 64 58 17 ↔ 71 66 10 ↔ 5.1% 5.2% 38 ↔ Rhode Island 17 20 23 ↔ 51 49 25 ↔ 57 61 12 ↔ 10.1% 10.4% 3 ↔ South Carolina 13 14 41 ↔ 42 37 35 ↔ 47 46 18 ↔ 4.9% 4.6% 45 ↔ South Dakota 15 17 35 ↔ 76 72 11 ↔ 29 18 38 X 9.4% 7.6% 8 XTennessee 13 13 43 ↔ 44 41 30 ↔ 17 20 36 ↔ 5.6% 6.0% 26 ↔ Texas 27 27 7 ↔ 39 33 41 ↔ 130 125 3 ↔ 4.6% 5.3% 35 Utah 12 11 47 ↔ 58 58 17 ↔ * 6 47 * 4.3% 4.4% 48 ↔ Vermont 31 27 7 ↔ 54 62 12 ↔ 63 61 12 ↔ 7.3% 7.2% 10 ↔ Virginia 21 20 23 ↔ 56 45 28 ↔ 33 32 28 ↔ 5.4% 5.6% 31 ↔ Washington 25 24 14 ↔ 103 85 6 ↔ 13 12 42 ↔ 6.1% 6.1% 21 ↔ West Virginia 19 21 22 ↔ 26 24 47 ↔ * * * * 5.7% 6.0% 26 ↔ Wisconsin 22 23 17 ↔ 92 84 7 ↔ 41 38 22 ↔ 5.1% 5.3% 35 ↔ Wyoming 27 20 23 X * 37 35 * * * * * 4.7% 4.5% 47 ↔
Key for Change: Performance improvement ↔ Little or no change in performance X Performance decline * No trend available
Source: Long-Term Services and Supports State Scorecard, 2020.

ADVANCING ACTION | LONGTERMSCORECARD.ORG
54
EXHIBIT A10 Indicator Data: Quality of Life and Quality of Care
Rate of Employment for Adults with ADL Disability Ages 18-64 Relative to Rate of Employment for
Adults without ADL Disability Ages 18-64
Percentage of High-Risk Nursing Home Residents
with Pressure SoresState 2013—15 2016—18 Rank Change 2018 Rank ChangeUnited States 21.4% 21.4% ↔ 7.3% *Alabama 18.4% 15.5% 51 ↔ 7.5% 27 *Alaska 29.0% 19.6% 38 X 5.9% 15 *Arizona 21.1% 17.8% 46 ↔ 7.7% 32 *Arkansas 17.9% 16.5% 49 ↔ 7.7% 32 *California 21.4% 21.5% 27 ↔ 7.0% 25 *Colorado 22.9% 24.9% 15 ↔ 5.6% 10 *Connecticut 25.2% 23.5% 21 ↔ 5.3% 3 *Delaware 20.8% 22.8% 24 ↔ 5.4% 6 *District of Columbia 20.4% 23.5% 21 ↔ 13.0% 51 *Florida 19.8% 20.6% 33 ↔ 7.9% 35 *Georgia 20.0% 21.3% 28 ↔ 9.0% 47 *Hawaii 26.0% 26.9% 11 ↔ 5.2% 2 *Idaho 18.6% 28.4% 8 5.8% 13 *Illinois 22.4% 21.1% 32 ↔ 7.5% 27 *Indiana 20.3% 21.3% 28 ↔ 7.1% 26 *Iowa 30.0% 26.6% 12 ↔ 5.3% 3 *Kansas 28.1% 25.5% 14 ↔ 6.1% 17 *Kentucky 15.7% 16.9% 48 ↔ 8.3% 37 *Louisiana 17.4% 19.2% 39 ↔ 8.8% 44 *Maine 18.9% 17.6% 47 ↔ 5.4% 6 *Maryland 28.3% 24.3% 18 ↔ 8.9% 46 *Massachusetts 21.3% 21.3% 28 ↔ 5.7% 12 *Michigan 18.1% 18.6% 44 ↔ 7.7% 32 *Minnesota 33.3% 31.1% 4 ↔ 5.9% 15 *Mississippi 16.5% 19.8% 37 9.3% 48 *Missouri 18.8% 18.9% 41 ↔ 7.9% 35 *Montana 30.4% 27.1% 10 ↔ 6.3% 19 *Nebraska 28.4% 27.7% 9 ↔ 5.6% 10 *Nevada 36.5% 34.9% 2 ↔ 8.6% 41 *New Hampshire 24.7% 24.7% 16 ↔ 6.1% 17 *New Jersey 24.2% 23.6% 19 ↔ 8.3% 37 *New Mexico 22.1% 19.2% 39 ↔ 8.3% 37 *New York 22.4% 20.3% 36 ↔ 8.6% 41 *North Carolina 19.5% 18.8% 42 ↔ 9.8% 50 *North Dakota 25.3% 38.1% 1 4.8% 1 *Ohio 23.0% 21.9% 26 ↔ 6.7% 23 *Oklahoma 24.3% 24.7% 16 ↔ 9.6% 49 *Oregon 23.8% 23.6% 19 ↔ 8.5% 40 *Pennsylvania 20.5% 20.6% 33 ↔ 6.9% 24 *Rhode Island 20.6% 20.4% 35 ↔ 6.4% 20 *South Carolina 19.6% 18.1% 45 ↔ 8.6% 41 *South Dakota 29.6% 32.6% 3 ↔ 5.5% 9 *Tennessee 16.1% 18.7% 43 ↔ 7.5% 27 *Texas 21.4% 21.3% 28 ↔ 7.6% 31 *Utah 27.7% 30.2% 6 ↔ 6.4% 20 *Vermont 19.3% 30.8% 5 5.4% 6 *Virginia 22.2% 26.3% 13 7.5% 27 *Washington 22.6% 23.4% 23 ↔ 6.6% 22 *West Virginia 18.6% 16.4% 50 ↔ 8.8% 44 *Wisconsin 22.7% 22.1% 25 ↔ 5.8% 13 *Wyoming 34.1% 29.2% 7 X 5.3% 3 *
Key for Change: Performance improvement ↔ Little or no change in performance X Performance decline * No trend available
Source: Long-Term Services and Supports State Scorecard, 2020.

ADVANCING ACTION | LONGTERMSCORECARD.ORG
55
EXHIBIT A10 Indicator Data: Quality of Life and Quality of Care (continued)
Percentage of Long-Stay Nursing Home Residents Who
Inappropriately Receive Antipsychotic MedicationHCBS Quality Cross-State Benchmarking
Capability State 2015 2018 Rank Change 2015—19 Rank ChangeUnited States 17.3% 14.6% 1.3 *Alabama 19.9% 20.2% 51 ↔ 2.2 11 *Alaska 14.5% 11.6% 6 0 38 *Arizona 17.4% 12.5% 10 1.0 31 *Arkansas 16.9% 14.0% 19 0 38 *California 13.2% 10.8% 4 0 38 *Colorado 15.4% 15.0% 29 ↔ 2.0 12 *Connecticut 17.3% 16.5% 37 ↔ 1.5 20 *Delaware 13.3% 13.6% 15 ↔ 1.6 16 *District of Columbia 13.3% 10.0% 3 0 38 *Florida 17.5% 14.0% 19 1.5 20 *Georgia 19.8% 18.1% 46 2.0 12 *Hawaii 8.0% 7.8% 1 ↔ 0 38 *Idaho 16.8% 17.7% 43 ↔ 0 38 *Illinois 20.3% 18.7% 48 ↔ 1.5 20 *Indiana 16.4% 14.4% 24 2.5 8 *Iowa 16.5% 14.6% 27 0 38 *Kansas 19.9% 16.5% 37 2.7 6 *Kentucky 20.2% 17.3% 39 0 38 *Louisiana 21.5% 15.8% 34 0.6 37 *Maine 17.8% 17.4% 42 ↔ 1.6 16 *Maryland 14.1% 12.2% 8 1.0 31 *Massachusetts 18.9% 17.8% 44 ↔ 1.0 31 *Michigan 13.4% 13.0% 13 ↔ 0 38 *Minnesota 13.5% 13.3% 14 ↔ 3.5 2 *Mississippi 21.1% 18.2% 47 2.0 12 *Missouri 19.4% 18.8% 49 ↔ 1.2 24 *Montana 15.0% 12.8% 11 0 38 *Nebraska 19.4% 17.3% 39 1.6 16 *Nevada 16.6% 15.1% 30 1.2 24 *New Hampshire 17.2% 14.1% 21 1.0 31 *New Jersey 12.9% 9.6% 2 2.5 8 *New Mexico 16.6% 17.3% 39 ↔ 0 38 *New York 15.6% 11.2% 5 0 38 *North Carolina 14.4% 12.0% 7 3.0 5 *North Dakota 18.5% 17.8% 44 ↔ 0 38 *Ohio 19.6% 14.4% 24 3.1 3 *Oklahoma 19.8% 18.9% 50 ↔ 1.8 15 *Oregon 17.4% 14.3% 23 1.6 16 *Pennsylvania 16.4% 15.5% 32 ↔ 2.7 6 *Rhode Island 17.2% 16.1% 35 ↔ 0.8 36 *South Carolina 14.2% 13.6% 15 ↔ 1.2 24 *South Dakota 16.7% 16.3% 36 ↔ 1.2 24 *Tennessee 20.0% 14.9% 28 3.6 1 *Texas 20.8% 12.8% 11 2.5 8 *Utah 17.9% 13.7% 17 1.2 24 *Vermont 16.8% 15.7% 33 ↔ 1.2 24 *Virginia 17.1% 14.2% 22 1.0 31 *Washington 16.1% 15.1% 30 ↔ 1.2 24 *West Virginia 16.1% 13.9% 18 1.5 20 *Wisconsin 12.9% 12.2% 8 ↔ 3.1 3 *Wyoming 12.4% 14.4% 24 X 0 38 *
Key for Change: Performance improvement ↔ Little or no change in performance X Performance decline * No trend available
Source: Long-Term Services and Supports State Scorecard, 2020.

ADVANCING ACTION | LONGTERMSCORECARD.ORG
56
Source: Long-Term Services and Supports State Scorecard, 2020.
EXHIBIT A11 Indicator Data: Support for Family Caregivers (Policy-Level Scores)
Supporting Working Family Caregivers
Family Responsibility
Protected Classification
(out of 2.0)
Exceeds Federal FMLA
(out of 4.0)
Paid Family Leave
(out of 4.0)
Mandatory Paid Sick Days
(out of 3.0)
Flexible Sick Days
(out of 3.0)
Unemployment Insurance for Family Caregivers (out of 1.0)
State 2014 2019 2016 2019 2016 2019 2016 2019 2016 2019 2016 2019United States 0.23 0.29 0.29 0.29 0.25 0.50 0.51 0.85 0.58 0.75 0.49 0.49Alabama 0 0 0 0 0 0 0 0 0 0 0 0Alaska 0 0 0 0 0 0 0 0 0 0 1.00 1.00Arizona 0 0.30 0 0 0 0 1.00 2.00 1.13 2.25 1.00 1.00Arkansas 0 0 0 0 0 0 0 0 0 0 1.00 1.00California 0 0.60 0.75 0 3.25 3.25 2.50 2.50 2.25 2.25 1.00 1.00Colorado 0.30 0.30 0 0 0 0 0 0 0 0 1.00 1.00Connecticut 1.00 1.00 1.75 1.75 0 2.00 2.00 2.00 1.00 1.00 1.00 1.00Delaware 2.00 2.00 0 0 0 0 0 0 0 0 1.00 1.00District of Columbia 2.00 2.00 3.00 3.00 1.75 3.50 2.00 2.00 2.00 2.00 1.00 1.00Florida 0.60 0.60 0 0 0 0 0 0 0 0 0 0Georgia 0 0 0 0 0 0 0 0 0.63 1.25 0 0Hawaii 0 0 2.00 2.00 0 0 0 0 2.00 2.00 1.00 1.00Idaho 0 0 0 0 0 0 0 0 0 0 0 0Illinois 0.60 0.60 0 0 0 0 1.00 2.00 2.25 2.25 1.00 1.00Indiana 0 0.30 0 0 0 0 0 0 0 0 0 0Iowa 0 0.60 0 0 0 0 0 0 0 0 0 0Kansas 0.60 0.60 0 0 0 0 0 0 0 0 1.00 1.00Kentucky 0.30 0.30 0 0 0 0 0 0 0 0 0 0Louisiana 0 0 0 0 0 0 0 0 0 0 0 0Maine 0.30 0.30 1.25 1.25 0 0 0 1.50 1.00 1.00 1.00 1.00Maryland 0.60 0.60 0 0 0 0 1.50 2.50 2.00 2.00 0 0Massachusetts 0 0 0 0 0 3.25 2.50 2.50 1.75 1.75 1.00 1.00Michigan 0.60 0.60 0 0 0 0 0 2.00 0 1.00 0 0Minnesota 0 0 0.50 0.50 0 0 1.00 2.00 2.25 2.25 1.00 1.00Mississippi 0 0 0 0 0 0 0 0 0 0 0 0Missouri 0 0 0 0 0 0 0 0 0 0 0 0Montana 0 0 0 0 0 0 0 0 0 0 0 0Nebraska 0 0 0 0 0 0 0 0 0 0 0 0Nevada 0 0 0 0 0 0 0 2.00 0 0 1.00 1.00New Hampshire 0 0 0 0 0 0 0 0 0 0 1.00 1.00New Jersey 0.60 0.60 0.50 1.75 1.50 2.50 2.00 3.00 2.00 2.00 0 0New Mexico 0 0.30 0 0 0 0 0 1.50 0 3.00 0 0New York 0.60 0.60 0 0 1.50 3.50 2.00 2.00 1.00 2.00 1.00 1.00North Carolina 0 0 0 0 0 0 0 0 0 0 0 0North Dakota 0 0 0 0 0 0 0 0 0 0 0 0Ohio 0.30 0.30 0 0 0 0 0 0 0 0 0 0Oklahoma 0 0.30 0 0 0 0 0 0 0 0 1.00 1.00Oregon 0.30 0.30 2.00 2.00 0 1.50 2.50 2.50 2.00 2.00 1.00 1.00Pennsylvania 0.60 0.60 0 0 0 0 1.50 1.50 0 0 1.00 1.00Rhode Island 0 0 0.50 0.50 2.75 2.75 0 2.50 0 1.75 1.00 1.00South Carolina 0 0 0 0 0 0 0 0 0 0 1.00 1.00South Dakota 0 0 0 0 0 0 0 0 0 0 0 0Tennessee 0 0 0 0 0 0 0 0 0 0 0 0Texas 0.30 0.30 0 0 0 0 0 1.50 0 0 0 0Utah 0 0 0 0 0 0 0 0 0 0 1.00 1.00Vermont 0 0 1.25 1.25 0 0 2.50 3.00 2.25 2.25 0 0Virginia 0 0 0 0 0 0 0 0 0 0 0 0Washington 0 0 0.75 0 1.75 3.50 2.00 3.00 2.75 2.75 1.00 1.00West Virginia 0 0 0 0 0 0 0 0 0 0 0 0Wisconsin 0 0.60 0.75 0.75 0 0 0 0 1.25 1.25 1.00 1.00Wyoming 0 0 0 0 0 0 0 0 0 0 0 0

ADVANCING ACTION | LONGTERMSCORECARD.ORG
57
Person- and Family-Centered CareNurse Delegation and
Scope of PracticeTransportation
Policies
Spousal Impoverishment
Protections (out of 2.0)
Having Caregiver
Assessment (out of 2.5)
CARE Act Legislation (out of 1.0)
Nursing Tasks Able to be Delegated (out of 4.0)
Nurse Practitioner
Scope of Practice
(out of 1.0)
Volunteer Driver Protection (out of 1.0)
State 2016 2019 2016 2019 2016 2019 2016 2019 2016 2019 2015-16 2019United States 0.92 0.90 0.97 1.34 0.63 0.80 2.66 2.69 0.59 0.61 0.10 0.14Alabama 0.51 0 1.60 1.60 0 0 0.50 0.50 0.50 0.50 0 0Alaska 2.00 2.00 0 0 1.00 1.00 4.00 4.00 1.00 1.00 0 0Arizona 0.50 0.50 1.60 1.60 0 0 3.50 3.50 1.00 1.00 0 0Arkansas 0.50 0.50 0 1.00 1.00 1.00 3.50 3.50 0.50 0.50 0 0California 2.00 2.00 0 0 1.00 1.00 0.50 0.50 0 0 1.00 1.00Colorado 1.50 1.50 1.00 1.00 1.00 1.00 4.00 4.00 1.00 1.00 0 0Connecticut 0.50 0.50 0 1.60 1.00 1.00 0.50 0.50 1.00 1.00 0 0Delaware 0.51 0.50 1.90 1.90 1.00 1.00 0.75 0.75 0.50 0.50 0 0District of Columbia 1.00 0 1.60 2.20 1.00 1.00 2.50 2.50 1.00 1.00 0 0Florida 1.50 1.50 1.60 2.20 0 0 0 0 0 0 1.00 1.00Georgia 2.00 2.00 1.90 1.60 0 0 3.50 3.50 0 0 0 0Hawaii 1.65 2.00 1.60 1.60 1.00 1.00 3.50 3.50 1.00 1.00 0 0Idaho 0.50 0.50 0 0 0 0 4.00 4.00 1.00 1.00 0 0Illinois 2.00 1.63 1.30 1.30 1.00 1.00 0.50 0.50 0.50 0.50 0 0Indiana 0.50 0.50 0 0 1.00 1.00 0 0 0.50 0.50 0 0Iowa 1.00 1.00 0 0 0 1.00 4.00 4.00 1.00 1.00 0 0Kansas 0.50 0.50 0 0 0 1.00 1.50 1.50 0.50 0.50 0 0Kentucky 0.50 0.50 0 0 0 1.00 4.00 4.00 0.50 0.50 0 0Louisiana 2.00 2.00 1.60 1.90 1.00 1.00 2.00 2.25 0.50 0.50 0 0Maine 1.50 1.50 0 0 1.00 1.00 2.25 2.25 1.00 1.00 1.00 1.00Maryland 0.50 0.50 0 0 1.00 1.00 3.50 3.50 1.00 1.00 0 1.00Massachusetts 1.50 0.50 1.60 1.60 1.00 1.00 0.50 0.50 0 0 0 0Michigan 0.50 0.50 1.00 1.00 1.00 1.00 3.25 3.25 0 0 0 0Minnesota 0.60 1.50 2.20 2.50 1.00 1.00 4.00 4.00 1.00 1.00 0 0Mississippi 2.00 2.00 1.00 2.50 1.00 1.00 1.25 1.25 0.50 0.50 0 0Missouri 0.50 0.50 0 1.30 0 1.00 4.00 4.00 0 0 0 0Montana 0.50 0.50 1.00 1.30 0 1.00 4.00 4.00 1.00 1.00 0 0Nebraska 0.50 0.50 2.20 2.20 1.00 1.00 4.00 4.00 1.00 1.00 0 0Nevada 0.50 0.50 1.00 1.30 1.00 1.00 3.75 3.75 1.00 1.00 0 0New Hampshire 0.50 0.50 1.60 1.90 1.00 1.00 3.25 3.25 1.00 1.00 1.00 1.00New Jersey 0.50 0.50 0 1.30 1.00 1.00 3.50 4.00 0.50 0.50 0 0New Mexico 0.58 0.53 0 1.00 1.00 1.00 4.00 4.00 1.00 1.00 0 0New York 1.53 1.49 0 1.00 1.00 1.00 2.75 2.75 0.50 0.50 0 0North Carolina 0.50 0.50 1.00 1.00 0 0 4.00 4.00 0 0 0 0North Dakota 0.28 1.00 1.00 1.00 0 1.00 3.50 3.50 0.50 1.00 0 0Ohio 0.50 0.50 1.00 1.60 0 1.00 1.75 1.75 0.50 0.50 0 0Oklahoma 1.01 1.00 1.30 2.20 1.00 1.00 3.50 3.50 0 0 0 0Oregon 0.50 0.50 1.00 2.50 1.00 1.00 4.00 4.00 1.00 1.00 0 0Pennsylvania 0.50 0.50 1.90 2.20 1.00 1.00 0 0 0.50 0.50 0 0Rhode Island 0.50 0.50 1.00 1.60 1.00 1.00 0 0 1.00 1.00 0 1.00South Carolina 1.45 1.41 1.90 2.20 0 0 0.25 0.50 0 0 0 0South Dakota 0.50 0.50 2.20 2.20 0 0 3.25 3.25 0.50 1.00 0 0Tennessee 0.50 0.50 1.00 1.30 0 1.00 0.50 0.50 0 0 0 0Texas 1.00 1.00 2.20 1.90 0 1.00 4.00 4.00 0 0 0 0Utah 0.50 0.50 1.60 1.60 1.00 1.00 4.00 4.00 0.50 0.50 0 0Vermont 1.50 1.47 0 1.60 0 0 4.00 4.00 1.00 1.00 1.00 1.00Virginia 0.50 0.50 0 0 1.00 1.00 3.00 3.00 0 0 0 0Washington 0.82 0.80 2.50 2.50 1.00 1.00 4.00 4.00 1.00 1.00 0 0West Virginia 0.50 0.50 0 1.60 1.00 1.00 3.00 3.00 0.50 0.50 0 0Wisconsin 1.11 1.08 1.30 1.60 0 0 3.50 4.00 0.50 0.50 0 0Wyoming 2.00 2.00 1.30 1.30 1.00 1.00 2.75 2.75 1.00 1.00 0 0
Source: Long-Term Services and Supports State Scorecard, 2020.
EXHIBIT A11 Indicator Data: Support for Family Caregivers (Policy-Level Scores) (continued)

ADVANCING ACTION | LONGTERMSCORECARD.ORG
58
Supporting Working Family
CaregiversPerson- and Family-Centered
CareNurse Delegation and Scope of
PracticeState 2014—16 2019 Change 2016 2019 Change 2016 2019 ChangeUnited States 2.35 3.17 2.52 3.04 3.25 3.30 ↔ Alabama 0 0 ↔ 2.11 1.60 X 1.00 1.00 ↔ Alaska 1.00 1.00 ↔ 3.00 3.00 ↔ 5.00 5.00 ↔ Arizona 3.13 5.55 2.10 2.10 ↔ 4.50 4.50 ↔ Arkansas 1.00 1.00 ↔ 1.50 2.50 4.00 4.00 ↔ California 9.75 9.60 ↔ 3.00 3.00 ↔ 0.50 0.50 ↔ Colorado 1.30 1.30 ↔ 3.50 3.50 ↔ 5.00 5.00 ↔ Connecticut 6.75 8.75 1.50 3.10 1.50 1.50 ↔ Delaware 3.00 3.00 ↔ 3.41 3.40 ↔ 1.25 1.25 ↔ District of Columbia 11.75 13.50 3.60 3.20 X 3.50 3.50 ↔ Florida 0.60 0.60 ↔ 3.10 3.70 0 0 ↔ Georgia 0.63 1.25 3.90 3.60 X 3.50 3.50 ↔ Hawaii 5.00 5.00 ↔ 4.25 4.60 4.50 4.50 ↔ Idaho 0 0 ↔ 0.50 0.50 ↔ 5.00 5.00 ↔ Illinois 4.85 5.85 4.30 3.93 X 1.00 1.00 ↔ Indiana 0 0.30 1.50 1.50 ↔ 0.50 0.50 ↔ Iowa 0 0.60 1.00 2.00 5.00 5.00 ↔ Kansas 1.60 1.60 ↔ 0.50 1.50 2.00 2.00 ↔ Kentucky 0.30 0.30 ↔ 0.50 1.50 4.50 4.50 ↔ Louisiana 0 0 ↔ 4.60 4.90 2.50 2.75 Maine 3.55 5.05 2.50 2.50 ↔ 3.25 3.25 ↔ Maryland 4.10 5.10 1.50 1.50 ↔ 4.50 4.50 ↔ Massachusetts 5.25 8.50 4.10 3.10 X 0.50 0.50 ↔ Michigan 0.60 3.60 2.50 2.50 ↔ 3.25 3.25 ↔ Minnesota 4.75 5.75 3.80 5.00 5.00 5.00 ↔ Mississippi 0 0 ↔ 4.00 5.50 1.75 1.75 ↔ Missouri 0 0 ↔ 0.50 2.80 4.00 4.00 ↔ Montana 0 0 ↔ 1.50 2.80 5.00 5.00 ↔ Nebraska 0 0 ↔ 3.70 3.70 ↔ 5.00 5.00 ↔ Nevada 1.00 3.00 2.50 2.80 4.75 4.75 ↔ New Hampshire 1.00 1.00 ↔ 3.10 3.40 4.25 4.25 ↔ New Jersey 6.60 9.85 1.50 2.80 4.00 4.50 New Mexico 0 4.80 1.58 2.53 5.00 5.00 ↔ New York 6.10 9.10 2.53 3.49 3.25 3.25 ↔ North Carolina 0 0 ↔ 1.50 1.50 ↔ 4.00 4.00 ↔ North Dakota 0 0 ↔ 1.28 3.00 4.00 4.50 Ohio 0.30 0.30 ↔ 1.50 3.10 2.25 2.25 ↔ Oklahoma 1.00 1.30 3.31 4.20 3.50 3.50 ↔ Oregon 7.80 9.30 2.50 4.00 5.00 5.00 ↔ Pennsylvania 3.10 3.10 ↔ 3.40 3.70 0.50 0.50 ↔ Rhode Island 4.25 8.50 2.50 3.10 1.00 1.00 ↔ South Carolina 1.00 1.00 ↔ 3.35 3.61 0.25 0.50 South Dakota 0 0 ↔ 2.70 2.70 ↔ 3.75 4.25 Tennessee 0 0 ↔ 1.50 2.80 0.50 0.50 ↔ Texas 0.30 1.80 3.20 3.90 4.00 4.00 ↔ Utah 1.00 1.00 ↔ 3.10 3.10 ↔ 4.50 4.50 ↔ Vermont 6.00 6.50 1.50 3.07 5.00 5.00 ↔ Virginia 0 0 ↔ 1.50 1.50 ↔ 3.00 3.00 ↔ Washington 8.25 10.25 4.32 4.30 ↔ 5.00 5.00 ↔ West Virginia 0 0 ↔ 1.50 3.10 3.50 3.50 ↔ Wisconsin 3.00 3.60 2.41 2.68 4.00 4.50 Wyoming 0 0 ↔ 4.30 4.30 ↔ 3.75 3.75 ↔
EXHIBIT A12 Indicator Data: Support for Family Caregivers (Category Totals)
Key for Change: Performance improvement ↔ Little or no change in performance X Performance decline
Source: Long-Term Services and Supports State Scorecard, 2020.
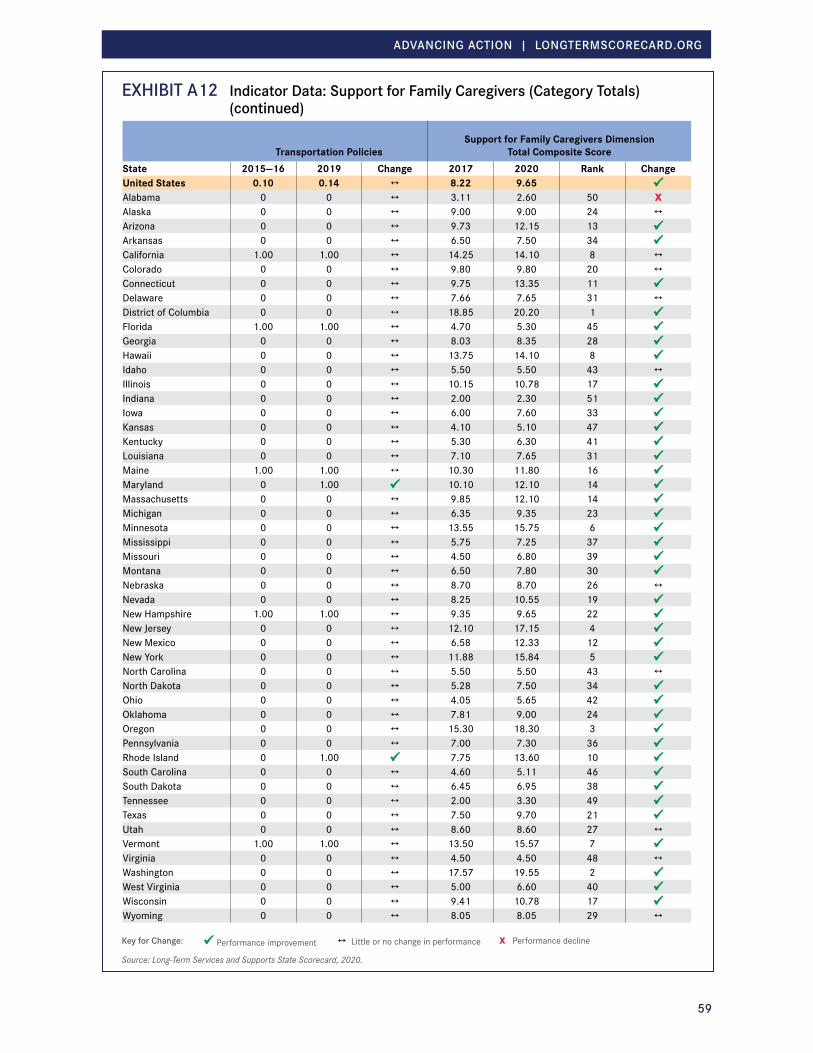
ADVANCING ACTION | LONGTERMSCORECARD.ORG
59
EXHIBIT A12 Indicator Data: Support for Family Caregivers (Category Totals) (continued)
Transportation PoliciesSupport for Family Caregivers Dimension
Total Composite ScoreState 2015—16 2019 Change 2017 2020 Rank ChangeUnited States 0.10 0.14 ↔ 8.22 9.65 Alabama 0 0 ↔ 3.11 2.60 50 XAlaska 0 0 ↔ 9.00 9.00 24 ↔ Arizona 0 0 ↔ 9.73 12.15 13 Arkansas 0 0 ↔ 6.50 7.50 34 California 1.00 1.00 ↔ 14.25 14.10 8 ↔ Colorado 0 0 ↔ 9.80 9.80 20 ↔ Connecticut 0 0 ↔ 9.75 13.35 11 Delaware 0 0 ↔ 7.66 7.65 31 ↔ District of Columbia 0 0 ↔ 18.85 20.20 1 Florida 1.00 1.00 ↔ 4.70 5.30 45 Georgia 0 0 ↔ 8.03 8.35 28 Hawaii 0 0 ↔ 13.75 14.10 8 Idaho 0 0 ↔ 5.50 5.50 43 ↔ Illinois 0 0 ↔ 10.15 10.78 17 Indiana 0 0 ↔ 2.00 2.30 51 Iowa 0 0 ↔ 6.00 7.60 33 Kansas 0 0 ↔ 4.10 5.10 47 Kentucky 0 0 ↔ 5.30 6.30 41 Louisiana 0 0 ↔ 7.10 7.65 31 Maine 1.00 1.00 ↔ 10.30 11.80 16 Maryland 0 1.00 10.10 12.10 14 Massachusetts 0 0 ↔ 9.85 12.10 14 Michigan 0 0 ↔ 6.35 9.35 23 Minnesota 0 0 ↔ 13.55 15.75 6 Mississippi 0 0 ↔ 5.75 7.25 37 Missouri 0 0 ↔ 4.50 6.80 39 Montana 0 0 ↔ 6.50 7.80 30 Nebraska 0 0 ↔ 8.70 8.70 26 ↔ Nevada 0 0 ↔ 8.25 10.55 19 New Hampshire 1.00 1.00 ↔ 9.35 9.65 22 New Jersey 0 0 ↔ 12.10 17.15 4 New Mexico 0 0 ↔ 6.58 12.33 12 New York 0 0 ↔ 11.88 15.84 5 North Carolina 0 0 ↔ 5.50 5.50 43 ↔ North Dakota 0 0 ↔ 5.28 7.50 34 Ohio 0 0 ↔ 4.05 5.65 42 Oklahoma 0 0 ↔ 7.81 9.00 24 Oregon 0 0 ↔ 15.30 18.30 3 Pennsylvania 0 0 ↔ 7.00 7.30 36 Rhode Island 0 1.00 7.75 13.60 10 South Carolina 0 0 ↔ 4.60 5.11 46 South Dakota 0 0 ↔ 6.45 6.95 38 Tennessee 0 0 ↔ 2.00 3.30 49 Texas 0 0 ↔ 7.50 9.70 21 Utah 0 0 ↔ 8.60 8.60 27 ↔ Vermont 1.00 1.00 ↔ 13.50 15.57 7 Virginia 0 0 ↔ 4.50 4.50 48 ↔ Washington 0 0 ↔ 17.57 19.55 2 West Virginia 0 0 ↔ 5.00 6.60 40 Wisconsin 0 0 ↔ 9.41 10.78 17 Wyoming 0 0 ↔ 8.05 8.05 29 ↔
Key for Change: Performance improvement ↔ Little or no change in performance X Performance decline
Source: Long-Term Services and Supports State Scorecard, 2020.

ADVANCING ACTION | LONGTERMSCORECARD.ORG
60
EXHIBIT A13 Indicator Data: Effective TransitionsPercentage of Nursing Home Residents with
Low Care Needs
Percentage of Home Health Patients
with a Hospital Admission
Percentage of Long-Stay Nursing Home Residents Hospitalized within a
Six-Month PeriodState 2017 Rank Change 2014 2017 Rank Change 2014 2016 Rank ChangeUnited States 8.9% * 15.9% 15.8% ↔ 17.6% 16.8% ↔ Alabama 11.1% 32 * 17.1% 17.4% 50 ↔ 19.0% 18.7% 40 ↔ Alaska * * * 12.3% 13.8% 1 X 11.1% 13.0% 18 XArizona 7.1% 14 * 14.9% 14.8% 10 ↔ 8.2% 7.2% 2 Arkansas 14.5% 43 * 17.4% 17.0% 47 ↔ 24.3% 23.4% 49 ↔ California 9.3% 26 * 14.5% 14.4% 3 ↔ 18.5% 18.8% 41 ↔ Colorado 13.1% 41 * 14.5% 14.5% 5 ↔ 8.5% 8.8% 5 ↔ Connecticut 12.3% 37 * 16.8% 16.4% 38 ↔ 13.9% 12.7% 16 ↔ Delaware 10.0% 28 * 17.1% 15.8% 22 ↔ 15.6% 16.0% 30 ↔ District of Columbia * * * 16.7% 15.1% 12 19.4% 19.4% 43 ↔ Florida 7.2% 15 * 15.3% 15.4% 18 ↔ 21.7% 21.4% 47 ↔ Georgia 8.4% 23 * 16.4% 16.7% 41 ↔ 17.4% 16.2% 32 ↔ Hawaii 3.0% 3 * 14.6% 14.5% 5 ↔ 5.1% 4.7% 1 ↔ Idaho 8.0% 18 * 14.4% 14.4% 3 ↔ 12.1% 11.2% 9 ↔ Illinois 10.0% 28 * 15.7% 15.7% 21 ↔ 19.9% 17.3% 35 Indiana 5.2% 7 * 16.4% 15.8% 22 ↔ 17.0% 17.2% 34 ↔ Iowa 15.9% 45 * 16.7% 16.0% 29 ↔ 15.2% 14.2% 21 ↔ Kansas 18.2% 47 * 17.3% 16.7% 41 ↔ 19.3% 18.6% 39 ↔ Kentucky 5.6% 10 * 17.2% 16.8% 44 ↔ 21.0% 20.7% 46 ↔ Louisiana 12.2% 35 * 15.9% 16.1% 31 ↔ 26.8% 26.3% 50 ↔ Maine 2.1% 1 * 16.4% 15.5% 19 ↔ 11.9% 12.2% 12 ↔ Maryland 5.1% 6 * 16.4% 15.3% 16 ↔ 15.9% 15.5% 28 ↔ Massachusetts 9.1% 24 * 16.9% 16.9% 46 ↔ 12.6% 12.9% 17 ↔ Michigan 8.3% 20 * 15.9% 15.9% 26 ↔ 16.9% 15.3% 25 Minnesota 12.8% 38 * 16.5% 16.2% 36 ↔ 7.0% 7.2% 2 ↔ Mississippi 11.8% 34 * 17.2% 16.8% 44 ↔ 28.2% 28.0% 51 ↔ Missouri 24.0% 49 * 16.5% 16.1% 31 ↔ 18.8% 17.5% 36 ↔ Montana 14.8% 44 * 14.8% 16.0% 29 ↔ 12.0% 12.6% 14 ↔ Nebraska 12.2% 35 * 16.6% 16.1% 31 ↔ 15.7% 15.8% 29 ↔ Nevada 9.1% 24 * 15.4% 16.1% 31 ↔ 19.4% 19.9% 45 ↔ New Hampshire 11.5% 33 * 16.5% 17.5% 51 ↔ 13.7% 13.4% 20 ↔ New Jersey 10.6% 31 * 16.0% 15.8% 22 ↔ 19.7% 18.2% 38 ↔ New Mexico 13.0% 40 * 15.1% 14.7% 7 ↔ 15.0% 13.1% 19 New York 6.8% 13 * 16.4% 16.4% 38 ↔ 14.1% 12.6% 14 North Carolina 4.7% 4 * 16.1% 15.6% 20 ↔ 16.4% 16.1% 31 ↔ North Dakota 13.1% 41 * 17.6% 14.7% 7 13.8% 14.4% 22 ↔ Ohio 7.3% 16 * 16.0% 15.9% 26 ↔ 13.4% 11.9% 11 Oklahoma 20.7% 48 * 15.5% 15.2% 14 ↔ 22.8% 23.3% 48 ↔ Oregon 5.5% 9 * 14.7% 14.7% 7 ↔ 8.8% 9.4% 6 ↔ Pennsylvania 5.9% 11 * 16.7% 16.7% 41 ↔ 13.6% 12.5% 13 ↔ Rhode Island 10.5% 30 * 15.9% 17.0% 47 ↔ 8.6% 8.2% 4 ↔ South Carolina 5.2% 7 * 16.1% 16.3% 37 ↔ 19.0% 18.0% 37 ↔ South Dakota 16.2% 46 * 14.9% 15.8% 22 ↔ 15.5% 15.3% 25 ↔ Tennessee 4.7% 4 * 16.9% 17.0% 47 ↔ 19.4% 18.8% 41 ↔ Texas 8.3% 20 * 14.8% 15.2% 14 ↔ 21.4% 19.6% 44 Utah 2.9% 2 * 13.7% 14.1% 2 ↔ 11.3% 10.3% 7 ↔ Vermont 8.2% 19 * 16.1% 16.1% 31 ↔ 13.7% 14.8% 23 ↔ Virginia 7.6% 17 * 16.7% 15.9% 26 ↔ 17.6% 15.4% 27 Washington 6.2% 12 * 14.9% 14.8% 10 ↔ 11.1% 11.6% 10 ↔ West Virginia 9.3% 26 * 17.6% 16.5% 40 ↔ 16.8% 16.5% 33 ↔ Wisconsin 8.3% 20 * 16.6% 15.3% 16 ↔ 11.7% 11.1% 8 ↔ Wyoming 12.8% 38 * 16.8% 15.1% 12 16.4% 15.1% 24 ↔
Key for Change: Performance improvement ↔ Little or no change in performance X Performance decline * No trend available
Source: Long-Term Services and Supports State Scorecard, 2020.

ADVANCING ACTION | LONGTERMSCORECARD.ORG
61
EXHIBIT A13 Indicator Data: Effective Transitions (continued)
Percentage of Nursing Home Residents with One or More Potentially Burdensome Transitions at End of Life
Percentage of Short-Stay Residents Who were Successfully Discharged to the Community
State 2013 2016 Rank Change 2017—18 Rank ChangeUnited States 29.8% 28.6% ↔ 53.9% *Alabama 28.9% 24.7% 18 55.2% 26 *Alaska 14.0% 18.6% 3 X 62.6% 3 *Arizona 26.5% 26.8% 32 ↔ 60.9% 5 *Arkansas 33.6% 31.6% 44 ↔ 50.7% 45 *California 33.9% 33.4% 47 ↔ 52.0% 37 *Colorado 23.7% 23.8% 13 ↔ 58.6% 9 *Connecticut 28.4% 26.0% 26 57.8% 12 *Delaware 28.7% 25.8% 24 55.7% 20 *District of Columbia 33.0% 33.3% 46 ↔ 51.7% 39 *Florida 40.6% 39.2% 51 ↔ 51.9% 38 *Georgia 29.5% 26.9% 33 54.3% 30 *Hawaii 15.5% 16.2% 1 ↔ 68.5% 1 *Idaho 17.3% 17.9% 2 ↔ 59.8% 7 *Illinois 33.4% 30.2% 41 49.9% 48 *Indiana 26.0% 26.5% 28 ↔ 52.7% 36 *Iowa 27.7% 27.3% 34 ↔ 55.7% 20 *Kansas 30.6% 28.2% 38 53.9% 31 *Kentucky 28.4% 29.6% 40 ↔ 51.0% 44 *Louisiana 36.7% 33.6% 48 43.8% 51 *Maine 21.9% 21.8% 9 ↔ 58.6% 9 *Maryland 27.2% 26.7% 31 ↔ 57.0% 15 *Massachusetts 25.3% 25.7% 23 ↔ 55.0% 27 *Michigan 27.6% 27.8% 36 ↔ 55.3% 23 *Minnesota 21.8% 23.2% 12 ↔ 59.9% 6 *Mississippi 36.9% 35.7% 50 ↔ 49.7% 50 *Missouri 27.6% 27.7% 35 ↔ 50.0% 47 *Montana 20.2% 20.7% 6 ↔ 59.2% 8 *Nebraska 25.0% 25.1% 22 ↔ 53.7% 32 *Nevada 28.2% 31.0% 43 X 51.7% 39 *New Hampshire 24.2% 24.3% 16 ↔ 53.4% 33 *New Jersey 29.8% 29.4% 39 ↔ 55.3% 23 *New Mexico 23.9% 24.8% 19 ↔ 55.8% 19 *New York 26.5% 24.2% 15 51.3% 43 *North Carolina 28.7% 27.8% 36 ↔ 55.0% 27 *North Dakota 19.2% 20.1% 5 ↔ 49.9% 48 *Ohio 34.3% 31.8% 45 56.8% 16 *Oklahoma 32.7% 30.4% 42 51.4% 41 *Oregon 22.5% 21.0% 8 ↔ 61.4% 4 *Pennsylvania 27.3% 24.8% 19 53.1% 34 *Rhode Island 34.5% 26.6% 30 55.3% 23 *South Carolina 28.3% 26.5% 28 ↔ 56.0% 17 *South Dakota 23.1% 20.7% 6 53.1% 34 *Tennessee 26.8% 25.8% 24 ↔ 54.4% 29 *Texas 35.4% 34.0% 49 ↔ 51.4% 41 *Utah 28.3% 25.0% 21 63.1% 2 *Vermont 15.4% 21.9% 10 X 55.9% 18 *Virginia 26.6% 24.4% 17 57.5% 14 *Washington 21.3% 22.8% 11 ↔ 57.8% 12 *West Virginia 28.0% 26.2% 27 ↔ 50.6% 46 *Wisconsin 22.9% 23.8% 13 ↔ 58.2% 11 *Wyoming 20.9% 19.3% 4 ↔ 55.5% 22 *
Key for Change: Performance improvement ↔ Little or no change in performance X Performance decline * No trend available
Source: Long-Term Services and Supports State Scorecard, 2020.

ADVANCING ACTION | LONGTERMSCORECARD.ORG
62
Exhibit B1 AcknowledgementsThe authors would like to thank all of those who provided expert guidance and support to the Scorecard team, including project leads at The Commonwealth Fund and The SCAN Foundation and the rest of the AARP project team, members of the Scorecard National Advisory Panel (NAP), and a host of subject matter experts.
We would particularly like to thank the project leads at The Commonwealth Fund and The SCAN Foundation:
The Commonwealth Fund• David Blumenthal, MD, President
• Melinda Abrams, Senior Vice President, Delivery System Reform and International Innovations
• Tanya Shah, Vice President, Delivery System Reform
The SCAN Foundation• Bruce A. Chernof, MD, President & Chief
Executive Officer
• Gretchen Alkema, Vice President, Policy & Communications
• Megan Burke, Policy Analyst
• Mari Nicholson, Director of Communications
• René Seidel, Vice President, Programs & Operations
• Erin Westphal, Program Officer
We would also like to thank the AARP extended project team:
• Debra Whitman, Executive Vice President and Chief Public Policy Officer, AARP
• Patricia Shannon, Senior Vice President and Chief Financial Officer, AARP Foundation
• Carl Levesque, Senior Writer and Editor, AARP Public Policy Institute
• Allison Richardson, Project Manager, AARP Public Policy Institute
• Kim Sedmak, Policy Outreach Director, AARP Public Policy Institute
The Scorecard National Advisory Panel is drawn from a broad range of knowledgeable stakeholders across public, private, and non-profit organizations, and federal government. Their task was to advise the AARP project team on all aspects of the LTSS State Scorecard, including expanding and updating the indicator set to reflect changes in available data since the development of the third Scorecard. We would like to thank:
• Lisa Alecxih, The Lewin Group
• Robert Applebaum, Miami University of Ohio
• Mary Olsen Baker, Minnesota Department of Human Services
• Shawn Bloom, National PACE Association
• Jennifer Bowdoin, Centers for Medicare & Medicaid Services
• Jennifer Burnett, Pennsylvania Health and Wellness
• Brian Burwell, Ventech Solutions
• RoAnne Chaney, Michigan Disability Rights Coalition
• Amanda Fredriksen, AARP Texas State Office
• Lori Gerhard, Administration for Community Living, U.S. Dept of Health & Human Services
• Carol Irvin, Mathematica
• Susan Jenkins, Administration for Community Living, U.S. Dept of Health & Human Services
• Rosalie Kane, University of Minnesota
• Ruth Katz, U.S. Department of Health & Human Services
• Kathy Kelly, Family Caregiver Alliance
• Gavin Kennedy, U.S. Department of Health & Human Services
• Dawn Lambert, Connecticut Division of Health Services, Department of Social Services
• Joyce Larkin, Centene Corporation

ADVANCING ACTION | LONGTERMSCORECARD.ORG
63
• Amanda Lehning, University of Maryland
• Danielle Nelson, U.S. Department of Transportation
• Elizabeth Priaulx, National Disability Rights Network
• Bea Rector, Washington State Department of Social & Health Services
• Martha Roherty, ADvancing States
• Elaine Ryan, AARP State Advocacy & Strategic Integration
• Paul Saucier, Maine Department of Health and Human Services
• Marisa Scala-Foley, National Association of Area Agencies on Aging
• Manisha Sengupta, National Center for Health Statistics
• Bonnie Silva, Colorado Department of Health Care Policy & Financing
• Damon Terzaghi, ADvancing States
• Angela Witt, Wisconsin Department of Health Services
In addition to the NAP, we would like to thank the following individuals who provided expert consultation during the development of the 4th edition of the Scorecard:
• Christopher Birkmeyer, Genworth
• Natalie Boonchaisri, The Lewin Group
• Rita Choula, AARP Public Policy Institute
• Elaine Dalpiaz, AARP State and Community Engagement
• Steve Eiken, IBM Watson Health
• Lynn Feinberg, AARP Public Policy Institute
• Wendy Fox-Grage, National Academy for State Health Policy
• Sara Galantowicz, Abt Associates
• Brad Gudzinas, AARP Public Policy Institute
• Edem Hado, AARP Public Policy Institute
• Ilene Henshaw, AARP State Advocacy & Strategy Integration
• Joseph Lugo, Administration for Community Living, U.S. Dept of Health & Human Services
• Jana Lynott, AARP Public Policy Institute
• Robert Mollica, Independent Contractor
• Christina Neil-Bowen, Independent Contractor
• Gordon Saunders, Genworth
• Katharine Witgert, Abt Associates

longtermscorecard.org
Long-Term Services and Supports State Scorecard 2020 Edition