financing for long-term services and supports
TRANSCRIPT

The Hilltop Institute was formerly the Center for Health Program Development and Management.
Financing for Long-Term Servicesand Supports
Harriet L. Komisar
National Health Policy ForumFocus on Reform: Long-Term Services and Supports
and the CLASS Act June 18, 2010

-2-
Overview
How do we pay for long-term services and supports (LTSS)? Mainly: out-of-pocket and Medicaid
Closer looker at: Medicare (doesn’t cover LTSS) Private long-term care insurance (small role) Medicaid (role as safety net, “nursing home
bias,” wide variation among states)

SOURCES OF FINANCINGFOR LONG-TERM SERVICES AND SUPPORTS
-3-

-4-
Most people are not insured for LTSS
Unpaid care (family and friends): Large role
Private long-term care insurance: Few have it
Medicare: Does not cover LTSS Limited coverage of skilled nursing facility and home
health for “post-acute” care
Medicaid: Covers LTSS but is a “safety net” Must meet income and asset criteria

When extensive services are needed, it can be costly
Nationwide average prices (in 2009) Nursing home (private room): $79,900 per year Assisted living: $38,000 per year Home care aide: $21 per hour (20 hrs/week =
$21,900 per year) Adult day services: $67 per day
Prices vary among, and within, locations
-5-
Source: The 2009 MetLife Market Survey of Nursing Home, Assisted Living, Adult Day Services, and Home Care Costs.

Medicaid and out-of-pocket are the main payers of LTSS
-6-
Medicaid ($119.0 billion)62%
Out-of-Pocket ($43.5 billion)
23%
Private Health and Long-Term Care Insurance
($22.3 billion)12%
Other Public ($6.2 billion)
3%
Total in 2008 = $191.1 billion Source: O’Shaughnessy 2010.

Medicare covers post-acute services (not LTSS)
Area of considerable confusion
Home health care benefit Emphasis on skilled nursing and therapy services Provides part-time or intermittent services Must be homebound & need periodic skilled nursing or therapy
Skilled nursing facility care benefit Covered after a 3-day hospital stay Must need daily skilled nursing or therapy service 100-day maximum
-7-

Many people go without needed LTSS
-8-
Unmet Need20%
Met Need80%
Among community adults who need LTSS
Source: Feder, Komisar & Friedland 2007; based on data from 1994-1997.

How LTSS is financed is important
Lack of insurance means people are at risk financially
Reliance on out-of-pocket and Medicaid affects access to care Determines whether and what types of care can be obtained
Affects supply Nursing home industry shaped by Medicaid
Results in fragmented and uncoordinated care
-9-

PRIVATE LONG-TERM CARE INSURANCE
-10-

Few people have private long-term care insurance
About 7 million people have private LTCI About 3% of people age 20+; about 10% of people age 65+
Most policies pay for home-based & nursing home care; some also cover assisted living & adult day
Price depends on features and age when first purchased
Typically sold as individual policies
-11-

-12-
Why is the private long-term care insurance market limited?
“Underwriting” means many people can’t purchase it One study estimated 28% of people age 65-69
Demand is low Consumer confusion, lack of knowledge Difficult to navigate individual market Expensive Concerns about stability of premiums and insurer,
benefit adequacy

Federal efforts to increase the number of purchasers Federal tax incentives, e.g.,
Itemized deduction of medical expenses, deduction for self-employed
Benefits exempt from taxation for qualified policies
Information: Own Your Future campaign and National Clearinghouse for Long-Term Care website
The Partnership for Long-Term Care program “Partnership” policyholders have a higher Medicaid asset eligibility
threshold after receiving their policy’s benefits
Have had little effect on number of purchasers
-13-

MEDICAID
-14-

Medicaid’s coverage of LTSS varies by state Benefits
Nursing home services: all states must provide Home and community based services (HCBS)
• Home health: all states must provide• Personal care: optional (30 states)• HCBS waivers: optional (all states use to varying degrees)
Eligibility Income and assets criteria; functional criteria
“Nursing home bias” in Medicaid
-15-

HCBS share of Medicaid LTSS spending has been growing
-16-
13% 24%43%
87% 76%57%
1990 1997 2008
Institutional Services
Home and Community Based Services
($30 billion) ($56 billion) ($106 billion)
Source: Burwell, Sredl & Eiken 2009. Years are fiscal years.
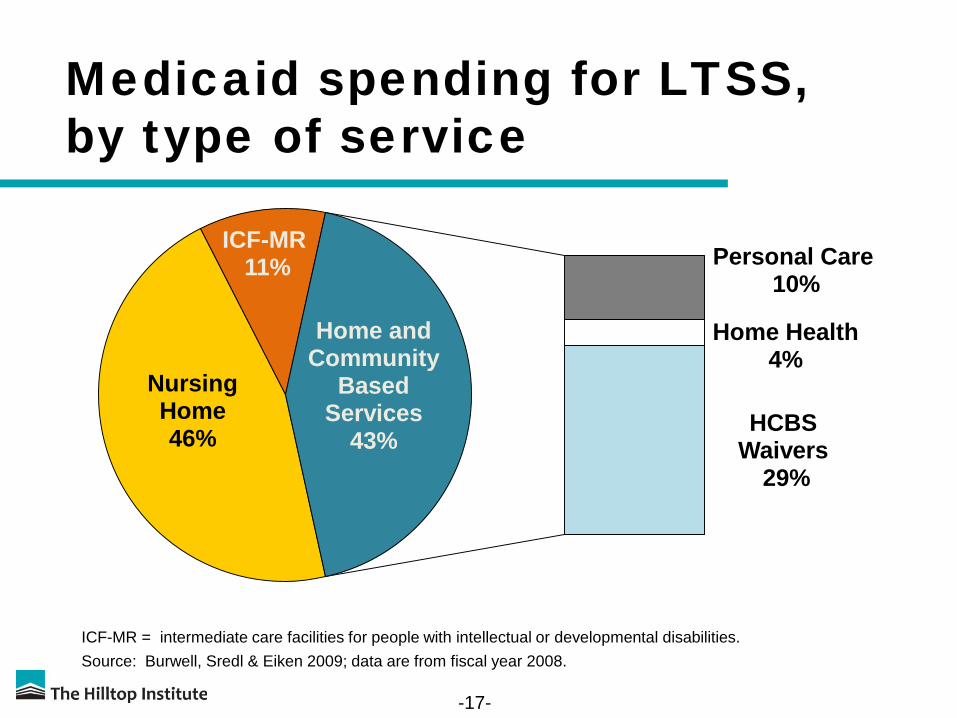
Medicaid spending for LTSS, by type of service
-17-
Nursing Home 46%
ICF-MR11% Personal Care
10%
Home Health4%
HCBS Waivers
29%
Home and Community
Based Services
43%
Source: Burwell, Sredl & Eiken 2009; data are from fiscal year 2008.ICF-MR = intermediate care facilities for people with intellectual or developmental disabilities.

Medicaid HCBS Waivers Account for most Medicaid HCBS spending
All states use, but vary greatly in extent, target populations
Allow states to provide range of services to individuals who meet state’s eligibility criteria for institutional care
Allow states to control waiver spending Can limit waiver enrollment, offer in specified geographic areas
Typically designed for target populations Older adults and people with disabilities (“aged and disabled”) People with intellectual or developmental disabilities (“MR/DD”) Other (e.g., HIV/AIDS, brain injury, mental illness, children)
-18-

Medicaid HCBS Waiver spending varies by enrollment groups
-19-
10% 7%
40%72%
50%
21%
Enrollees Spending
Older adults and people with disabilities
People with intellectual /developmental disabilities
Other
Source: Ng, Harrington & O’Malley 2009; data are from fiscal year 2007.

Medicaid LTSS programs vary widely among states
$2,478
$1,031
$508
$1,137
$383$145
$0
$1,000
$2,000
$3,000
All LTSS
Source: Feder, Komisar & Friedland 2007. Amounts shown are for fiscal year 2005.
Average of 5 Highest
States
Average of 5 Lowest
States
Average of 5 Highest
States
Average of 5 Lowest
States
U.S. Total
U.S. Total
Home and Community Based Services
Medicaid LTSS Spending per State Resident withIncome Below 200% of Poverty Level

Medicaid issues going forward
Continued interest in expanding HCBS Better “balance” between institutional services
and HCBS Consumer-directed care Health reform law provides new options and
financial incentives to states for expanding HCBS
Tight state budgets
-21-

-22-
Sources Burwell, B., Sredl, K., & and Eiken, S. (December 2009). Medicaid Long-Term
Care Expenditures in FY 2008. Thomson Reuters. http://www.hcbs.org/moreInfo.php/nb/doc/2793/Medicaid_Long_Term_Care_Expenditures_FY_2008
Feder, J., Komisar, H., & Friedland, R. (2007) Long-Term Care Financing: Policy Options for the Future. Georgetown University Long-Term Care Financing Project. http://ltc.georgetown.edu/papers.html
MetLife Mature Market Institute & LifePlans, Inc. (October 2009). The 2009 MetLife Market Survey of Nursing Home, Assisted Living, Adult Day Services, and Home Care Costs. http://www.metlife.com/assets/cao/mmi/publications/studies/mmi-market-survey-nursing-home-assisted-living.pdf

-23-
Sources continued
Ng, T., Harrington, C., & O’Malley, M. (November 2009). Medicaid Home and Community-Based Service Programs: Data Update. Kaiser Family Foundation. http://www.kff.org/medicaid/upload/7720-03.pdf
O’Shaughnessy, C. (April 2010). The Basics: National Spending for Long-Term Services and Supports (LTSS). National Health Policy Forum. http://www.nhpf.org/library/details.cfm/2783

-24-
About The Hilltop Institute
The Hilltop Institute at the University of Maryland,Baltimore County (UMBC) is a nationally recognizedresearch center dedicated to improving the health andsocial outcomes of vulnerable populations. Hilltopconducts research, analysis, and evaluation on behalf ofgovernment agencies, foundations, and other non-profitorganizations at the national, state, and local levels.
www.hilltopinstitute.org

-25-
Contact Information
Harriet L. Komisar, Ph.D.
Senior Research Analyst
The Hilltop Institute
University of Maryland, Baltimore County (UMBC)
410.455.6740
www.hilltopinstitute.org