long range forecasting: spring 2004 paul knight & rich grumm psu/nws univ park/state college pa
TRANSCRIPT

Long Range Forecasting:Spring 2004
Paul Knight & Rich Grumm
PSU/NWS
Univ Park/State College PA

Introduction
• The Great Tragedy of Science - the slaying of a beautiful hypothesis by an ugly fact
– T.H. Huxley (1825-95)
• Define Terms
• Overview of the Material
• Developing the Discipline

Defining Terms
• Extended Forecasting– a prediction of weather conditions for a period
extending beyond more than 3 days from issuance
• Medium Range Forecasting– a prediction of weather conditions for a period
extending from 3 to 7 days from issuance
• Long Range Forecasting– a prediction of weather conditions for a period
extending beyond more than 7 days from issuance - there is no limit how far beyond

AMS Statement on Extended Forecasting
• 1991– 6 to 10 days: some skill in mean temp and
precip relative to climatology (T better than P)– Monthly/Seasonal forecasts: slight skill in
mean temperature and precipitation departure; but no skill in day to day forecasts
• 2001– dramatic improvement in 1-2 seasons in
advance forecasts of temp and precip– still no day-to-day skill beyond 1-2 weeks
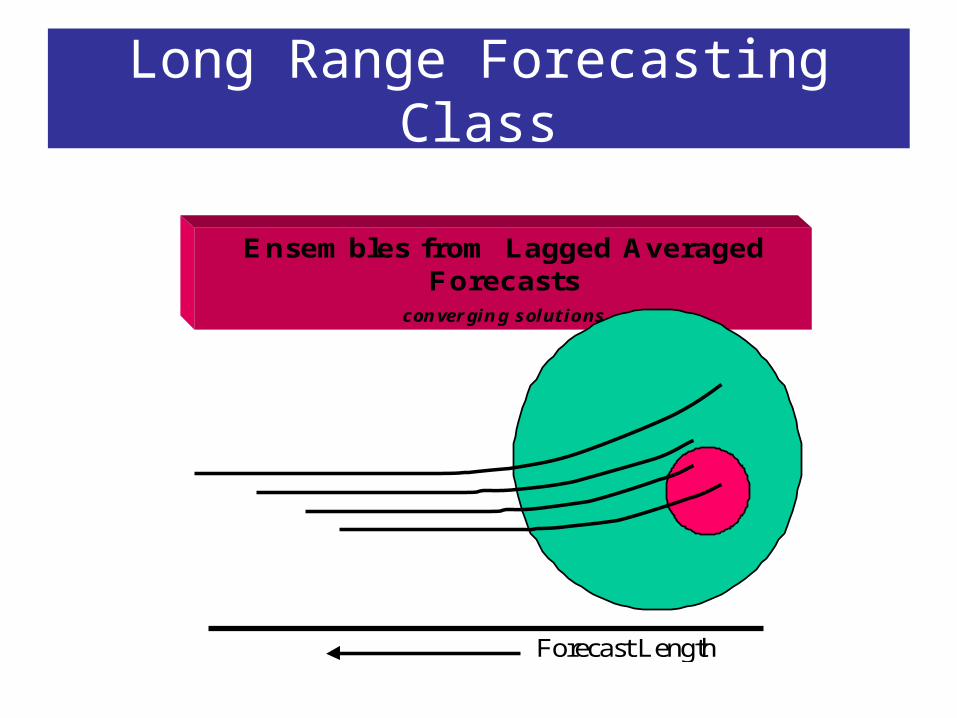
Long Range Forecasting Class
Ensembles from Lagged AveragedForecasts
converging solutions
Forecast Length

Long Range Forecasting Class
NWS-State College
PDO SST Examples
Figure 2 The warm phase (left) and cold phase (right) of the PDO. The warm phase is also known as a high NPO while the cold phase is also known as a low NPO. Similar to an El Nino event, note the warm water in the eastern Pacific.
NWS-State College
PDO values 1900-2000
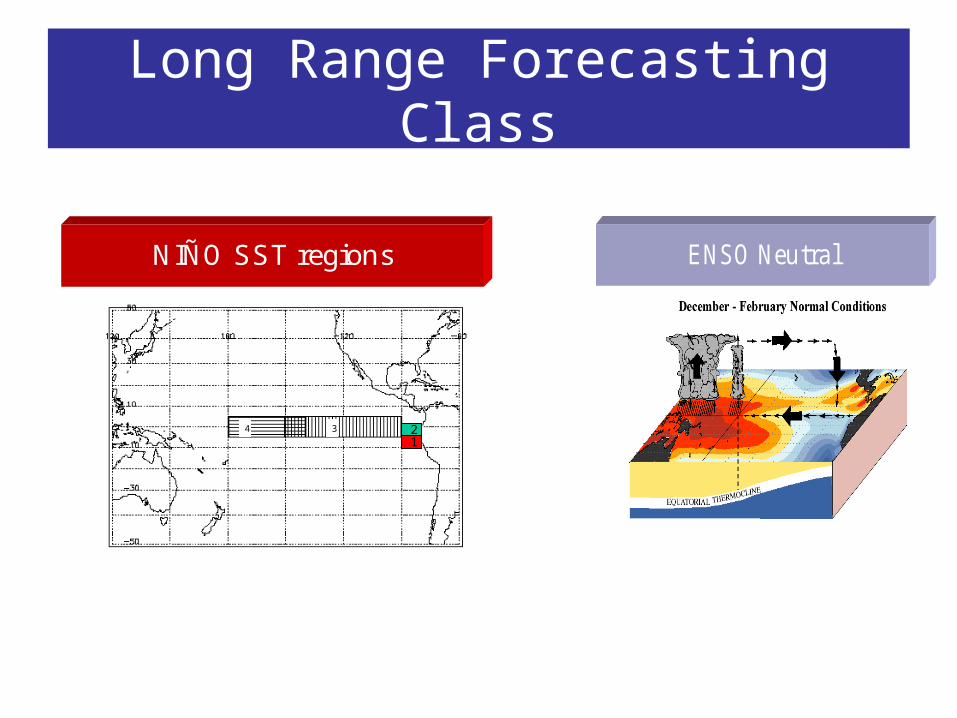
Long Range Forecasting Class
NIÑO SST regions
21
34
ENSO Neutral

Long Range Forecasting Class
The 3D view of MJO
• Axis of coupledconvection/suppressedconvection usuallybetween 5S-5N
• SST feedback couldbe sensitive enough toeither trigger or helppropagate the wave
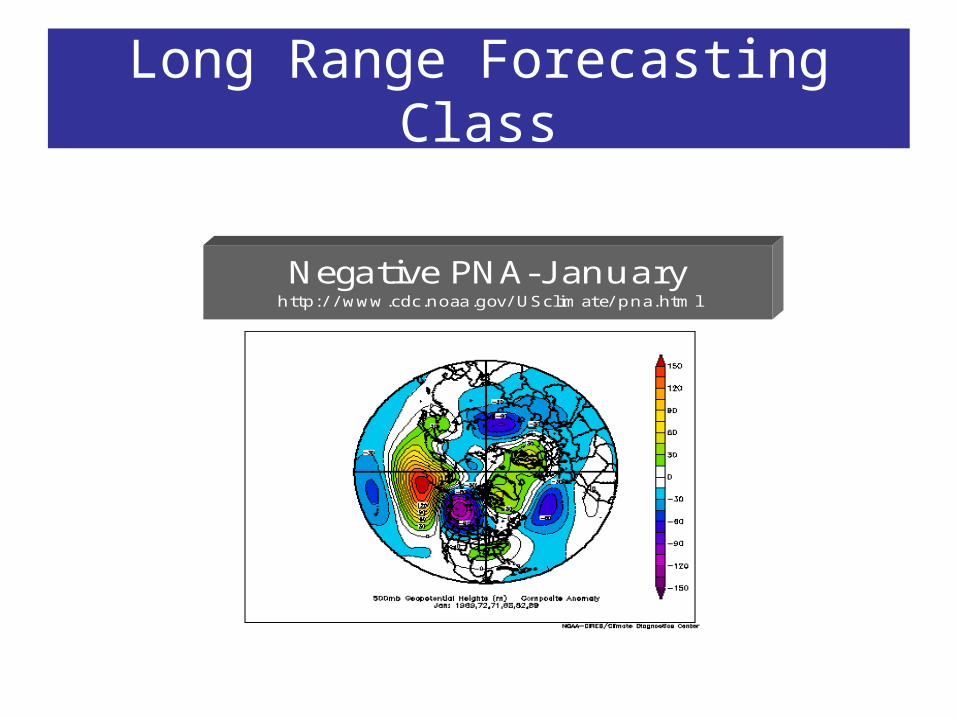
Long Range Forecasting Class
NWS-State College
Negative PNA-J anuaryhttp:/ / www.cdc.noaa.gov/ USclimate/ pna.html

Long Range Forecasting Class
NWS-State College
NAO-Negative Phase

Long Range Forecasting Class
NWS-State College
Low NAO Storm Example
NWS-State College
The Little Iceage begins• Colder weather began to dominate in 12th
century– 1309/ 10 Thames river freezes cold and dry weather
• tree rings were narrow suggesting cold and dry
• NAO < 0
– 1312 very wet failed wheat crops (NAO>0)– 1315 very wet for next 3 years
• extraordinary tree ring growth in Iceland and Ireland
• very wet
• lead to crop failures and the Great Famine– some countries lost 5-10% of population in large towns
– 1320 NAO went negative and ended famine periods andwetness-Record cold set in

Long Range Forecasting Class
Autocorrelation J A-FE-MA 01correlation point 40N/ 75W
PA Node
EuropeanNode
PacificNode
AntiNode

Long Range Forecasting Class
2002 Model Forecasts
l Sc ripps
l Plank
GCM Model Matters
l Grid Spac ing• dependent on
coordinatesystem for globe
• dependent oncomputer space
l Time Step• dependent on
resolution andlength of forecst
l Terrain andOcean Mapping• generally rough
with little detail
l Parameterize• solar radiation• convection• heat flux• wind stress

Long Range Forecasting Class
Annular ModeAnnular Mode
nn NAM averaged forNAM averaged forJan-Feb-Mar (high)Jan-Feb-Mar (high)
nn NAM averaged forNAM averaged forJan-Feb-Mar (low)Jan-Feb-Mar (low)
Blocking PatternsBlocking Patterns
nn Example of 500 Example of 500 mb mb flowflow

Long Range Forecasting Class

Secrets Revealed
• The Tropics (oceans) drive the changes in seasonal and annual conditions in the middle latitudes
• The myth of the perfect analog– While an enormous number of cases are
needed for ‘the perfect analog’, a substantial amount of useful information is available from a carefully selected few.
• The start of desktop LRF research (for regional/local connections)

Developing the Discipline
• Recent Past– What has been the trend?– Why has the trend changed?
• Current conditions– What are the most salient features?– Why is it happening?
• Forecast conditions– What do the dynamic and statistical models
show and why?

Past Conditions
Fall (Sept-Nov) 2003 Temperatures

Past Conditions
500 hPa anomalies for last 35 days

Past Conditions

Current Conditions

Current Conditions
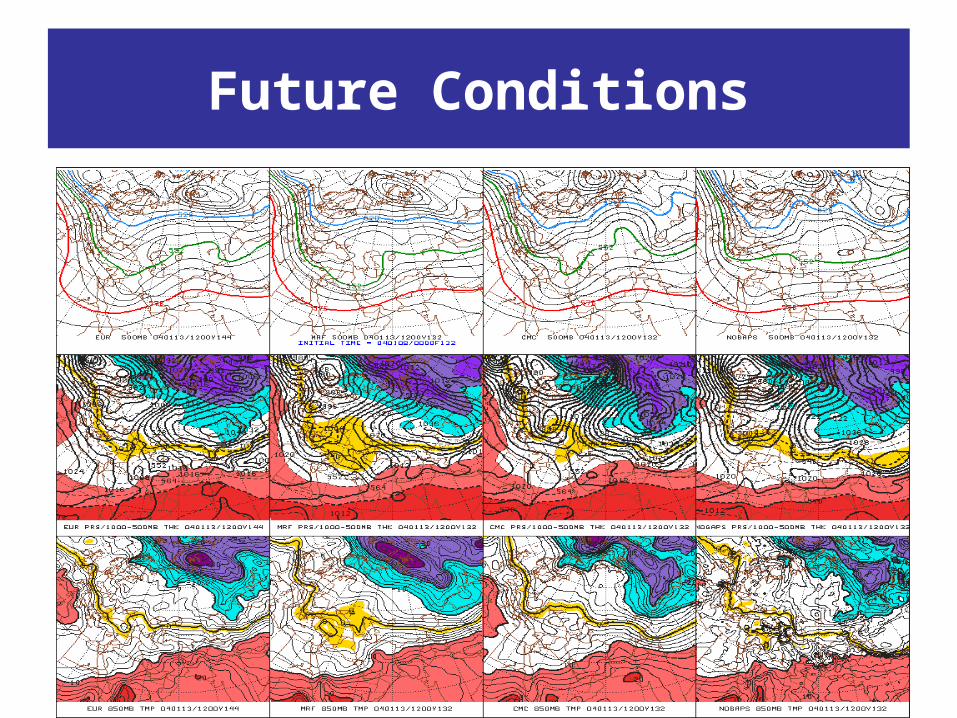
Future Conditions

Future Conditions

The Master Forecaster
• Seeks to learn what is going on– Diagnosis leads to understanding– Use remotely sensed and model data
• Seeks to understand what will happen– Medium range analysis tools integrating data
sets– Model tools to forecast at long range

Forecast Funnel Theory(traditional view)
• represents the scales of interaction: hemispheric, synoptic, mesoscale and local that influence the onset of and changes in weather events for a particular forecast area. These scale interactions establish a context for demonstrating and establishing essential forecasting skills.
• Forecasters spend more time on details near bottom of the funnel the local scale

COMET’s Funnel-Pyramid

(Updated) Forecast Funnel
• Consider forecast length (time) as well as scale
• Consider tools for both the scale and the time
• Forecaster time will be focused more on the details as the weather gets more interesting
• Sensible weather is local

Scales of Prediction
EnsemblesModels andClimatic Anomalies
Mesoscale Models and ensembles
Satellites
Satellites
Analysis
diagnosis
Radar
Analysis
S
C
A
L
E
Event TimeWeeks Days Hours
EnsemblesClimate (PNA/NAO)Climatic Anomalies
Mesoscale Models

References
Buroughs, W.J., 1992: Weather Cycles: Real or Imaginary? Cambridge University Press. ISBN 0 521 47869 3
Brooks, H.E, C. A. Doswell III, and R.A. Maddox, 1993: On the Use of Mesoscale and Cloud-Scale Models in Operational Forecasting. Wea. Fore.7, 7, 120-132.
URL’s:http://grads.iges.org/ellfb/Dec02/Pierce/fig1.gif
http://www.cdc.noaa.gov/HistData/http://opwx.db.erau.edu/~herbster/wx427/fcst_process.html
http://meted.ucar.edu/mesoprim/mesodefn/print.htm
http://www.atmos.colostate.edu/ao/Figures/Thompson_Wallace_Science2001/index.html
http://www.cpc.ncep.noaa.gov/products/tanal/accesspage.html
http://ingrid.ldeo.columbia.edu/maproom/Global
http://www.rap.ucar.edu/weather/surface/us_AFsnow.gif