loh & coghlan. domestic water use study
DESCRIPTION
lohTRANSCRIPT

Domest i cWater Use S tudy
In Per th , Western Austra l ia1998-2001
M i c h a e l L o h
Pe t e r C o g h l a n
M a r c h 2 0 0 3
Contents1 Background and Methodology 1
1.1 Introduct ion 11 .2 Methodology 2
1 .2 .1 Samples 31 .2 .2 Quest ionna i res 31 .2 .3 Water Usage 4
2 Sample Character ist ics 62.1 Occupancy Rate 62 .2 Ex-House Appl iances 62 .3 In-House Appl iances 7
2 .3 .1 Wash ing Mach ine 72 .3 .2 Shower 72 .3 .3 Toi let 82 .3 .4 Other In-house Appl iances 8
3 Total Water Usage 93.1 Annua l Char ge 93 .2 Month ly Usage 103.3 Dai ly Profi le 11
4 Ex-House Water Usage 144.1 S ing le Res ident ia l 14
4 .1 .1 Automat ic Ret icu lat ion System 154.1 .2 Houses wi th Bores 164 .1 .3 Ef fect of Lawn/Garden Area on Water Usage 16
4.2 Mult i -Res ident ia l 175 In-House Water Usage 19
5.1 Tota l In-House Usage 195.2 Component Usage 205.3 Appl iance Usage 21
5.3 .1 Shower 215.3 .2 Wash ing Mach ine 225.3 .3 Toi let 23
6 Some Trends s ince 1981/82 246.1 Appl iance Owner sh ip 246.2 Tota l Usage 256.3 Ex-House Usage 256.4 In-House Usage 26
7 Summar y of F indings 287.1 S ing le Res ident ia l Households 28
7 .1 .1 Tota l Water Usage 287.1 .2 Ex-house 297.1 .3 In-house 29
7.2 Mult i -Res ident ia l Households 307 .2 .1 Tota l Water Usage 307.2 .2 Ex-house 307.2 .3 In-house 31
6.3 F ina l Comment 31References 32Acknowledgement 33
D O M E S T I C W A T E R U S E S T U D Y

one
1.1 IntroductionThe Water Corporation of Western Australia supplies scheme water to approximately1.7 million people throughout the state of Western Australia of whom about 1.4 million livein Perth, the state capital. With a mediterranean climate, Perth’s weather is characterised bycool wet winters and hot dry summers. The average annual rainfall is 864 mm of which744 mm falls between May and October and only 36 mm in the summer months ofDecember, January and February. Most of the city lies on a coastal sand plain about 20 kmwide between the Indian Ocean and the Darling Range. Below the plain, groundwatersuitable for irrigation exists at depths varying from 2 m to 50 m and there are fewrestrictions in most areas to prevent householders sinking a bore for watering (garden, lawnand verge) purposes should they desire to supplement their scheme water supply.
In the 1999/00 financial year, Perth’s total demand for scheme water was 241 GL, distributedas shown in Figure 1.1. Domestic water usage accounts for approximately 70% of Perth’stotal demand, of which 62% is used by single residential dwellings and 8% by multi-residentialdwellings (e.g. townhouses, apartments and flats).
A good understanding of domestic water usage patterns and trends is essential for theCorporation to effectively plan for the present and future needs of its domestic and othercustomers. A detailed study of domestic water use in Perth was last undertaken in 1981/82,almost 20 years ago (Metropolitan Water Authority, 1985). In 1995 the Corporationcompleted the Perth Water Future Study (PWF) (Stokes et al., 1995) which committed theCorporation to a new Domestic Water Use Study (DWUS) that would provide a morecurrent understanding of domestic water use patterns and trends.
A further incentive to update knowledge of domestic water use came from the Water andRivers Commission (WRC), one of the Corporation’s regulators. The WRC is responsible forthe management and protection of Western Australia’s water resources which includesallocating available water resources to uses such as public water supply. WRC’s approval todevelop new sources would be subject to the Corporation implementing a mutuallyacceptable water use efficiency program which sets realistic savings targets.
More specifically, objectives of the new DWUS were to:
❖ collect data on household water usage;
❖ identify water use patterns and trends; and
❖ develop a demand forecasting model and a water use efficiency program at a later stage.
This report addresses the first two study objectives. It briefly describes the studymethodology, presents the more salient results of data analysis and summarises key findings.The information will be used by the Corporation to improve forecasting of future demandand develop water use efficiency programs that are soundly based.
1 Background and Methodology
I n P e r t h , W e s t e r n A u s t r a l i a 1 9 9 8 - 2 0 0 1
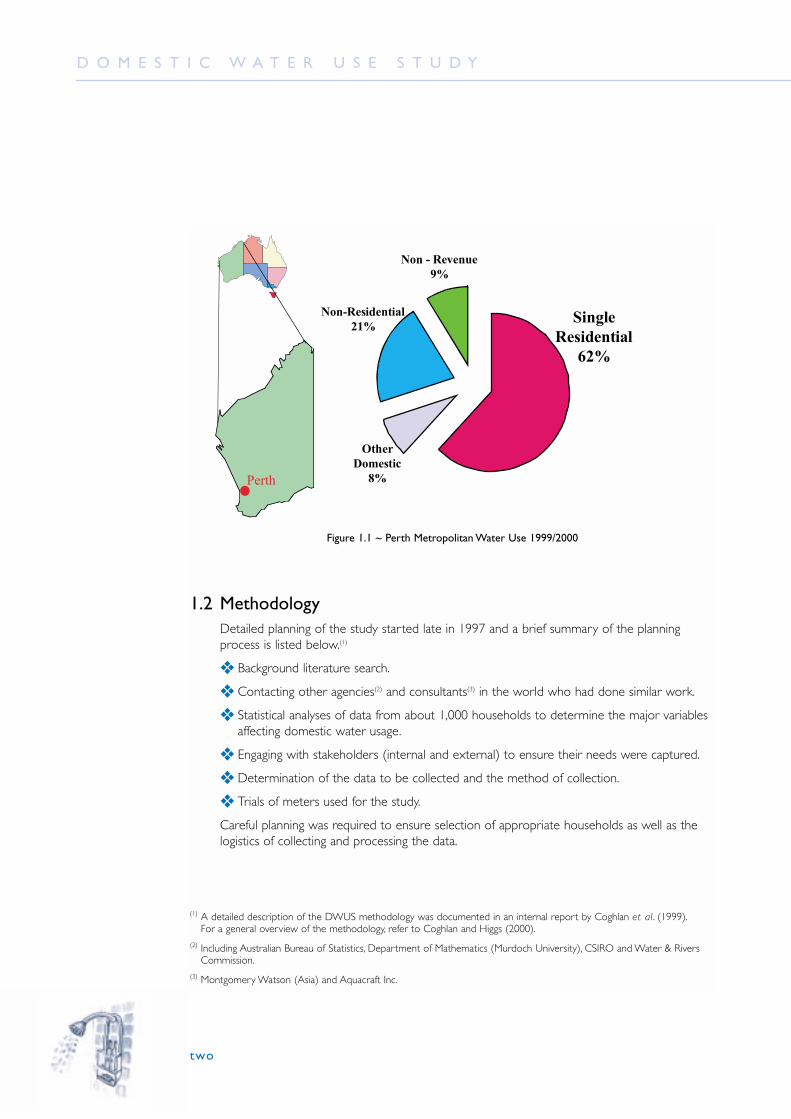
Figure 1.1 ~ Perth Metropolitan Water Use 1999/2000
1.2 MethodologyDetailed planning of the study started late in 1997 and a brief summary of the planningprocess is listed below.(1)
❖ Background literature search.
❖ Contacting other agencies(2) and consultants(3) in the world who had done similar work.
❖ Statistical analyses of data from about 1,000 households to determine the major variablesaffecting domestic water usage.
❖ Engaging with stakeholders (internal and external) to ensure their needs were captured.
❖ Determination of the data to be collected and the method of collection.
❖ Trials of meters used for the study.
Careful planning was required to ensure selection of appropriate households as well as thelogistics of collecting and processing the data.
two
D O M E S T I C W A T E R U S E S T U D Y
(1) A detailed description of the DWUS methodology was documented in an internal report by Coghlan et al. (1999).For a general overview of the methodology, refer to Coghlan and Higgs (2000).
(2) Including Australian Bureau of Statistics, Department of Mathematics (Murdoch University), CSIRO and Water & RiversCommission.
(3) Montgomery Watson (Asia) and Aquacraft Inc.

three
I n P e r t h , W e s t e r n A u s t r a l i a 1 9 9 8 - 2 0 0 1
1.2.1 Samples
A phased approach was adopted for the DWUS. Phase 1 included single residentialhouseholds, followed by Phase 2 which focused on multi-residential households.
In Phase 1, household data was collected from 720 volunteer households across the Perthmetropolitan area which comprised of:
❖ A Pilot Group of 120 households at which special metering equipment was installed tocontinuously monitor water use from November 1998 to June 2000.
❖ A Main Group of another 600 households at which total monthly water usage wasrecorded from November 1998 to February 2000.
All 720 households completed three questionnaire surveys covering demographics, applianceownership and attitudes to water use.
The Pilot Group consisted of 3 sub-samples of 40 households drawn from low, medium andhigh income locations. The Main Group was a stratified sample and is statisticallyrepresentative of the Perth metropolitan area. Data gathered from the Main Group wereused to help validate the Pilot Group data on key variables.
In Phase 2, household data were collected from 297 volunteer multi-residential households(4)
across the Perth metropolitan area which comprised of:
❖ A Pilot Group of 124 households(5) at which special metering equipment was installed tocontinuously monitor water use from September 2000 and November 2001.
❖ A Main Group of another 173 households which provided questionnaire data only.
Data from additional households in the Main Group were used to help validate the PilotGroup data on key variables.
1.2.2 Questionnaires
In Phase 1, data on household characteristics and attitudes were collected using threeseparate questionnaires. The first surveyed all 720 households at the time of recruitment andcovered ownership of water-using appliances and demographics. Two additional questionnairesurveys, one at the end of each of the two summer periods in the study time frame (i.e.1998/99 and 1999/00), covered attitudes to water use (CSIRO, 2002). All questionnaireswere designed with input from the Corporation and administered by CSIRO’s AustralianResearch Centre for Water in Society (ARCWIS).
In Phase 2, all multi-residential households were surveyed at the time of recruitment using aquestionnaire covering ownership of water-using appliances, water use patterns anddemographics. Again, ARCWIS assisted with survey design and conduct.
(4) These include duplexes, triplexes, townhouses/units in groups of more than 4 and some multi-storey residentialhouseholds.
(5) The pilot group is made up of 26 duplexes, 26 triplexes, 39 townhouses/apartments in a group of 4 to 10 and 33townhouses/flats/apartments in a group of more than 10.

four
1.2.3 Water Usage
All Pilot Group households had meters and data loggers (referred to as ‘smart’ meters)installed on their water services to continuously record water usage patterns. The ‘smart’metering set up is shown schematically in Figure 1.2 and pictorially in Figure 1.3. Existingservice meters at Main Group households (both Phases) were only read monthly byhouseholders.
All water usage data were stored on a data logger which was downloaded every six weeksand validated for timing, total usage and data quality. The data was then further processedusing special computer software called ‘Trace Wizard’(6) to a format suitable for analysis ofusage patterns.
Figure 1.2 ~ ‘Smart’ Metered Household
D O M E S T I C W A T E R U S E S T U D Y
(6) This program was developed by Aquacraft Inc. in the United States of America (www.aquacraft.com).

f ive
I n P e r t h , W e s t e r n A u s t r a l i a 1 9 9 8 - 2 0 0 1
Figure 1.3 ~ ‘Smart’ Meter Arrangement
s ix
2 Sample Character ist ics
D O M E S T I C W A T E R U S E S T U D Y
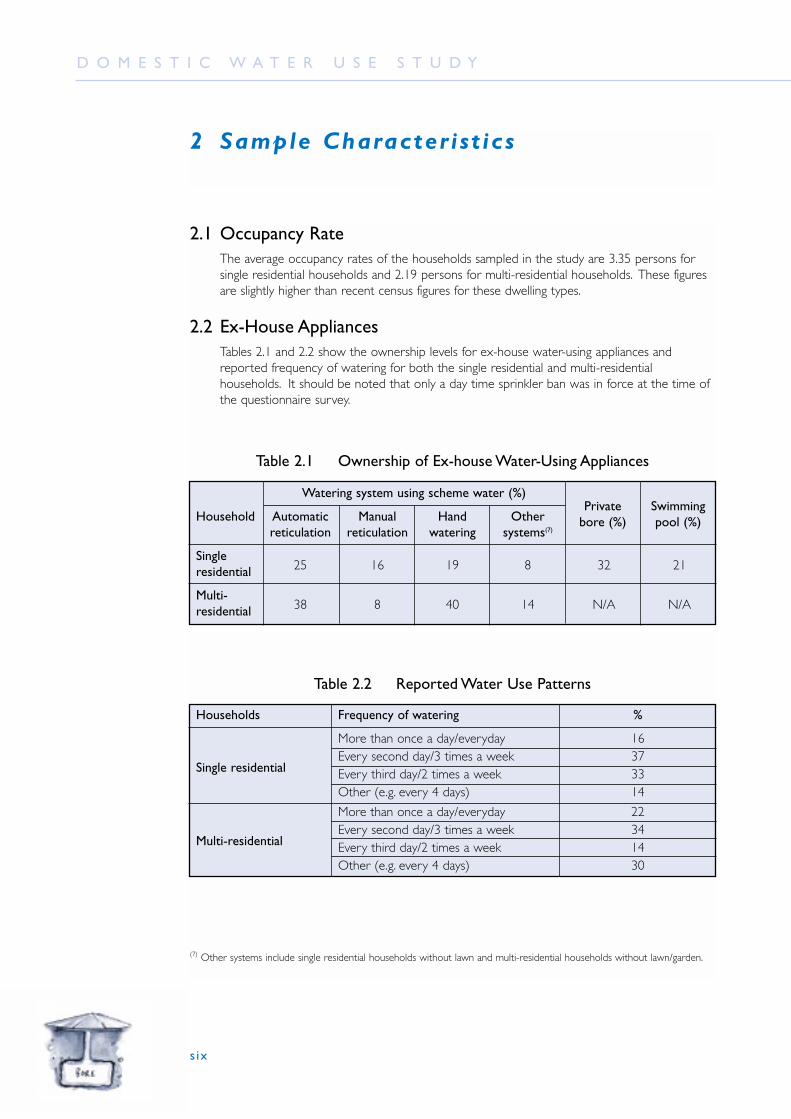
2.1 Occupancy RateThe average occupancy rates of the households sampled in the study are 3.35 persons forsingle residential households and 2.19 persons for multi-residential households. These figuresare slightly higher than recent census figures for these dwelling types.
2.2 Ex-House AppliancesTables 2.1 and 2.2 show the ownership levels for ex-house water-using appliances andreported frequency of watering for both the single residential and multi-residentialhouseholds. It should be noted that only a day time sprinkler ban was in force at the time ofthe questionnaire survey.
(7) Other systems include single residential households without lawn and multi-residential households without lawn/garden.
Table 2.1 Ownership of Ex-house Water-Using Appliances
Watering system using scheme water (%)
Household Automatic Manual Hand Otherreticulation reticulation watering systems(7)
Singleresidential 25 16 19 8 32 21
Multi-residential 38 8 40 14 N/A N/A
Privatebore (%)
Swimmingpool (%)
Table 2.2 Reported Water Use Patterns
Households Frequency of watering %
More than once a day/everyday 16Every second day/3 times a week 37
Single residential Every third day/2 times a week 33Other (e.g. every 4 days) 14
More than once a day/everyday 22Every second day/3 times a week 34
Multi-residential Every third day/2 times a week 14Other (e.g. every 4 days) 30

seven
I n P e r t h , W e s t e r n A u s t r a l i a 1 9 9 8 - 2 0 0 1
2.3 In-House Appliances2.3.1 Washing Machine
99% of single residential households owned a washing machine compared to only 92% formulti-residential households. 4% of the multi-residential households shared a communalwashing machine and the rest did not have a washing machine on site at all. Table 2.3summarises ownership levels and shows that automatic top loading washing machines are themost popular.
2.3.2 Shower
Ownership levels for the different types of shower are shown in Table 2.4. Difficulties inobtaining accurate information from householders on the efficiency rating of their showers(ie A, AA etc) meant that the only meaningful distinction between shower types was whetherone or more water-efficient showers (of any type) was owned or not.
(8) Includes owners who did not specify the type of washing machine owned.(9) Includes households which used a communal washing machine.(10) Mixed – households with more than one type of shower, e.g. one water efficient shower and one normal flow shower in
the same house
Table 2.3 Washing Machine Ownership
Type of residence Washing machine type %
Automatic top loader 85Automatic front loader 8
Single residential Twin tub/other types(8) 6No washing machine 1
Total 100Automatic top loader 80Automatic front loader 9
Multi-residential Twin tub/other types 3No washing machine(9) 8
Total 100
Table 2.4 Shower Ownership
Type of No of Normal Water- Mixed(10) Totalresidence showers flow (%) efficient (%) (%) (%)
1 37 16 0 53Single 2 26 8 8 42residential 3 or more 2 1 2 5
1 68 14 0 82Multi- 2 11 2 2 15residential 3 or more 2 1 1 4

eight
D O M E S T I C W A T E R U S E S T U D Y
2.3.3 Toilet
Table 2.5 shows ownership level of various toilet types. Owners were asked about thecapacity of their dual flush toilet cisterns(11) but many could not reliably identify the type(s) ofdual flush toilets installed in their houses. This identification problem was furthercompounded by the fact that some older dual flush toilets have 11/6 L capacity and thisoption was not specified in the questionnaire. For these reasons, no distinction has beenmade between the types of dual flush toilets installed.
The high ownership levels for dual flush toilets are a reflection of an amendment to By-Lawsin 1993, which made it compulsory for all new toilet cisterns installed after 1993 to be of the6/3 L dual flush type.
2.3.4 Other In-House Appliances
Ownership levels for dishwashers and evaporative air conditioners are shown below inTable 2.6.
(11) The capacity of the cisterns could either be 6/3 L or 9/4.5 L.(12) Mixed – households with more than one type of toilet.
Table 2.5 Toilet Ownership
Type of No of Single flush Dual flush Mixed(12) Totalresidence toilets (%) (%) (%) (%)
1 25 24 0 49Single 2 9 28 7 44residential 3 or more 1 4 2 7
1 12 43 0 55Multi- 2 5 34 0 39residential 3 or more 0 6 0 6
Table 2.6 Ownership of Other Appliances
Appliance Single residential Multi-residential
Dishwasher (%) 29 9
Evaporative24 34
air conditioner (%)
nine
I n P e r t h , W e s t e r n A u s t r a l i a 1 9 9 8 - 2 0 0 1
3 Total Water Usage
This section examines total water usage based mainly on data from pilot groups (both singleresidential and multi-residential) before reporting further on how this is used in-house andex-house.
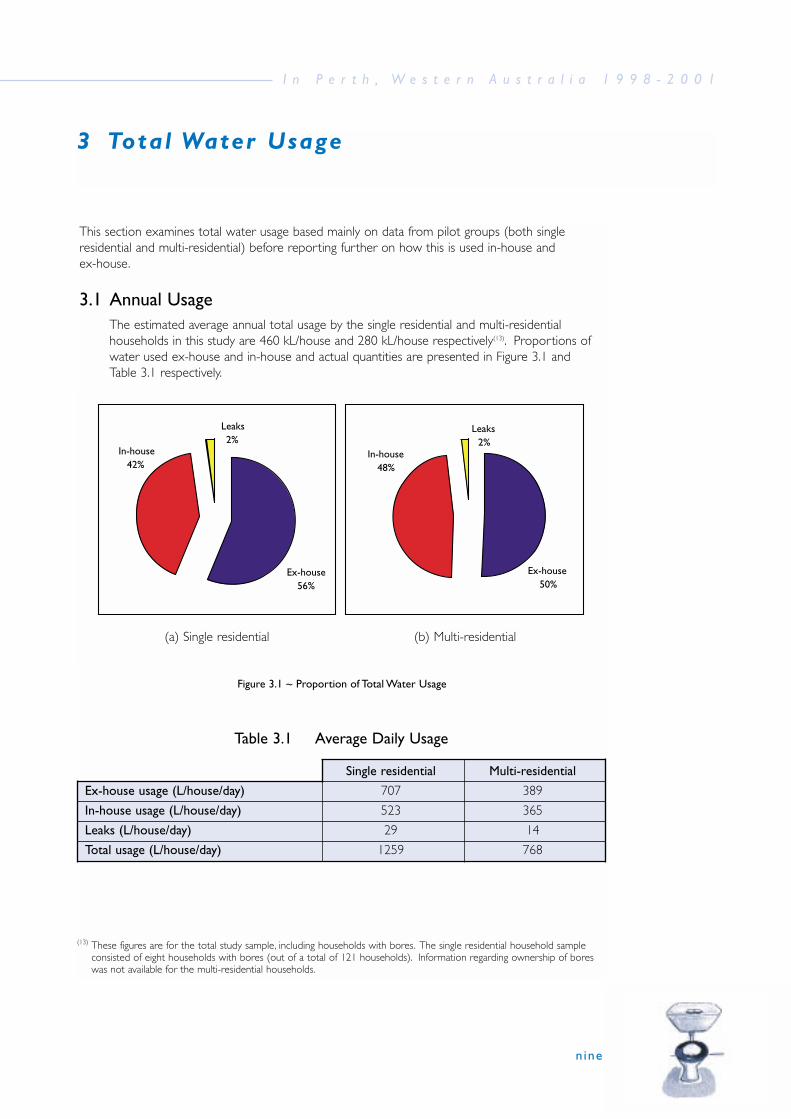
3.1 Annual UsageThe estimated average annual total usage by the single residential and multi-residentialhouseholds in this study are 460 kL/house and 280 kL/house respectively(13). Proportions ofwater used ex-house and in-house and actual quantities are presented in Figure 3.1 andTable 3.1 respectively.
Figure 3.1 ~ Proportion of Total Water Usage
(a) Single residential (b) Multi-residential
Table 3.1 Average Daily Usage
Single residential Multi-residential
Ex-house usage (L/house/day) 707 389
In-house usage (L/house/day) 523 365
Leaks (L/house/day) 29 14
Total usage (L/house/day) 1259 768
(13) These figures are for the total study sample, including households with bores. The single residential household sampleconsisted of eight households with bores (out of a total of 121 households). Information regarding ownership of boreswas not available for the multi-residential households.

ten
D O M E S T I C W A T E R U S E S T U D Y
3.2 Monthly UsageFigure 3.2 compares average monthly water usage by single residential and multi-residentialhouseholds. It is very clear that single residential households use more water compared tothe multi-residential households during summer months. This is most likely due to the largerareas of lawn and garden that single residential households maintain compared to multi-residential households.
During the winter months, average water usage of single residential household appears to behigher than that of the multi-residential households. However, on a per capita basis (seeSection 5.2) the usage is fairly similar.
Figure 3.2 ~ Average Monthly Usage for Single/Multi-residential Households
Figure 3.3 shows the average monthly water usage (L/house/day) for both single and multi-residential households. Single residential households were divided into high, medium and lowincome households.
Multi-residential households, on the other hand, were divided into multi-storey householdsand single storey households. It is difficult to locate multi-storey households with individualmeters because most have a master meter recording water usage for the entire complex.Therefore, only nine multi-storey households were recruited for this study. The water usageof these nine households was cross-checked using meter readings from households within thesame complex. Multi-storey households have been isolated from most of the sample andtheir water usage patterns reported on separately.

eleven
I n P e r t h , W e s t e r n A u s t r a l i a 1 9 9 8 - 2 0 0 1
For single residential households, there is a strong relationship between total usage and thesocio-economic level of the area in which a household is located. The usage patterns duringwinter are essentially the same for all three sub-groups but there is considerable variationbetween them during the summer months.This is also a strong indication that the sub-groupshave similar in-house usage patterns but very different ex-house demand patterns.
Less water is used by the multi-storey residential group, reflecting the fact that water usage bythese households is mainly in-house due to the absence of lawn/garden.(14) Water usage forthis group is further reduced by its lower average occupancy rate of 1.44 persons.
Figure 3.3 ~ Average Monthly Usage
3.3 Daily ProfileFigures 3.4 to 3.7 show the summer and winter daily profiles for total water usage. Therewas very little difference in the profiles for all the households during winter when most waterusage is in-house.
(14) The only exception is households located on the ground floor which may have a limited lawn/garden area.

twelve
D O M E S T I C W A T E R U S E S T U D Y
Figure 3.4 ~ Single Residential Summer Hourly Profile – Total Usage
Figure 3.5 ~ Multi-residential Summer Hourly Profile – Total Usage

th ir teen
I n P e r t h , W e s t e r n A u s t r a l i a 1 9 9 8 - 2 0 0 1
Figure 3.6 ~ Single Residential Winter Hourly Profile - Total Usage
Figure 3.7 ~ Multi-residential Winter Hourly Profile – Total Usage

four teen
4 Ex-House Water Usage
D O M E S T I C W A T E R U S E S T U D Y
Almost all ex-house water use is accounted for by lawn and garden watering, with a much smalleramount used for swimming pools (mainly for topping up purposes). Small tap uses have beenidentified but study methodology does not permit reliable identification as in-house or ex-houseusage. As it is likely that the vast majority of small tap uses would be in-house, they have all beenassigned to in-house usage.
For a multi-residential household, the average ex-house usage for watering only is 389 L/day (seeTable 3.1). Study methodology did not permit a reliable estimate of water usage by swimming poolsfor individual multi-residential households. If available to these households, swimming pools are, inalmost all cases, located in a common area. Such water use is normally through a separate andcommon water service to the whole complex which could not be monitored using the specialmeters developed for the study.
4.1 Single ResidentialOn average a single residential household used 707 L/day ex-house with 687 L/day(approximately 97%) used on the lawn and garden and 20 L/day (3%) for the swimming pool.
Figure 4.1 shows average daily ex-house usage by month for low, medium and high incomehouseholds. The decrease in usage for January was due to unseasonal rainfall of over100 mm.
Figure 4.1 ~ Single Residential Average Daily Ex-house Usage (by Month)

f i f teen
I n P e r t h , W e s t e r n A u s t r a l i a 1 9 9 8 - 2 0 0 1
Household income had a significant effect on ex-house water usage. High income householdstended to use more water ex-house than lower income households. Differences in ex-houseusage could also be due to ownership of automatic reticulation watering systems as higherincome areas are more likely to have these systems than low income areas.
4.1.1 Automatic Reticulation System
Table 4.1 shows the average daily ex-house water usage by month for single residentialhouseholds. It is clear that households with automatic reticulation systems used considerablymore water when compared with households with no automatic reticulation systems,particularly during summer. Figure 4.2 shows the average daily ex-house usage by month forhouseholds with and without automatic reticulation systems.
Figure 4.2 ~ Single Residential Ex-house Average Daily Scheme Water Usage (by month)
Table 4.1 Single Residential Average Ex-house Scheme Water Usage
Auto No automaticreticulation reticulation
Average usage1058 537(L/house/day)

s ixteen
D O M E S T I C W A T E R U S E S T U D Y
4.1.2 Houses with Bores
Figure 4.3 shows the scheme water usage by houses with and without bores. As would beexpected, houses with bores use less scheme water for watering purposes than houseswithout a bore. Higher income households are more likely to have a bore than low incomehouseholds. The influence of automatic reticulation systems on daily usages is again evident.
Figure 4.3 ~ Ex-house Scheme Water Usage For Houses With and Without Bores (Single Residential)
4.1.3 Effect of Lawn/Garden Area on Watering Usage
The irrigable area (garden, lawn and verge) of single residential households was estimatedfrom aerial photographs to ascertain if there is any relationship between the areas requiringwatering and water usage attributed to them. The relationship between water usage andirrigable area for the summer period (Dec. 1999 to Feb. 2000) is shown in Figure 4.4.
No strong relationship between irrigable area and ex-house water usage is evident.This was also the case when comparing houses with different income levels. A relationshipcould reasonably be expected if all households watered efficiently, so it is possible that manyhouseholds are following inefficient irrigation practices.

seventeen
I n P e r t h , W e s t e r n A u s t r a l i a 1 9 9 8 - 2 0 0 1
Figure 4.4 ~ Summer Watering Usage vs Irrigable Area
4.2 Multi-Residential
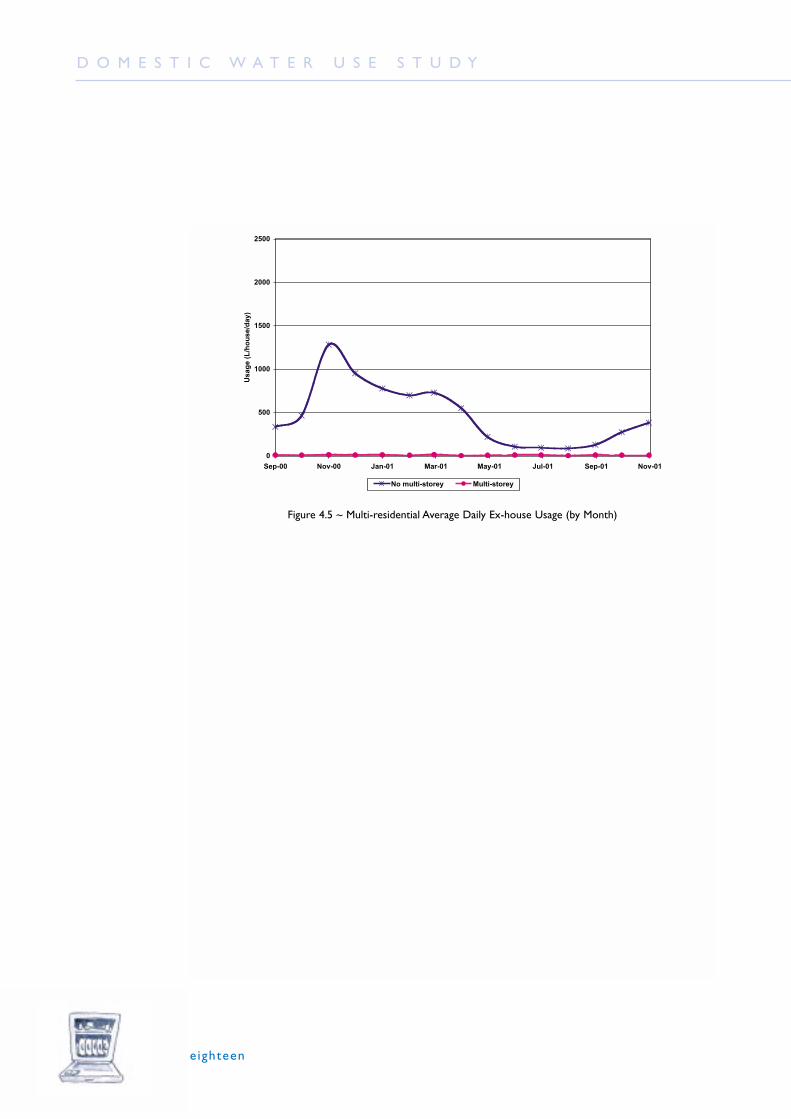
On average, a multi-residential household used 389 L/day ex-house for watering lawn andgarden.
Figure 4.5 shows the average monthly ex-house usage for multi-residential households withonly one storey and those with more than one storey. Ex-house water usage of the multi-storey households is close to zero. This is due to the fact that these households do not havea garden and any ex-house water usage is likely to be for minor uses such as watering pots.The ex-house water usage for multi-residential households was significantly lower than that ofthe single residential households. As with single residential households, seasonal variation inex-house water usage occurred for single storey multi-residential households.
Table 4.3 shows the average water usage for multi-residential households. As with singleresidential households, owners of an automatic reticulation system used considerably morewater ex-house than those without one.
Table 4.3 Multi-residential Average Ex-house Scheme Water Usage
Auto No automaticreticulation reticulation
Average usage515 279(L/house/day)
eighteen
D O M E S T I C W A T E R U S E S T U D Y
Figure 4.5 ~ Multi-residential Average Daily Ex-house Usage (by Month)

nineteen
I n P e r t h , W e s t e r n A u s t r a l i a 1 9 9 8 - 2 0 0 1
5 In-House Water Usage
This section describes the in-house water usage by the different household types.
5.1 Total In-House UsageFigure 5.1 shows the average monthly in-house usage for single residential andmulti-residential households while Figure 5.2 shows the average monthly in-house usagefor the different types of households.
Figure 5.1 ~ Average Daily In-house Usage (by Month)
Figure 5.2 ~ Average Daily In-house Usage for Different Household Types (by Month)

twenty
D O M E S T I C W A T E R U S E S T U D Y
It is evident from Figures 5.1 and 5.2 that there was very little seasonal variation in in-housewater usage. For single residential households, high income households had a slightly higherusage compared to all other household types with the difference increasing a little during thesummer period. This could be due to more frequent showering during summer and morefrequent use of evaporative air conditioning systems. As for multi-residential households, it isclear that multi-storey households used the least amount of water.
5.2 Component UsageSingle residential households used more water in-house than multi-residential households.Single residential households used an average of about 520 L/house/day whereas multi-residential households used an average of about 360 L/house/day. The split of thecomponents is as shown in Figure 5.3.
Figure 5.3 ~ Proportion of In-house Usage
In-house usage is highly dependent on the occupancy rates for the different household types.Given that the average occupancy rate for single residential households in this study is3.35 persons and 2.19 persons for the multi-residential households, the difference in waterusage is understandable.
(a) Single residential (b) Multi-residential

twenty-one
I n P e r t h , W e s t e r n A u s t r a l i a 1 9 9 8 - 2 0 0 1
Table 5.1 shows total individual appliance usage and per capita usage. Total in-house usage doesnot vary much on a per capita basis between household types. The main difference is that singleresidential households used more water for toilets than multi-residential households, possibly due tolower ownership levels of dual flush toilets in single households. Multi-residential households, onthe other hand, had more small tap usages with no apparent reason for this difference.
5.3 Appliance UsageOne of the objectives of the study was to investigate the potential savings of water-efficientappliances,(15) so consumption by individual in-house appliances was estimated.
5.3.1 Shower
Table 5.2 shows the water consumption for each type of shower i.e. conventional normal flowand water-efficient shower roses.
In the case of the normal flow showers, there is no significant difference between water usage(L/shower) by the residents in either single or multi-residential households.
There is no significant difference between shower durations for a normal flow or water-efficient shower rose. The average shower lasts about 7 minutes (ranging from 6.7 to7.3 minutes).
(15) For a preliminary investigation into water savings, refer to Loh et al. (2002).
Table 5.1 Per Capita In-house Usage
Single residential Multi-residential
Appliance L/house/day L/person/day L/house/day L/person/day
Bath and shower 171 51 121 55
Washing machine 139 42 94 43
Toilet 112 33 62 28
Tap 83 24 77 35
Other 18 5 11 5
Total in-house 523 155 365 166
twenty-two
D O M E S T I C W A T E R U S E S T U D Y
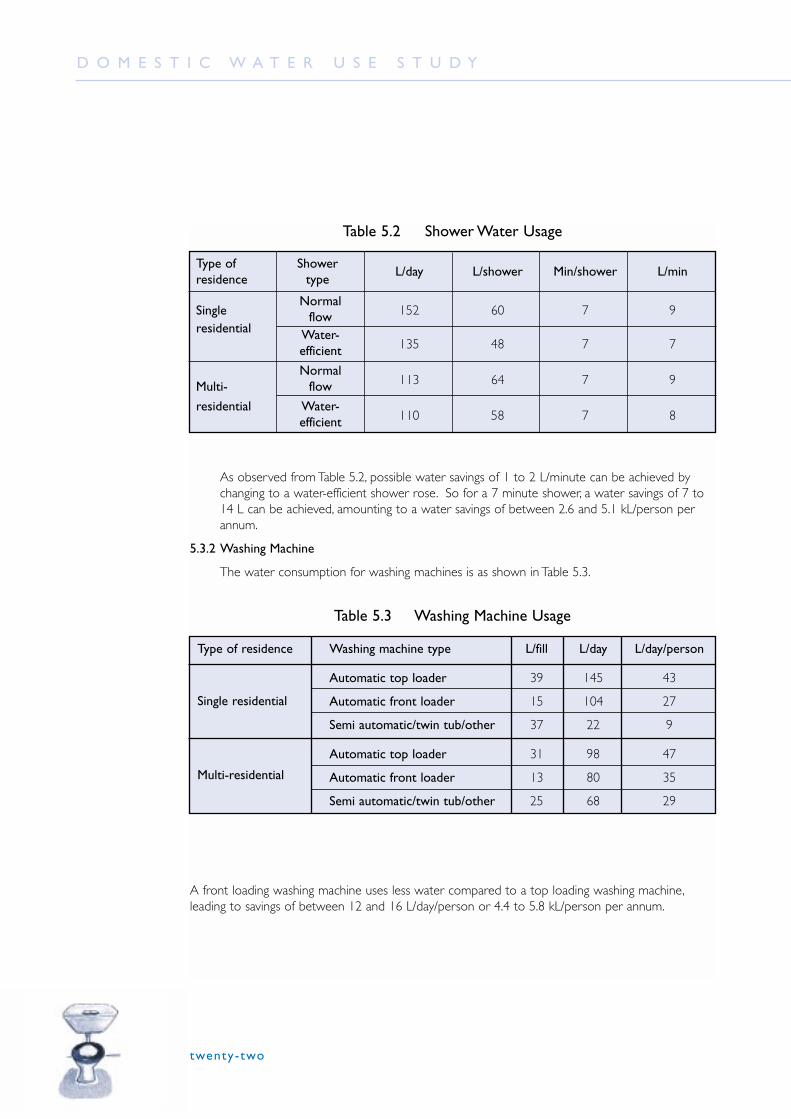
As observed from Table 5.2, possible water savings of 1 to 2 L/minute can be achieved bychanging to a water-efficient shower rose. So for a 7 minute shower, a water savings of 7 to14 L can be achieved, amounting to a water savings of between 2.6 and 5.1 kL/person perannum.
5.3.2 Washing Machine
The water consumption for washing machines is as shown in Table 5.3.
A front loading washing machine uses less water compared to a top loading washing machine,leading to savings of between 12 and 16 L/day/person or 4.4 to 5.8 kL/person per annum.
Table 5.3 Washing Machine Usage
Type of residence Washing machine type L/fill L/day L/day/person
Automatic top loader 39 145 43
Automatic front loader 15 104 27
Semi automatic/twin tub/other 37 22 9
Automatic top loader 31 98 47
Automatic front loader 13 80 35
Semi automatic/twin tub/other 25 68 29
Single residential
Multi-residential
Table 5.2 Shower Water Usage
Type of Shower L/day L/shower Min/shower L/min
residence type
Normal152 60 7 9Single flow
residential Water-135 48 7 7efficient
Normal113 64 7 9Multi- flow
residential Water-110 58 7 8efficient
twenty-three
I n P e r t h , W e s t e r n A u s t r a l i a 1 9 9 8 - 2 0 0 1
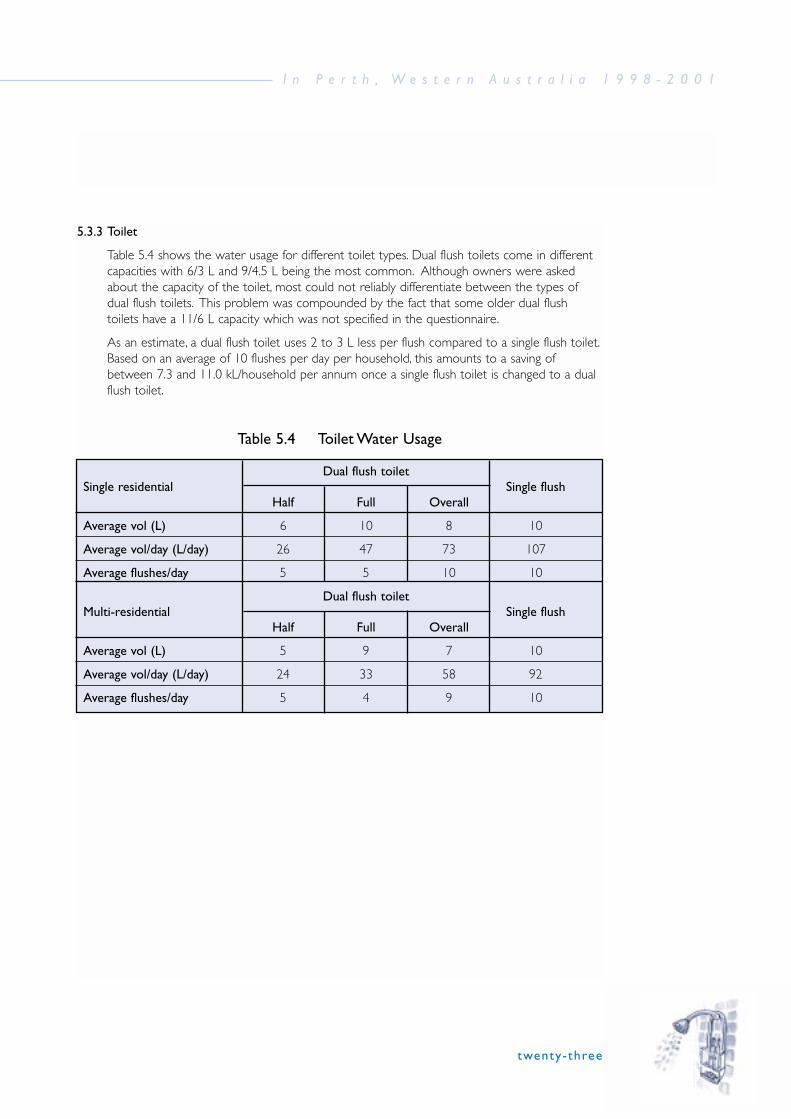
5.3.3 Toilet
Table 5.4 shows the water usage for different toilet types. Dual flush toilets come in differentcapacities with 6/3 L and 9/4.5 L being the most common. Although owners were askedabout the capacity of the toilet, most could not reliably differentiate between the types ofdual flush toilets. This problem was compounded by the fact that some older dual flushtoilets have a 11/6 L capacity which was not specified in the questionnaire.
As an estimate, a dual flush toilet uses 2 to 3 L less per flush compared to a single flush toilet.Based on an average of 10 flushes per day per household, this amounts to a saving ofbetween 7.3 and 11.0 kL/household per annum once a single flush toilet is changed to a dualflush toilet.
Table 5.4 Toilet Water Usage
Dual flush toiletSingle residential Single flush
Half Full Overall
Average vol (L) 6 10 8 10
Average vol/day (L/day) 26 47 73 107
Average flushes/day 5 5 10 10
Dual flush toiletMulti-residential Single flush
Half Full Overall
Average vol (L) 5 9 7 10
Average vol/day (L/day) 24 33 58 92
Average flushes/day 5 4 9 10

twenty- four
6 Some Trends s ince 1981/82
D O M E S T I C W A T E R U S E S T U D Y
As discussed earlier, a similar study was carried out in 1981/82. That study concentrated on singleresidential households, so the comparison here relates only to single residential households.
Rigorous comparison between the two studies is not possible due to different methodologiesadopted. Diaries were used to record water use activities in the 1981/82 study so there aresome differences in types of data collected (e.g. leaks and small tap usages ex-house). Since theseusages account for only a small part of total water usage, a valid comparison of many study resultscan still be made.
6.1 Appliance OwnershipTable 6.1 shows the main changes in appliance ownership since 1981/82.
Ownership levels for all main appliances have increased since 1981/82. In terms of impact onwater usage, the large increase in fixed reticulation systems is particularly relevant.
Table 6.1 Changes in Appliance Ownership
Ownership inAppliance
1981/82 (%) 1998/00 (%)
Private bore 27 32
Below ground pool 11 21
Fixed reticulation off mains (scheme water for watering) 5 41
Automatic reticulation off mains (scheme water for watering) 2 25
Two or more showers 19 47
One or more water efficient showers 0 35
Two or more toilets 22 51
One or more dual flush toilets 1 65
Automatic washing machine 64 93
Non-automatic washing machines 30 6
Dishwasher 13 29

twenty- f ive
I n P e r t h , W e s t e r n A u s t r a l i a 1 9 9 8 - 2 0 0 1
6.2 Total UsageThe total usage (L/house/day) for both studies is as shown in Table 6.2.
Total average water usage per single residential household has increased by about 55% since1981/82. In-house water usage has increased slightly, probably due to a slight increase inoccupancy rates for the study samples (an average of 3.07 persons/house for the 1981/82study compared to 3.35 persons/house for the 1998/00 study).
6.3 Ex-House UsageTable 6.3 shows that watering is the major component of ex-house water usage recorded bythe two studies. This component has more than doubled since the previous study due mainlyto the increased popularity of automatic reticulation and/or fixed sprinkler systems.
(16) This includes filling watering cans, washing hands etc. for the 1981/82 study. These were picked up by tap usages in the1998/00 study.
Table 6.2 Comparison of Water Use
1981/82 Study 1998/00 Study
Usage%
Usage%(L/house/day) (L/house/day)
Ex-house 342 42 707 56
In-house 473 58 523 42
Leaks Not available - 29 2
Total 815 100 1259 100
Table 6.3 Comparison of Ex-house Water Usage (L/house/day)
1981/82 Study 1998/00 Study
Usage%
Usage%(L/house/day) (L/house/day)
Watering 311 91 687 97
Swimming pool 13 4 20 3
Other(16) 18 5 0 0
Total 342 100 707 100

twenty-s ix
D O M E S T I C W A T E R U S E S T U D Y
The level of ownership of swimming pools has increased from 11% (from the 1981/82 Study)to 21% and the water usage has also increased from 13 L/house/day to 20L/house/day(17).Nevertheless, the water usage for swimming pools does not represent a significantproportion of ex-house water usage.
6.4 In-House UsageThe volume of in-house usage is heavily dependent on household size. Indeed, the onlysignificant influence on in-house usage is the number of people in the household.
As shown in Table 6.4, per capita in-house usage has remained constant since 1981/82 atabout 155 L/person/day. However, its components have changed as indicated.
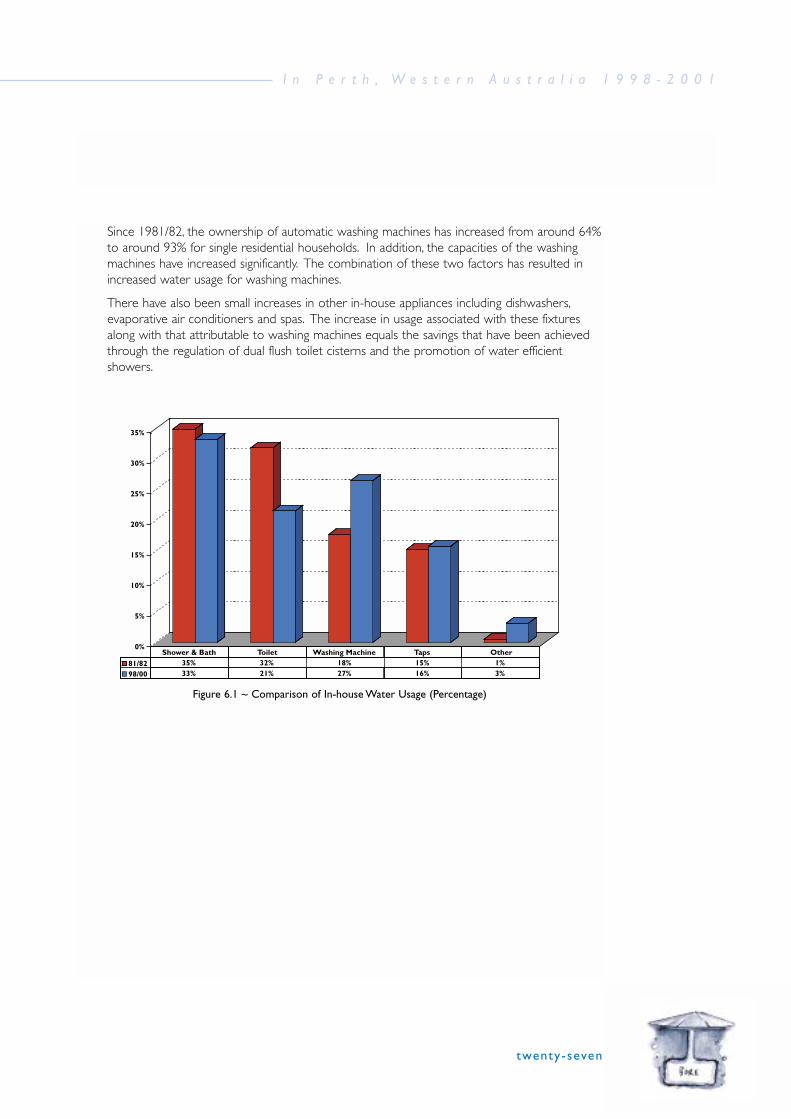
Figure 6.1 shows that the four major in-house appliances are the shower, washing machine,toilet and tap uses, accounting for 96% of total in-house usage. Since 1981/82, there havebeen significant changes in the distribution of in-house usage between these appliances.
The ownership level of dual flush toilets has increased from 1% in 1981/82 to 65% in1998/00 due to legislation making dual flush toilets compulsory for all new toilet installations.This has resulted in a significant drop in the proportion of total in-house water usage by thetoilet from 32% in 1981/82 to only 21% in 1998/00.
Concurrently, washing machine usage has increased from 18% to 26%. Bath usage hasdeclined considerably and shower usage has increased. However, the combined bath andshower component has remained fairly constant at around 32% - 35% of total in-house usage.
(17) Averaged over all study households.(18) Tap usage includes a small amount of usage outdoors, e.g. washing cars, washing hands etc.(19) ‘Other-in-house’ includes dishwashers, evaporative air conditioners and spas.
Table 6.4 Comparison of In-house Water Usage
Usage/house (L/day) Usage/person (L/day)Household appliance
1981/82 1998/00 1981/82 1998/00
Shower 143 167 47 50
Bath 21 4 7 1
Toilet 150 112 49 33
Washing machine 83 139 27 42
Taps(18) 72 83 23 24
Other in-house(19) 3 18 1 5
Total 472 523 154 155
twenty-seven
I n P e r t h , W e s t e r n A u s t r a l i a 1 9 9 8 - 2 0 0 1
Since 1981/82, the ownership of automatic washing machines has increased from around 64%to around 93% for single residential households. In addition, the capacities of the washingmachines have increased significantly. The combination of these two factors has resulted inincreased water usage for washing machines.
There have also been small increases in other in-house appliances including dishwashers,evaporative air conditioners and spas. The increase in usage associated with these fixturesalong with that attributable to washing machines equals the savings that have been achievedthrough the regulation of dual flush toilet cisterns and the promotion of water efficientshowers.
Figure 6.1 ~ Comparison of In-house Water Usage (Percentage)

twenty-e ight
7 Summar y of F indings
D O M E S T I C W A T E R U S E S T U D Y
This section summarises the main findings of this study.
7.1 Single Residential Households7.1.1 Total Water Usage
❖ The domestic sector accounts for about 70% of Perth’s total demand.
❖ The rate of water usage during the winter period was essentially the same for all singleresidential households but higher income households use more water during summer.
❖ The average total usage per household was:
L/house/day % total use
Ex-house 707 56
In-house 523 42
Leaks 29 2
Total 1259 100
❖ The component usage per household is set out below:
Single Residential Household Water Usage
twenty-n ine
I n P e r t h , W e s t e r n A u s t r a l i a 1 9 9 8 - 2 0 0 1
7.1.2 Ex-house
❖ Estimated average ex-house water usage was 707 L/house/day which includes 687L/house/day for watering and 20 L/house/day for the swimming pool.
❖ Private bore ownership/access has increased from 27% in 1981 to 32% in 1998 – anincrease of only 5%.
❖ Ownership of reticulation systems off the mains has increased considerably from only 5%in 1981 to over 41% in 1998. About 25% of households own a fully automatic system.
❖ A major influence on ex-house water usage is ownership of an automatic reticulationsystem or a bore.
❖ No strong relationship was established between irrigable area (ie lawn, garden and verge)and total ex-house water usage. Such a relationship could be reasonably expected so it islikely that many householders are watering inefficiently.
❖ Higher income households use more water with almost all of this used ex-house.
❖ Households with an automatic reticulation system used an average of 1058 L/house/daywhile households without an automatic reticulation system used an average of 537L/house/day.
7.1.3 In-house
❖ Per capita usage at about 155L/person/day has remained about the same since 1981.
❖ Toilet usage has decreased from 32% to 21% of in-house usage due to increasedownership of dual flush toilets (from 1% in 1981/82 to 65% in 1998/00).
❖ Washing machine usage has increased from 18% to 27%. This is due to the increase in theownership of automatic washing machines (from 64% to 93%) and in their capacity since1981/82.
❖ There have been small increases in the ownership levels of other in-house appliancesincluding dishwashers, evaporative air conditioners and spas.
❖ The increase in usage associated with these fixtures along with that attributable to washingmachines equals the savings that have been achieved through the regulation of dual flushtoilet cisterns.
❖ Average component usages for in-house use per household were:
Component L/house/day % in-house % total use L/person/day
Bath and shower 171 33 14 51
Washing machine 139 27 11 42
Toilet 112 21 9 33
Tap 83 16 7 24
Other 18 3 1 5
Total in-house 523 100 42 155

th ir ty
D O M E S T I C W A T E R U S E S T U D Y
7.2 Multi-Residential Households7.2.1 Total Water Usage
❖ There is no seasonal variation for multi-storey residential households, indicating that waterusage is mainly in-house.
❖ Multi-residential households use less water compared to single residential households.
❖ The average total usage per household was:
L/house/day % total use
Ex-house 389 51
In-house 365 47
Leaks 14 2
Total 768 100
❖ The component usage per household is as follows:
7.2.2 Ex-house
❖ Estimated average ex-house water usage was 389 L/house/day for watering only.
❖ Ex-house usage of multi-storey households was negligible.
❖ Households with automatic reticulation systems used an average of 515 L/house/daywhereas households without automatic reticulation system used an average of 279L/house/day.
Multi-residential Household Water Usage
th ir ty-one
I n P e r t h , W e s t e r n A u s t r a l i a 1 9 9 8 - 2 0 0 1
7.2.3 In-house
❖ Per capita usage is 166 L/person/day, which was not significantly different from that of singleresidential households.
❖ Bath and shower were the main water users in-house.
❖ Average component usages for in-house use per household were:
Component L/house/day % in-house % total use L/person/day
Bath and shower 121 33 16 55
Washing machine 94 26 12 43
Toilet 62 17 8 28
Tap 77 21 10 35
Other 11 3 1 5
Total in-house 365 100 47 166
7.3 Final CommentIt should be noted that a permanent daytime sprinkler ban (i.e. no watering between 9amand 6 pm) has been in place since 1 November 1994 in Perth and areas supplied by theintegrated water supply system. Further, water restrictions limiting sprinkler uses to two daysper week between 6 pm and 9 am were introduced in September 2001 to reduce theoutside water use of Perth domestic customers. These restrictions remain in place at thetime of publication of this report.
The State Government of Western Australia has released a State Water Strategy (2003).One of the aims of this widely publicised strategy is to improve water use efficiencythroughout the state of Western Australia. Assuming community support in the adoption ofvarious water conservation measures, the domestic water use patterns presented in thisreport are expected to change. For instance, the public has been offered attractive financialrebates to install water efficient shower heads, AAAA rated (or better) washing machines,rainwater tanks and garden bores. Ultimately, much will depend on community attitudes anda massive education campaign may be necessary to promote responsible water usagebehaviour in order to ensure a sustainable water future.

th ir ty-two
References
D O M E S T I C W A T E R U S E S T U D Y
Coghlan, P., Forrest, R., Higgs, C., Manning, P., Legerstee, C. and Vanderwal, P. (1999) ‘Domestic WaterUse Study Phase 1, Stage 1 – Methodology and Study Plan’ Infrastructure Planning Branch ReportA4-902, Internal Confidential Report,Water Corporation, Perth, Australia
Coghlan, P and Higgs, C. (2000) ‘Domestic Water Use Study’ Proceed ings , Hydro 2000 , 3rdInternational Hydrology and Water Resources Symposium of the IE Aust, Perth,Western Australia,Australia,Vol.1, 141-146
CSIRO (2002) ‘Perth Domestic Water-Use Study: Household Appliance Ownership andCommunity Attitudinal Analysis 1999-2000 ’ CSIRO Urban Water Program
Government of Western Australia (2003) ‘A State Water Strategy for Western Australia ’
Loh, M., Gould, L., Coghlan, P., Jeevaraj, C. and Hughes, G (2002) ‘Domestic Water Use Study – TheNext Step Forward’ 27th Hydrology and Water Resources Symposium, Melbourne,Victoria,Australia
Metropolitan Water Authority (1985) ‘Domestic Water Use in Perth, Western Australia’Metropolitan Water Authority, Perth, Australia
Stokes, R.A., Beckwith, J.A., Pound, I.R., Stone, R.R., Coghlan, P.C., & Ng, R. (1995) ‘Perth’s WaterFuture, A Water Strategy for Perth and Mandurah to 2021 ’Water Authority of WesternAustralia, Publication No WP214.

Acknowledgement
The authors take this oppor tunity to express theirs incere thanks to Sharon Master ; Graeme Hughes;Richard For rest ; Paul Taylor ; David Bur ton; LynneGould; Asset Monitor ing Ser vices of the Corporation;Land Development Branch of the Corporation;Austral ian Research Centre for Water in Society(ARCWIS) of CSIRO and many others who took par tin this study and without whose assistance this repor twould not have been possible .
A special vote of thanks is extended to al l thehouseholders whose patience, co-operation and effor tprovided the Corporation with the necessar yinformation to enable a better understanding ofdomestic water use in Per th.
I n P e r t h , W e s t e r n A u s t r a l i a 1 9 9 8 - 2 0 0 1
th ir ty-three

ISBN 1 74043 1235 March 2003
www.watercorporation.com.au