logistic regression and multiple classification analyses ... regression and multiple classification...
TRANSCRIPT

Research Article
Proceedings of the Pakistan Academy of Sciences: Pakistan Academy of SciencesB. Life and Environmental Sciences 53 (1): 21–34 (2016)Copyright © Pakistan Academy of SciencesISSN: 0377 - 2969 (print), 2306 - 1448 (online)
Logistic Regression and Multiple Classification Analyses to ExploreRisk Factors of Under-5 Mortality in Bangladesh
Kakoli Rani Bhowmik*, and Sabina Islam Shahjalal University of Science & Technology, Sylhet, Banglasesh
Abstract: Logistic regression (LR) analysis is the most common statistical methodology to find outthe determinants of childhood mortality. However, the significant predictors cannot be rankedaccording to their influence on the response variable. Multiple classification (MC) analysis can beapplied to identify the significant predictors with a priority index which helps to rank the predictors.The main objective of the study is to find the socio-demographic determinants of childhood mortalityat neonatal, post-neonatal, and post-infant period by fitting LR model as well as to rank those throughMC analysis. The study is conducted using the data of Bangladesh Demographic and Health Survey2007 where birth and death information of children were collected from their mothers. Threedichotomous response variables are constructed from children age at death to fit the LR and MCmodels. Socio-economic and demographic variables significantly associated with the responsevariables separately are considered in LR and MC analyses. Both the LR and MC models identified thesame significant predictors for specific childhood mortality. For both the neonatal and child mortality,biological factors of children, regional settings, and parents’ socio-economic status are found as 1st,2nd, and 3rd significant groups of predictors respectively. Mother’s education and household’senvironment are detected as major significant predictors of post-neonatal mortality. This study showsthat MC analysis with or without LR analysis can be applied to detect determinants with rank whichhelp the policy makers taking initiatives on a priority basis.
Keywords: Neonatal, post-neonatal, & child mortality; logistic regression analysis; multipleclassification analysis; priority index
1. BACKGROUND
Childhood mortality known as under-5 mortality isa worldwide problem particularly in thedeveloping countries. Though much improvementhas been achieved to meet the fourth MillenniumDevelopment Goal (MDG) regarding worldwidechild mortality (reduce two-thirds during 1990 to2015), still now a large number of children (about 6.9 million in 2011) are failing to survive untiltheir fifth birthday [1]. The scenario is very worsein the low-income countries (50 per 1000 children)specifically in Sub-Saharan Africa (92 per 1000children) and Southern Asia (67 per 1000children). In Bangladesh under-5 child mortalityrate also declined to about 53 in 2007/11 from 146
in 1990/91 through successful programs forimmunization, control of diarrhoeal diseases andvitamin A supplementation [2]. This achievementindicates partial fulfillment of the MDG (48 per1000 by 2015). Though the overall rate has beendeclined, major vulnerable groups among thepopulation are still needed to address. Theresearches indicate that the disparities betweenpoor and rich households have significantrelationship with the rate of child vulnerability indeveloping countries [3]. The children from thepoorest households have about three times morerisk to die than those from the richest households.Thus identifying the risk factors behind the earlychildhood death is still an important area ofresearch.
————————————————Received, April 2015; Accepted, March 2016 *Corresponding author: Kakoli Rani Bhowmik; Email: [email protected]
22 Kakoli Rani Bhowmik & Sabina Islam
A number of studies have been done to find the associated factors of early childhood mortality in many countries as well as in Bangladesh [4-9]. Socio-economic, demographic, environmental, and maternal & child health care variables are found to have significant impact on early childhood mortality. To find out the influencing predictors on childhood mortality, generally exploratory and LR analyses have been used in most of the studies [9-11]. Exploratory analysis does not permit for quantification or testing the strength of inter-relationship between two variables. In contrast, LR analysis is employed to examine the association of all the selected explanatory variables with the dependent variable simultaneously. However, it is not possible to identify which predictor is the most effective one among the significant predictors. In another way, it can be said that the significant variables cannot be ranked according to their influence on the dependent variable in LR analysis. The significant variables can be ranked according to their contribution in the variation of the study variable applying multiple classifications (MC) analysis [12]. Moreover, the MC analysis can be done for both nominal and interval scale dependent variables while LR analysis for nominal variables.
The MC analysis provides how much variation of the target variable is explained by a predictor included in the regression model and hence provides an assessment of the importance of the predictors. In another way, the degree of relationship between a predictor variable and the dependent variable as well as predictive power of the predictor variable can be assessed by MC analysis. It shows both bivariate (without presence of other predictors) and multivariate relationships (with presence of other predictors) between the predictors and the dependent variable. While in LR analysis separate analyses are required to obtain such relationships. Thus MC analysis is an additive model with wider range of application than the linear and the generalized linear regression model. The aim of the study is not only to find out the significant predictors but also to observe their predictive power to read the variation in the childhood mortality in Bangladesh
through both LR and MC analyses. The article is organized as: LR and MC analyses are discussed in Section 2; description of the data obtained from Bangladesh Demographic and Health Survey (BDHS) 2007 is given in Section 3; results of the LR and MC models are described in Section 4 and the conclusion is made in Section 5.
2. LOGISTIC REGRESSION AND MULTIPLE CLASSIFICATION ANALYSES
In this study binary logistic regression (LR) model has been developed to find the significant predictors of childhood mortality, while MC model helps to rank those significant predictors according to their priority on explaining the variation of the response variable.
2.1 Logistic Regression Analysis
Logistic regression analysis is conducted to find a relationship between a categorical response variable and one or more explanatory variables. The analysis helps to determine the predictor variables significantly associated with the dependent variable with exact significance level. Here the conditional probability 1=iY given
ii xX = is expressed as ( )Pr 1|i i i iP Y X x= = = =
( ) ( )( )exp 1 expT Ti ix xβ β+ and that of 0=iY as
( ) ( )( )βTiiiii xxXYP exp11|0Pr1 +====− where
iY is the dichotomous variable having values 1 for success (say a child dies before his/her 1st birth day) and 0 for failure (the child is still alive), ix is a vector of independent variables and β is a vector of unknown parameters. Then the odds and the log of odds being success are respectively
)(1
βTixe
pipi =
−and βT
ixpi
pi =
−1
ln . (1)
This equation for the log of odds is known as LR model. For a binary explanatory variable, odds ratio (OR) can be easily calculated by taking the exponential of the corresponding regression coefficient ( )βe which helps to interpret the probability of being success for a target group compared to a reference group. It is noted that an OR greater than 1.0 suggests more possibility to

Logistic Regression and Multiple Classification of Under-5 Mortality in Bangladesh 23
occur, while an OR less than 1.00 indicates a decreased likelihood compared to the reference category. Maximum likelihood method with a suitable iterative process such as Newton’s method is used to estimate the regression coefficients [13]. The Hosmer-Lemeshow (H-L) test is done for assessing the goodness of fit of the fitted LR model [14]. To assess the significance of an individual predictor, several tests such as likelihood ratio, Wald, and score tests are recognized in LR theory [13]. These tests are asymptotically equivalent [14]. The binary LR model is extended to multinomial and ordinal LR models when the dependent variables are measured in nominal scale (more than two categories) and ordinal scale [15].
2.2 Multiple Classification Analysis
The MC analysis is a multivariate technique for assessing the interrelationship of some explanatory variables with a response variable through an additive model. MC analysis determines the effect of each predictor before and after adjustments for its inter-correlations with other predictors included in the additive regression model. The MC analysis technique can be considered as a multiple regression analysis where the explanatory variables are dummy variables [16-17]. Unlike simple multivariate methods, MC analysis can handle explanatory variables measured on nominal scale and any form of interrelationships between the explanatory variables and the response variable. However, dependent variable is required to be measured on an interval scale without extreme skewness or to be a dichotomous variable without extremely unequal occurrences. The predictor variables can be measured on nominal scale (categories), ordinal scale (ranking), and interval scale (classes of numerical variable).
In MC analysis approach, each subgroup of an independent variable is transmitted into a dummy variable depending on whether the case falls or not in that particular subgroup. The MC model assigns a coefficient to each category of each predictor and the response value of an individual is expressed as the sum of the coefficients assigned to the categories indicating the individual’s
characteristics, the average of the response values for all cases, and a random error term. Thus the additive model in MC analysis can be expressed as
(2) nijkjinijk ebay ...... .........++++= µ where, nijky ... is the response value for a particular respondent who falls into ith category of predictor A, jth category of predictor B and so on; µ is the grand mean of the dependent variable Y, ia is the added effect of ith category of predictor A (difference between grand mean µ and the mean of the ith category of predictor A), jb is the added effect of jth category of predictor B (difference between grand mean µ and the mean of the jth category of predictor B); nijke ... is the random error term.
The coefficients are estimated in such a way that the sum of squared errors is minimized. Thus like least squares method, some normal equations or least squares equations are needed to solve for estimating the MC analysis coefficients. These equations can be solved by following a suitable iterative procedure. The diagnostic of the fitted model can be done by checking whether all the predictors can explain a significant proportion of the variation in the values of the dependent variable. In the similar way, the significance of each predictor can be answered by one-way analysis of variance. For details please see Andrews et al. [12] and Nagpaul [18].
For assessing the importance of a predictor (the degree of relationship between a predictor and the dependent variable), two correlation ratios called Eta ( )η and Beta ( )β statistics are calculated from the model before and after adjustment the other predictors respectively [19]. The value of the adjusted statistic β indicates the importance of a predictor on the response variable. The ranks of β statistics indicate the relative importance of the various predictors to explain the variance of the dependent variable [20]. Eta ( )η statistic is used for assessing the bivariate relationship between a predictor and the dependent variable. Both statistics range from 0 to 1. The statistics for a predictor I are estimated by [12]:
TU II =η , ( )2YYWU Ijj k
IjkI −
= ∑ ∑ ,

24 Kakoli Rani Bhowmik & Sabina Islam
−= ∑∑∑
kk
kkk
kkk wywywT
22 ,
TDII =β , and ∑ ∑
=
jIj
kIjkI aWD 2 .
Here kw is the weight of kth individual, ky is the value of Y for kth individual, IjY is the mean value of Y for the jth category of independent variable I, IjkW is the weight of kth individual fall in jth category of I independent variable, and Ija is the adjusted deviance of jth category of independent variable I on final iteration. Thus IU and ID are the sum of squares based on unadjusted and adjusted deviations respectively for predictor I and T is the total sum of squares. Squares of Iη and Iβ indicate the proportions of variation in Y explained by the predictor I before and after adjustments of other predictors respectively. The specific formulas are illustrated in [12, 18, 20].
Though MC analysis method is like an ANOVA, it has no problem of accounting correlated predictors in the additive model. In comparison to multiple regression analysis, MC analysis has no problem of considering non-interval scale predictors in the model. The gain of MC analysis over multiple regression analysis is estimating the effect of each predictor on the dependent variable both before and after considering the effects of all other predictors without any constraints, while some restriction are needed to consider in multiple regression analysis [18].
3. STUDY MATERIALS
In BDHS 2007, a nationally representative sample of 10,819 households has been selected following a two-stage stratified sampling method. A total of 10,996 ever-married women age 15-49 years (eligible respondents) were asked to inform regarding their socio-economic characteristics, reproductive history, knowledge and use of family planning methods, vaccinations, and childhood illnesses etc. [21]. All ever married women were also requested to provide a complete history of their live births including their survival status and
age at the survey date or at death. Since the units of this analysis in this study are under five dead children, the study can be considered as a retrospective study where information regarding the death children is based on mothers’ recall. NIPORT et al. [21] conducted several tests (sampling and non-sampling errors, underreporting and misreporting of infant deaths, etc.) for checking the validity of the mortality data and confirmed the accuracy of the collected data.
Before analysis, it was expected that only the live births during the last 5 years preceding the survey were enough to conduct the study. However, the number of live births died during this period was not sufficient to find significant association of the response variable (whether a live birth is still alive or died) with the considered explanatory variables. The problem can be solved by considering the live births that were born in last 10 or 15 years. In this case, there is some suspicion about the perfect comparison between the case group (who died before their fifth birthday) and the control group (who are still alive). If the live births of last 10 years are considered, a large number of children who still survive after their first five years of life will be in the control group, while in case group the members are under-5 death children ignoring their date of birth. To overcome such problem, all the children who died before their fifth birth day are considered so that both the case and control groups have at least one common characteristic that they are died before 5 years of age. So in total 3426 children who died before five years of age were extracted from the total live births. However, these children were born during 36 years preceding the survey date. The problem of considering all these death children are incompleteness of death reports and inaccuracy in mothers’ recall for the children whose mothers are very older now. For reducing inaccuracy, we consider only those children (2132) who were born during the last 20 years and failed to survive up to their fifth birth day. The consideration for 20 years is to increase the sample size so that significant association between the dependent and independent variables can be obtained.
The variable of interest is the age of child death measured in months that is used to define
Logistic Regression and Multiple Classification of Under-5 Mortality in Bangladesh 25
three binary variables for explaining the early childhood mortality indicators: neonatal death (1132) referred to deaths during first four weeks of birth, postnatal death (555) referred to deaths during 1 to11 months after birth and child death (445) referred to deaths during 12 to 59 months after birth [2]. Bivariate relationship between the dependent variables and the independent variables are observed before LR and MC analysis. Type of explanatory variables associated with the binary response variable varies with the type of mortality indicators. For this reason, different explanatory variables are used to develop three independent models for three mortality indicators involving all the death children. Since the LR model was developed for binary response variable, same binary variable was used to develop the corresponding MC model. Both LR and MC analyses are done in SPSS using LOGIT and ANOVA with MCA function, respectively. The sampling weight given in BDHS data was considered to perform the analysis.
4. RESULTS
To meet the target of United Nation’s MDG and to set strategies, the policy makers and donors require not only the rate of child mortality but also its risk factors. It will be beneficial for the policy makers if they can make an order of initiatives based on the ranks of the significant predictors. An attempt has been made in this section which is split into three sub-sections as pattern of neonatal, postnatal and child mortality in Bangladesh since 2000, significantly associated predictors determined in the LR analysis, and the ranking of the significant predictors based on MC analysis.
4.1 Childhood Mortality Pattern in Bangladesh
Bangladesh has gain a great achievement in the reduction of all stages of child mortality. In 1970s, infant mortality and child mortalities were respectively 147 and 86 per 1000 live births while in 2000s, the rates have come down to 51 and 17 per 1000 live births respectively [22]. According to recent BDHS 2011, 1 in each 23 children fails to survive after one year of age, while 1 in each 19
children dies before 5 years of age [2]. Though the overall childhood mortality has been reduced over the last few decades, the rate of decline is not same at different stages of childhood mortality. According to DHS surveys in Bangladesh since 1993/94 to 2011, infant mortality has declined by 51 percent (87 to 43 per 1000 live births), while child mortality and under-5 mortality have declined by 78 percent (50 to 11 per 1000 live births) and 60 percent (113 to 53 per 1000 live births) respectively.Among the infant mortalities (neonatal and post-neonatal), the proportion of neonatal death out of infant deaths is still high over the periods (60% in 1993/94 and 74.42% in 2011). Thus initiatives still require to decline the infant death specially the neonatal death to reduce the variation of child mortality at different stages of childhood.
To examine the situation of child death during the last decade, the three consecutive BDH surveys (BDHS-2007, BDHS-2004 and BDHS-2000) are used to draw the Figure 1 where the proportions of child deaths at different stages out of total under-5 deaths are shown [21, 23-24]. The children who died before their fifth birthday are considered here without seeing their date of birth. It is explicitly clear that proportion of child death during neonatal period (<1 month) is highest over the last decade. About 50 percent of child deaths occurred during the neonatal period and the rate doesn’t change. While the proportions of postnatal death and young child death are near about 25 percent. It is also noticeable that percentages of child death at different stages are almost same but the rate of childhood mortality decreased superficially during the last eight years. The reason might be the increasing sizes of live births considered in the corresponding surveys.
The trend analysis shows that the rate of under-5 child mortality has been decreased significantly and is in the right track to meet the MDG-4 by 2015. It also identifies the significant variation in mortality rate at different stages of childhood. The most vulnerable stage is the 1st month after birth and followed by the next 11 months. These variations also suggest that the risk factors of child mortality might vary with

26 Kakoli Rani Bhowmik & Sabina Islam
childhood stages. This is the basic reason of separate LR and MC analysis for neonatal, postnatal and child mortality.
4.2 Risk Factors of Early Childhood Mortality
Before fitting a binary LR model, the independent variables are chosen through cross-tabulation analysis between binary outcome variable (whether a child died in a given period or not) and categorical explanatory variables. Eleven categorical explanatory variables are found to have significant association (through chi-squared test not shown in the paper) with childhood mortality indicator variable. These associations vary with the considered dependent variables which indicate death of children at different stage of life. To free from multicollinearity problem, all influential covariates are not included to build up the regression model. Three binary LR models as well as three MC additive models have been developed to find out the significant factors of neonatal, post-neonatal and young child death. The results of both LR and MC models shown in Table 1 to Table 3 indicate that a considerable number of predictors have significant effect on less than five deaths and also the predictors vary with the models. The H-L tests indicate that all the fitted LR models are perfect for the given data set (p-value>0.05). The results are discussed below by chronological order of neonatal, post-neonatal, and child mortality.
Sex differential has a significant relationship with childhood mortality. In Bangladesh ratio of male-to-female infant and under-5 mortality is more than 100 since 1970s while in case of child mortality this ratio is always less than 100 [22]. In our study it is observed that sex of child has significant association with child death at the very beginning (neonatal) stage of life. Table 1 shows that male children (OR: 1.0 and adjusted predicted mean, APM: 0.51) were more likely to die at the neonatal stage than those female children (OR: 0.71 and APM: 0.44). The reason may be due to the fact that boys are biologically weaker and more susceptible to diseases and premature death compared to girls [25].
Hong [26] observed a strong negative association of infant mortality with multiple births in Bangladesh from the analysis of 2004 Bangladesh Demographic and Health Survey data. In this study the fitted LR model also indicates that number of foetus has highly significant effect on neonatal death. It is expected that women who gave multiple births are more likely (OR=2.9, APM=0.68) to face neonatal child death than those who have single birth (APM=0.45). The reason may be multiple births create more complicacy during delivery than the single birth and babies become physically week, as a result the risk of neonatal mortality is found higher for the multiple births.
Fig. 1. Comparison of child death under age five in three consecutive BDH surveys (Source: BDHS-2000 [23], BDHS-2004 [24], BDHS-2007 [21].

Logistic Regression and Multiple Classification of Under-5 Mortality in Bangladesh 27
The previous studies regarding child mortality in Bangladesh indicate that the children born within 24 months of preceding and successive birth had higher risk of early childhood death [27-29]. It is also observed in the study that mothers with previous birth interval of more than 24 months is 0.81 times (APM=0.46) less likely to have neonatal mortality compared to mother with less than 24 months birth interval (APM=0.50). It is because of the fact that during the short birth interval period mothers did not get sufficient time to revert their reproductive health and so they have
increased risk of getting premature birth as well as neonatal death. Mother’s age at first birth is also found mildly significant (p-value<0.15) with the child neonatal death after adjusting the other covariates. It is observed that mothers who provided birth before 19 years of age had higher risk (OR: 1.24, APM=0.49) of facing neo-natal death compared to their counterparts (APM=0.43). In a case study of Rajshahi district, Mondal et al. [30] found mother’s age at first birth as significant predictor of both infant and child mortality.
Table 1. Distribution of neonatal mortality and its risk factors in Bangladesh determined by logistic regression (LR) and multiple classification (MC) models, BDHS 2007.
Background Characteristics
Percentage of Mortality
Number of Children
Model I: Neonatal Mortality† Results from
LR Model Results from MC Model‡
β OR APA UPA Sex of child
Male R 56.8 1125 - - 0.5089 0.5135 Female 49.0 1008 -0.342 0.711*** 0.4367 0.4320
No. of foetus Singleton R 51.4 1968 - - 0.4531 0.4511 Multiple 73.2 164 1.057 2.877*** 0.6794 0.6995
Previous birth interval
<24 R 50.1 513 - - 0.5008 0.5057 24+ 45.7 869 -0.217 0.805** 0.4567 0.4539
Mother’s age at first birth
<19 52.8 1582 0.214 1.238* 0.4886 0.4858 19+ R 53.9 551 - - 0.4264 0.4349
Mother’s access to mass media
No media 52.8 1892 0.335 1.398** 0.4784 0.4807 One or more medias R 55.4 242 - - 0.4225 0.4007
Region
Barisal R 43.1 130 - - 0.3754 0.3814 Chittagong 44.8 426 0.012 1.012 0.3912 0.3844 Dhaka 52.9 698 0.393 1.481* 0.4794 0.4742 Khulna 54.3 188 0.379 1.460 0.4653 0.4708 Rajshahi 63.5 460 0.855 2.350*** 0.5765 0.5862 Sylhet 53.0 232 0.438 1.549* 0.4833 0.4852 Constant - - -0.746 0.474*** - - Goodness of fit (p-value)
H-L test: χ2(8)=14.804
(0.063) F-test: F10,1370=6.971
(0.000) R2 value Cox & Snell: 0.048 0.048 *** P<0.05; ** P<0.10; * <0.01 R Refers to reference category † Total children for Model-I: 2132 (weighted) ‡APA & UPA refer to adjusted and unadjusted predicted average, respectively
28 Kakoli Rani Bhowmik & Sabina Islam
Now-a-days maternal and child health care depend on mothers activities such as access to updated information through mass media like newspaper/magazine, radio and television programs, participating in different programs related to child and maternal health care, morbidity and mortality. In this study mother’s access to mass media (TV & radio) are found significantly associated with neonatal mortality. Mothers who had not the habit of watching TV or listening radio are 1.4 times (APM=0.48) more
likely to have neonatal mortality than the mothers who had such habit (APM=0.42). Existing mass media of Bangladesh are now broadcasting sufficient awareness program regarding child health care after birth, as a result mothers who maintain media access are more conscious about neonatal health and have more knowledge about the causes of neonatal death compared to the mother who is not maintaining any media.
The one and only variable which is found significantly associated with all types of childhood
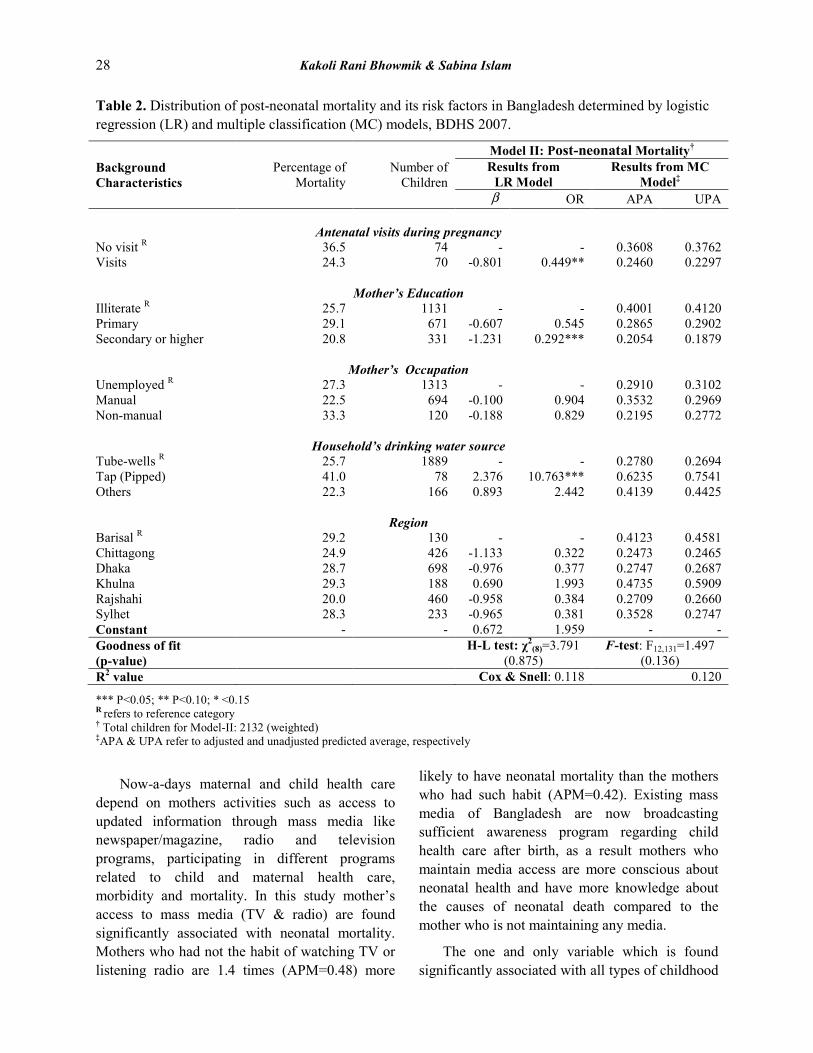
Table 2. Distribution of post-neonatal mortality and its risk factors in Bangladesh determined by logistic regression (LR) and multiple classification (MC) models, BDHS 2007.
Background Characteristics
Percentage of Mortality
Number of Children
Model II: Post-neonatal Mortality† Results from
LR Model Results from MC
Model‡ β OR APA UPA
Antenatal visits during pregnancy
No visit R 36.5 74 - - 0.3608 0.3762 Visits 24.3 70 -0.801 0.449** 0.2460 0.2297
Mother’s Education
Illiterate R 25.7 1131 - - 0.4001 0.4120 Primary 29.1 671 -0.607 0.545 0.2865 0.2902 Secondary or higher 20.8 331 -1.231 0.292*** 0.2054 0.1879
Mother’s Occupation
Unemployed R 27.3 1313 - - 0.2910 0.3102 Manual 22.5 694 -0.100 0.904 0.3532 0.2969 Non-manual 33.3 120 -0.188 0.829 0.2195 0.2772
Household’s drinking water source
Tube-wells R 25.7 1889 - - 0.2780 0.2694 Tap (Pipped) 41.0 78 2.376 10.763*** 0.6235 0.7541 Others 22.3 166 0.893 2.442 0.4139 0.4425
Region
Barisal R 29.2 130 - - 0.4123 0.4581 Chittagong 24.9 426 -1.133 0.322 0.2473 0.2465 Dhaka 28.7 698 -0.976 0.377 0.2747 0.2687 Khulna 29.3 188 0.690 1.993 0.4735 0.5909 Rajshahi 20.0 460 -0.958 0.384 0.2709 0.2660 Sylhet 28.3 233 -0.965 0.381 0.3528 0.2747 Constant - - 0.672 1.959 - - Goodness of fit (p-value) H-L test: χ2
(8)=3.791 (0.875)
F-test: F12,131=1.497 (0.136)
R2 value Cox & Snell: 0.118 0.120
*** P<0.05; ** P<0.10; * <0.15 R refers to reference category † Total children for Model-II: 2132 (weighted) ‡APA & UPA refer to adjusted and unadjusted predicted average, respectively
Logistic Regression and Multiple Classification of Under-5 Mortality in Bangladesh 29
mortality in bivariate analysis is the location (division) where the children are living. It is observed that the proportion of child death under five years of age significantly varies with the regional settings. However, in LR analysis region has significant effect on neonatal and young child deaths. The children belonging to Rajshahi division had higher risk (2.35 times) of being died within the neonatal period compared to the children of Barisal division. Also the risk of neonatal mortality was found significantly higher among the children of Sylhet (1.55 times) and Dhaka (1.48 times) divisions compared to Barisal division. The corresponding unadjusted and
adjusted predicted means are also found significantly higher than that of Barisal division (Table 1).
A different set of significant predictors are found for post-neonatal and child mortality in both LR and MC analyses. Receiving antenatal care during pregnancy which decreases the risk of maternal mortality as well as early childhood mortality is found significant in both LR and MC models (Table 2). It is observed that mothers who pursued regular antenatal visits during pregnancy are 0.45 times less likely to have post-neonatal mortality than their counterparts. The OR of post-neonatal death is found significantly varied
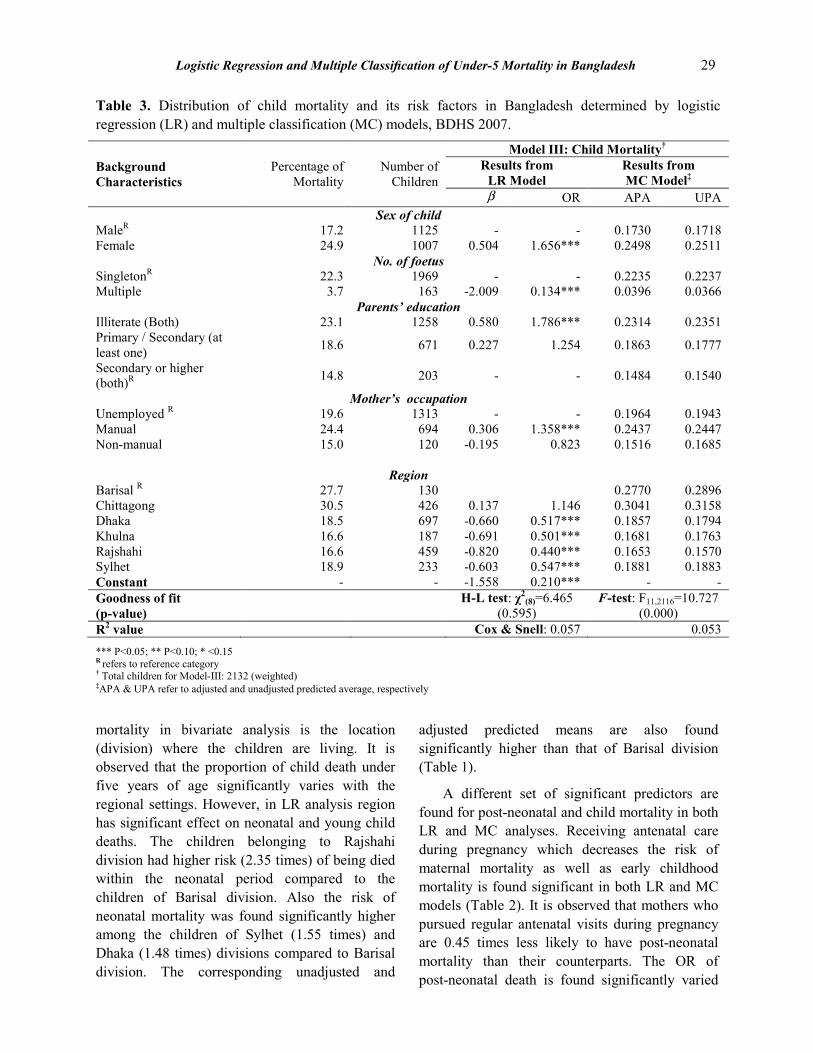
Table 3. Distribution of child mortality and its risk factors in Bangladesh determined by logistic regression (LR) and multiple classification (MC) models, BDHS 2007.
Background Characteristics
Percentage of Mortality
Number of Children
Model III: Child Mortality† Results from
LR Model Results from MC Model‡
β OR APA UPA Sex of child
MaleR 17.2 1125 - - 0.1730 0.1718 Female 24.9 1007 0.504 1.656*** 0.2498 0.2511
No. of foetus SingletonR 22.3 1969 - - 0.2235 0.2237 Multiple 3.7 163 -2.009 0.134*** 0.0396 0.0366
Parents’ education Illiterate (Both) 23.1 1258 0.580 1.786*** 0.2314 0.2351 Primary / Secondary (at least one) 18.6 671 0.227 1.254 0.1863 0.1777
Secondary or higher (both)R 14.8 203 - - 0.1484 0.1540
Mother’s occupation Unemployed R 19.6 1313 - - 0.1964 0.1943 Manual 24.4 694 0.306 1.358*** 0.2437 0.2447 Non-manual 15.0 120 -0.195 0.823 0.1516 0.1685
Region
Barisal R 27.7 130 0.2770 0.2896 Chittagong 30.5 426 0.137 1.146 0.3041 0.3158 Dhaka 18.5 697 -0.660 0.517*** 0.1857 0.1794 Khulna 16.6 187 -0.691 0.501*** 0.1681 0.1763 Rajshahi 16.6 459 -0.820 0.440*** 0.1653 0.1570 Sylhet 18.9 233 -0.603 0.547*** 0.1881 0.1883 Constant - - -1.558 0.210*** - - Goodness of fit (p-value) H-L test: χ2
(8)=6.465 (0.595)
F-test: F11,2116=10.727 (0.000)
R2 value Cox & Snell: 0.057 0.053 *** P<0.05; ** P<0.10; * <0.15 R refers to reference category † Total children for Model-III: 2132 (weighted) ‡APA & UPA refer to adjusted and unadjusted predicted average, respectively

30 Kakoli Rani Bhowmik & Sabina Islam
with Mother’s education. Secondary or higher educated mothers are 0.292 times less likely to have post-neonatal child death compared to the illiterate mothers. The reason of such result is expected since educated mothers are better able to access medical services, follow advice and engage in child care practices that reduce post-neonatal death. Sources of drinking water, categorized according to Das et al. [31], as a household environmental variable were found significantly associated with post-neonatal mortality. The risk of post-neonatal mortality is about 10.76 and 2.44 times more likely for the children, whose family used tap and other sources water than tube-well water. Adjusted and unadjusted predicted means in MC model also suggest the similar. It is necessary to mention that there is no variation by regional settings which clearly indicates the post-neonatal deaths are almost similar over the whole country. These results might be due to small portion of childhood deaths during the post-neonatal period in the data set.
In the similar manner of neonatal mortality, sex differential has a significant relationship with child mortality (Table 3). Though male children were found more likely to die at the neonatal stage than that female children (OR: 0.71), the opposite result is observed in case of child mortality. Female children are 1.66 times more likely to die in the period of 12-59 months than the male children. This significant variation might be due to the sex inequalities in health care and feeding practices which are still common in Bangladesh. The male children get more preference for providing health and nutrition care, and so they make progress in reducing the risk of death. Recently Brinda, Rajkumar, and Enemark [32] have also shown a significant positive association between child mortality and Gender Inequality Index developed by United Nations Development Programme (UNDP) from a cross-national study of 138 countries. In case of foetus status, also an opposite scenario is observed in child mortality case. The risk of child mortality is 0.13 times lower for the multiple births than the single birth (Table 3), while the risk of neonatal death was more than double (Table 1). This might be due to
the more care of family members for the multiple births at young child period (12-59 months) after facing the infant complicacy.
The parents’ education is significantly associated with childhood mortality [33]. Though the education was not found significant in the earlier stage childhood death, LR model indicates that risk of child mortality (death during 12-59 months) consequently decreasing with the increase of mother’s and father’s educational level (Table 3). Children with illiterate parents were 1.8 times more likely to experience with child mortality in comparison to children with highly educated. This may be due to the fact that higher educated parents had more knowledge about child health compared to illiterate parents.
Results obtained from the fitted LR and MC models indicate that mother’s occupation has also significant effect on child death during the 12-59 months of child age. Mother who is related with manual work (such as farmer, agricultural worker, fisherman, unskilled labourer, domestic labourer, non-agricultural land owner and labourer) is 1.35 times more likely to have child mortality compared to unemployed mother, however the risk is 0.82 times lower for the mother who is engaged with non-manual work. The reason may be mothers are generally educated who is engaged in non-manual work compared to unemployed and manual working mothers.
At last the regional influence is also observed in case of child mortality as neonatal child death but with different scenario. Though the children of Rajshahi division were found more experienced with neonatal death (OR: 2.35), they are least experienced (OR: 0.44) with child death in comparison to children of Barisal division. Except in Chittagong, the risk of child mortality is also found lower in other divisions (please see OR and APM in Table 3). These results indicate that the risk of child mortality is higher in Barisal and Chittagong divisions; however risk of neonatal death was lower there. Thus the regional settings have a great influence in overall childhood mortality situation which is not captured in the overall improvement of national childhood mortality rate.

Logistic Regression and Multiple Classification of Under-5 Mortality in Bangladesh 31
4.3 Importance of Early Childhood Mortality Predictors
The LR analysis helps to find out the variables significantly associated with the child mortality but can’t rank the variables according to the magnitude of their influence on the variable of interest. The MC analysis provides a way to rank the significant variables according to their relative importance on dependent variable. Similar to LR analysis, three separate MC models are developed for different stages of childhood mortality. The model fit statistics indicate that the MC models for neonatal and child mortality is significantly fitted with lower R-squared values (Table 4). However, the MC model for post-neonatal mortality is found insignificant at 5% but significant at 15% level of significance. The reason is the fewer number of cases at this stage. The lower R-squared values in all the MC models are due to the binary response variable which is clear also from the R-squared values of LR models. The MC model for neonatal
mortality (Table 4) shows that the number of foetus is explaining highest contribution (β=0.141), followed by regional settings (β=0.140). Though regional settings is found to have significant higher contribution to neonatal mortality, on an average the biological factor (sex, foetus, & birth interval) is explaining the highest variation (β=0.273=0.082+0.141+0.050). Thus now it is very easy to rank the significant predictors as: biological factors as first, regional settings as second and mother’s characteristics as third.
In case of post-neonatal mortality, mother’s education and household’s drinking water source are explaining the most variation significantly at 10% significance level. In the absence of other predictors, mother’s education had highest contribution (η=0.181) though in presence of other variables its contribution stands on 2nd position (β=0.207) after drinking water source (β=0.209). Among the other variables, only the contribution of ante-natal visits during pregnancy (β=0.159) is
Table 4. Multiple Classification (MC) analysis for neonatal, post-neonatal, and child mortality in Bangladesh, BDHS-2007.
Variables
Model I: Neonatal Mortality
Model II: Post-neonatal Mortality
Model III: Child Mortality
Iη Iβ p-value Iη Iβ p-value Iη Iβ p-value
Sex of child 0.072 0.082 0.002 0.094 0.097 0.000
No. of foetus 0.129 0.141 0.000 0.120 0.123 0.000
Previous birth interval (months) 0.043 0.050 0.059 - - - - - -
Mother’s education - - - 0.181 0.207 0.070 - - -
Parent’s education - - - - - - 0.070 0.078 0.002
Mother’s occupation - - - 0.074 0.019 0.977 0.064 0.062 0.016
Mother’s Access to Mass media 0.033 0.047 0.076 - - - - - -
Antenatal visits during pregnancy - - - 0.125 0.159 0.078 - - -
Household’s drinking water source - - - 0.154 0.209 0.054 - - -
Mother age at first birth 0.054 0.044 0.101 - - - - - -
Region 0.131 0.140 0.000 0.150 0.220 0.259 0.132 0.149 0.000

32 Kakoli Rani Bhowmik & Sabina Islam
found significant. On the other hand, almost similar pattern of neo-natal mortality is observed in case of child mortality. Here the regional setting is observed as the most effective determinant (η=0.132, β=0.149) to predict the number of child death during the period of 12-59 months before and after adjusting with other variables (Table 4). The close competitors are biological factors: no. of foetus (η=0.120, β=0.123) and sex of child (η=0.094, β=0.097) whose marginal effects and net effects are almost similar. The basic difference in child mortality is the contribution of parent’s characteristics (education and occupation) in explaining the variation of child mortality. Thus the significant variables can be ranked here almost in the similar way of neonatal mortality. From the MC analysis results, it is also visible that, significant factors are same in MC as like LR analysis which clearly supports the additional facilities of MC analysis. However, LR analysis provides risk of success for a specific group compared to a reference group. The similar interpretation can be made from MC analysis but need to compare the adjusted predicted values of the compared group with reference group. It is easy to verify just comparing the predicted means with the odds ratio: the higher the odds ratio of a group, the higher the predicted mean.
5. CONCLUSIONS
Though much improvement has been done in the reduction of overall under-5 mortality in Bangladesh, still have significant differences in the rate of mortality at different stages of children life. Comparatively the rate of neonatal death is still considerably higher though the overall childhood mortality rate is now in control. Also the variations in child death by regional, socio-economic and demographic characteristics are still needed to ascertain to reach the goal of ultimate target. To identify the vulnerable groups, several studies have been done by following the classical approach of LR analysis as a multivariate technique. In this study it is also obvious that characteristics associated with the childhood death varies with respect to the age at death. Binary LR analysis determines child birth history (sex, number of foetus, birth interval), regional settings, and mother awareness through the access to mass
media as significant predictors of neonatal death, while for post-neonatal mortality significant predictors are related to mother’s characteristics (education and ante-natal care) and household environment (access to better drinking water source). Like neonatal mortality, children biological factors, regional settings, and parent’s socio-economic status (parents’ education, mother’s occupation) are found as significant predictors of child mortality. The similar scenario is also revealed through MC analysis with an extra facility of ranking the significant predictors. The MC analysis result suggests to focus on child biological factors, regional settings and parents’ socio-economic status with a priority basis for both neonatal and post-infant stage; while mothers education and household environment for post-neonatal stage. The main contribution of this study is to focus on the utility of the MC analysis with the LR analysis to make an order of the significant predictors so that the policy makers can take initiatives on a priority basis. 6. ACKNOWLEDGEMENTS
We thank DHS Macro Internationals for the permission to use the 2007 BDHS dataset to do the analysis for this paper.
7. REFERENCES 1. UNICEF. Young Child Survival and
Development. UNICEF, New York, USA (2015). http://www.unicef.org/childsurvival/.
2. NIPORT (National Institute of Population Research and Training). Bangladesh Demographic and Health Survey 2011. NIPORT, Mitra and Associates, Dhaka, Bangladesh and ORC Macro, Calverton, Maryland, USA (2013).
3. Garde, M. & N. Sabina. Inequalities in Child Survival: Looking at Wealth and Other Socio-economic Disparities in Developing Countries. Save the Children, London, UK (2010).
4. Al-Kabir, A. Effects of Community Factors on Infant and Child Mortality in Rural Bangladesh. World Fertility Survey (WFS) Scientific Report No. 55. International Statistical Institute, Voorburg (1984).
5. Kabir, A., M.S. Islam, M.S. Ahmed & K. Barbhuiya. Factors influencing infant and child
Logistic Regression and Multiple Classification of Under-5 Mortality in Bangladesh 33
mortality in Bangladesh. The Sciences 1(5): 292-295 (2001).
6. DaVanzo, J., A. Razzaque, M. Rahman, L. Hale, K. Ahmed, M.A. Khan, G. Mustafa & K. Gausia. The Effects of Birth Spacing on Infant and Child Mortality, Pregnancy Outcomes, and Maternal Morbidity and Mortality in Matlab, Bangladesh. RAND Labor and Population (WR-198), RAND Corporation, Santa Monica, California, USA (2004).
7. Chowdhury, Q.H., R. Islam & K. Hossain. Socio-economic determinants of neonatal, postnatal, infant and child mortality. International Journal of Sociology and Anthropology 2(6): 118-125 (2010).
8. Kamal, S.M.M., M. Ashrafuzzaman & S.A. Nasreen. Risk factors of neonatal mortality in Bangladesh. Journal of Nepal Paediatric Society 32(1): 37-46 (2012).
9. Islam, R., M. Hossain, M. Rahman & M. Hossain. Impact of socio-demographic factors on child mortality in Bangladesh: An Multivariate Approach. International Journal of Psychology and Behavioral Sciences 3(1): 34-39 (2013).
10. Rahman, M., B. Wojtyniak, M.M. Rahaman & K.M.S. Aziz. Impact of environmental sanitation and crowding on infant mortality in rural Bangladesh. The Lancet 326(8445): 28-30 (1985).
11. Kabir, M.A., A.Q. Al-Amin, G.M. Alam & M.A. Matim. Early childhood mortality and affecting factors in developing countries: An experience from Bangladesh. International Journal of Pharmacology 1-7 (2011).
12. Andrews, F.M., J.N. Morgan, J.A. Sonquist & L. Klem. Multiple Classification Analysis: A Report on a Computer Program for Multiple Regression Using Categorical Predictors, 2nd
ed. Institute for Social Research, University of Michigan, Michigan, USA (1973).
13. Menard, S. Applied Logistic Regression Analysis. 2nd ed. Sage Publications, California, USA (2002).
14. Hosmer, D.W. & S. Lemeshow. Applied Logistic Regression, 2nd ed. John Wiley & Sons, New Jersey, USA (2000).
14. Engle, R.F. Wald, likelihood ratio, and Lagrange multiplier tests in econometrics. In: Griliches Z. and M.D. Intriligator (Ed.). Handbook of Econometrics, Volume II. Elsevier Science Publishers, North Holland, p. 775-826 (1984).
15. Agresti, A. Categorical Data Analysis, 2nd ed. John Wiley & Sons, New Jersey, USA (2002).
16. Suits, D.B. Use of dummy variables in regression equations. Journal of the American Statistical Association 52(280): 548-551 (1957).
17. Melichar, E. least squares analysis of economic survey data. In: Proceedings of the Business and Economic Statistics Section. American Statistical Association, p. 373-385 (1965).
18. Nagpaul, P.S. Chapter Five - Multiple regression and multiple classification analysis. In: Guide to Advanced Data Analysis using IDAMS Software. Division of Information and Informatics, UNESCO, New Delhi, India (2001). http://www.unesco.org/webworld/idams/advguide/TOC.htm.
19. Susel, A. Multiple classification analysis: Theory and application to demography. In: Acta Universitatis Lodziensis. Folia Oeconomica 255 Methodological Aspects of Multivariate Statistical Analysis: Statistical Models and Applications, p. 183-189 (2011).
20. Bachman, J.G. The Impact of Family Background and Intelligence on Tenth-Grade Boys. Youth in Transition. Volume II, Institute for Social Research, the Michigan University, Michigan, USA (1970).
21. NIPORT (National Institute of Population Research and Training). Bangladesh Demographic and Health Survey 2007. NIPORT, Mitra and Associates, Dhaka, Bangladesh and ORC Macro, Calverton, Maryland, USA (2009).
22. United Nations. Sex Differentials in Childhood Mortality. Department of Economic and Social Affairs, Population Division, United Nations, New York, USA (2011).
23. NIPORT (National Institute of Population Research and Training). Bangladesh Demographic and Health Survey 1999-2000. NIPORT, Mitra and Associates, Dhaka, Bangladesh and ORC Macro, Calverton, Maryland, USA (2001).
24. NIPORT (National Institute of Population Research and Training). Bangladesh Demographic and Health Survey 2004. NIPORT, Mitra and Associates, Dhaka, Bangladesh and ORC Macro, Calverton, Maryland, USA (2005).
25. Pongou, R. Why is infant mortality higher in boys than in girls? A New Hypothesis Based On Preconception Environment and Evidence from a Large Sample of Twins. Demography 50 (2): 421-444 (2013).

34 Kakoli Rani Bhowmik & Sabina Islam
26. Hong, R. Effect of Multiple Birth on Infant Mortality in Bangladesh. Journal of Paediatrics and Child Health 42 (10): 630-635 (2006).
27. Koenig, M.A., J.F. Phillips, O.M. Campbell & S. D'Souza. Birth intervals and childhood mortality in rural Bangladesh. Demography 27(2): 251-265 (1990).
28. Miller, J.E., J. Trussell, A.R. Pebley & B. Vaughan. Birth spacing and child mortality in Bangladesh and the Philippines. Demography 29(2): 305-318 (1992).
29. Rutstein, S.O. Further Evidence of the Effects of Preceding Birth Intervals on Neonatal Infant and Under-Five-Years Mortality and Nutritional Status in Developing Countries: Evidence from the Demographic and Health Surveys. DHS Working Papers No. 41. Macro International, Calverton, Maryland, USA (2008).
30. Mondal, M.N.I., M.K. Hossain & M.D. Ali. Factors influencing infant and child mortality: A Case study of Rajshahi district, Bangladesh. Journal of Human Ecology 26(1): 31-39 (2009).
31. Das, S., M.Z. Hossain, & M.A. Islam (2008). Predictors of child chronic malnutrition in Bangladesh. Proceedings of Pakistan Academy of Sciences 45(3), 137-155.
32. Brinda, E.M., A.P. Rajkumar & U. Enemark. Association between gender inequality index and child mortality rates: A cross-national study of 138 countries. BMC Public Health 15(1): 97 (2015).
33. Bbaale, E. & F. Buyinza. Micro‐analysis of mother's education and child mortality: Evidence from Uganda. Journal of International Development 24(S1): S138-S158 (2012).