logansport municipal utilities · 3 electric department balance sheet december 31, 2017 assets $...
TRANSCRIPT

LOGANSPORTMUNICIPAL
UTILITIESL o g a n s p o r t , I n d i a n a

www.logansportutilities.com 1
UTILITY SERVICE BOARD
Jay King, Chairman
Martin Monahan, Vice Chairman
Mike Meagher, Secretary
Mike Laird, Member
Mark Bender, Member
MANAGEMENT
Paul A. Hartman, Superintendent
LuAnn Davis, Controller
Robert Dunderman, Electric Distribution Manager
Brian DeWitt, Wastewater Manager
Cameron Dillon, Water Department Manager
Julie Truax, Human Resources Manager
2017 ANNUAL REPORTUTILITY SERVICE BOARD
Jay King, Chairman
Martin Monahan, Vice Chairman
Mike Meagher, Secretary
Mike Laird, Member
Mark Bender, Member
MANAGEMENT
Paul A. Hartman, Superintendent
LuAnn Davis, Controller
Robert Dunderman, Electric Distribution Manager
Brian DeWitt, Wastewater Manager
Cameron Dillon, Water Department Manager
Julie Truax, Human Resources Manager
2017 ANNUAL REPORT

www.logansportutilities.com 2
LONG TERM INDEBTEDNESS AS OF DECEMBER 31, 2017
OUTSTANDING BONDS ISSUED BONDS RETIRED REVENUE BONDS INTEREST PAIDAS OF DURING DURING OUTSTANDING AS DURING
January 1, 2017 2017 2017 OF 12/31/17 2017
ELECTRIC UTILITY -$ -$ -$ -$ -$
WATER UTILITY 1,312,000.00$ -$ 201,000.00$ 1,111,000.00$ 36,663.00$
SEWAGE UTILITY 1,072,000.00$ -$ 224,000.00$ 848,000.00$ 27,624.00$
STORMWATER 13,830,984.00$ -$ 685,830.00$ 13,145,154.00$ 208,763.22$
TOTALS 16,214,984.00$ -$ 1,110,830.00$ 15,104,154.00$ 273,050.22$
This is to certify that the data contained in this report is accurate to the best of my knowledge and belief.
LONG TERM INDEBTEDNESSAs of December 31, 2017

www.logansportutilities.com 3
ELECTRIC DEPARTMENT BALANCE SHEETDecember 31, 2017
ASSETS
5,140.66$ 2,614,672.73$
62,501.84$ 2,677,174.57
-$ -$ -$
1,322,398.66$ 1,322,398.66
2,464,154.34$-$ -$ -$
3,039,473.87$277,334.39$
-$ 25,635.70$
177,824.42$ 5,984,422.729,989,136.61$
85,456,248.65$170,178.12$ 85,626,426.77
64,884,088.8520,742,337.92$30,731,474.53$
CURRENT ASSETS: Cash-Operating .......................................................................... Accounts Receivable-Customers ............................................... Accounts Receivable-Others......................................................
Prepaid Expenses Inventory-Coal ............................................................................ Inventory-Oil ............................................................................... Inventory-Materials .....................................................................
INVESTMENTS: Operating Fund (Savings) .......................................................... Bond Sinking Fund ..................................................................... Bond Reserve............................................................................. Construction Fund (Investment) ................................................. Depreciation Reserve................................................................. Banked Vacation ........................................................................ Employee Savings...................................................................... Insurance Reserve ..................................................................... Restricted Customer Deposits.................................................... Total Current Assets................................................................
FIXED ASSETS: Plant in Service .......................................................................... Construction Work in Progress................................................... Less: Reserve for Depreciation ............................................... Net Plant.................................................................................. TOTAL ASSETS.................................................................
ELECTRIC DEPARTMENT BALANCE SHEETDecember 31, 2017

www.logansportutilities.com 4
ELECTRIC DEPARTMENT BALANCE SHEET (Continued)December 31, 2017
LIABILITIES CURRENT LIABILITIES:
2,361,869.33$ -$
407,104.86$ 407,104.86178,075.00
2,947,049.19$ 6,527,162.22$
-$ 17,940,966.89$3,316,296.23$ $21,257,263.12
TOTAL LIABILITIES 30,731,474.53$
Accounts Payable..................................................................... Current Portion (Bonds)............................................................ Accrued Customer Deposits................................................................... Total Current Liabilities.......................................................... Contributions in Aid .................................................................. Long Term-Bonds..................................................................... Earned Surplus......................................................................... Current Year Earnings..............................................................
ELECTRIC DEPARTMENT BALANCE SHEET (Continued)December 31, 2017

www.logansportutilities.com 5
ELECTRIC DEPARTMENT INCOME STATEMENT
January 1, 2017 to December 31, 2017
37,124,181.91$93,879.63
229,602.5525,568.53
3,039,806.0245,483.52 40,558,522.16$
78,042.28$ 29,685,650.203,158,846.062,015,043.05
768,313.910.00
1,536,330.43 37,242,225.93$
3,316,296.23$
REVENUES: Electric Sales............................................................................ Customer Penalties .................................................................. Customer Service Sales........................................................... Interest Income......................................................................... Fuel Adjustments Revenues .................................................... Miscellaneous Revenues..........................................................
EXPENSES: Steam Power Generation ......................................................... Purchased Power ..................................................................... Distribution Expense................................................................. Administration & General Expense........................................... Payroll & Revenue Receipts Tax.............................................. Interest Expense ...................................................................... Depreciation .............................................................................
INCOME TRANSFERRED TO SURPLUS....................................
ELECTRIC DEPARTMENT INCOME STATEMENTJanuary 1, 2017 to December 31, 2017

www.logansportutilities.com 6
ELECTRIC DEPARTMENT CASH FLOW ANALYSIS
January 1, 2017 to December 31, 2017
(292,394.06)$
40,779,225.43$25,568.53$
275,086.07$ 216,616.83$ 41,296,496.86$
. 41,004,102.80$
3,236,888.34$2,783,356.96$
29,685,650.20$-$
(1,020,377.30)$ 36,726,272.80$
4,277,830.00$
(4,389.18)$ 501,998.03$ 497,608.85$
3,780,221.15$1,310,926.15$
2,469,295.00$
2,469,295.00$
Operating Cash Balance 1/01/17
SOURCE OF FUNDS: Net Revenue Interest from Investments............................................ Misc. Non-Operating Revenues .................................. Contributions in Aid ..................................................... Total Cash Available.................................................
USE OF FUNDS: Operation & Maintenance Expense............................. Administrative & General Expenses ............................ Purchased Power ........................................................ Coal, Oil and Gas ........................................................
Less: Increase in Payables & Accruals ....................
Cash Available after Expenses..........................
Prepayments & Inventory ............................................ Capital Outlay-Utility ....................................................
Net Cash Available from Operation................... Transfer to Investments...............................................
Cash in Bank 12/31/17 ...............................................
Invested 12/31/17........................................................
ELECTRIC DEPARTMENT CASH FLOW ANALYSISJanuary 1, 2017 to December 31, 2017

www.logansportutilities.com 7
ELECTRIC DEPARTMENT CASH BALANCESDecember 31, 2017
2016 2017CASH BALANCES:
(292,394.06)$ 2,469,295.00$1,506,299.02$ 3,039,473.87$
262,476.77$ 277,334.39$ 275,154.67$ 25,635.70$ 165,411.77$ 177,824.42$
-$ -$
Cash Operating Fund ............................................... Depreciation Fund .................................................... Banked Vacation ...................................................... Insurance Reserve ................................................... Restricted Customer Deposits.................................. Construction Fund. ...................................................
ELECTRIC DEPARTMENT CASH BALANCESDecember 31, 2017

www.logansportutilities.com 8
ELECTRIC DEPARTMENT INVESTMENT BALANCES
JANUARY 1, 2017 TO DECEMBER 31, 2017
1,506,299.02$ RECEIPTS:
1,510,000.00$23,174.85$ 1,533,174.85$
3,039,473.87$-$ -$
3,039,473.87$
275,154.67$ RECEIPTS:
-$ 481.03$ 481.03$
275,635.70$ 250,000.00$ -$
25,635.70$
165,411.77$ RECEIPTS:
10,500.00$ 1,912.65$ 12,412.65$
177,824.42$ -$ -$
177,824.42$
-$ RECEIPTS:
-$ -$ -$
-$ -$
-$
ELECTRIC DEPRECIATION AND REPLACEMENT: Balance, January 1, 2017.....................................
Transfers .............................................................. Interest Earned..................................................... Total Balance and Receipts............................. Disbursements ..................................................... Balance, December 31, 2017...............................
ELECTRIC INSURANCE RESERVE: Balance, January 1, 2017.....................................
Transfers .............................................................. Interest Earned..................................................... Total Balance and Receipts............................. Disbursements ..................................................... Balance, December 31, 2017...............................
RESTRICTED CUSTOMER DEPOSITS: Balance, January 1, 2017.....................................
Transfers .............................................................. Interest Earned..................................................... Total Balance & Receipts ................................ Disbursements ..................................................... Balance, December 31, 2017...............................
ELECTRIC CONSTRUCTION: Balance, January 1, 2017.....................................
Transfers .............................................................. Interest Earned..................................................... Total Balance & Receipts ................................ Disbursements ..................................................... Balance, December 31, 2017...............................
ELECTRIC DEPARTMENT INVESTMENT BALANCESJanuary 1, 2017 to December 31, 2017

www.logansportutilities.com 9
ELECTRIC DEPARTMENT 2017 ANNUAL STATISTICS REPORTKilowatt Hours Produced by Month
GENERATED PURCHASED TOTAL
0 37,061,287 37,061,2870 31,986,530 31,986,5300 35,198,921 35,198,9210 31,325,526 31,325,5260 34,429,424 34,429,4240 38,843,070 38,843,0700 42,195,504 42,195,5040 39,790,731 39,790,7310 35,948,584 35,948,5840 34,913,301 34,913,3010 34,620,152 34,620,1520 37,214,882 37,214,8820 433,527,912 433,527,9120 0 00 433,527,912 433,527,9120 68.48 MILLS
2016 2017
431,583,192 414,490,0300% 100%
$ 85,124,428.74 $ 85,456,248.65$ 0.00 $ 170,178.12$ 0.00 $ 0.00
12,519 12,544
JANUARY.................................................................FEBRUARY..............................................................MARCH ....................................................................APRIL .......................................................................MAY..........................................................................JUNE ........................................................................JULY.........................................................................AUGUST ..................................................................SEPTEMBER ...........................................................OCTOBER................................................................NOVEMBER.............................................................DECEMBER ............................................................. GROSS TOTAL................................................... USED BY LIGHT PLANT .................................... NET TOTAL.........................................................
Total Energy Delivered to System............................Percentage of Energy Purchased ............................Property/Plant Valuation...........................................Construction .............................................................Outstanding Obligations ...........................................Total Number of Meters in Service...........................
ELECTRIC DEPARTMENT 2017 ANNUAL STATISTICS REPORTKilowatt Hours Produced by Month

www.logansportutilities.com 10
LMU ELECTRIC TRANSMISSION/DISTRIBUTION SYSTEMS STATISTICSAs of December 31, 2017
2017 STREET LIGHTS 2016 2017
1,933 2,125372 37210 (Boulders) 10 (Boulders)11 (Chase Rd.) 11 (Chase Rd.)
192 0363 363
7 7171 171
5 50 10
3,064 3,053
2017 UTILITY EASEMENTS..........................................................
100 Watt High Pressure Sodium ....................................150 Watt High Pressure Sodium ....................................150 Watt High Pressure Sodium ....................................150 Watt High Pressure Sodium ....................................175 Watt Mercury Vapor.................................................250 Watt High Pressure Sodium ....................................400 Watt Mercury Vapor.................................................400 Watt Pressure Sodium Vapor .................................. LED Lights (Eel River Avenue) .................................135 LED Lights (West St.) .............................................
Total Lights
1 3
LMU ELECTRIC TRANSMISSION/DISTRIBUTION SYSTEMS STATISTICSAs of December 31, 2017

www.logansportutilities.com 11
2017 METERING TOTALS
Jan Feb Mar Apr May June July Aug Sept Oct Nov Dec TOTAL
Service Turn Ons 41 37 72 61 64 81 70 114 77 92 66 43 818Service Turn Offs 31 37 37 45 49 62 61 66 53 57 47 31 576Service Cuts 100 99 74 86 130 101 110 169 141 141 103 64 1,318Service Reinstate 69 68 60 72 77 77 75 136 105 115 66 43 963Reads 104 125 138 120 123 137 123 156 146 110 115 104 1,501Re-Reads 149 71 50 81 64 52 70 60 29 44 59 40 769Single Phase Test 97 133 147 94 186 162 119 143 227 202 132 198 1,840Three Phase Bench Test 2 1 6 1 0 3 0 0 0 0 4 7 24Three Phase Field Test 11 26 21 15 17 9 0 0 0 0 17 5 121Ten Year Meter change 14 10 18 14 19 20 16 19 18 97 34 23 302
Meters Purchased…………………….. 298Meters Tested…………………………. 1,985Meters Retired…………………………. 319Meters in Stock……………………….. 214Meters Moved…………………………..1,318Meters Changed………………………. 302
2017 METERING TOTALS

www.logansportutilities.com 12
DISTRIBUTION SYSTEM - 2017
2016 2017
# of Svcs # of SvcsNew Commercial Installed
9 1,591.00$ 6 6,994.80$6 30,304.00$ 0 1,900.00$
New Industrial Installed0 -$ 0 -$ 0 -$ 0 -$
New Residential Installed5 1,083.00$ 3 767.00$ 9 10,137.00$ 12 8,362.50$
14 2,674.00$ 9 7,761.80$15 40,441.00$ 13 10,262.50$
0 -$ 3 278.57$ 3 5,423.00$ 7 22,952.00$
0 -$ 0 -$ 0 -$ 0 -$
10 3,100.00$ 16 4,800.00$22 12,115.00$ 23 14,005.00$
10 3,100.00$ 19 5,078.57$25 17,583.00$ 30 36,957.00$
Total Paid Jobs24 5,774.00$ 28 12,840.00$40 57,979.00$ 43 47,219.50$
64 63,753.00$ 71 60,059.50$
Overhead....................................................Underground ..............................................
Overhead....................................................Underground ..............................................
Overhead....................................................Underground ..............................................
New Systems Installed-Totals of NewOverhead....................................................Underground ..............................................
Commercial Services UpgradesOverhead....................................................Underground ..............................................
Industrial Services UpgradesOverhead....................................................Underground ..............................................
Residential Services UpgradesOverhead....................................................Underground ..............................................
System Upgrades-Total of UpgradesOverhead....................................................Underground ..............................................
Overhead....................................................Underground ..............................................
TOTAL
DISTRIBUTION SYSTEM – 2017

www.logansportutilities.com 13
DISTRIBUTION SYSTEM 2017- CONTINUED
LINES - MILES 2016 2017
Total Overhead System Miles of Line.................................................. 415 415Total Overhead Miles of Wire .............................................................. 1,154 1,154Total Underground System Miles of Line ............................................. 44 44Total Underground Miles of Wire ......................................................... 165 165
POLES
Total Number of Poles......................................................................... 21,434 21,448
TRANSFORMERS
Transformers Within City ..................................................................... 1,377 1,374Transformers Outside City ................................................................... 2,182 2,190 Total Transformers in Service......................................................... 3,559 3,564
DISTRIBUTION SYSTEM2016 +/- 2017 +/-
2.4 KV Overhead 0' 0'2.4 KV Underground 0' 0'
4.16 KV Overhead 0' 0'7.2 KV Overhead (+) 1500' (+) 600'7.2 KV Underground (+) 1800' (+) 900"
12.4 KV Overhead 0' 0'12.4 KV Underground 0' 0'7.98 KV Overhead (+) 150' (+) 200'7.98 KV Underground (+) 3000' (+) 2000'13.8 KV Overhead (-) 800' 0'13.8 KV Underground (-) 0' (+) 400'
DISTRIBUTION SYSTEM – 2017 (Continued)

www.logansportutilities.com 14
FIRES CUSTOMER SERVICE WRECKSCUSTOMERPROBLEMS TOTAL
JANUARY -$ -$ 638.03$ -$ 638.03$ FEBRUARY 973.44 2,293.32 3,266.76 MARCH - APRIL 681.51 - 4,503.75 - 5,185.26 MAY - - 734.61 734.61 JUNE 477.64 4,025.85 264.94 4,768.43 JULY 1,271.29 270.12 232.62 1,774.03 AUGUST 821.90 6,537.38 52.44 7,411.72 SEPTEMBER 465.61 366.41 31,171.06 32,003.08 OCTOBER 610.27 736.03 330.26 1,676.56 NOVEMBER 372.03 2,699.32 594.67 3,666.02 DECEMBER - 2,872.30 - 2,872.30
TOTAL 5,673.69$ -$ 25,677.12$ 32,645.99$ 63,996.80$
CHARGEABLE CALLS FOR 2017
CHARGEABLE CALLS FOR 2017

www.logansportutilities.com 15
ANNUAL ELECTRIC DISTRIBUTION SUMMARY REPORT FOR 2017
We started the New Year out on the fast track. With the new energy contract signed with NextEra we had plenty to accomplish. Working with NextEra and Duke Energy to make this a smooth transition has proven to be a large undertaking. As we close in on that final day with Duke Energy, it gets more exciting and nervous at the same time.
The County has started to improve a major road to Clymers and the ethanol plant. Scott Hanawalt, Senior Planning Engineer, started working on the design in 2016 to move our three phase primary circuit that feeds into Clymers along County Road 400 South. The road is being widened by thirty-feet. In total, the project is almost four miles in length. With the length of the project, Cass County and INDOT have broken it up into four phases. Phase One concentrated in the town of Clymers. We started this phase in late 2016 and finished in February of 2017. Phase Two was immediately started with the design and work was finished by the fall. The design for Phase Three is complete and we’re waiting on the notice to proceed. Each phase of this project has to be designed and submitted to INDOT for approval before any work can be started. This project is a tribute to our workforce. From the Planning Department, the Storeroom personnel and our line crews, we built a line that we’re all proud of.
A new project was started on the Boulevard for LED street lights. With numerous roadblocks the project has continued into 2018. We had hoped to finish this project in the fall of 2017 but because of other underground utilities in the area we had to change our design. The new lights should make this street beautiful when we’re finished.
In conclusion, we’re looking forward to the New Year as it brings an end to a long term relationship with Duke Energy and starting a new relationship with NextEra.

www.logansportutilities.com 16
WATER DEPARTMENT BALANCE SHEETDecember 31, 2017
ASSETS
CURRENT ASSETS: Cash - Operating ........................................................... 917,457.14$ Accounts Receivable - Customers ................................ 227,727.59$ Accounts Receivable-Other........................................... 365.06 Prepaid Expenses ......................................................... - Deferred Expenses Bonds ............................................ - 228,092.65$
1,145,549.79$
INVESTMENTS: Operating Reserve ........................................................ 468,928.88$ Annexation Fund ........................................................... - Depreciation Fund ......................................................... 864,372.57 Sinking Fund ................................................................. 209.64 Bond Reserve................................................................ 249,598.05 Bond Construction......................................................... - Insurance Reserve ........................................................ 117,008.27 1,700,117.41$ Inventory........................................................................ 86,494.59$ Total Current Assets................................................. 1,786,612.00$
FIXED ASSETS: Plant in Service ............................................................. 23,723,965.72$ Construction Work in Progress...................................... 100,293.61 Less: Reserve for Depreciation .................................. 12,060,782.99 11,763,476.34$
TOTAL ASSETS ...................................................... 14,695,638.13$
WATER DEPARTMENT BALANCE SHEETDecember 31, 2017

www.logansportutilities.com 17
WATER DEPARTMENT BALANCE SHEET - Continued
December 31, 2017
LIABILITIES
CURRENT LIABILITIES: Accounts Payable....................................................... 61,620.34$ Accrued Expenses ..................................................... 65,542.39 Customer Deposits ..................................................... 300.00 Current Portion Bonds................................................ 208,000.00$ Note Payable SRF...................................................... 0.00 Accrued Interest ......................................................... 18,331.50 226,331.50 Total Current Liabilities............................................ 353,794.23$
LONG TERM DEBT: Long Term Portion Bonds .......................................... 903,000.00$ Contributions in Aid .................................................... 6,617,572.07 7,520,572.07$
CAPITAL: Earned Surplus........................................................... 6,682,428.84$ Current Year Earnings................................................ 138,842.99 6,821,271.83$
TOTAL LIABILITIES............................................. 14,695,638.13$
WATER DEPARTMENT BALANCE SHEET (Continued)December 31, 2017

www.logansportutilities.com 18
WATER DEPARTMENT INCOME STATEMENT
January 1, 2017 to December 31, 2017
REVENUES:
Metered Sales ........................................................... 2,497,430.69$ Private Fire Protection ............................................... 391,461.75 Public Fire Protection ................................................ Penalties.................................................................... 16,202.81 Customer Service Sales & Permits ........................... 72,025.01 Interest Earned .......................................................... 26,720.29 Other - Non-Operating Income .................................. 66,374.28 3,070,214.83$
EXPENSES:
Pumping .................................................................... 55,334.55$ Treatment .................................................................. 614,526.26 Distribution Expense.................................................. 991,280.18 Administrative & General Expense............................ 382,721.53 Depreciation Expense ............................................... 324,548.27 Taxes, Pension, Group Insurance ............................. 526,298.05 Interest Expense........................................................ 36,663.00 2,931,371.84$
INCOME TRANSFERRED TO SURPLUS..................... 138,842.99$
WATER DEPARTMENT INCOME STATEMENTJanuary 1, 2017 to December 31, 2017

www.logansportutilities.com 19
WATER DEPARTMENT CASH FLOW ANALYSIS
JANUARY 1, 2017 TO DECEMBER 31, 2017
Cash in Bank 1/01/17 741,382.36$
SOURCE OF FUNDS: Net Revenue from Sales ......................................... 2,900,764.66$ Interest Income........................................................ 26,720.29$ Other Income........................................................... 138,399.29$ Contributions in Aid.................................................. 60,342.93$ Funds from Bond Refinancing ................................. 3,126,227.17$ Total Cash Available...........................................
3,867,609.53$
USE OF FUNDS: Operating Expenses ................................................ 1,661,140.99$ Administrative Expenses ......................................... 909,019.28$ Prepayments & Inventory ........................................ (20,011.35)$
Less: Increase in Payables & Accruals................... (12,207.89)$ 2,562,357.11$
Cash from Operation .......................................... 1,305,252.42
Capital Improvements.............................................. 105,435.61$ Transfers ................................................................. 282,359.67 387,795.28$
Cash in Bank 12/31/17 ................................................. 917,457.14$
Invested 12/31/17 ......................................................... 917,457.14$
WATER DEPARTMENT CASH FLOW ANALYSISJanuary 1, 2017 to December 31, 2017

www.logansportutilities.com 20
WATER DEPARTMENT INVESTMENT BALANCESJANUARY 1, 2017 TO DECEMBER 31, 2017
WATER DEPRECIATION: Balance, January 1, 2017.......................................... 854,520.85$
RECEIPTS: Transfers ................................................................... . Interest Earned .......................................................... 9,851.72$ 9,851.72$ Total Balance & Receipts...................................... 864,372.57$ Disbursements........................................................... -$ -$ Balance, December 31, 2017 .................................... 864,372.57$
WATER BOND RESERVE: Balance, January 1, 2017 .......................................... 246,753.25$ RECEIPTS: Transfers ................................................................... -$ Interest Earned .......................................................... 2,844.80$ 2,844.80$ Total Balance & Receipts...................................... 249,598.05$ Disbursements........................................................... -$ -$ Balance, December 31, 2017 .................................... 249,598.05$
WATER BOND AND INTEREST: Balance, January 1, 2017 .......................................... 748.83$ RECEIPTS: Transfers ................................................................... 242,848.00$ Interest Earned .......................................................... 1,275.81$ 244,123.81$ Total Balance & Receipts...................................... 244,872.64$ Disbursements........................................................... 244,663.00$ 244,663.00$ Balance, December 31, 2017 .................................... 209.64$
INSURANCE RESERVE: Balance, January 1, 2017 .......................................... 115,664.72$ RECEIPTS: Transfers ................................................................... -$ Interest Earned .......................................................... 1,343.55$ 1,343.55$ Total Balance & Receipts...................................... 117,008.27$ Disbursements........................................................... -$ -$ Balance, December 31, 2017 .................................... 117,008.27$
WATER DEPARTMENT INVESTMENT BALANCESJanuary 1, 2017 to December 31, 2017
www.logansportutilities.com 21
WATER DEPARTMENT INVESTMENT BALANCESJANUARY 1, 2017 TO DECEMBER 31, 2017
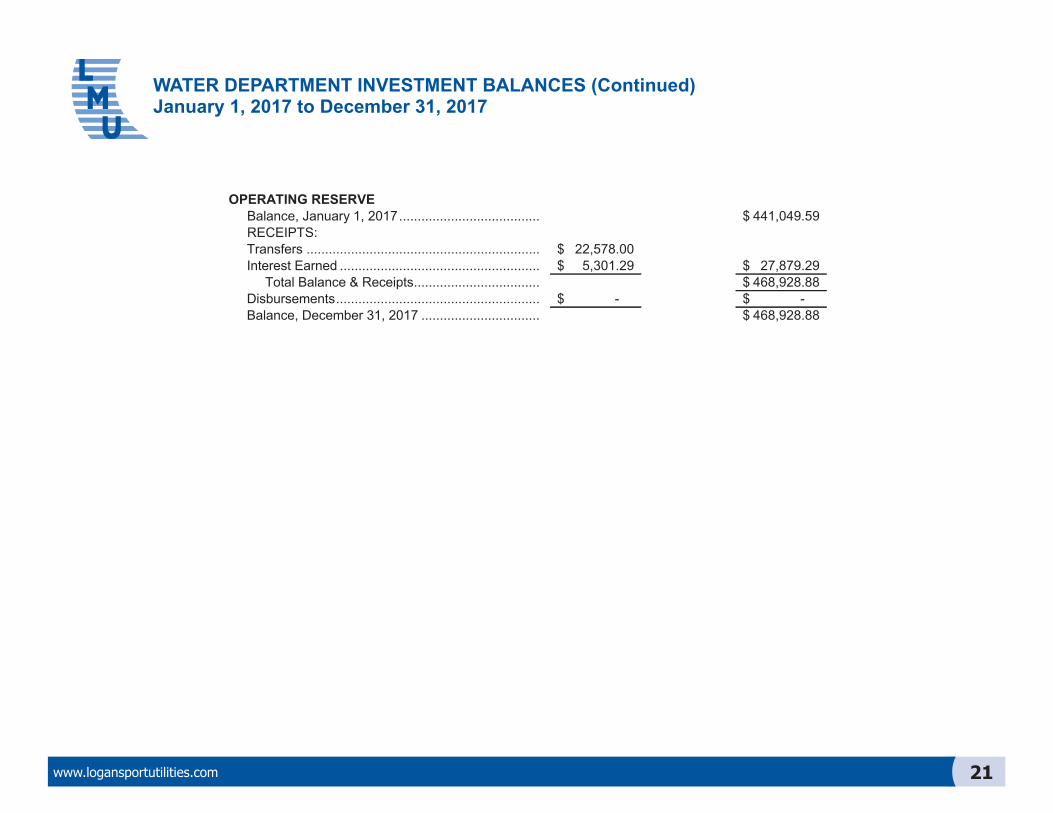
OPERATING RESERVE Balance, January 1, 2017...................................... 441,049.59$ RECEIPTS: Transfers ............................................................... 22,578.00$ Interest Earned ...................................................... 5,301.29$ 27,879.29$ Total Balance & Receipts.................................. 468,928.88$ Disbursements....................................................... -$ -$ Balance, December 31, 2017 ................................ 468,928.88$
WATER DEPARTMENT INVESTMENT BALANCES (Continued)January 1, 2017 to December 31, 2017

www.logansportutilities.com 22
WATER DEPARTMENT
2017 ANNUAL STATISTICS REPORT
PROPERTY AND PLANT VALUATION:
2016............................................................... 23,718,323.76$2017............................................................... 23,824,259.33$
CONSTRUCTION:
2016............................................................... -$ 2017............................................................... 100,293.61$
OUTSTANDING BOND OBLIGATION:
2016............................................................... 1,312,000.00$2017............................................................... 1,111,000.00$
CASH BALANCES: 2016 2017
Cash Operating Fund ................................................. 741,382.36$ 917,457.14$ Depreciation................................................................ 854,520.85$ 864,372.57$ Bond & Interest Redemption Fund.............................. 748.83$ 209.84$ Bond Reserve Fund.................................................... 246,753.25$ 249,598.05$ Insurance Reserve...................................................... 115,664.72$ 117,008.27$ Operating Reserve ..................................................... 441,049.59$ 468,928.88$
WATER DEPARTMENT 2017 ANNUAL STATISTICS REPORT

www.logansportutilities.com 23
LOGANSPORT MUNICIPAL UTILITIES ANNUAL REPORT OF OPERATIONS - 2017 WATER DISTRIBUTION SYSTEM STATISTICS
SERVICE CALLS:
Services Replaced 56 Swimming Pools Filled
New Services Installed 10 Verify Meter Readings for Accuracy
Services Repaired 105 Miscellaneous Service Turn Ons & Offs
Fire Hydrants Broken by Vehicles 2 Water Line Locates Requested
Fire Hydrants Repaired or Replaced 16 Fire Hydrants Flushed
Mains Broken by Contractors 0 Isolation Valves Repaired/Replaced
Mains Broken (unknown causes) 37 New Isolation Valves Installed
Line Stops Performed 4 Miscellaneous Service Calls
Remote Meter Conversions 157 Mains Extended, linear feet
Frozen Meters 3 Mains Replaced, linear feet
Repeat Frozen Meters 0
Broken Meters 8 WATER SYSTEM TOTALS:
Pits & Covers Replaced 268 Total Number of Water Meters
Inspections for Leaks 718 Total Number of Fire Hydrants
Valve & Curb Boxes Repaired/Replaced 42 Total Number of Fire Lines
Meter Tests, Calibrations, & Repairs 48 Miles of Main Operated & Maintained 123
7,317
711
114
313
0
60 Ft.
1,422
8
2
2,198
0
1,598
1,269
LOGANSPORT MUNICIPAL UTILITIESANNUAL REPORT OF OPERATIONS – 2017
WATER DISTRIBUTION SYSTEM STATISTICS

www.logansportutilities.com 24
LOGANSPORT MUNICIPAL UTILITIES ANNUAL REPORT OF OPERATIONS - 2017 PUBLIC WATER SUPPLY STATISTICS
OPERATIONS:
A. Water Pumped to the Public - Million Gallons
Peak Monthly Flow -
Minimum Monthly Flow -
Average Monthly Flow -
Individual Well Production - Million Gallons (a) Well(b) Well(c) Well(d) Well(e) Well
B. Equivalent Average Hours/Day Production -
C. Chemicals Required for Treatment - Chlorine (pounds)
D. Safe Drinking Water Act (SDWA) Compliance Rating -
LABORATORY/MONITORING PROGRAM (COMBINED WATER SUPPLIES):
A. Conducted over 10,000 water quality analyses during the year.
B. Contracted laboratory performed specialized analyses on bacteriological, inorganic, organic, disinfection byproducts(trihalomethanes and haloacetic acids), nitrates, total organic carbon, unregulated contaminant monitoring profiles, synthetic organic compounds, trace metals, radionuclides, and various other specialized contaminants.
C. In-house laboratory analyses and monitoring for operational control and reporting purposes are conducted 24x7.
395.64 MG
12.8
319.81 MG
1,786.34 MG
165.16 MG (AUG)
LMU WELLFIELD:
130.58 MG (APR)
148.86 MG
382.34 MG376.70 MG
19,698 Lbs.
100%
311.87 MG
LOGANSPORT MUNICIPAL UTILITIESANNUAL REPORT OF OPERATIONS – 2017
PUBLIC WATER SUPPLY STATISTICS

www.logansportutilities.com 25
LOGANSPORT MUNICIPAL UTILITIES ANNUAL REPORT OF OPERATIONS - 2017 WATER TREATMENT STATISTICS
WATER TREATED AND PUMPED (BY MONTHS IN 1,000 GALLONS)
Wellfield Wellfield
January 147,250 July 158,930
February 136,140 August 165,160
March 145,330 September 159,510
April 130,580 October 158,680
May 132,190 November 155,070
June 148,810 December 148,680
TOTAL WATER TREATED & PUMPED - KGALS
CHEMICALS USED DURING 2017
Chlorine - pounds 19,689
…………………………
…………………………
…………………………
1,786,330
…………………………
…………………………
…………………………
…………………………
…………………………
…………………………
…………………………
…………………………
…………………………
LOGANSPORT MUNICIPAL UTILITIESANNUAL REPORT OF OPERATIONS – 2017
WATER TREATMENT STATISTICS

www.logansportutilities.com 26
WASTEWATER DEPARTMENT BALANCE SHEETDecember 31, 2017
ASSETS:
CURRENT ASSETS: Cash-Operating ........................................................................... 759,743.86$ Accounts Receivable - Customers .............................................. 266,396.93$ Accounts Receivable - Other....................................................... 37,242.63 303,639.56$ Prepaid Expenses ....................................................................... -$ Inventories................................................................................... 8,748.55$ Unamortized Bond Costs ............................................................ -$
INVESTMENTS: Operating Reserve ...................................................................... 645,543.16$ Construction Fund ....................................................................... 35,875.85 Depreciation Fund ....................................................................... 2,932,614.09 Sinking Fund - Bonds .................................................................. 219.87 Fiscal Agent................................................................................. 17,059.40 Bond Reserve.............................................................................. 264,792.40 Insurance Reserve ...................................................................... 112,490.20 4,008,594.97$ Total Current Assets 5,080,726.94$
FIXED ASSETS: Plant in Service ........................................................................... 34,986,296.83$ Construction Work in Progress.................................................... 808,116.52 Less: Reserve for Depreciation ................................................ 21,508,904.01 14,285,509.34$
TOTAL ASSETS..................................................................... 19,366,236.28$
WASTEWATER DEPARTMENT BALANCE SHEETDecember 31, 2017

www.logansportutilities.com 27
WASTEWATER DEPARTMENT BALANCE SHEET - ContinuedDecember 31, 2017
LIABILITIES:
CURRENT LIABILITIES: Accounts Payable........................................................................ 177,040.91$ Current Portion Long Term Bonds ............................................... 232,000.00$ Accrued Expenses....................................................................... 107,514.95 339,514.95$
LONG TERM DEBT: Long Term Portion Bonds ............................................................ 616,000.00$ 616,000.00$
CONTRIBUTIONS IN AID: Utility Operation ........................................................................... 4,586,290.71$ State Funded ............................................................................... 1,538,451.90 Federal Funded ........................................................................... 8,596,219.17 14,720,961.78$
CAPITAL: Paid in Capital.............................................................................. 856,000.00$ Retained Earnings ....................................................................... 3,183,868.26 Current Year Earnings ................................................................. (527,149.62) 3,512,718.64$
TOTAL LIABILITIES.............................................................. 19,366,236.28$
WASTEWATER DEPARTMENT BALANCE SHEET (Continued)December 31, 2017

www.logansportutilities.com 28
WASTEWATER DEPARTMENT INCOME STATEMENTJanuary 1, 2017 to December 31, 2017
REVENUES: Sewage Earnings ...................................................... 3,978,735.32$ Penalties.................................................................... 37,486.69$ Miscellaneous Non-Operating Revenues.................. 39,022.52$ Interest on Short-Term Notes.................................... 54,550.41$ Taps and Permits ...................................................... 223,889.55$ 4,333,684.49$
EXPENSES: Sewer Line Expense ................................................. 666,991.67$ Sewage Pumping Expense ....................................... 514,659.10$ Sewage Treatment Expense ..................................... 1,895,545.35$ Administrative and General Expense ........................ 405,878.79$ Depreciation .............................................................. 705,779.18$ Payroll Taxes, Group Insurance, Pension................. 644,356.02$ Interest Expense ....................................................... 27,624.00$ 4,860,834.11$
INCOME TRANSFERRED TO SURPLUS..................... (527,149.62)$
WASTEWATER DEPARTMENT INCOME STATEMENTJanuary 1, 2017 to December 31, 2017

www.logansportutilities.com 29
WASTEWATER DEPARTMENT CASH FLOW ANALYSISJanuary 1, 2017 to December 31, 2017
Cash in Bank 01/01/17 804,078.91$
SOURCE OF FUNDS: Net Revenue from Sales ........................................... 4,012,731.76$ Interest from Investments .......................................... 54,550.41$ Contributions in Aid.................................................... 64,482.94$ Miscellaneous Revenues........................................... 262,912.07$ Note Rec. City/County ............................................... -$ Bond Refinancing ...................................................... -$ 4,394,677.18$
Total Cash Available............................................. 5,198,756.09$
USE OF FUNDS: Operating Expenses .................................................. 3,077,196.12$ Administrative Expenses ........................................... 1,050,234.81$ Prepayments & Inventory .......................................... 667.62$ Less: Increase in Payables & Accruals ..................
41,288.60$ 4,086,809.95$ Cash from Operation ............................................
1,111,946.14$ Capital Improvements................................................ 4,928.62$ Transfers ................................................................... 347,273.66$ 352,202.28$
Cash in Bank 12/31/17 .............................................. 759,743.86$
Invested 12/31/17 ...................................................... 759,743.86$
WASTEWATER DEPARTMENT CASH FLOW ANALYSISJanuary 1, 2017 to December 31, 2017
www.logansportutilities.com 30
WASTEWATER DEPARTMENT STATISTICS REPORT JANUARY 1, 2017 TO DECEMBER 31, 2017
PROPERTY AND PLANT VALUATION:
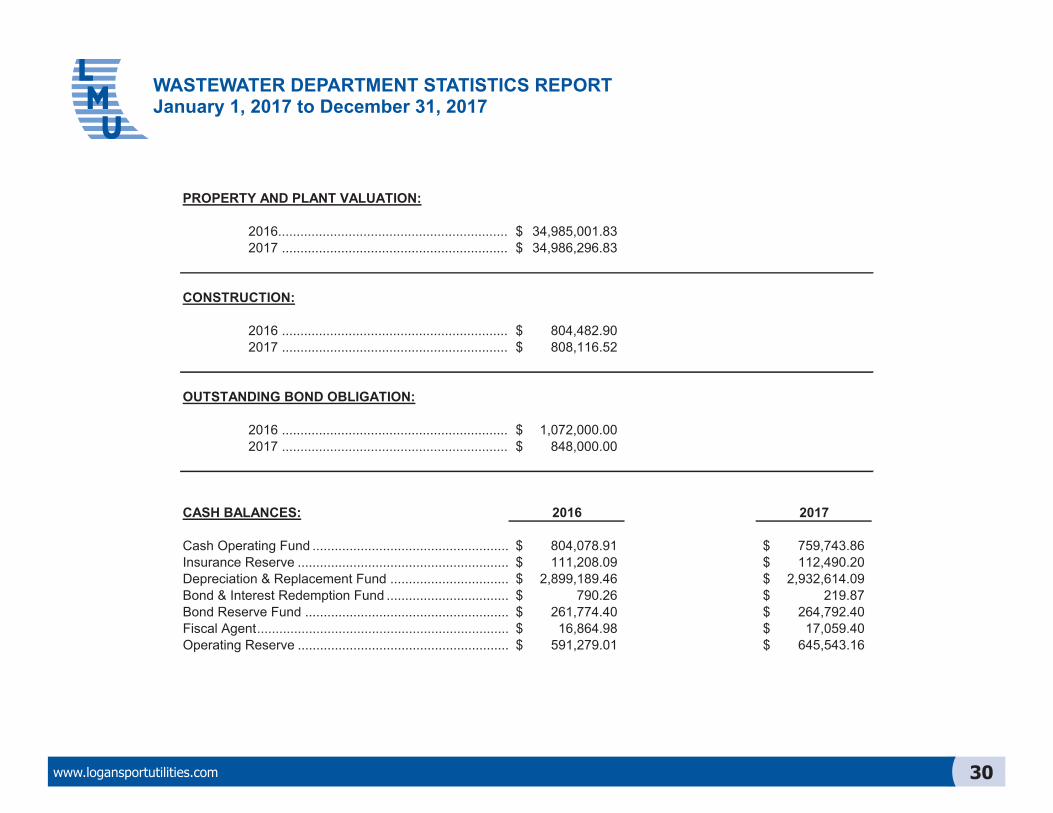
2016.............................................................. 34,985,001.83$2017 ............................................................. 34,986,296.83$
CONSTRUCTION:
2016 ............................................................. 804,482.90$ 2017 ............................................................. 808,116.52$
OUTSTANDING BOND OBLIGATION:
2016 ............................................................. 1,072,000.00$2017 ............................................................. 848,000.00$
CASH BALANCES: 2016 2017
Cash Operating Fund ..................................................... 804,078.91$ 759,743.86$ Insurance Reserve ......................................................... 111,208.09$ 112,490.20$ Depreciation & Replacement Fund ................................ 2,899,189.46$ 2,932,614.09$Bond & Interest Redemption Fund ................................. 790.26$ 219.87$ Bond Reserve Fund ....................................................... 261,774.40$ 264,792.40$ Fiscal Agent.................................................................... 16,864.98$ 17,059.40$ Operating Reserve ......................................................... 591,279.01$ 645,543.16$
WASTEWATER DEPARTMENT STATISTICS REPORTJanuary 1, 2017 to December 31, 2017

www.logansportutilities.com 31
WASTEWATER DEPARTMENT INVESTMENT BALANCESJANUARY 1, 2017 TO DECEMBER 31, 2017
2,899,189.46$ -$
33,424.63$ 33,424.632,932,614.09$
-$ -$ 2,932,614.09$
WASTEWATER SINKING:790.26$
257,670.00$ 1,383.61$ 259,053.61
259,843.87$ 259,624.00$ 259,624.00
219.87$
261,774.40$ -$
3,018.00$ 3,018.00264,792.40$
-$ 0.00264,792.40$
16,864.98$ -$
194.42$ 194.4217,059.40$
-$ 0.0017,059.40$
INSURANCE RESERVE:111,208.09$
-$ 1,282.11$ 1,282.11
112,490.20$ -$ 0.00
112,490.20$
WASTEWATER DEPRECIATION & REPLACEMENT:Balance, January 1, 2017.............................................Transfers ......................................................................Interest Earned............................................................. Total Balance and Receipts.....................................Disbursements .............................................................Balance, December 31, 2017.......................................
Balance, January 1, 2017.............................................Transfers ......................................................................Interest Earned............................................................. Total Balance and Receipts.....................................Disbursements .............................................................Balance, December 31, 2017.......................................
WASTEWATER BOND RESERVE:Balance, January 1, 2017.............................................Transfers ......................................................................Interest Earned............................................................. Total Balance and Receipts.....................................Disbursements .............................................................Balance, December 31, 2017.......................................
WASTEWATER INVESTMENT WITH FISCAL AGENT:Balance, January 1, 2017.............................................Transfers ......................................................................Interest Earned............................................................. Total Balance and Receipts.....................................Disbursements .............................................................Balance, December 31, 2017.......................................
Balance, January 1, 2017.............................................Transfers ......................................................................Interest Earned............................................................. Total Balance and Receipts.....................................Disbursements .............................................................Balance, December 31, 2017.......................................
WASTEWATER DEPARTMENT INVESTMENT BALANCESJanuary 1, 2017 to December 31, 2017

www.logansportutilities.com 32
WASTEWATER DEPARTMENT INVESTMENT BALANCES - CONTINUEDJANUARY 1, 2017 TO DECEMBER 31, 2017
OPERATING RESERVE:Balance, January 1, 2017............................. 591,279.01$ Transfers ...................................................... 46,976.00$ Interest Earned............................................. 7,288.15$ 54,264.15 Total Balance and Receipts..................... 645,543.16$ Disbursements ............................................. -$ -$ Balance, December 31, 2017....................... 645,543.16$
WASTEWATER DEPARTMENT INVESTMENT BALANCES (Continued)January 1, 2017 to December 31, 2017

www.logansportutilities.com 33
LOGANSPORT MUNICIPAL UTILITIESANNUAL REPORT OF OPERATIONS – 2017
WASTEWATER TREATMENT PLANT STATISTICS
LOGANSPORT MUNICIPAL UTILITIES ANNUAL REPORT OF OPERATIONS - 2017 WASTEWATER TREATMENT PLANT STATISTICS
SEWAGE TREATED AND PUMPED (BY MONTHS IN 1,000 GALLONS):
January ………….. July …………..
February ………….. August …………..
March ………….. September …………..
April ………….. October …………..
May ………….. November …………..
June ………….. December …………..
TOTAL GALLONS TREATED = 3,083,290
CHEMICALS USED DURING 2017: PRIMARY BIOSOLIDS REMOVED:
Liquid Chlorine …………… 102,000 pounds 2017…………………….. 11,554,900 gallons
Sulfur Dioxide …………… 114,000 pounds 2016…………………….. 11,090,600 gallons
2015…………………….. 11,339,400 gallons
TOTAL OF SEWAGE TREATED AS FOLLOWS (IN 1,0000 GALLONS):
From City System................................................ 2,451,817From Tyson's System ......................................... 631,473 Total Treated Gallons (2017) ......................... 3,083,290 Total Treated Gallons (2016) ......................... 2,516,510 Total Treated Gallons (2015) ......................... 2,979,570
265,800
216,000247,690
272,400
206,460
294,190
262,570
213,640
226,610
269,400
341,310
267,220

www.logansportutilities.com 34
LOGANSPORT MUNICIPAL UTILITIES ANNUAL REPORT OF OPERATIONS - 2017 INDUSTRIAL PRETREATMENT STATISTICS
NPDES DISCHARGE PERMIT #IN0023604:
Month
January
February
March
April
May
June
July
August
September
October
November
December
Sub-Totals
Total Pretreatment Program Income - $ 65,557.06
32,144.82$ 33,412.24$
7,539.60$
396.82$
2,227.87$
328.12$
1,873.36$
602.09$
9,484.03$
632.83$
2,242.76$
2,774.04$
1,756.67$
Program Fees User Charge Fees
2,286.63$ 33,412.24$
LOGANSPORT MUNICIPAL UTILITIESANNUAL REPORT OF OPERATIONS – 2017INDUSTRIAL PRETREATMENT STATISTICS

www.logansportutilities.com 35
LOGANSPORT MUNICIPAL UTILITIES ANNUAL REPORT OF OPERATIONS - 2017 HAULED-IN WASTE SUMMARY STATISTICS
NPDES DISCHARGE PERMIT #IN0023604:
Month Revenue
January 31,161.63$
February 26,492.68$
March 32,075.63$
April 20,499.43$
May 4,682.42$
June 5,360.61$
July 6,651.99$
August 6,174.26$
September 2,353.52$
October 1,676.80$
November 2,459.16$
December 1,622.32$
TOTALS 141,210.45$
201,949
76,738
3,491,322
54,058
56,020
76,729
224,397
584,140
157,425
175,794
Gallons Received
661,103
670,794
552,175
LOGANSPORT MUNICIPAL UTILITIESANNUAL REPORT OF OPERATIONS – 2017HAULED-IN WASTE SUMMARY STATISTICS

www.logansportutilities.com 36
LOGANSPORT MUNICIPAL UTILITIES ANNUAL REPORT OF OPERATIONS - 2017 POLLUTANT REMOVAL STATISTICS
NPDES DISCHARGE PERMIT #IN0023604:
ANNUAL POLLUTANT TREATMENT REMOVALS AND EFFICIENCIESTotal Annual Volume of Contaminants Received & Treated plus Treatment Efficiencies
Carbonaceous Biochemical Oxygen Demand (CBOD) 1,551,273 pounds
Total Suspended Solids (TSS) 2,840,024 pounds
Total Ammonia 245,817 pounds
Total Phosphorus 186,153 pounds
Total Chromium 227 pounds
Total Copper 1,569 pounds
Total Lead 107 pounds
Total Zinc 3,986 pounds
Total Primary & Secondary Solids 6,153,587 pounds
Total Final Dewatered Biosolids 3,907,995 pounds
CBOD Percent Removal Rate 96%
TSS Percent Removal Rate 91%
Ammonia Percent Removal Rate 90%
U.S. EPA / IDEM COMPLIANCE RATING 99.8%
LOGANSPORT MUNICIPAL UTILITIESANNUAL REPORT OF OPERATIONS – 2017
POLLUTANT REMOVAL STATISTICS

www.logansportutilities.com 37
LOGANSPORT MUNICIPAL UTILITIES ANNUAL REPORT OF OPERATIONS - 2017ANNUAL RUNNING AVERAGE COMPLIANCE STATUS
NPDES DISCHARGE PERMIT #IN0023604:
Parameter Annual Average
Dissolved Oxygen 8.5
Solids - Mass 752
Solids - Conc. 10
Ammonia - Mass 71
Ammonia - Conc. 1.0
CBOD5 - Mass 179
CBOD5 - Conc. 3
Chlorine Residual 0.02
Phosphorus - Conc. 0.8
E. Coli. 4
Chromium 0.003
Copper 0.011
Lead 0.001
Zinc 0.022
*As regulated by the U.S. EPA & the Indiana Department of Environmental Management under the Clean Water Act
NPDES Limit*
6.0 mg/L min.
4,506.3 lbs/day max.
30 mg/L max.
25 mg/L max.
600.8 lbs/day max.
4 mg/L max.
0.04 mg/L max.
1.0 mg/L mo. avg.
3,755.3 lbs/day max.
125 CFU/100 ml max.
0.208 mg/L max.
2.81 mg/L max.
0.033 mg/L max.
0.025 mg/L max.
LOGANSPORT MUNICIPAL UTILITIESANNUAL REPORT OF OPERATIONS – 2017
ANNUAL RUNNING AVERAGE COMPLIANCE STATUS

www.logansportutilities.com 38
LOGANSPORT MUNICIPAL UTILITIES ANNUAL REPORT OF OPERATIONS - 2017 WASTEWATER COLLECTION SYSTEM STATISTICS
MAINTENANCE OPERATIONS: SERVICE CALLS:
Mains Televised, Feet 7,922 Ft. Sewer Mains Located 2,198
Mains Repaired, Feet 24 Ft. Miscellaneous Service Calls 210
Mains Rooted and Rodded, Linear Feet 8,987 Ft.
Sewer Solvent Applied, Pounds 17,500 Lbs.
Grit & Debris Removed, Cubic Yards 330 Yds.
Mains Applied with Root Treatment, Linear Feet 3,594 Ft.
Manholes Raised 52
Manhole Covers and Castings Replaced 24
Manhole Covers Only Replaced 6
Catch Basins Cleaned and/or Repaired 148
Catch Basin Grates Replaced 12
Traps Installed 2 WASTEWATER SYSTEM TOTALS:
New Manholes Installed 1 Total Number of Customers
New Sewer Mains or Force Mains Extended, Feet 0 Miles of Main Operated & Maintained
New Sewer Services Installed 10
7,319
135
LOGANSPORT MUNICIPAL UTILITIESANNUAL REPORT OF OPERATIONS – 2017
WASTEWATER COLLECTION SYSTEM STATISTICS

www.logansportutilities.com 39
LOGANSPORT MUNICIPAL UTILITIES ANNUAL REPORT OF OPERATIONS - 2017 FINAL BIOSOLIDS PRODUCTION STATISTICS
NPDES DISCHARGE PERMIT #IN0023604:
Final Dewatered Biosolids Disposal 503 Reg Worksheet
Biosolids Disposal Method: 100% Landfilled
2017MONTH yd3/day days %TS dry lbs. wet lbs.
JAN 34 28 21.79 327,093 1,501,114FEB 31 24 21.07 247,180 1,173,139MAR 37 26 23.69 359,349 1,516,882APR 33 25 26.82 348,891 1,300,860MAY 33 26 26.02 352,023 1,352,894JUN 24 28 28.45 301,459 1,059,610JUL 29 28 27.75 355,300 1,280,362AUG 25 29 27.50 314,375 1,143,180SEP 26 25 26.68 273,449 1,024,920OCT 31 27 27.29 360,168 1,319,782NOV 31 27 26.86 354,493 1,319,782DEC 29 27 25.45 314,214 1,234,634TOT 320 309 3,907,994 15,227,158AVG 30 27 25.78 325,666 1,268,930MAX 37 29 28.45 360,168 1,516,882MIN 24 24 21.07 247,180 1,024,920
DRY WET
3,907,994 15,227,158
1954.00 7,613.58
1771.49 6,902.47Total Final DWB Produced, Metric Tons:
DEWATERED BIOSOLIDS PRODUCTION DATA
Total Final DWB Produced, Pounds:
Total Final DWB Produced, Tons:
LOGANSPORT MUNICIPAL UTILITIESANNUAL REPORT OF OPERATIONS – 2017
FINAL BIOSOLIDS PRODUCTION STATISTICS

www.logansportutilities.com 40
LOGANSPORT MUNICIPAL UTILITIES ANNUAL REPORT OF OPERATIONS - 2017 COMBINED SEWER OVERFLOW STATISTICS
NPDES DISCHARGE PERMIT #IN0023604
Total CSO CSO CSO CSO CSO CSO CSO CSO CSO CSO CSO CSO CSO CSO CSO TotalMonth Precip #002 #003 #004 #005 #006 #007 #008 #009 #010 #011 #012 #013 #015 #016 #018 #
In. MG's MG's MG's MG's MG's MG's MG's MG's MG's MG's MG's MG's MG's MG's MG's EventsJan 4.12 0.000 8.060 0.000 0.000 0.000 0.000 0.019 0.000 5.633 1.822 8Feb 1.77 0.000 2.955 0.000 0.000 0.000 0.000 0.006 0.008 0.000 1.602 0.706 3Mar 4.49 0.000 0.018 0.001 0.000 0.001 0.000 0.000 0.002 0.018 0.000 7.304 1.925 7Apr 5.33 0.000 1.556 0.003 0.000 0.000 0.000 0.001 0.009 0.000 3.881 1.710 9May 5.54 0.000 6.109 0.050 0.000 0.000 0.000 0.003 0.022 0.000 4.099 3.915 10Jun 6.51 0.000 8.208 0.000 0.000 0.715 0.000 0.000 0.284 0.799 0.000 5.041 8.536 8Jul 8.60 0.000 9.419 0.000 0.000 6.614 0.000 0.000 0.801 3.803 0.000 8.804 12.946 1.486 8Aug 4.48 0.000 4.780 0.000 0.000 0.693 0.000 0.000 0.140 1.469 0.000 3.159 4.647 6Sep 1.46 0.000 1.035 0.000 0.000 0.013 0.000 0.000 0.001 0.276 0.000 0.783 0.800 2Oct 3.95 0.000 1.738 0.000 0.000 0.142 0.000 0.000 0.028 0.571 0.000 2.495 1.489 4Nov 5.68 0.000 5.513 0.000 0.000 3.312 0.000 0.000 0.256 2.250 0.000 6.934 5.679 4Dec 0.25 0.000 0.000 0.000 0.000 0.000 0.000 0.000 0
Total 52.18 0.000 0.000 0.000 49.391 0.054 0.000 11.490 0.000 0.000 1.522 9.244 0.000 49.735 44.175 1.486 69Avg 4.35 0.000 #DIV/0! #DIV/0! 4.490 0.005 0.000 1.641 0.000 0.000 0.152 0.840 0.000 4.521 4.016 0.743 6Max 8.60 0.000 0.000 0.000 9.419 0.050 0.000 6.614 0.000 0.000 0.801 3.803 0.000 8.804 12.946 1.486 10Min 0.25 0.000 0.000 0.000 0.018 0.000 0.000 0.001 0.000 0.000 0.001 0.008 0.000 0.783 0.706 0.000 0Pct 0.0% 0.0% 0.0% 29.6% 0.0% 0.0% 6.9% 0.0% 0.0% 0.9% 5.5% 0.0% 29.8% 26.4% 0.9% 100%
(Normal = 38.48")Annual Totals For 2017:
Discharge Days: 69MG: In Ratio: 3.202
MG: Day Ratio: 2.422
MG's Discharged: 167.097Precip. Inches: 52.18
LOGANSPORT MUNICIPAL UTILITIESANNUAL REPORT OF OPERATIONS – 2017
COMBINED SEWER OVERFLOW STATISTICS
www.logansportutilities.com 41
LOGANSPORT MUNICIPAL UTILITIES ANNUAL REPORT OF OPERATIONS - 2017 WASTEWATER TREATMENT PLANT STATS
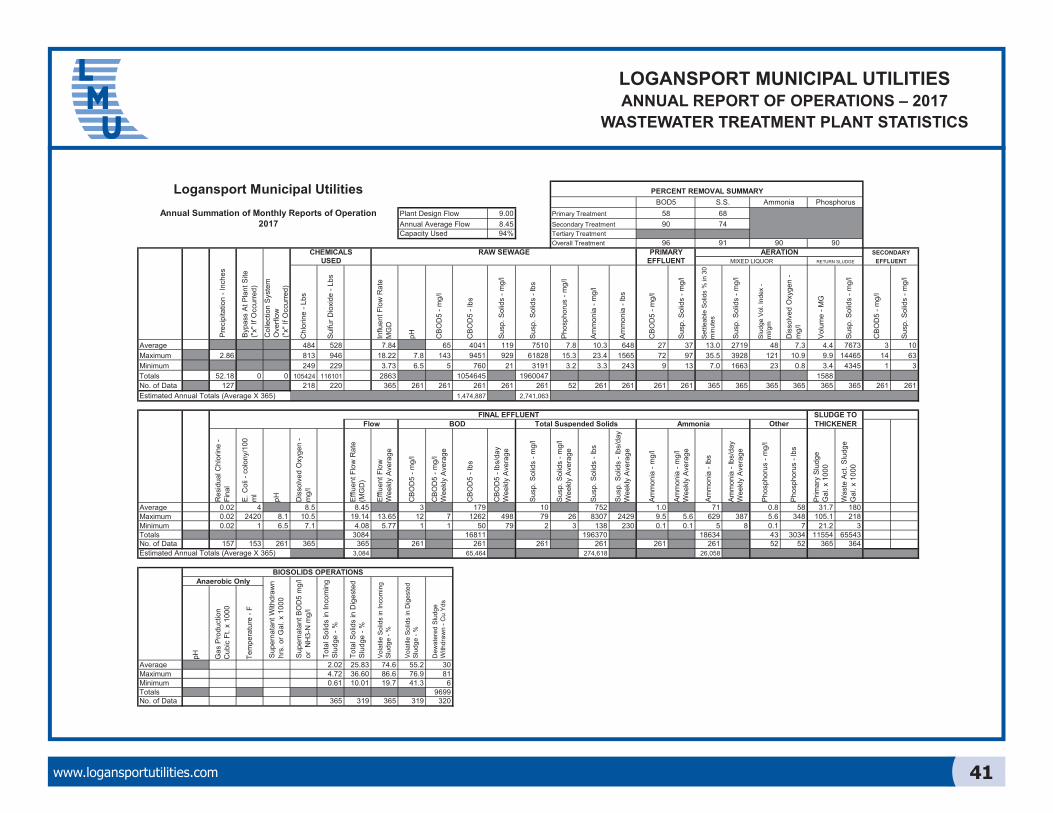
PERCENT REMOVAL SUMMARYBOD5 S.S. Ammonia Phosphorus
Plant Design Flow 9.00 Primary Treatment 58 68Annual Average Flow 8.45 Secondary Treatment 90 74Capacity Used 94% Tertiary Treatment
Overall Treatment 96 91 90 90CHEMICALS RAW SEWAGE PRIMARY AERATION SECONDARY
USED EFFLUENT MIXED LIQUOR RETURN SLUDGE EFFLUENT
Chl
orin
e - L
bs
Sul
fur D
ioxi
de -
Lbs
Influ
ent F
low
Rat
e M
GD
pH CB
OD
5 - m
g/l
CB
OD
5 - l
bs
Sus
p. S
olid
s - m
g/l
Sus
p. S
olid
s - l
bs
Pho
spho
rus
- mg/
l
Am
mon
ia -
mg/
l
Am
mon
ia -
lbs
CB
OD
5 - m
g/l
Sus
p. S
olid
s - m
g/l
Settl
eabl
e So
lids
% in
30
min
utes
Sus
p. S
olid
s - m
g/l
Slud
ge V
ol. I
ndex
- m
l/gm
Dis
solv
ed O
xyge
n -
mg/
l
Vol
ume
- MG
Sus
p. S
olid
s - m
g/l
CB
OD
5 - m
g/l
Sus
p. S
olid
s - m
g/l
Average 484 528 7.84 65 4041 119 7510 7.8 10.3 648 27 37 13.0 2719 48 7.3 4.4 7673 3 10Maximum 2.86 813 946 18.22 7.8 143 9451 929 61828 15.3 23.4 1565 72 97 35.5 3928 121 10.9 9.9 14465 14 63Minimum 249 229 3.73 6.5 5 760 21 3191 3.2 3.3 243 9 13 7.0 1663 23 0.8 3.4 4345 1 3Totals 52.18 0 0 105424 116101 2863 1054645 1960047 1588No. of Data 127 218 220 365 261 261 261 261 261 52 261 261 261 261 365 365 365 365 365 365 261 261Estimated Annual Totals (Average X 365) 1,474,887 2,741,063
SLUDGE TOFlow BOD Total Suspended Solids Ammonia Other THICKENER
Res
idua
l Chl
orin
e -
Fina
l
E. C
oli -
col
ony/
100
ml
pH Dis
solv
ed O
xyge
n -
mg/
l
Effl
uent
Flo
w R
ate
(MG
D)
Effl
uent
Flo
wW
eekl
y A
vera
ge
CB
OD
5 - m
g/l
CB
OD
5 - m
g/l
Wee
kly
Ave
rage
CB
OD
5 - l
bs
CB
OD
5 - l
bs/d
ayW
eekl
y A
vera
ge
Sus
p. S
olid
s - m
g/l
Sus
p. S
olid
s - m
g/l
Wee
kly
Ave
rage
Sus
p. S
olid
s - l
bs
Sus
p. S
olid
s - l
bs/d
ayW
eekl
y A
vera
ge
Am
mon
ia -
mg/
l
Am
mon
ia -
mg/
lW
eekl
y A
vera
ge
Am
mon
ia -
lbs
Am
mon
ia -
lbs/
day
Wee
kly
Ave
rage
Pho
spho
rus
- mg/
l
Pho
spho
rus
- lbs
Prim
ary
Slu
dge
Gal
. x 1
000
Was
te A
ct. S
ludg
eG
al. x
100
0
Average 0.02 4 8.5 8.45 3 179 10 752 1.0 71 0.8 58 31.7 180Maximum 0.02 2420 8.1 10.5 19.14 13.65 12 7 1262 498 79 26 8307 2429 9.5 5.6 629 387 5.6 348 105.1 218Minimum 0.02 1 6.5 7.1 4.08 5.77 1 1 50 79 2 3 138 230 0.1 0.1 5 8 0.1 7 21.2 3Totals 3084 16811 196370 18634 43 3034 11554 65543No. of Data 157 153 261 365 365 261 261 261 261 261 261 52 52 365 364Estimated Annual Totals (Average X 365) 3,084 65,464 274,618 26,058
BIOSOLIDS OPERATIONSAnaerobic Only
pH Gas
Pro
duct
ion
C
ubic
Ft.
x 10
00
Tem
pera
ture
- F
Average 2.02 25.83 74.6 55.2 30Maximum 4.72 36.60 86.6 76.9 81Minimum 0.61 10.01 19.7 41.3 6Totals 9699No. of Data 365 319 365 319 320
Dew
ater
ed S
ludg
e W
ithdr
awn
- Cu
Yds
Tota
l Sol
ids
in In
com
ing
Slu
dge
- %
Col
lect
ion
Sys
tem
O
verfl
ow("
x" If
Occ
urre
d)
FINAL EFFLUENT
Byp
ass
At P
lant
Site
("x"
If O
ccur
red)
Vola
tile
Solid
s in
Inco
min
g Sl
udge
- %
Pre
cipi
tatio
n - I
nche
s
Vola
tile
Solid
s in
Dig
este
d Sl
udge
- %
Logansport Municipal UtilitiesAnnual Summation of Monthly Reports of Operation
2017
Sup
erna
tant
With
draw
n hr
s. o
r Gal
. x 1
000
Sup
erna
tant
BO
D5
mg/
l or
NH
3-N
mg/
l
Tota
l Sol
ids
in D
iges
ted
Slu
dge
- %
LOGANSPORT MUNICIPAL UTILITIESANNUAL REPORT OF OPERATIONS – 2017
WASTEWATER TREATMENT PLANT STATISTICS

www.logansportutilities.com 42
The LMU Wastewater Treatment Plant had another productive year during 2017. More than three billion gallons of waste water were treated at the facility, consisting of over 1.5 million pounds of carbonaceous bio chemical oxygen demand, over 2.8 million pounds of total suspended solids, over 245,000 pounds of ammonia as nitrogen, and over 186,000 pounds of phosphorus. Included in this volume were over 2.9 tons of trace metals. Additionally, over 6.1 million pounds of primary and secondary solids were treated, culminating into over 3.9 million pounds of dewatered biosolids. Fifty-one tons of chlorine were used to disinfect the effluent during the seasonal period, while fifty-seven tons of sulfur dioxide were used to dechlorinate the effluent waters prior to discharge into the Wabash River. E-Coli. levels in the discharge were reduced to four colonies per 100 milliliters, as our annual running average, which is well below the 125 colonies/100ml standard. Treatment removal efficiencies for solids, CBOD, ammonia, and phosphorus were in or near the ninetieth percentile.
The LMU treatment plant also accepted over 3.4 million gallons of hauled-in wastewater,consisting of over 660,000 gallons of septage and over 2.8 million gallons of sanitary landfill leachate waters. This service provided a safe, dependable means of disposal and treatment of wastewater that might other wise pollute our environment.
The LMU WWTP celebrated a 99.8% compliance rating with all regulatory issues. Plant personnel continued another year of high level performance in the operation and maintenance of LMU Wastewater Treatment Plant, O&M of the Tyson Foods pretreatment plant—which happened to treat over 631 million gallons—oversight of fifteen industrial dischargers, analyses of over 16,000 laboratory tests, and the assistance given to our sister utilities, our customers, and the various environmental groups and extended communities.
LOGANSPORT MUNICIPAL UTILITIES WASTEWATER TREATMENT PLANT
ANNUAL REPORT OF OPERATIONS- 2017 -

www.logansportutilities.com 43
STORMWATER DEPARTMENT BALANCE SHEETDecember 31, 2017
ASSETS:
CURRENT ASSETS:Cash-Operating ................................................ 90,344.37$ Accounts Receivable - Customers................... 108,856.02$ Accounts Receivable-Other ............................. -$ 108,856.02$
INVESTMENTS:Construction Fund............................................ 294,328.00$ Depreciation Fund............................................ 1,223,430.40$Sinking Fund-Bonds......................................... 957,560.98$ Operating Reserve........................................... 967,546.60$ Bond Reserve .................................................. 778,623.65$ 4,221,489.63$ Total Current Assets ................................... 4,420,690.02$
FIXED ASSETS:Plant in Service ................................................ 15,629,595.74$Construction Work in Progress ........................ 7,994,704.35$ Less: Reserve for Depreciation ................. 2,634,718.48$ 20,989,581.61$
TOTAL ASSETS ......................................... 25,410,271.63$
STORMWATER DEPARTMENT BALANCE SHEETDecember 31, 2017

www.logansportutilities.com 44
STORMWATER DEPT. BALANCE SHEET-CONTINUED
LIABILITIES:
CURRENT LIABILITIES:Accounts Payable....................................... 201,892.22$ Current Portion Long Term Bonds ............. 697,616.00$ Accrued Expenses ..................................... 1,277.99$ Accrued Interest ........................................ 94,892.61$ 793,786.60$
LONG TERM DEBT:Long Term Portion-Bonds .......................... 12,447,538.00$ 12,447,538.00$
CONTRIBUTIONS IN AID:Utility Operation .......................................... 592,980.04$ State Funded.............................................. 373,387.09$ Federal Funded .......................................... 539,013.00$ 1,505,380.13$
CAPITAL:Paid in Capital ............................................ -$ Retained Earnings ...................................... 9,820,182.01$Current Year Earnings................................ 641,492.67$ 10,461,674.68$
TOTAL LIABILITIES .............................. 25,410,271.63$
December 31, 2017
STORMWATER DEPARTMENT BALANCE SHEET (Continued)December 31, 2017

www.logansportutilities.com 45
STORMWATER DEPARTMENT INCOME STATEMENTJanuary 1, 2017 to December 31, 2017
REVENUES:Earnings .................................................................. 1,442,780.47$ Penalties.................................................................. 21,809.64Miscellaneous Non-Operating Revenue.................. 2,938.65Interest Income........................................................ 37,930.92 1,505,459.68$
EXPENSES:Line Expense........................................................... 100,176.86$ Administrative & General Expense.......................... 220,957.04Depreciation ............................................................ 334,069.89Interest Expense ..................................................... 208,763.22 863,967.01$
INCOME TRANSFERRED TO SURPLUS................................ 641,492.67$
PROPERTY AND PLANT VALUATION:2016......................................................................... 15,629,595.74$ 2017......................................................................... 15,629,595.74$
CONSTRUCTION:2016......................................................................... 7,359,908.15$ 2017......................................................................... 7,994,704.35$
OUTSTANDING BOND OBLIGATION:2016......................................................................... 13,830,984.00$ 2017......................................................................... 13,145,154.00$
CASH BALANCES: 2016 2017Cash Operating Fund ............................................... 190,419.69$ 90,344.37$ Operating Reserve ................................................... 956,518.95$ 967,546.60$ Depreciation & Replacement Fund........................... 1,513,248.02$ 1,223,430.40$ Bond Sinking Fund ................................................... 928,922.52$ 957,560.98$ Bond Reserve Fund.................................................. 585,222.19$ 778,623.65$ Construction Fund .................................................... 309,889.00$ 294,328.00$
STORMWATER DEPARTMENT INCOME STATEMENTJanuary 1, 2017 to December 31, 2017

www.logansportutilities.com 46
STORMWATER DEPARTMENT INVESTMENT BALANCESJANUARY 1, 2017 TO DECEMBER 31, 2017
1,513,248.02$50,000.00$ 17,182.38$ 67,182.38$
1,580,430.40$357,000.00$ 357,000.00$
1,223,430.40$
928,922.52$ 944,328.00$
3,774.06$ 948,102.06$ 1,877,024.58$
919,463.60$ 919,463.60$ 957,560.98$
585,222.19$ 188,865.00$
4,536.46$ 193,401.46$ 778,623.65$
-$ -$ 778,623.65$
956,518.95$ -$
11,027.65$ 11,027.65$ 967,546.60$
-$ -$ 967,546.60$
STORMWATER DEPRECIATION AND REPLACEMENT:Balance, January 1, 2017.........................Transfers ..................................................Interest Earned ......................................... Total Balance and Receipts...................Disbursements..........................................Balance, December 31, 2017 ...................
STORMWATER BOND SINKING:Balance, January 1, 2017.........................Transfers ..................................................Interest Earned ......................................... Total Balance and Receipts...................Disbursements..........................................Balance, December 31, 2017 ...................
STORMWATER BOND RESERVE:Balance, January 1, 2017.........................Transfers ..................................................Interest Earned ......................................... Total Balance and Receipts...................Disbursements..........................................Balance, December 31, 2017 ...................
STORMWATER OPERATING RESERVE:Balance, January 1, 2017.........................Transfers ..................................................Interest Earned ......................................... Total Balance and Receipts...................Disbursements..........................................Balance, December 31, 2017 ...................
STORMWATER DEPARTMENT INVESTMENT BALANCESJanuary 1, 2017 to December 31, 2017

www.logansportutilities.com 47
STORMWATER DEPARTMENT INVESTMENT BALANCES - CONT'D.JANUARY 1, 2017 TO DECEMBER 31, 2017
309,889.00$ -$ -$ -$
309,889.00$ 15,561.00$ 15,561.00$
294,328.00$
CONSTRUCTION FUND BALANCE:Balance, January 1, 2017 ..........................Transfers ....................................................Interest Earned........................................... Total Balance and Receipts.....................Disbursements ...........................................Balance, December 31, 2017 ...................
STORMWATER DEPARTMENT INVESTMENT BALANCES (Continued)January 1, 2017 to December 31, 2017

www.logansportutilities.com 48
LOGANSPORT MUNICIPAL UTILITIES ANNUAL REPORT OF OPERATIONS - 2017 STORMWATER SYSTEM STATISTICS
Stormwater Mains Televised, Feet
Catch Basins/Manholes Rebuilt/Repaired
Mains Cleaned & Rodded, Feet
Grit and Debris Removed, Cubic Feet
Grate Covers & Castings Replaced
Catch Basins Cleaned
Stormwater Lines Repaired, Feet
New Storm Lines Installed, Feet
New Manholes Installed
New Inlets Installed
Outfall Inspections, Testing, Maintenance, Cleaning
Debris Removed from River Banks, Cubic Yards
Illicit Discharge Investigations & Stream Monitoring
Public Hearings/Special Meetings/Educational Presentations
Rule 13 Stormwater Projects Monitored
Annual Precipitation, Inches (38.48 inches per year considered "Normal")
Stormwater Lines Operated & Maintained, Miles
560 Ft.
3
75 Yds.
11
23
3,700 Ft.
0
12
40 Ft.
13
46 x 2 ea.
30 Yds
8
0
20
1
52.18"
LOGANSPORT MUNICIPAL UTILITIESANNUAL REPORT OF OPERATIONS – 2017
STORMWATER SYSTEM STATISTICS

www.logansportutilities.com 49
LOGANSPORT MUNICIPAL UTILITIESANNUAL REPORT OF OPERATIONS – 2017
W-WW-SW DEPARTMENTS SUMMARY
In June 2017, Mr. Jim Jackson, former Water, Wastewater, and Stormwater Manager, celebrated his retirement after more than 37 years of exceptional service to LMU. Throughout his career, Mr. Jackson was directly involved in the planning and implementation of numerous projects that continue to make our utilities run more efficiently. With his retirement, Brian Dewitt was named Wastewater Manager, and Cameron Dillon was named Water Manager.
In 2017, the Water Department had several goals to increase the efficiency of water flow, which in turn gives the consumer higher quality water. One of the main goals was installing a SCADA controlled valve at a river crossing on the south side of Logansport. The completion of the project gave LMU Water Operators the ability to fine tune pressures and flow throughout that portion of the distribution system. Additionally, the Water Department completed one stage of its “Race Street Project,” which involved the abandonment of an old 24-inch water main utilized by the now retired Water Treatment Plant. By doing so, LMU crews also had to relocate the service lines for the residences along Race Street to an existing 24-inch main on the opposite side of the street.
There were several other projects completed by the LMU crews during 2017. Throughout the year, the distribution crew replaced several sections of failing galvanized lines throughout the community. This not only improves flow through the system and reduces water loss due to leaks, but most importantly increases the reliability of service to the consumer. With the help of employees from the Water Department, the distribution crew was able to repaint all of the “Downtown District” fire hydrants and complete several paving projects that involved raising manholes, castings, catch basins, and valve boxes. The crews also completed a massive stormwater project near the intersection of High Street and Davis Road, which involved removing trees, clearing brush, dredging, and redefining an open stormwater drainage ditch. This ditch is the main relief for the area, including the intersection of 24th and North Streets. The project took just over 6 weeks and substantially improved water flow and drainage in the area. All in all, 2017 was a productive and successful year for the Water, Wastewater and Stormwater Departments. With the projects that were completed throughout the year and the projects that were planned and started towards the close of 2017, the pace has been set and we hope to make 2018 just as successful.

LOGANSPORT MUNICIPAL UTILITIESLogansport, Indiana • www.logansportutilities.com