logan city special school queensland state school ... · * caution should be used when comparing...
TRANSCRIPT

Logan City Special School Queensland State School Reporting 2014 School Annual Report
Postal address 133 Wembley Road Logan Central 4114
Phone (07) 3489 6333
Fax (07) 3489 6300
Email [email protected]
Webpages Additional reporting information pertaining to Queensland state schools is located on the My School website and the Queensland Government data website.
Contact person Rod Kirkland - Principal
Principal’s foreword
Introduction
It gives me great pleasure to provide the School Annual Report for Logan City Special School for the 2014 school year.
The focus of this report is to provide parents, staff, students and the wider community with a clear, concise synopsis of our
school and the progress made towards achieving the identified goals for the past year. In 2014, the school retained the goal
for Logan City Special School to be a safe, supportive and stimulating learning environment that supported students to reach
their potential as active and respected citizens in an increasingly digital world.
Success of the 2014 programs was evident in the increased staff, parent and student satisfaction levels in the School Opinion
Survey results. Logan City Special School continued a proud tradition of being a supportive school environment for students
in the school’s care. We are recognised by the wider school community for the provision of comprehensive educational
programs within a nurturing environment.
The school continued its’ commitment to the School-wide Positive Behaviour Support program in 2014, developed a new
vision of ‘Independence Through Learning’ and strongly adhering to the 3 simple rules of We Care, We Communicate, We
Cooperate. Staff worked extremely hard to identify and implement strong data collection to inform whole school decisions
about learning and managing behaviour improvements.
School progress towards its goals in 2014
Strategic Goal: Teaching and Learning Audit recommendations actioned through explicit school strategic focus on:-
Improved Literacy and Numeracy outcomes for students
In 2014 our Teaching and Learning Committee collaboratively reviewed and updated the school Literacy and Numeracy plans,
ensuring they were in line with the Australian Curriculum. They also completed an audit of current physical resources to
ensure appropriate types and levels of Literacy and Numeracy resources were available to support student programs.
Individual Achievement Scales were updated so we can show improvements students are making with their learning.
Senior Schooling Curriculum supporting transition
In 2014 our Deputy Principal, Head of Curriculum and Senior School Teachers continued to explore curriculum options for
students in the final years of schooling at Regional, State and National level. We also continued to develop relationships with
businesses and funded groups within the local area to expand post-school options for students. These partnerships along
with the implementation of the Australian Curriculum have defined our 2014 focus in the area of Senior Schooling
Curriculum.

Improved Health and Wellbeing
We have continued our focus on the Health and Wellbeing of all students and staff, with a continuing focus on resilience in
2014.
School-wide Positive Behaviour Support
Regular data collection and analysis supported the implementation of School-wide Positive Behaviour Support in 2014.
Consolidating class focus lessons around our 3 rules: We Care, We Communicate, We Cooperate allowed us to further embed
these positive social skills across all aspects of daily school life.
Strategic Goal: Appropriate alignment with KLAs / facets of the National Curriculum.
The Teaching and Learning Committee had a strong commitment to interacting with the Australian Curriculum in preparation
for implementation of new subjects in 2014. Feedback was an important part of this process and this took place at all levels,
from Teacher meeting discussions to formal feedback. Staff completed implementation of school-based Australian
Curriculum implementation. The school developed a comprehensive Pedagogy Framework for teaching based on the
‘Dimensions of Teaching and Learning’ (Marzano).
Strategic Goal: Closing the Gap on indigenous and non-indigenous student attendance.
We have worked toward increasing student attendance through the identification of individual family stressors and the
continued development of relationships with families and external support groups within the local community.
Strategic Goal: Implementation of Developing Performance Plans for administrators and teaching staff.
100% of teaching staff (including educational leaders) participated in and completed the process of Developing Performance
Plans. These plans contributed to the organisation of professional development opportunities as well as personal and team
professional reflections activities throughout 2014.
Future outlook
Through a collaborative planning process we have determined our strategic objectives for 2015. These are:
1. Improved literacy outcomes for students 2. Improved numeracy outcomes for students 3. Improved well-being and life skills for students 4. Closing the literacy gap for indigenous students 5. Embedding a school pedagogic framework 6. Implementation of recommendations from the Teaching & Learning Audit 7. Review of Developing Performance Plans for administrators and teaching staff

Our school at a glance
School Profile
Coeducational or single sex: Coeducational
Year levels offered in 2014: Early Childhood - Year 12
Total student enrolments for this school: 155
Total Girls Boys
Enrolment Continuity
(Feb – Nov)
2012 100 25 75 92%
2013 102 25 77 92%
2014 115 32 83 97%
Student counts are based on the Census (August) enrolment collection.
Characteristics of the student body:
Our school is organised into two distinct student bodies: student in years Prep – 12, and students attending the
Early Childhood Developmental Program (ECDP). Students attending the ECDP range in age from birth to 5 years
and attend the program for varying amounts of time across the school week.
Students in Prep – Year 12 are organised into four teams: Junior, Primary, Junior Secondary and Senior. This team
structure recognises the distinct phases of learning and development and promotes a focus upon the smaller group
and individual, ensuring student and staff wellbeing is increased.
Our school caters for the educational needs of students who have a verified impairment which results in them
requiring access to specialised teaching and an alternative, individualised curriculum. All students attending the
Prep – Year 12 program have a verified Intellectual Impairment and a number of students have additional verified
impairments including Autism Spectrum Disorder, Physical Impairment, Visual Impairment and Hearing Impairment.
Our families come from a diverse range of socio-economic backgrounds and a number of our students were born
outside of Australia or of parents recently arrived in Australia, increasing our school’s cultural and socio-economic
diversity. South Africa, South Sea Islands, New Zealand, Cambodia, Republic of the Philippines and Middle East
are some of the places from which our families originated. We also have a number of students of Aboriginal and
Torres Strait Island background.
Average class sizes
Phase
Average Class Size
2012 2013 2014
Prep – Year 3 3 3 4
Year 4 – Year 7 Primary 6
Year 7 Secondary – Year 10 8
Year 11 – Year 12 8
School Disciplinary Absences

# Exclusion is an abbreviated title which reflects suspensions with recommendations for exclusion, which may result in an exclusion or be set aside
through an appeals process.
* Caution should be used when comparing 2014 data with previous years SDA data as amendments to the disciplinary provisions in the Education
(General Provisions) Act 2006, passed in late 2013, created a time series break.
Curriculum offerings
Our distinctive curriculum offerings
In 2014 our curriculum was:
Informed by the Australian Curriculum;
Delivered through the Key Learning Areas;
Strongly focussed on individual student need;
Reported on individual student achievement;
Based on Dimensions of Teaching and Learning (Marzano)
Based on real-life experiences;
Stephanie Alexander Kitchen Garden project complements programs;
Supported by a range of DETE therapists within classrooms;
Individual Curriculum Plans and SET Plan goals to meet individual needs, and;
Work sampling and work experience.
Extra curricula activities
School camps in Junior Secondary & Senior schools
A wide range of excursions to complement learning programs
Sporting calendar of events
Representative teams for touch and soccer at Regional competitions.
Canoeing.
How Information and Communication Technologies are used to assist learning
Our school has a strong commitment to exploring technologies which will assist students to access the
curriculum, as well as technologies which are user-friendly and affordable for families. In 2014 Teachers
were using iPads as a teaching and organisational tool. Staff had specific professional training in the
use of assistive technologies.
Shared teaching spaces utilise Interactive TV’s/Whiteboards, ensuring that all students had regular and
appropriate access to this technology to support their learning.
Teachers also use a wide range of standard commercial technologies, Voice Output Devices and
alternative access equipment to support student learning on a daily basis. These include: Digital
Camera / Video, Big Mac, Techtalk, various switches, alternative keyboards, alternative mouses and
other peripherals.
Disciplinary Absences
Count of Incidents
2012 2013 2014*
Short Suspensions - 1 to 5 days 32 20 8
Long Suspensions - 6 to 20 days 2 0 0
Exclusions# 0 0 0
Cancellations of Enrolment 0 0 0

Social Climate
Continued focus on the enactment of our school motto – ‘Independence Through Learning’ and school
rules – We Care, We Communicate, We Cooperate as part of the daily interactions for staff and
students has helped the school to maintain a positive social climate. A number of key staff provided
ongoing support to parents, students and staff, further increasing the overall care for all at the school.
These staff include a Guidance Officer, a Registered Nurse and a school chaplain.
The Wellness committee incorporates a Harmony Club which continued to meet regularly to support
staff wellness and health and to actively promote a positive and open social climate throughout the
school. This included organisation of social and team building aspects of ongoing activities throughout
the year. Commitment by all Teachers to having a shared Office area (HQ) rather than being isolated in
their classrooms has increased the level of communication within the teaching group and been a key
strategy in ensuring all staff have opportunities to develop meaningful relationships.
The school is part of the Schoolwide Positive Behaviour Support program and had made detailed reviews and implementation of best practice to support students. All students (100%) report that ‘they like being at school’ and 100% of parents believe ‘their child is getting a good education at school’.
Parent, student and staff satisfaction with the school
Performance measure
Percentage of parent/caregivers who agree# that: 2012 2013 2014
their child is getting a good education at school (S2016) 100% 87% 100%
this is a good school (S2035) 100% 95% DW
their child likes being at this school* (S2001) 100% 95% 100%
their child feels safe at this school* (S2002) 93% 91% 100%
their child's learning needs are being met at this school* (S2003) 88% 87% 100%
their child is making good progress at this school* (S2004) 100% 91% 100%
teachers at this school expect their child to do his or her best* (S2005) 100% 91% 100%
teachers at this school provide their child with useful feedback about his or her school work* (S2006)
100% 91% 100%
teachers at this school motivate their child to learn* (S2007) 100% 91% 100%
teachers at this school treat students fairly* (S2008) 94% 91% 100%
they can talk to their child's teachers about their concerns* (S2009) 100% 91% 100%
this school works with them to support their child's learning* (S2010) 100% 91% 100%
this school takes parents' opinions seriously* (S2011) 100% 91% 100%
student behaviour is well managed at this school* (S2012) 94% 91% 100%
this school looks for ways to improve* (S2013) 100% 91% 100%
this school is well maintained* (S2014) 100% 91% 100%
Performance measure
Percentage of students who agree# that: 2012 2013 2014
they are getting a good education at school (S2048) 100% 100%

Performance measure
Percentage of students who agree# that: 2012 2013 2014
they like being at their school* (S2036) 100% 100%
they feel safe at their school* (S2037) 80% 92%
their teachers motivate them to learn* (S2038) 93% 100%
their teachers expect them to do their best* (S2039) 93% 100%
their teachers provide them with useful feedback about their school work* (S2040) 93% 92%
teachers treat students fairly at their school* (S2041) 100% 100%
they can talk to their teachers about their concerns* (S2042) 93% 100%
their school takes students' opinions seriously* (S2043) 93% 92%
student behaviour is well managed at their school* (S2044) 53% 100%
their school looks for ways to improve* (S2045) 93% 100%
their school is well maintained* (S2046) 100% 100%
their school gives them opportunities to do interesting things* (S2047) 93% 92%
Performance measure
Percentage of school staff who agree# that: 2012 2013 2014
they enjoy working at their school (S2069) 98% 89%
they feel that their school is a safe place in which to work (S2070) 96% 93%
they receive useful feedback about their work at their school (S2071) 88% 81%
students are encouraged to do their best at their school (S2072) 94% 100%
students are treated fairly at their school (S2073) 96% 88%
student behaviour is well managed at their school (S2074) 94% 85%
staff are well supported at their school (S2075) 90% 80%
their school takes staff opinions seriously (S2076) 88% 81%
their school looks for ways to improve (S2077) 98% 100%
their school is well maintained (S2078) 80% 85%
their school gives them opportunities to do interesting things (S2079) 86% 88%
* Nationally agreed student and parent/caregiver items were incorporated in the School Opinion Survey in 2012.
# ‘Agree’ represents the percentage of respondents who Somewhat Agree, Agree or Strongly Agree with the statement. Due to a major
redevelopment of the surveys (parent/caregiver and student in 2012; staff in 2013), comparisons with results from previous years are not
recommended.
DW = Data withheld to ensure confidentiality.
Involving parents in their child’s education
To ensure that parents remain fully informed about their child’s progress at school the following
strategies are employed:
Communication books utilised between school and home to inform of significant events which may

occur in either setting.
Fortnightly newsletter.
Requested parental involvement at special day events – Fun Runs, Harmony Day, Sports Day.
Parent / carer support group for parents of students.
Information sessions for parents of students in ECDP program.
Requested parental involvement at student Individual Planning meetings (ICPs / SETPlans).
Regular P and C meetings widely advertised.
Reducing the school’s environmental footprint
Continued staff and student education about personal responsibilities regarding the school and individual environmental footprints, as well as application for additional solar panels and a full investigation into excess water usage has enabled us to reduce both our water usage and electricity consumption, thus reducing our environmental footprint. We are particularly pleased with the reduction trends evident.
Environmental footprint indicators
Years Electricity
kWh Water kL
2011-2012 90,019 1,146
2012-2013 101,837 1,162
2013-2014 87,724 1,168
The consumption data is compiled from sources including ERM, Ergon reports and utilities data entered into OneSchool by each school. The data provides an indication of the consumption trend in each of the utility categories which impact on the school’s environmental footprint.
Our staff profile
Staff composition, including Indigenous staff
2014 Workforce Composition Teaching Staff* Non-teaching
Staff Indigenous Staff
Headcounts 40 31 <5
Full-time equivalents 33 21 <5
Qualification of all teachers
Masters 7
Doctorate 0
Total 53
0 0 00
2

*Teaching staff includes School Leaders
**Graduate Diploma etc. includes Graduate Diploma, Bachelor Honours Degree, and Graduate Certificate.
Expenditure on and teacher participation in professional development
The total funds expended on teacher professional development in 2014 were $30,000.
The major professional development initiatives are as follows:
Literacy and Numeracy training
OneSchool Training
School Wide Positive Behaviour Support focus team training
Australian Curriculum
Pedagogic Framework
Transition to Post-School
Curriculum Risk Management
Specialised Health procedures
Asthma Management
Asbestos management
Management of Epilepsy
Developing Performance Framework
Workplace Health and Safety - including My HR WHS
My HR
OnePortal
Average staff attendance 2012 2013 2014
Staff attendance for permanent and temporary staff and school leaders. 96% 96% 96%
Proportion of staff retained from the previous school year
From the end of the previous school year, 96% of staff was retained by the school for the entire 2014 school year.

School income broken down by funding source
Performance of our students
Key student outcomes
Student attendance 2012 2013 2014
The overall attendance rate for the students at this school (shown as a percentage). 87% 87% 87%
The overall attendance rate in 2014 for all Queensland Special schools was 89%.
Student attendance rate for each year level (shown as a percentage)
Year 1 Year 2 Year 3 Year 4 Year 5 Year 6 Year 7 Year 8 Year 9 Year 10
Year 11
Year 12
2012
2013
2014
DW = Data withheld to ensure confidentiality.
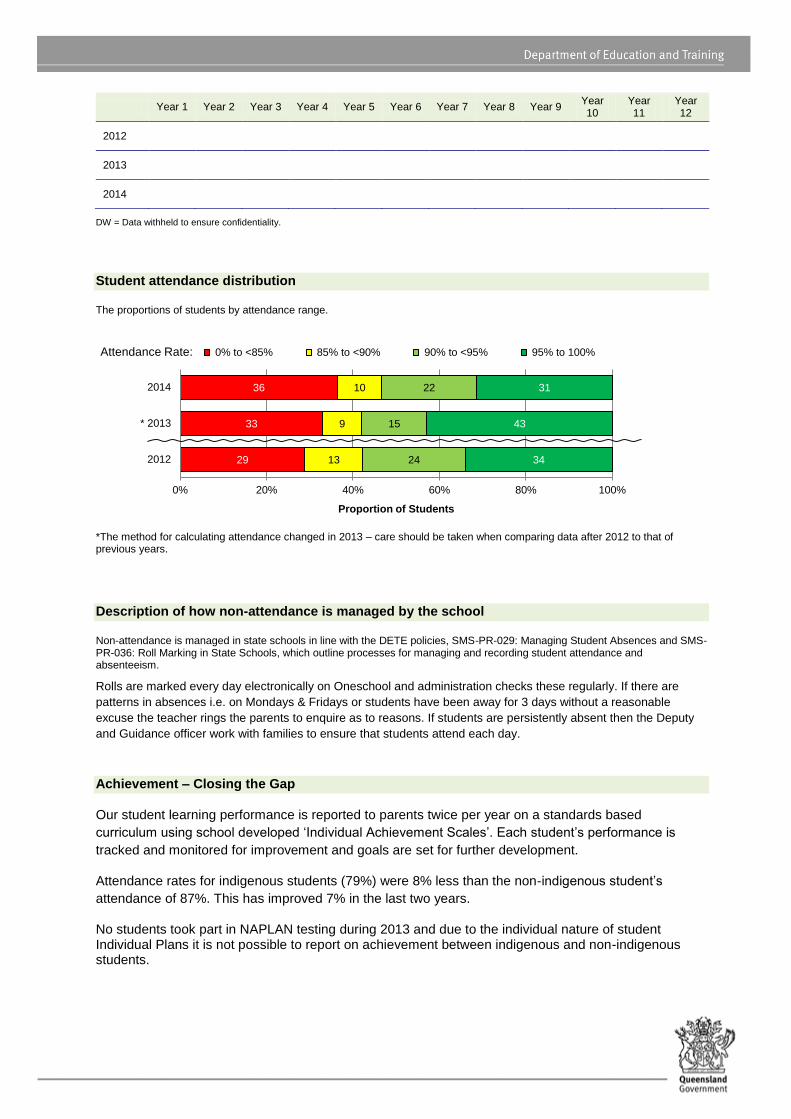
Student attendance distribution
The proportions of students by attendance range.
29
33
36
13
9
10
24
15
22
34
43
31
0% 20% 40% 60% 80% 100%
2012
* 2013
2014
Proportion of Students
Attendance Rate: 0% to <85% 85% to <90% 90% to <95% 95% to 100%
*The method for calculating attendance changed in 2013 – care should be taken when comparing data after 2012 to that of previous years.
Description of how non-attendance is managed by the school
Non-attendance is managed in state schools in line with the DETE policies, SMS-PR-029: Managing Student Absences and SMS-PR-036: Roll Marking in State Schools, which outline processes for managing and recording student attendance and absenteeism.
Rolls are marked every day electronically on Oneschool and administration checks these regularly. If there are
patterns in absences i.e. on Mondays & Fridays or students have been away for 3 days without a reasonable
excuse the teacher rings the parents to enquire as to reasons. If students are persistently absent then the Deputy
and Guidance officer work with families to ensure that students attend each day.
Achievement – Closing the Gap
Our student learning performance is reported to parents twice per year on a standards based
curriculum using school developed ‘Individual Achievement Scales’. Each student’s performance is
tracked and monitored for improvement and goals are set for further development.
Attendance rates for indigenous students (79%) were 8% less than the non-indigenous student’s
attendance of 87%. This has improved 7% in the last two years.
No students took part in NAPLAN testing during 2013 and due to the individual nature of student Individual Plans it is not possible to report on achievement between indigenous and non-indigenous students.

Outcomes for our Year 12 cohorts 2012 2013 2014
Number of students receiving a Senior Statement 6 15 4
Number of students awarded a Queensland Certificate of Individual Achievement. 6 15 4
Number of students receiving an Overall Position (OP) 0 0 0
Number of students who are completing/continuing a School-based Apprenticeship or Traineeship (SAT).
0 0 0
Number of students awarded one or more Vocational Educational Training (VET) qualifications (incl. SAT).
0 4 0
Number of students awarded an Australian Qualification Framework Certificate II or above.
0 0 0
Number of students awarded a Queensland Certificate of Education (QCE) at the end of Year 12.
0 0 0
Number of students awarded an International Baccalaureate Diploma (IBD). 0 0 0
Percentage of OP/IBD eligible students with OP 1-15 or an IBD.
Percentage of Year 12 students who are completing or completed a SAT or were awarded one or more of the following: QCE, IBD, VET qualification.
0% 27% 0%
Percentage of Queensland Tertiary Admissions Centre (QTAC) applicants receiving an offer.
As at 19 February 2015. The above values exclude VISA students.
As at 19 February 2015. The above values exclude VISA students.
As at 19 February 2015. The above values exclude VISA students.
Apparent retention rates Year 10 to Year 12 2012 2013 2014
Year 12 student enrolment as a percentage of the Year 10 student cohort.
Overall Position Bands (OP)
Number of students in each Band for OP 1 to 25
Years OP 1-5 OP 6-10 OP 11-15 OP 16-20 OP 21-25
2012 0 0 0 0 0
2013 0 0 0 0 0
2014 0 0 0 0 0
Vocational Educational Training qualification (VET)
Number of students completing qualifications under Australian Qualification Framework (AQF)
Years Certificate I Certificate II Certificate III or above
2012 0 0 0
2013 4 0 0
2014 0 0 0

Some students are accessing certificate and ASDAN learning at local high schools.
Post-school destination information
At the time of publishing this School Annual Report, the results of the 2014 post-school destinations survey, Next Step – Student Destination Report (2013 Year 12 cohort) for the school were not available. Information about these post-school destinations of our students will be uploaded to the school’s website in September.
Early school leavers information
The destinations of young people who left the school in Years 10, 11 and prior to completing Year 12.
There were no students who we believe left school early in 2014.