local wib plan labor force analysis - monterey …€¦ · · 2016-09-14presents the current and...
TRANSCRIPT

LOCAL WIB PLAN
LABOR FORCE ANALYSIS
MAY 2, 2013
Prepared for:
MONTEREY COUNTY WORKFORCE INVESTMENT BOARD
Submitted by:
APPLIED DEVELOPMENT ECONOMICS, INC. 255 Ygnacio Valley Road, Suite 200 Walnut Creek, CA 94596
925.934.8712 www.adeusa.com

A p p l i e d D e v e l o p m e n t E c o n o m i c s

A p p l i e d D e v e l o p m e n t E c o n o m i c s
TTAABBLLEE OOFF CCOONNTTEENNTTSS
INTRODUCTION ........................................................................................... 2
LOCAL ECONOMIC CONDITIONS ........................................................................ 5
KEY DEMOGRAPHIC GROUPS ............................................................................. 9
EMPLOYMENT AND OCCUPATION PROJECTIONS ................................................... 12
APPENDIX A: ........................................................................................... 40


A p p l i e d D e v e l o p m e n t E c o n o m i c s | P a g e 1

A p p l i e d D e v e l o p m e n t E c o n o m i c s | P a g e 2
IINNTTRROODDUUCCTTIIOONN AANNDD SSUUMMMMAARRYY
In this labor force analysis report, Applied Development Economics (ADE) analyzes the latest
employment trends, projections, occupational staffing patterns for jobs in Monterey County. This
report includes 2012 to 2017 employment data by detailed North American Industry Classification
System (NAICS) codes from the Economic Modeling Specialists Intl. (EMSI) dataset. The report is
intended to assist the Monterey County WIB to prepare its Five-Year Local Plan. This report includes
the following sections:
Assessment of Current Economic Conditions. Monterey County was significantly affected by
the Great Recession and has had a slow recovery from the substantial drops in employment that
occurred since 2008.
Description of certain population groups and their employment status. This chapter
reports the number of employed persons based on their race, ethnicity, and age. In addition,
the American Community Survey (ACS) provides the number of veterans in labor force, and
their share of employment. The purpose of this section is to identify the employment related
needs of these sub-population groups. An ACS 5-year estimate of 2007-2011 provides data
about the size of the mentioned groups and their employment share.
Projection of economic trends between 2012 and 2017. This chapter provides
employment information that analyzes industrial and occupational trends at the regional scale.
This section focuses primarily on major industry clusters such as Agriculture, Tourism, and
Education. In addition to these major job sectors, other employment sources that are projected
to increase their employment levels between 2012 and 2017 are presented. For each industry a
comprehensive list of occupations is included. This cross tabulation of industry and occupation
presents the current and projected staffing pattern for the time frame of 2012 to 2017.
Description of the employment and workforce data and review of the analysis methodology.
As part of the Economic Strategic Plan process in late 2011, ADE completed a labor force analysis for
the County of Monterey which identified key career pathways that would be in demand as the major
industry clusters in the County expand. The four “pillars” of the County economy are agreed to be
agriculture, tourism, educational institutions and research, and local businesses, primarily in the retail
sector. In order to complete the present Local Workforce Development Plan, this report provides an
analysis of projected employment trends between 2012 and 2017, based on data from EMSI. The
analysis addresses leading the industry clusters in the county both in terms of total job growth and
also occupational demand within each industry component of the clusters.
Summary of Projected Job Opportunities and Training Resources. The analysis addresses
projected job opportunities for the major industry clusters in Monterey County: Agriculture, Tourism
and Education, as well as other growth industries over the next five years, particularly health care.

A p p l i e d D e v e l o p m e n t E c o n o m i c s | P a g e 3
The table below summarizes the overall growth job growth for each cluster and selected high demand
occupations.
There are a number of training providers that can help to address the development of the workforce to
fill these future jobs. Based on the Eligible Training Provider List, the following is a selection of existing
programs.
TOURISM AND HOSPITALITY
Monterey Peninsula College
Shoreline Workforce Development Services
International Bartender School
EDUCATION
CSU Monterey Bay
Chapman University
SUMMARY OF MAJOR OCCUPATIONAL GROWTH OPPORTUNITIES
Cluster Occupation
Projected Growth
2012-2017 Tourism and Hospitality 1,528
Food preparers/cooks 751
Maids/desk clerks 175
Lodging Mgrs/event planners 21
Education 625
Teachers 456
Agriculture* 5,300
Farmworkers 2,898
Graders/sorters/packers 303
Managers and supervisors 230
Equipment operators/mechanics 345
Processing machine operators 70
Health and Social Assistance 1,313
Home health aids 186
Registered nurses/LVNs, nursing aids 226
Medical and dental assistants 38 Source: ADE, based on EMSI projections.
* Not counting projected loss of jobs in the agriculture support sector.

A p p l i e d D e v e l o p m e n t E c o n o m i c s | P a g e 4
AGRICULTURE AND DISTRIBUTION
Hartnell Community College
Coastal Trucking
Mission Trails ROP
Center for Employment Training
HEALTH CARE
Boston Reed
Center for Employment Training
Central Coast College
Heald College School of Business
Mission Trails ROP
Monterey Peninsula College
Pacific Grove Adult Education
Salinas Adult School
Soledad ROP
The Spot
RECOMMENDED ADDITIONAL STEPS TO PREPARE THE LOCAL WORKFORCE PLAN
Based on the available data, it is difficult to fully identify the occupational and training gaps for specific
labor force populations in the County. We would recommend the following steps to close these gaps
with the existing training providers in Monterey County.
1. Compile information about the occupations and work history of unemployed individuals in the
county, in order to determine what skills gaps may exist in this population segment relative
to projected future job opportunities.
2. Review the descriptions of demographic groups contained in this report with social service
agencies and training providers who work with these groups, to gain input on the particular
challenges associated with preparing individuals within each group for available employment
opportunities. The relevant social and demographic groups include, in particular, veterans,
the disabled, youth and older workers, as well as non-white ethnic groups and non-English
speakers.
3. Review the projected job opportunities with relevant training providers and employers in
these industries to ascertain the true availability of training programs and resources to meet
these needs. Develop a plan to address any identified gaps in straining services.
A p p l i e d D e v e l o p m e n t E c o n o m i c s | P a g e 5
LLOOCCAALL EECCOONNOOMMIICC CCOONNDDIITTIIOONNSS
EMPLOYMENT TRENDS
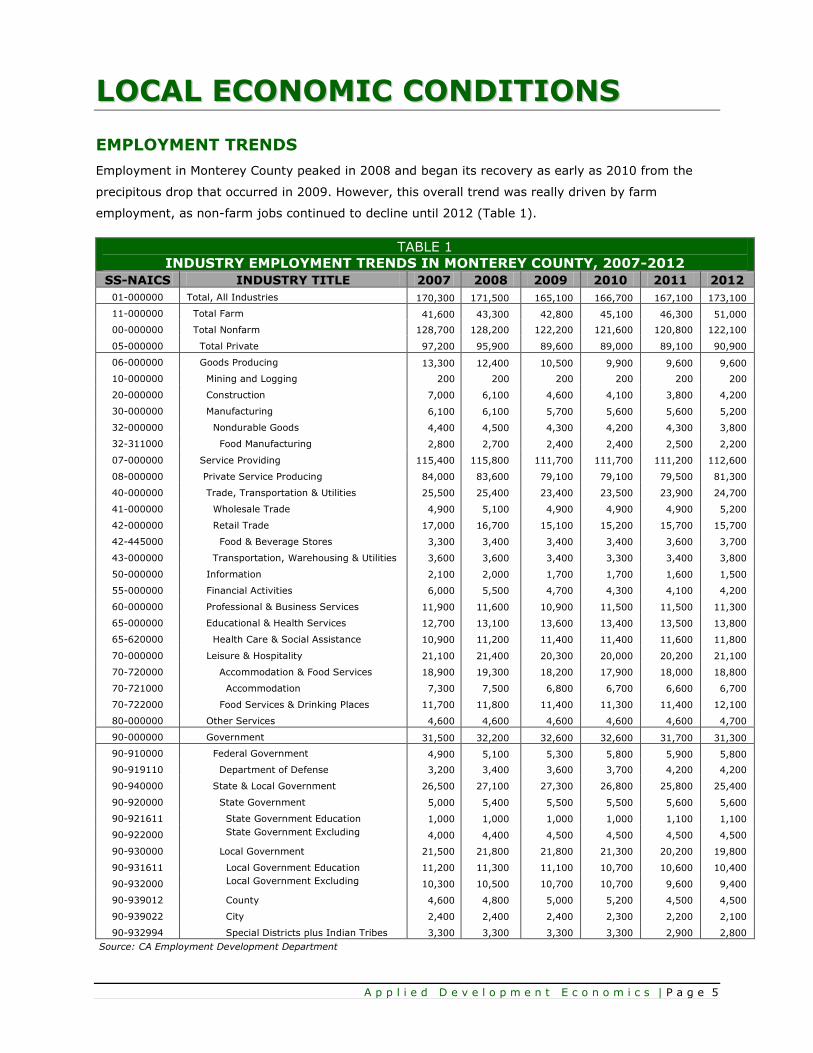
Employment in Monterey County peaked in 2008 and began its recovery as early as 2010 from the
precipitous drop that occurred in 2009. However, this overall trend was really driven by farm
employment, as non-farm jobs continued to decline until 2012 (Table 1).
TABLE 1
INDUSTRY EMPLOYMENT TRENDS IN MONTEREY COUNTY, 2007-2012
SS-NAICS INDUSTRY TITLE 2007 2008 2009 2010 2011 2012
01-000000 Total, All Industries 170,300 171,500 165,100 166,700 167,100 173,100
11-000000 Total Farm 41,600 43,300 42,800 45,100 46,300 51,000
00-000000 Total Nonfarm 128,700 128,200 122,200 121,600 120,800 122,100
05-000000 Total Private 97,200 95,900 89,600 89,000 89,100 90,900
06-000000 Goods Producing 13,300 12,400 10,500 9,900 9,600 9,600
10-000000 Mining and Logging 200 200 200 200 200 200
20-000000 Construction 7,000 6,100 4,600 4,100 3,800 4,200
30-000000 Manufacturing 6,100 6,100 5,700 5,600 5,600 5,200
32-000000 Nondurable Goods 4,400 4,500 4,300 4,200 4,300 3,800
32-311000 Food Manufacturing 2,800 2,700 2,400 2,400 2,500 2,200
07-000000 Service Providing 115,400 115,800 111,700 111,700 111,200 112,600
08-000000 Private Service Producing 84,000 83,600 79,100 79,100 79,500 81,300
40-000000 Trade, Transportation & Utilities 25,500 25,400 23,400 23,500 23,900 24,700
41-000000 Wholesale Trade 4,900 5,100 4,900 4,900 4,900 5,200
42-000000 Retail Trade 17,000 16,700 15,100 15,200 15,700 15,700
42-445000 Food & Beverage Stores 3,300 3,400 3,400 3,400 3,600 3,700
43-000000 Transportation, Warehousing & Utilities 3,600 3,600 3,400 3,300 3,400 3,800
50-000000 Information 2,100 2,000 1,700 1,700 1,600 1,500
55-000000 Financial Activities 6,000 5,500 4,700 4,300 4,100 4,200
60-000000 Professional & Business Services 11,900 11,600 10,900 11,500 11,500 11,300
65-000000 Educational & Health Services 12,700 13,100 13,600 13,400 13,500 13,800
65-620000 Health Care & Social Assistance 10,900 11,200 11,400 11,400 11,600 11,800
70-000000 Leisure & Hospitality 21,100 21,400 20,300 20,000 20,200 21,100
70-720000 Accommodation & Food Services 18,900 19,300 18,200 17,900 18,000 18,800
70-721000 Accommodation 7,300 7,500 6,800 6,700 6,600 6,700
70-722000 Food Services & Drinking Places 11,700 11,800 11,400 11,300 11,400 12,100
80-000000 Other Services 4,600 4,600 4,600 4,600 4,600 4,700
90-000000 Government 31,500 32,200 32,600 32,600 31,700 31,300
90-910000 Federal Government 4,900 5,100 5,300 5,800 5,900 5,800
90-919110 Department of Defense 3,200 3,400 3,600 3,700 4,200 4,200
90-940000 State & Local Government 26,500 27,100 27,300 26,800 25,800 25,400
90-920000 State Government 5,000 5,400 5,500 5,500 5,600 5,600
90-921611 State Government Education 1,000 1,000 1,000 1,000 1,100 1,100
90-922000 State Government Excluding
Education 4,000 4,400 4,500 4,500 4,500 4,500
90-930000 Local Government 21,500 21,800 21,800 21,300 20,200 19,800
90-931611 Local Government Education 11,200 11,300 11,100 10,700 10,600 10,400
90-932000 Local Government Excluding
Education 10,300 10,500 10,700 10,700 9,600 9,400
90-939012 County 4,600 4,800 5,000 5,200 4,500 4,500
90-939022 City 2,400 2,400 2,400 2,300 2,200 2,100
90-932994 Special Districts plus Indian Tribes 3,300 3,300 3,300 3,300 2,900 2,800
Source: CA Employment Development Department
A p p l i e d D e v e l o p m e n t E c o n o m i c s | P a g e 6
The sectors most affected by the recession were Construction, Financial Activities, and Retail. The
County’s tourism cluster also experienced a significant slow-down. The Construction and Financial
sectors gained about 400 jobs and 100 jobs, respectively, in 2012 but remain well below pre-recession
levels. The retail sector gained 50 jobs in 2011 but then remained flat this past year. The leisure and
hospitality sector regained its job levels from 2007, led by food services with a big gain in 2012, but is
still 300 jobs below its pre-recession level.
As mentioned above, farm labor declined in 2009 but then has been growing every year since then.
However, food processing employment lost 300 jobs in 2012 after modest increases through the
recession years. Total manufacturing jobs in the County have still not shown an annual increase since
2008.
Contradicting all other employment trends, the Health Care and Social Assistance sector has added
jobs or remained steady every year. As noted later in the report, substantial employment growth is
projected to continue in health care. Similarly, Federal Government employment has grown steadily in
Monterey County in recent years and is projected to continue adding jobs. Local and State government
declined significantly as a result of falling tax revenues, but now are projected to recover some of
those jobs over the next five years.
POPULATION AND LABOR FORCE
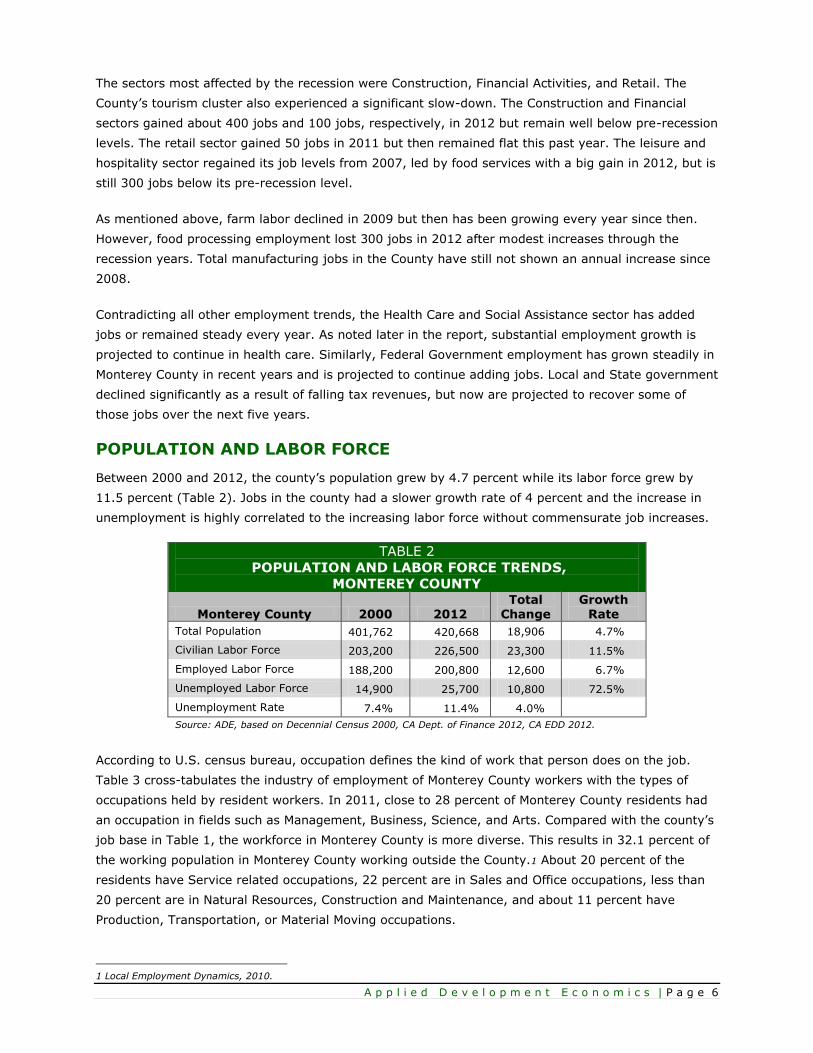
Between 2000 and 2012, the county’s population grew by 4.7 percent while its labor force grew by
11.5 percent (Table 2). Jobs in the county had a slower growth rate of 4 percent and the increase in
unemployment is highly correlated to the increasing labor force without commensurate job increases.
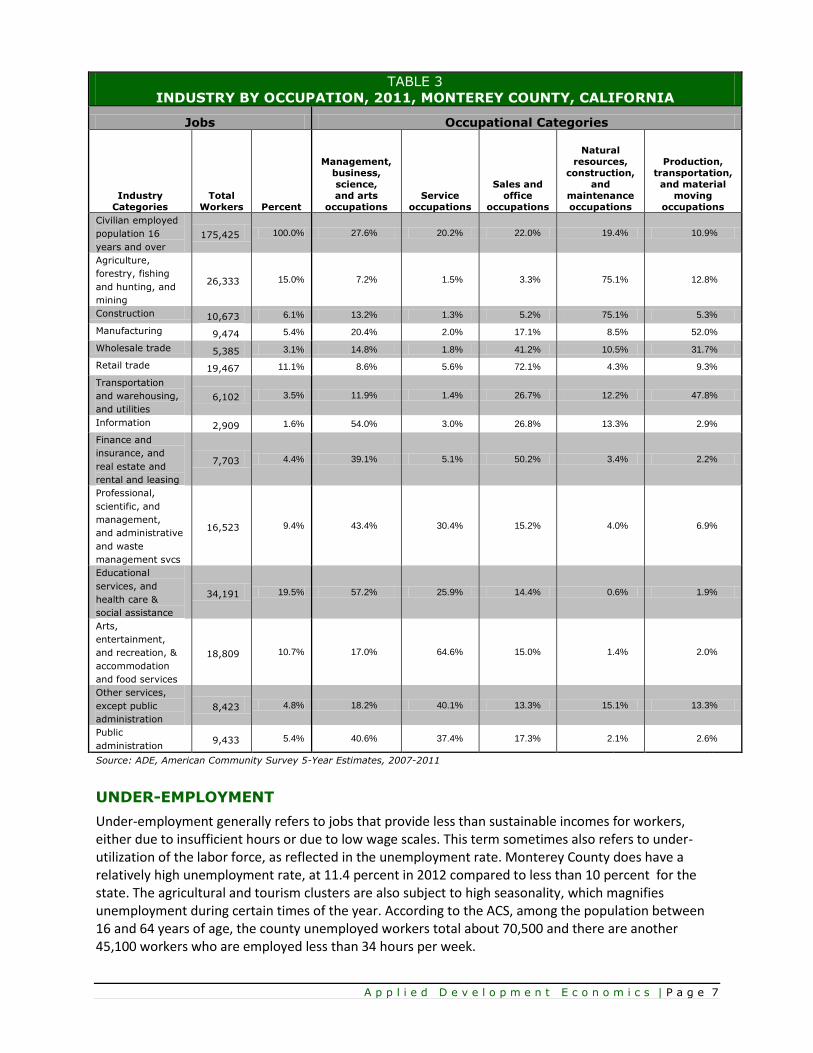
According to U.S. census bureau, occupation defines the kind of work that person does on the job.
Table 3 cross-tabulates the industry of employment of Monterey County workers with the types of
occupations held by resident workers. In 2011, close to 28 percent of Monterey County residents had
an occupation in fields such as Management, Business, Science, and Arts. Compared with the county’s
job base in Table 1, the workforce in Monterey County is more diverse. This results in 32.1 percent of
the working population in Monterey County working outside the County.1 About 20 percent of the
residents have Service related occupations, 22 percent are in Sales and Office occupations, less than
20 percent are in Natural Resources, Construction and Maintenance, and about 11 percent have
Production, Transportation, or Material Moving occupations.
1 Local Employment Dynamics, 2010.
TABLE 2
POPULATION AND LABOR FORCE TRENDS,
MONTEREY COUNTY
Monterey County 2000 2012 Total
Change Growth
Rate
Total Population 401,762 420,668 18,906
4.7%
Civilian Labor Force 203,200 226,500 23,300 11.5%
Employed Labor Force 188,200 200,800 12,600 6.7%
Unemployed Labor Force 14,900 25,700 10,800 72.5%
Unemployment Rate 7.4% 11.4% 4.0%
Source: ADE, based on Decennial Census 2000, CA Dept. of Finance 2012, CA EDD 2012.
A p p l i e d D e v e l o p m e n t E c o n o m i c s | P a g e 7
TABLE 3
INDUSTRY BY OCCUPATION, 2011, MONTEREY COUNTY, CALIFORNIA
Jobs Occupational Categories
Industry
Categories
Total
Workers Percent
Management,
business,
science,
and arts
occupations
Service
occupations
Sales and
office
occupations
Natural
resources,
construction,
and
maintenance
occupations
Production,
transportation,
and material
moving
occupations
Civilian employed
population 16
years and over
175,425 100.0% 27.6% 20.2% 22.0% 19.4% 10.9%
Agriculture,
forestry, fishing
and hunting, and
mining
26,333 15.0% 7.2% 1.5% 3.3% 75.1% 12.8%
Construction 10,673 6.1% 13.2% 1.3% 5.2% 75.1% 5.3%
Manufacturing 9,474 5.4% 20.4% 2.0% 17.1% 8.5% 52.0%
Wholesale trade 5,385 3.1% 14.8% 1.8% 41.2% 10.5% 31.7%
Retail trade 19,467 11.1% 8.6% 5.6% 72.1% 4.3% 9.3%
Transportation
and warehousing,
and utilities
6,102 3.5% 11.9% 1.4% 26.7% 12.2% 47.8%
Information 2,909 1.6% 54.0% 3.0% 26.8% 13.3% 2.9%
Finance and
insurance, and
real estate and
rental and leasing
7,703 4.4% 39.1% 5.1% 50.2% 3.4% 2.2%
Professional,
scientific, and
management,
and administrative
and waste
management svcs
16,523 9.4% 43.4% 30.4% 15.2% 4.0% 6.9%
Educational
services, and
health care &
social assistance
34,191 19.5% 57.2% 25.9% 14.4% 0.6% 1.9%
Arts,
entertainment,
and recreation, &
accommodation
and food services
18,809 10.7% 17.0% 64.6% 15.0% 1.4% 2.0%
Other services,
except public
administration
8,423 4.8% 18.2% 40.1% 13.3% 15.1% 13.3%
Public
administration 9,433 5.4% 40.6% 37.4% 17.3% 2.1% 2.6%
Source: ADE, American Community Survey 5-Year Estimates, 2007-2011
UNDER-EMPLOYMENT
Under-employment generally refers to jobs that provide less than sustainable incomes for workers, either due to insufficient hours or due to low wage scales. This term sometimes also refers to under-utilization of the labor force, as reflected in the unemployment rate. Monterey County does have a relatively high unemployment rate, at 11.4 percent in 2012 compared to less than 10 percent for the state. The agricultural and tourism clusters are also subject to high seasonality, which magnifies unemployment during certain times of the year. According to the ACS, among the population between 16 and 64 years of age, the county unemployed workers total about 70,500 and there are another 45,100 workers who are employed less than 34 hours per week.

A p p l i e d D e v e l o p m e n t E c o n o m i c s | P a g e 8
A p p l i e d D e v e l o p m e n t E c o n o m i c s | P a g e 9
KKEEYY DDEEMMOOGGRRAAPPHHIICC GGRROOUUPPSS
POPULATION COUNT FOR EMPLOYED POPULATION GROUPS
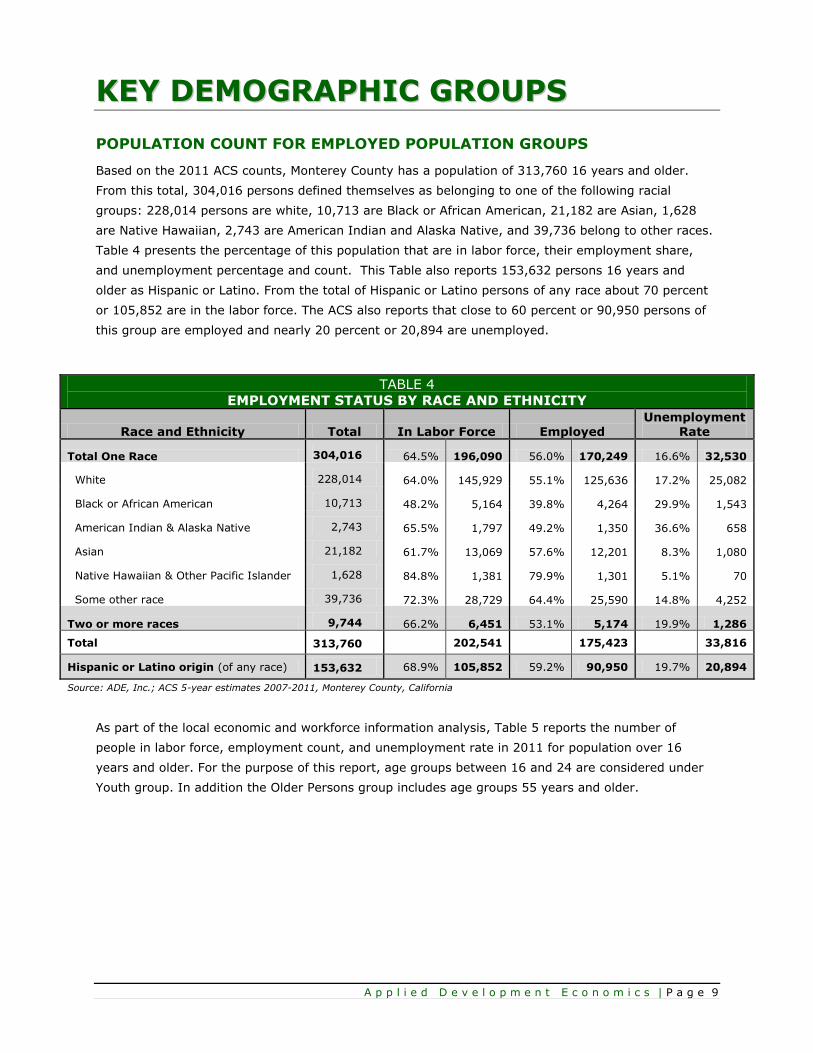
Based on the 2011 ACS counts, Monterey County has a population of 313,760 16 years and older.
From this total, 304,016 persons defined themselves as belonging to one of the following racial
groups: 228,014 persons are white, 10,713 are Black or African American, 21,182 are Asian, 1,628
are Native Hawaiian, 2,743 are American Indian and Alaska Native, and 39,736 belong to other races.
Table 4 presents the percentage of this population that are in labor force, their employment share,
and unemployment percentage and count. This Table also reports 153,632 persons 16 years and
older as Hispanic or Latino. From the total of Hispanic or Latino persons of any race about 70 percent
or 105,852 are in the labor force. The ACS also reports that close to 60 percent or 90,950 persons of
this group are employed and nearly 20 percent or 20,894 are unemployed.
TABLE 4
EMPLOYMENT STATUS BY RACE AND ETHNICITY
Race and Ethnicity Total In Labor Force Employed Unemployment
Rate
Total One Race 304,016 64.5% 196,090 56.0% 170,249 16.6% 32,530
White 228,014 64.0% 145,929 55.1% 125,636 17.2% 25,082
Black or African American 10,713 48.2% 5,164 39.8% 4,264 29.9% 1,543
American Indian & Alaska Native 2,743 65.5% 1,797 49.2% 1,350 36.6% 658
Asian 21,182 61.7% 13,069 57.6% 12,201 8.3% 1,080
Native Hawaiian & Other Pacific Islander 1,628 84.8% 1,381 79.9% 1,301 5.1% 70
Some other race 39,736 72.3% 28,729 64.4% 25,590 14.8% 4,252
Two or more races 9,744 66.2% 6,451 53.1% 5,174 19.9% 1,286
Total 313,760 202,541 175,423 33,816
Hispanic or Latino origin (of any race) 153,632 68.9% 105,852 59.2% 90,950 19.7% 20,894
Source: ADE, Inc.; ACS 5-year estimates 2007-2011, Monterey County, California
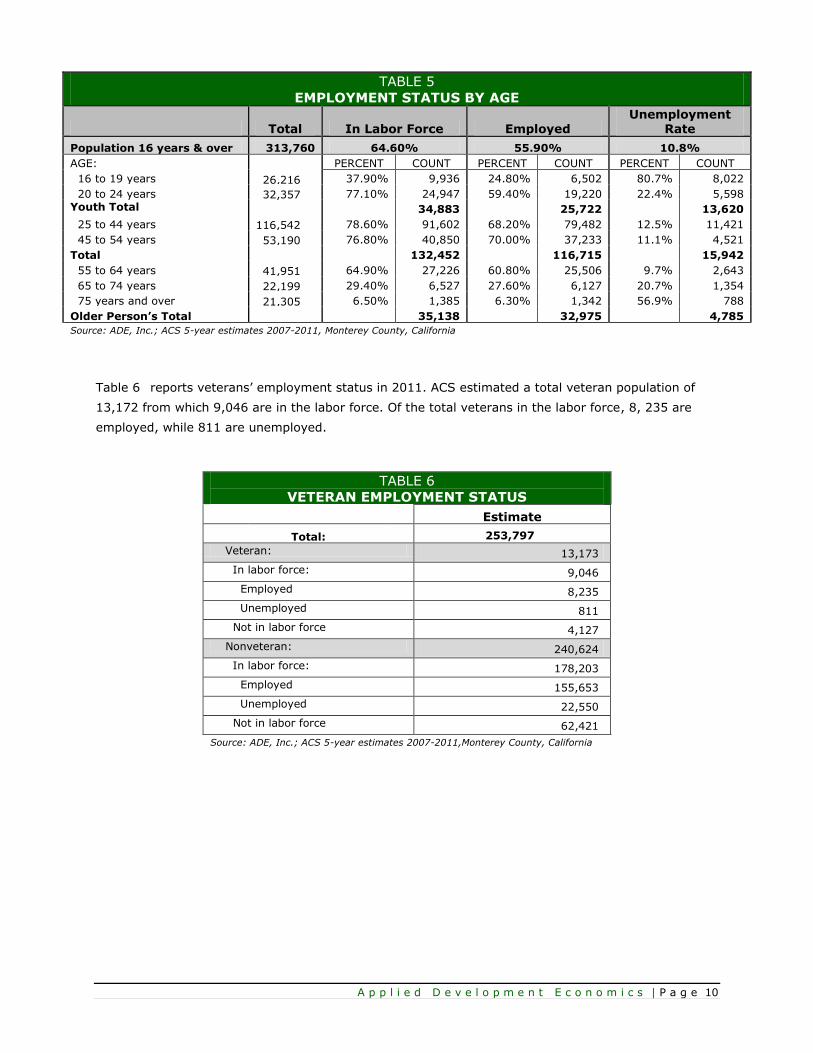
As part of the local economic and workforce information analysis, Table 5 reports the number of
people in labor force, employment count, and unemployment rate in 2011 for population over 16
years and older. For the purpose of this report, age groups between 16 and 24 are considered under
Youth group. In addition the Older Persons group includes age groups 55 years and older.
A p p l i e d D e v e l o p m e n t E c o n o m i c s | P a g e 10
TABLE 5
EMPLOYMENT STATUS BY AGE
Total In Labor Force Employed Unemployment
Rate
Population 16 years & over 313,760 64.60% 55.90% 10.8%
AGE: PERCENT COUNT PERCENT COUNT PERCENT COUNT
16 to 19 years 26,216 37.90% 9,936 24.80% 6,502 80.7% 8,022
20 to 24 years 32,357 77.10% 24,947 59.40% 19,220 22.4% 5,598 Youth Total 34,883 25,722 13,620
25 to 44 years 116,542 78.60% 91,602 68.20% 79,482 12.5% 11,421
45 to 54 years 53,190 76.80% 40,850 70.00% 37,233 11.1% 4,521
Total 132,452 116,715 15,942
55 to 64 years 41,951 64.90% 27,226 60.80% 25,506 9.7% 2,643
65 to 74 years 22,199 29.40% 6,527 27.60% 6,127 20.7% 1,354
75 years and over 21,305 6.50% 1,385 6.30% 1,342 56.9% 788
Older Person’s Total 35,138 32,975 4,785
Source: ADE, Inc.; ACS 5-year estimates 2007-2011, Monterey County, California
Table 6 reports veterans’ employment status in 2011. ACS estimated a total veteran population of
13,172 from which 9,046 are in the labor force. Of the total veterans in the labor force, 8, 235 are
employed, while 811 are unemployed.
TABLE 6
VETERAN EMPLOYMENT STATUS Estimate
Total: 253,797
Veteran: 13,173
In labor force: 9,046
Employed 8,235
Unemployed 811
Not in labor force 4,127
Nonveteran: 240,624
In labor force: 178,203
Employed 155,653
Unemployed 22,550
Not in labor force 62,421
Source: ADE, Inc.; ACS 5-year estimates 2007-2011,Monterey County, California

A p p l i e d D e v e l o p m e n t E c o n o m i c s | P a g e 11

A p p l i e d D e v e l o p m e n t E c o n o m i c s | P a g e 12
EEMMPPLLOOYYMMEENNTT AANNDD OOCCCCUUPPAATTIIOONN
PPRROOJJEECCTTIIOONNSS
According to EMSI, projected employment changes between 2012 and 2017 will add 9,648 jobs. As
shown in Table 7, the agriculture, forestry, fishing and hunting sector (NAICS code 11) was the largest
employment generator in 2012 with 47, 568 workers. This industry is projected to remain the primary
source of employment in 2017 with 52,116 workers, with 4,548 new jobs projected.
The second largest job sector in Monterey County by 2017 is accommodation and food services with
20,391 workers. The tourism industry, as a priority job sector in Monterey County, is comprised of the
accommodation and food services sector plus arts, entertainment, and recreation. By 2017, the
accommodation and food services sector is projected to grow by 1,528 workers, while arts and
entertainment will only add 29 additional employees during this period. Health care and social
assistance (NAICS code 62) is anticipated to gain 1,395 workers and become the third largest growing
job sector in the county.
Other services (NAICS code 81) and retail trade (NAICS 44-45) are the fourth and fifth growing
sectors with 869 and 674 additional workers respectively. Projections for management (NAICS code
55) and financial services (NAICS 52) show those sectors with the largest projected employment
losses by 2017. In addition, the information services sector (NAICS code 51) will also have a sizable
job loss, going from 1,569 workers in 2012 to 1,286 workers in 2017.
TABLE 7
EMPLOYMENT PROJECTIONS, 2012 TO 2017
NAICS Code Description 2012 Jobs
2017 Jobs (Projected)
Employment Change
2012-2017
11 Agriculture, Forestry, Fishing and Hunting 47,568 52,116 4,548
72 Accommodation and Food Services 18,863 20,391 1,528
62 Health Care and Social Assistance 12,070 13,465 1,395
81 Other Services (except Public Administration) 6,538 7,407 869
44-45 Retail Trade 16,261 16,935 674
54 Professional, Scientific, and Technical Services 5,786 6,312 526
42 Wholesale Trade 5,150 5,625 475
61 Educational Services (Private) 2,119 2,474 355
56 Administrative and Support and Waste
Management and Remediation Services 5,261 5,588 327
48-49 Transportation and Warehousing 2,639 2,959 320
71 Arts, Entertainment, and Recreation 2,302 2,331 29
21 Mining, Quarrying, and Oil and Gas Extraction 204 192 -12
31-33 Manufacturing 5,437 5,410 -27
53 Real Estate and Rental and Leasing 1,715 1,688 -27
22 Utilities 622 436 -186
23 Construction 3,849 3,550 -299
51 Information 1,596 1,286 -310
52 Finance and Insurance 2,621 2,266 -355
55 Management of Companies and Enterprises 1,355 486 -869
Source: ADE, EMSI Employment projections 2012_2017, Monterey County, California

A p p l i e d D e v e l o p m e n t E c o n o m i c s | P a g e 13
OCCUPATIONAL PROJECTIONS - TOURISM INDUSTRY
The tourism industry employs workers who provide cultural, entertainment and recreational services,
food preparation and restaurant services, or lodging and short-term accommodation through a wide
range of establishments. Tourism cluster includes Arts, Entertainment, and Recreation sectors, NAICS
71, and Accommodation and Food Services sector, NAICS 72. While sector 71 includes performing
arts, museums and historical sites, amusement, gambling, and recreation services, sector 72 includes
food services and drinking places as well as traveler accommodation, recreational accommodation,
and rooming and boarding houses. Altogether, the tourism industry employed 21,165 workers in 2012
and is projected to grow to 22,722 workers in 2017. This projected growth of 1,557 jobs will primarily
occur in the accommodations and food services category, as shown in Table 8.
TABLE 8
EMPLOYMENT CHANGE TOURISM INDUSTRY
NAICS Code Description 2012 Jobs 2017 Jobs
Employment Change
2012-2017
72 Accommodation and Food Services 18,863 20,391 1,528
71 Arts, Entertainment, and Recreation 2,302 2,331 29
Total Tourism Industry 21,165 22,722 1,557
Source: ADE, EMSI Employment projections 2012_2017, Monterey County, California
In order to assess the projected occupational demand created by employment growth in tourism, the
analysis tabulated the occupational staffing patterns for the tourism industries. Using data from EMSI,
the occupational staffing patterns data identifies which specific occupations will create the highest
number of new jobs between 2012 and 2017. This also helps gauge where the future demand for
workforce training and education will potentially come from.
This cross tabulation method gives us the ability to gather a list of growing occupations for a particular
industry and assess the required workforce skills an individual needs to find employment in the
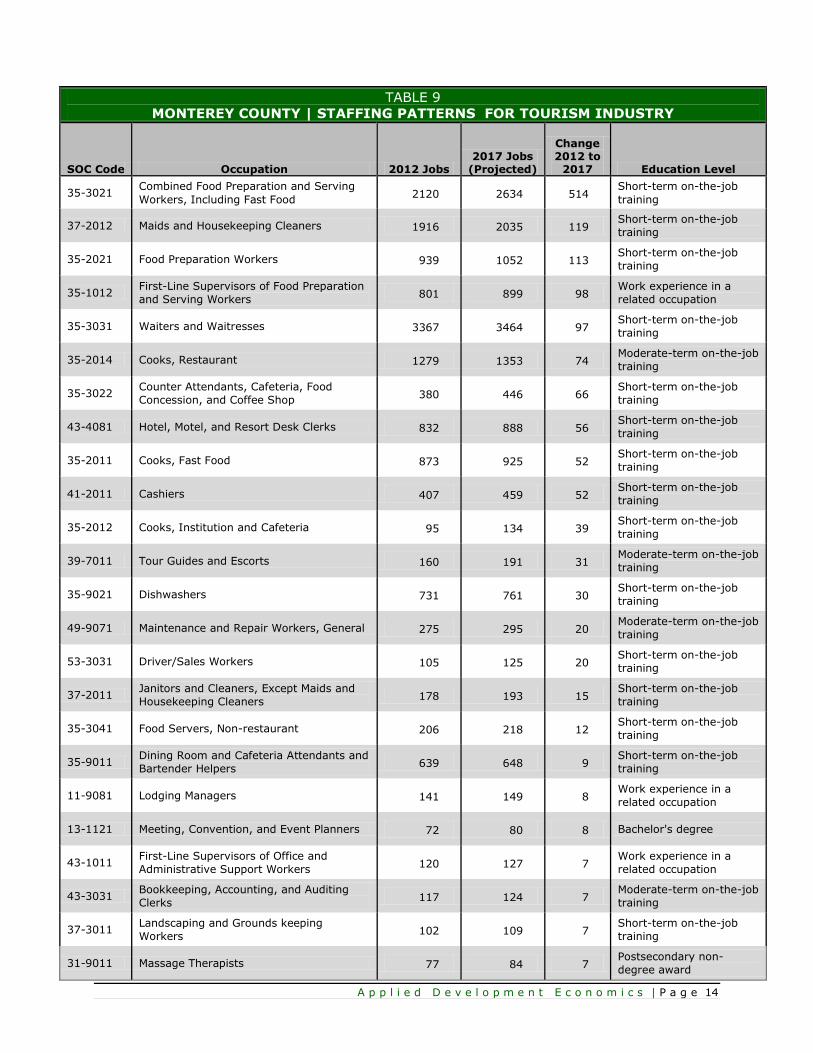
priority sectors. Table 9 presents the list of occupations in the tourism industry with a positive
workforce growth by 2017. Food preparation occupations (SOC code 35) will add a total of 1,120 new
workers by 2017, making it the largest growing tourism occupation in Monterey County. Building and
Grounds Cleaning and Maintenance, SOC 37, will have employment increase of about 146 persons.
Compared to the food preparation services, this sector has a slower increase. EMSI also projects that
97 Office and Administrative Support Occupations will be added to the job market by 2017 and 57 of
these jobs are related to hotel, motel and resort desk clerks.
A p p l i e d D e v e l o p m e n t E c o n o m i c s | P a g e 14
TABLE 9
MONTEREY COUNTY | STAFFING PATTERNS FOR TOURISM INDUSTRY
SOC Code Occupation 2012 Jobs 2017 Jobs
(Projected)
Change 2012 to
2017 Education Level
35-3021 Combined Food Preparation and Serving
Workers, Including Fast Food 2120 2634 514
Short-term on-the-job
training
37-2012 Maids and Housekeeping Cleaners 1916 2035 119 Short-term on-the-job
training
35-2021 Food Preparation Workers 939 1052 113 Short-term on-the-job
training
35-1012 First-Line Supervisors of Food Preparation
and Serving Workers 801 899 98
Work experience in a
related occupation
35-3031 Waiters and Waitresses 3367 3464 97 Short-term on-the-job
training
35-2014 Cooks, Restaurant 1279 1353 74 Moderate-term on-the-job
training
35-3022 Counter Attendants, Cafeteria, Food
Concession, and Coffee Shop 380 446 66
Short-term on-the-job
training
43-4081 Hotel, Motel, and Resort Desk Clerks 832 888 56 Short-term on-the-job
training
35-2011 Cooks, Fast Food 873 925 52 Short-term on-the-job
training
41-2011 Cashiers 407 459 52 Short-term on-the-job
training
35-2012 Cooks, Institution and Cafeteria 95 134 39 Short-term on-the-job
training
39-7011 Tour Guides and Escorts 160 191 31 Moderate-term on-the-job
training
35-9021 Dishwashers 731 761 30 Short-term on-the-job
training
49-9071 Maintenance and Repair Workers, General 275 295 20 Moderate-term on-the-job
training
53-3031 Driver/Sales Workers 105 125 20 Short-term on-the-job
training
37-2011 Janitors and Cleaners, Except Maids and
Housekeeping Cleaners 178 193 15
Short-term on-the-job
training
35-3041 Food Servers, Non-restaurant 206 218 12 Short-term on-the-job
training
35-9011 Dining Room and Cafeteria Attendants and
Bartender Helpers 639 648 9
Short-term on-the-job
training
11-9081 Lodging Managers 141 149 8 Work experience in a
related occupation
13-1121 Meeting, Convention, and Event Planners 72 80 8 Bachelor's degree
43-1011 First-Line Supervisors of Office and
Administrative Support Workers 120 127 7
Work experience in a
related occupation
43-3031 Bookkeeping, Accounting, and Auditing
Clerks 117 124 7
Moderate-term on-the-job
training
37-3011 Landscaping and Grounds keeping
Workers 102 109 7
Short-term on-the-job
training
31-9011 Massage Therapists 77 84 7 Postsecondary non-
degree award

A p p l i e d D e v e l o p m e n t E c o n o m i c s | P a g e 15
SOC Code Occupation 2012 Jobs 2017 Jobs
(Projected)
Change 2012 to
2017 Education Level
43-9061 Office Clerks, General 69 76 7 Short-term on-the-job
training
33-9032 Security Guards 29 35 6 Short-term on-the-job
training
35-2015 Cooks, Short Order 156 162 6 Short-term on-the-job
training
51-6011 Laundry and Dry-Cleaning Workers 60 66 6 Short-term on-the-job
training
41-2011 Cashiers 56 61 5 Short-term on-the-job
training
39-3011 Gaming Dealers 32 37 5 Moderate-term on-the-job
training
13-1121 Meeting, Convention, and Event Planners 17 22 5 Bachelor's degree
39-6011 Baggage Porters and Bellhops 85 90 5 Short-term on-the-job
training
41-3099 Sales Representatives, Services, All Other 67 72 5 Short-term on-the-job
training
39-3091 Amusement and Recreation Attendants 48 53 5 Short-term on-the-job
training
53-3033 Light Truck or Delivery Services Drivers 26 31 5 Short-term on-the-job
training
35-2019 Cooks, All Other 19 24 5 Moderate-term on-the-job
training
41-2031 Retail Salespersons 45 49 4 Short-term on-the-job
training
39-2021 Nonfarm Animal Caretakers 28 32 4 Short-term on-the-job
training
51-3011 Bakers 63 67 4 Long-term on-the-job
training
33-9092 Lifeguards, Ski Patrol, and Other
Recreational Protective Service Workers 31 35 4
Short-term on-the-job
training
37-3011 Landscaping and Grounds keeping
Workers 208 211 3
Short-term on-the-job
training
25-3021 Self-Enrichment Education Teachers 27 30 3 Work experience in a
related occupation
39-3031 Ushers, Lobby Attendants, and Ticket
Takers 18 21 3
Short-term on-the-job
training
33-9032 Security Guards 71 74 3 Short-term on-the-job
training
11-2022 Sales Managers 42 45 3 Bachelor's or higher
degree, plus work
experience
53-3041 Taxi Drivers and Chauffeurs 28 31 3 Short-term on-the-job
training
39-9032 Recreation Workers 28 31 3 Bachelor's degree
43-4051 Customer Service Representatives 27 30 3 Short-term on-the-job
training
43-9061 Office Clerks, General 38 40 2 Short-term on-the-job
training

A p p l i e d D e v e l o p m e n t E c o n o m i c s | P a g e 16
SOC Code Occupation 2012 Jobs 2017 Jobs
(Projected)
Change 2012 to
2017 Education Level
37-2011 Janitors and Cleaners, Except Maids and
Housekeeping Cleaners 36 38 2
Short-term on-the-job
training
49-9071 Maintenance and Repair Workers, General 35 37 2 Moderate-term on-the-job
training
27-1027 Set and Exhibit Designers 25 27 2 Bachelor's degree
43-6011 Executive Secretaries and Executive
Administrative Assistants 15 17 2
Work experience in a
related occupation
25-9031 Instructional Coordinators 13 15 2 Master's degree
11-1021 General and Operations Managers 141 143 2 Bachelor's or higher
degree, plus work
experience
35-1011 Chefs and Head Cooks 108 110 2 Work experience in a
related occupation
39-6012 Concierges 40 42 2 Moderate-term on-the-job
training
41-2031 Retail Salespersons 37 39 2 Short-term on-the-job
training
43-6011 Executive Secretaries and Executive
Administrative Assistants 29 31 2
Work experience in a
related occupation
43-4171 Receptionists and Information Clerks 23 25 2 Short-term on-the-job
training
13-2011 Accountants and Auditors 23 25 2 Bachelor's degree
41-1011 First-Line Supervisors of Retail Sales
Workers 17 19 2
Work experience in a
related occupation
53-7062 Laborers and Freight, Stock, and Material
Movers, Hand 17 19 2
Short-term on-the-job
training
43-5081 Stock Clerks and Order Fillers 10 12 2 Short-term on-the-job
training
35-3011 Bartenders 30 31 1 Short-term on-the-job
training
43-3031 Bookkeeping, Accounting, and Auditing
Clerks 24 25 1
Moderate-term on-the-job
training
25-3999 Teachers and Instructors, All Other 24 25 1 Bachelor's degree
43-6014 Secretaries and Administrative Assistants,
Except Legal, Medical, and Executive 20 21 1
Short-term on-the-job
training
43-4051 Customer Service Representatives 17 18 1 Short-term on-the-job
training
35-3021 Combined Food Preparation and Serving
Workers, Including Fast Food 12 13 1
Short-term on-the-job
training
43-1011 First-Line Supervisors of Office and
Administrative Support Workers 12 13 1
Work experience in a
related occupation
41-1011 First-Line Supervisors of Retail Sales
Workers 12 13 1
Work experience in a
related occupation
35-2015 Cooks, Short Order 11 12 1 Short-term on-the-job
training
39-3019 Gaming Service Workers, All Other 11 12 1 Moderate-term on-the-job
training
A p p l i e d D e v e l o p m e n t E c o n o m i c s | P a g e 17
SOC Code Occupation 2012 Jobs 2017 Jobs
(Projected)
Change 2012 to
2017 Education Level
43-6014 Secretaries and Administrative Assistants,
Except Legal, Medical, and Executive 29 30 1
Short-term on-the-job
training
43-3051 Payroll and Timekeeping Clerks 24 25 1 Moderate-term on-the-job
training
49-1011 First-Line Supervisors of Mechanics,
Installers, and Repairers 23 24 1
Work experience in a
related occupation
39-9031 Fitness Trainers and Aerobics Instructors 18 19 1 Postsecondary non-
degree award
11-3031 Financial Managers 14 15 1 Bachelor's or higher
degree, plus work
experience
11-3011 Administrative Services Managers 14 15 1 Work experience in a
related occupation
43-5071 Shipping, Receiving, and Traffic Clerks 11 12 1 Short-term on-the-job
training
13-1199 Business Operations Specialists, All Other 11 12 1 Long-term on-the-job
training
Source: ADE, EMSI Employment projections 2012 to 2017, Monterey County, California
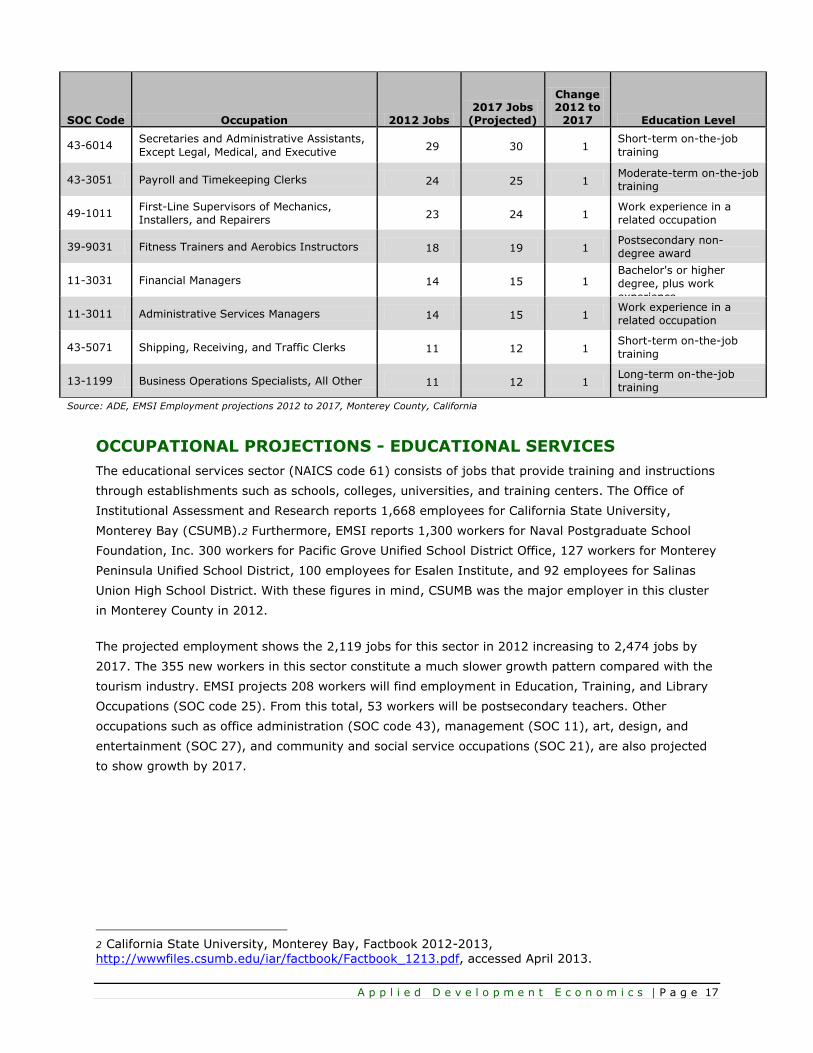
OCCUPATIONAL PROJECTIONS - EDUCATIONAL SERVICES
The educational services sector (NAICS code 61) consists of jobs that provide training and instructions
through establishments such as schools, colleges, universities, and training centers. The Office of
Institutional Assessment and Research reports 1,668 employees for California State University,
Monterey Bay (CSUMB).2 Furthermore, EMSI reports 1,300 workers for Naval Postgraduate School
Foundation, Inc. 300 workers for Pacific Grove Unified School District Office, 127 workers for Monterey
Peninsula Unified School District, 100 employees for Esalen Institute, and 92 employees for Salinas
Union High School District. With these figures in mind, CSUMB was the major employer in this cluster
in Monterey County in 2012.
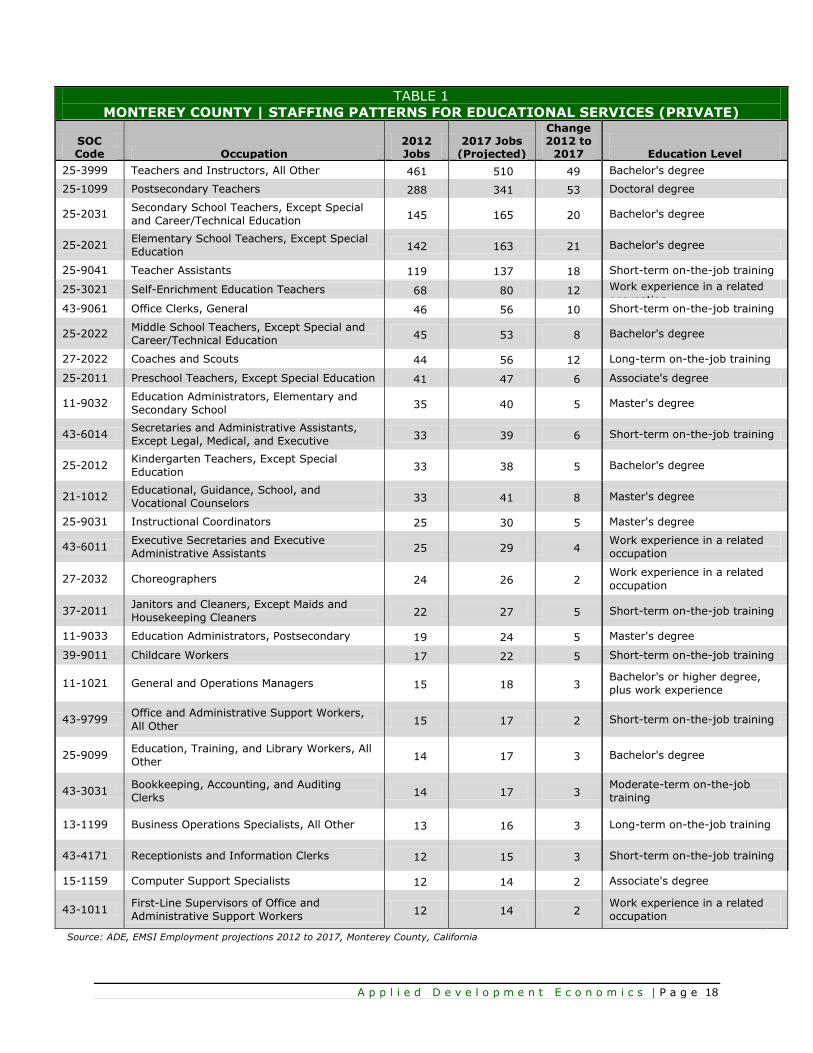
The projected employment shows the 2,119 jobs for this sector in 2012 increasing to 2,474 jobs by
2017. The 355 new workers in this sector constitute a much slower growth pattern compared with the
tourism industry. EMSI projects 208 workers will find employment in Education, Training, and Library
Occupations (SOC code 25). From this total, 53 workers will be postsecondary teachers. Other
occupations such as office administration (SOC code 43), management (SOC 11), art, design, and
entertainment (SOC 27), and community and social service occupations (SOC 21), are also projected
to show growth by 2017.
2 California State University, Monterey Bay, Factbook 2012-2013,
http://wwwfiles.csumb.edu/iar/factbook/Factbook_1213.pdf, accessed April 2013.
A p p l i e d D e v e l o p m e n t E c o n o m i c s | P a g e 18
TABLE 1
MONTEREY COUNTY | STAFFING PATTERNS FOR EDUCATIONAL SERVICES (PRIVATE)
SOC Code Occupation
2012 Jobs
2017 Jobs (Projected)
Change 2012 to
2017
Education Level
25-3999 Teachers and Instructors, All Other 461 510 49 Bachelor's degree
25-1099 Postsecondary Teachers 288 341 53 Doctoral degree
25-2031 Secondary School Teachers, Except Special
and Career/Technical Education 145 165 20 Bachelor's degree
25-2021 Elementary School Teachers, Except Special
Education 142 163 21 Bachelor's degree
25-9041 Teacher Assistants 119 137 18 Short-term on-the-job training
25-3021 Self-Enrichment Education Teachers 68 80 12 Work experience in a related
occupation 43-9061 Office Clerks, General 46 56 10 Short-term on-the-job training
25-2022 Middle School Teachers, Except Special and
Career/Technical Education 45 53 8 Bachelor's degree
27-2022 Coaches and Scouts 44 56 12 Long-term on-the-job training
25-2011 Preschool Teachers, Except Special Education 41 47 6 Associate's degree
11-9032 Education Administrators, Elementary and
Secondary School 35 40 5 Master's degree
43-6014 Secretaries and Administrative Assistants,
Except Legal, Medical, and Executive 33 39 6 Short-term on-the-job training
25-2012 Kindergarten Teachers, Except Special
Education 33 38 5 Bachelor's degree
21-1012 Educational, Guidance, School, and
Vocational Counselors 33 41 8 Master's degree
25-9031 Instructional Coordinators 25 30 5 Master's degree
43-6011 Executive Secretaries and Executive
Administrative Assistants 25 29 4
Work experience in a related
occupation
27-2032 Choreographers 24 26 2 Work experience in a related
occupation
37-2011 Janitors and Cleaners, Except Maids and
Housekeeping Cleaners 22 27 5 Short-term on-the-job training
11-9033 Education Administrators, Postsecondary 19 24 5 Master's degree
39-9011 Childcare Workers 17 22 5 Short-term on-the-job training
11-1021 General and Operations Managers 15 18 3 Bachelor's or higher degree,
plus work experience
43-9799 Office and Administrative Support Workers,
All Other 15 17 2 Short-term on-the-job training
25-9099 Education, Training, and Library Workers, All
Other 14 17 3 Bachelor's degree
43-3031 Bookkeeping, Accounting, and Auditing
Clerks 14 17 3
Moderate-term on-the-job
training
13-1199 Business Operations Specialists, All Other 13 16 3 Long-term on-the-job training
43-4171 Receptionists and Information Clerks 12 15 3 Short-term on-the-job training
15-1159 Computer Support Specialists 12 14 2 Associate's degree
43-1011 First-Line Supervisors of Office and
Administrative Support Workers 12 14 2
Work experience in a related
occupation
Source: ADE, EMSI Employment projections 2012 to 2017, Monterey County, California
A p p l i e d D e v e l o p m e n t E c o n o m i c s | P a g e 19
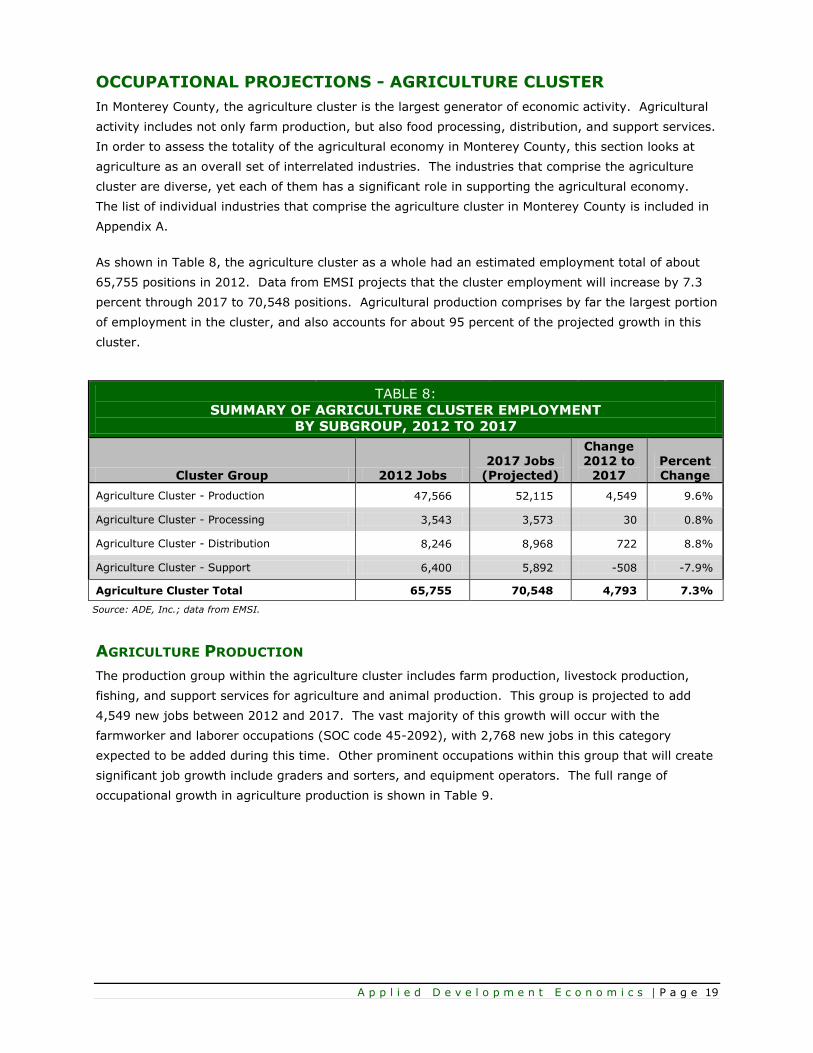
OCCUPATIONAL PROJECTIONS - AGRICULTURE CLUSTER
In Monterey County, the agriculture cluster is the largest generator of economic activity. Agricultural
activity includes not only farm production, but also food processing, distribution, and support services.
In order to assess the totality of the agricultural economy in Monterey County, this section looks at
agriculture as an overall set of interrelated industries. The industries that comprise the agriculture
cluster are diverse, yet each of them has a significant role in supporting the agricultural economy.
The list of individual industries that comprise the agriculture cluster in Monterey County is included in
Appendix A.
As shown in Table 8, the agriculture cluster as a whole had an estimated employment total of about
65,755 positions in 2012. Data from EMSI projects that the cluster employment will increase by 7.3
percent through 2017 to 70,548 positions. Agricultural production comprises by far the largest portion
of employment in the cluster, and also accounts for about 95 percent of the projected growth in this
cluster.
TABLE 8:
SUMMARY OF AGRICULTURE CLUSTER EMPLOYMENT
BY SUBGROUP, 2012 TO 2017
Cluster Group 2012 Jobs 2017 Jobs
(Projected)
Change 2012 to
2017 Percent Change
Agriculture Cluster - Production 47,566 52,115 4,549 9.6%
Agriculture Cluster - Processing 3,543 3,573 30 0.8%
Agriculture Cluster - Distribution 8,246 8,968 722 8.8%
Agriculture Cluster - Support 6,400 5,892 -508 -7.9%
Agriculture Cluster Total 65,755 70,548 4,793 7.3%
Source: ADE, Inc.; data from EMSI.
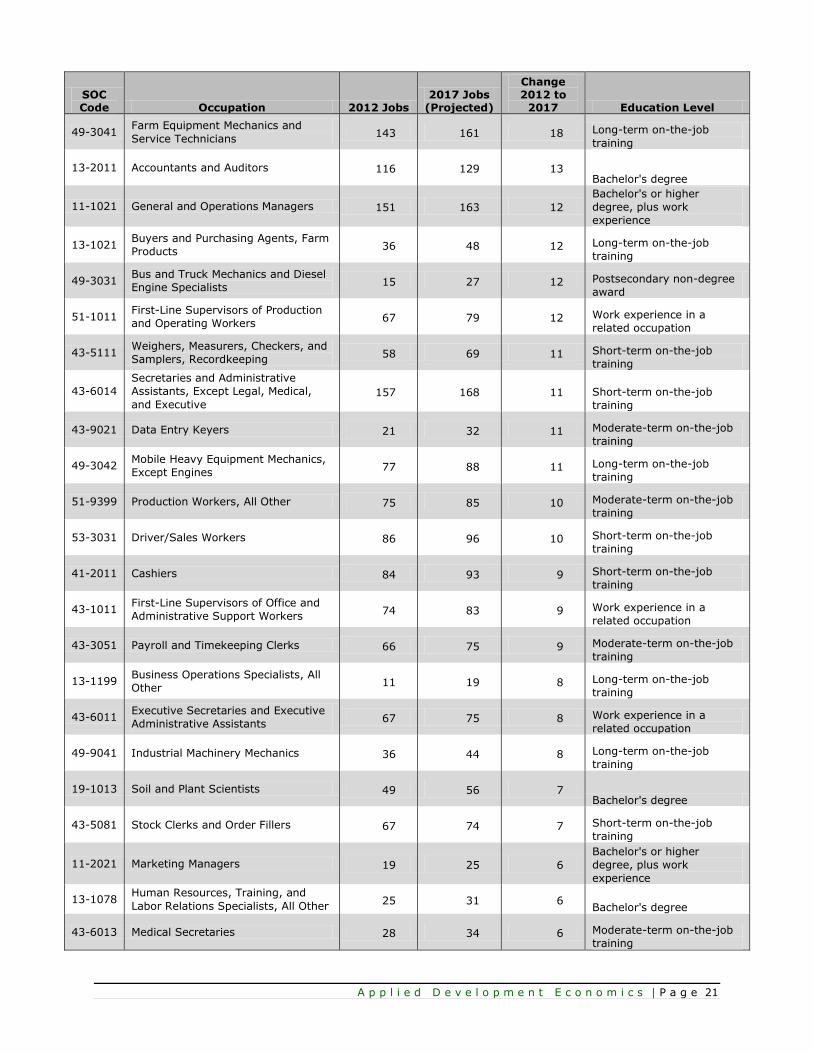
AGRICULTURE PRODUCTION
The production group within the agriculture cluster includes farm production, livestock production,
fishing, and support services for agriculture and animal production. This group is projected to add
4,549 new jobs between 2012 and 2017. The vast majority of this growth will occur with the
farmworker and laborer occupations (SOC code 45-2092), with 2,768 new jobs in this category
expected to be added during this time. Other prominent occupations within this group that will create
significant job growth include graders and sorters, and equipment operators. The full range of
occupational growth in agriculture production is shown in Table 9.

A p p l i e d D e v e l o p m e n t E c o n o m i c s | P a g e 20
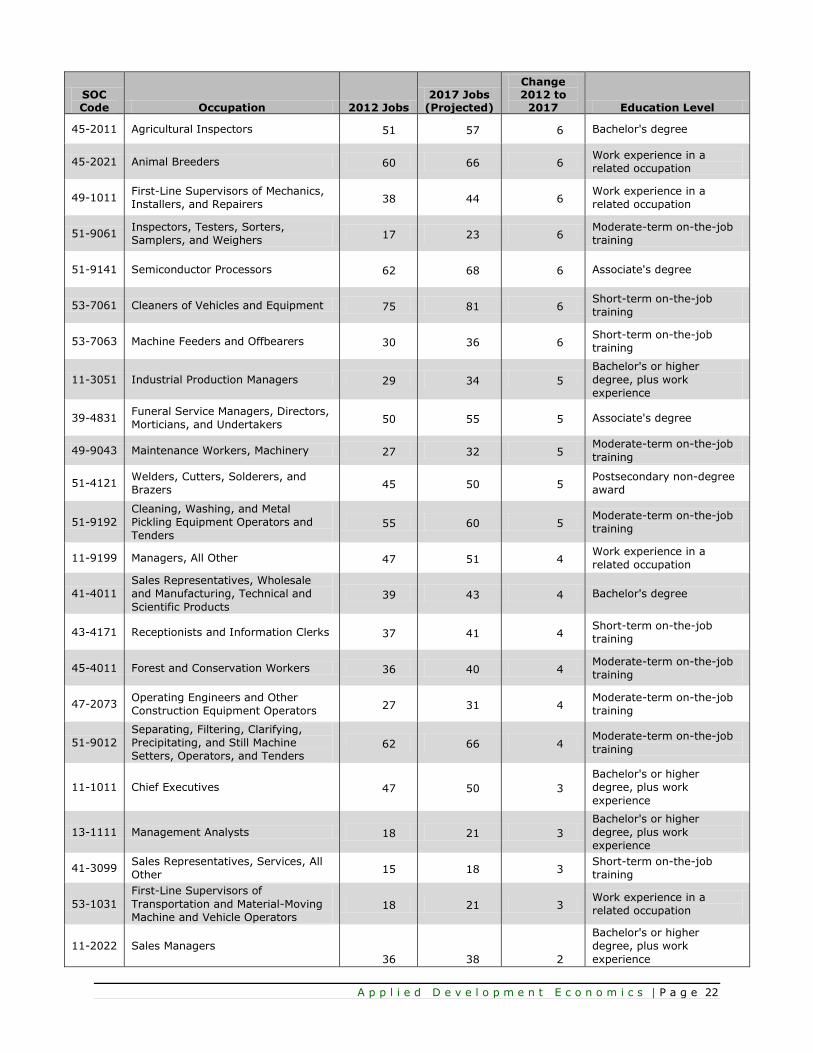
TABLE 9:
AGRICULTURE CLUSTER PRODUCTION - OCCUPATIONAL GROWTH 2012 TO 2017
SOC Code Occupation 2012 Jobs
2017 Jobs (Projected)
Change 2012 to
2017 Education Level
45-2092 Farmworkers and Laborers, Crop,
Nursery, and Greenhouse 32,516 35,284 2,768
Short-term on-the-job
training
45-2041 Graders and Sorters, Agricultural
Products 1,610 1,786 176
Short-term on-the-job
training
45-2091 Agricultural Equipment Operators 1,307 1,478 171 Short-term on-the-job
training
45-2093 Farmworkers, Farm, Ranch, and
Aquacultural Animals 1,263 1,393 130
Short-term on-the-job
training
11-9013 Farmers, Ranchers, and Other
Agricultural Managers 1,165 1,281 116
Work experience in a
related occupation
45-1011 First-Line Supervisors of Farming,
Fishing, and Forestry Workers 1,198 1,312 114
Work experience in a
related occupation
53-7064 Packers and Packagers, Hand 716 811 95 Short-term on-the-job
training
53-3032 Heavy and Tractor-Trailer Truck
Drivers 458 515 57
Short-term on-the-job
training
53-7062 Laborers and Freight, Stock, and
Material Movers, Hand 333 387 54
Short-term on-the-job
training
53-7051 Industrial Truck and Tractor
Operators 376 421 45
Short-term on-the-job
training
43-9061 Office Clerks, General 174 218 44 Short-term on-the-job
training
43-3031 Bookkeeping, Accounting, and
Auditing Clerks 260 298 38
Moderate-term on-the-job
training
45-2099 Agricultural Workers, All Other 322 357 35 Short-term on-the-job
training
37-3011 Landscaping and Grounds keeping
Workers 316 349 33
Short-term on-the-job
training
49-9071 Maintenance and Repair Workers,
General 162 194 32
Moderate-term on-the-job
training
51-9111 Packaging and Filling Machine
Operators and Tenders 202 234 32
Moderate-term on-the-job
training
43-4051 Customer Service Representatives 74 101 27 Short-term on-the-job
training
51-9198 Helpers--Production Workers 193 218 25 Short-term on-the-job
training
41-4012
Sales Representatives, Wholesale
and Manufacturing, Except Technical
and Scientific Products 177 201 24
Moderate-term on-the-job
training
43-5071 Shipping, Receiving, and Traffic
Clerks 168 192 24
Short-term on-the-job
training
37-3012 Pesticide Handlers, Sprayers, and
Applicators, Vegetation 63 84 21
Moderate-term on-the-job
training
53-3033 Light Truck or Delivery Services
Drivers 193 214 21
Short-term on-the-job
training
37-2011 Janitors and Cleaners, Except Maids
and Housekeeping Cleaners 116 136 20
Short-term on-the-job
training
A p p l i e d D e v e l o p m e n t E c o n o m i c s | P a g e 21
SOC Code Occupation 2012 Jobs
2017 Jobs (Projected)
Change 2012 to
2017 Education Level
49-3041 Farm Equipment Mechanics and
Service Technicians 143 161 18 Long-term on-the-job
training
13-2011 Accountants and Auditors 116 129 13 Bachelor's degree
11-1021 General and Operations Managers 151 163 12
Bachelor's or higher
degree, plus work
experience
13-1021 Buyers and Purchasing Agents, Farm
Products 36 48 12 Long-term on-the-job
training
49-3031 Bus and Truck Mechanics and Diesel
Engine Specialists 15 27 12 Postsecondary non-degree
award
51-1011 First-Line Supervisors of Production
and Operating Workers 67 79 12 Work experience in a
related occupation
43-5111 Weighers, Measurers, Checkers, and
Samplers, Recordkeeping 58 69 11 Short-term on-the-job
training
43-6014
Secretaries and Administrative
Assistants, Except Legal, Medical,
and Executive 157 168 11 Short-term on-the-job
training
43-9021 Data Entry Keyers 21 32 11 Moderate-term on-the-job
training
49-3042 Mobile Heavy Equipment Mechanics,
Except Engines 77 88 11 Long-term on-the-job
training
51-9399 Production Workers, All Other 75 85 10 Moderate-term on-the-job
training
53-3031 Driver/Sales Workers 86 96 10 Short-term on-the-job
training
41-2011 Cashiers 84 93 9 Short-term on-the-job
training
43-1011 First-Line Supervisors of Office and
Administrative Support Workers 74 83 9 Work experience in a
related occupation
43-3051 Payroll and Timekeeping Clerks 66 75 9 Moderate-term on-the-job
training
13-1199 Business Operations Specialists, All
Other 11 19 8 Long-term on-the-job
training
43-6011 Executive Secretaries and Executive
Administrative Assistants 67 75 8 Work experience in a
related occupation
49-9041 Industrial Machinery Mechanics 36 44 8 Long-term on-the-job
training
19-1013 Soil and Plant Scientists 49 56 7 Bachelor's degree
43-5081 Stock Clerks and Order Fillers 67 74 7 Short-term on-the-job
training
11-2021 Marketing Managers 19 25 6
Bachelor's or higher
degree, plus work
experience
13-1078 Human Resources, Training, and
Labor Relations Specialists, All Other 25 31 6
Bachelor's degree
43-6013 Medical Secretaries 28 34 6 Moderate-term on-the-job
training
A p p l i e d D e v e l o p m e n t E c o n o m i c s | P a g e 22
SOC Code Occupation 2012 Jobs
2017 Jobs (Projected)
Change 2012 to
2017 Education Level
45-2011 Agricultural Inspectors 51 57 6 Bachelor's degree
45-2021 Animal Breeders 60 66 6 Work experience in a
related occupation
49-1011 First-Line Supervisors of Mechanics,
Installers, and Repairers 38 44 6
Work experience in a
related occupation
51-9061 Inspectors, Testers, Sorters,
Samplers, and Weighers 17 23 6
Moderate-term on-the-job
training
51-9141 Semiconductor Processors 62 68 6 Associate's degree
53-7061 Cleaners of Vehicles and Equipment 75 81 6 Short-term on-the-job
training
53-7063 Machine Feeders and Offbearers 30 36 6 Short-term on-the-job
training
11-3051 Industrial Production Managers 29 34 5
Bachelor's or higher
degree, plus work
experience
39-4831 Funeral Service Managers, Directors,
Morticians, and Undertakers 50 55 5 Associate's degree
49-9043 Maintenance Workers, Machinery 27 32 5 Moderate-term on-the-job
training
51-4121 Welders, Cutters, Solderers, and
Brazers 45 50 5
Postsecondary non-degree
award
51-9192
Cleaning, Washing, and Metal
Pickling Equipment Operators and
Tenders 55 60 5
Moderate-term on-the-job
training
11-9199 Managers, All Other 47 51 4 Work experience in a
related occupation
41-4011
Sales Representatives, Wholesale
and Manufacturing, Technical and
Scientific Products 39 43 4 Bachelor's degree
43-4171 Receptionists and Information Clerks 37 41 4 Short-term on-the-job
training
45-4011 Forest and Conservation Workers 36 40 4 Moderate-term on-the-job
training
47-2073 Operating Engineers and Other
Construction Equipment Operators 27 31 4
Moderate-term on-the-job
training
51-9012
Separating, Filtering, Clarifying,
Precipitating, and Still Machine
Setters, Operators, and Tenders 62 66 4
Moderate-term on-the-job
training
11-1011 Chief Executives 47 50 3
Bachelor's or higher
degree, plus work
experience
13-1111 Management Analysts 18 21 3
Bachelor's or higher
degree, plus work
experience
41-3099 Sales Representatives, Services, All
Other 15 18 3
Short-term on-the-job
training
53-1031
First-Line Supervisors of
Transportation and Material-Moving
Machine and Vehicle Operators 18 21 3
Work experience in a
related occupation
11-2022 Sales Managers
36 38 2
Bachelor's or higher
degree, plus work
experience

A p p l i e d D e v e l o p m e n t E c o n o m i c s | P a g e 23
SOC Code Occupation 2012 Jobs
2017 Jobs (Projected)
Change 2012 to
2017 Education Level
11-3031 Financial Managers
22 24 2
Bachelor's or higher
degree, plus work
experience
13-1023 Purchasing Agents, Except
Wholesale, Retail, and Farm Products 19 21 2
Long-term on-the-job
training
17-2031 Biomedical Engineers 15 17 2
Bachelor's degree
19-1012 Food Scientists and Technologists 18 20 2
Bachelor's degree
33-9032 Security Guards 16 18 2
Short-term on-the-job
training
35-2021 Food Preparation Workers 23 25 2
Short-term on-the-job
training
37-3013 Tree Trimmers and Pruners 14 16 2
Short-term on-the-job
training
39-7011 Tour Guides and Escorts 14 16 2
Moderate-term on-the-job
training
43-3021 Billing and Posting Clerks 14 16 2
Short-term on-the-job
training
43-9011 Computer Operators 18 20 2
Moderate-term on-the-job
training
45-4022 Logging Equipment Operators 19 21 2
Moderate-term on-the-job
training
47-2031 Carpenters 18 20 2
Long-term on-the-job
training
47-2141 Painters, Construction and
Maintenance 15 17 2
Moderate-term on-the-job
training
51-9032 Cutting and Slicing Machine Setters,
Operators, and Tenders 14 16 2
Short-term on-the-job
training
51-9193 Cooling and Freezing Equipment
Operators and Tenders 23 25 2
Moderate-term on-the-job
training
11-1031 Legislators
11 12 1
Bachelor's or higher
degree, plus work
experience
11-3011 Administrative Services Managers 12 13 1
Work experience in a
related occupation
11-3021 Computer and Information Systems
Managers 15 16 1
Bachelor's or higher
degree, plus work
experience
11-3121 Human Resources Managers 14 15 1
Bachelor's or higher
degree, plus work
experience
11-9141 Property, Real Estate, and
Community Association Managers 14 15 1
Work experience in a
related occupation
19-4011 Agricultural and Food Science
Technicians 14 15 1 Associate's degree
25-3999 Teachers and Instructors, All Other 10 11 1
Bachelor's degree
37-2012 Maids and Housekeeping Cleaners 37 38 1
Short-term on-the-job
training
A p p l i e d D e v e l o p m e n t E c o n o m i c s | P a g e 24
SOC Code Occupation 2012 Jobs
2017 Jobs (Projected)
Change 2012 to
2017 Education Level
37-2021 Pest Control Workers 12 13 1 Moderate-term on-the-job
training
43-6012 Legal Secretaries 12 13 1 Postsecondary non-degree
award
47-2061 Construction Laborers 23 24 1 Short-term on-the-job
training
47-2152 Plumbers, Pipefitters, and
Steamfitters 12 13 1
Long-term on-the-job
training
49-3043 Rail Car Repairers 14 15 1 Long-term on-the-job
training
49-9097 Signal and Track Switch Repairers 10 11 1 Postsecondary non-degree
award
49-9799 Installation, Maintenance, and Repair
Workers, All Other 15 16 1
Moderate-term on-the-job
training
51-3011 Bakers 11 12 1 Long-term on-the-job
training
51-3091
Food and Tobacco Roasting, Baking,
and Drying Machine Operators and
Tenders 12 13 1
Moderate-term on-the-job
training
53-1021 First-Line Supervisors of Helpers,
Laborers, and Material Movers, Hand 54 55 1
Work experience in a
related occupation
Source: ADE, Inc.; data from EMSI.
Notes: The occupational tables are compiled from the job distribution for each industry sector within the subgroup. The data only includes
those occupations that have at least 10 jobs within each sector.
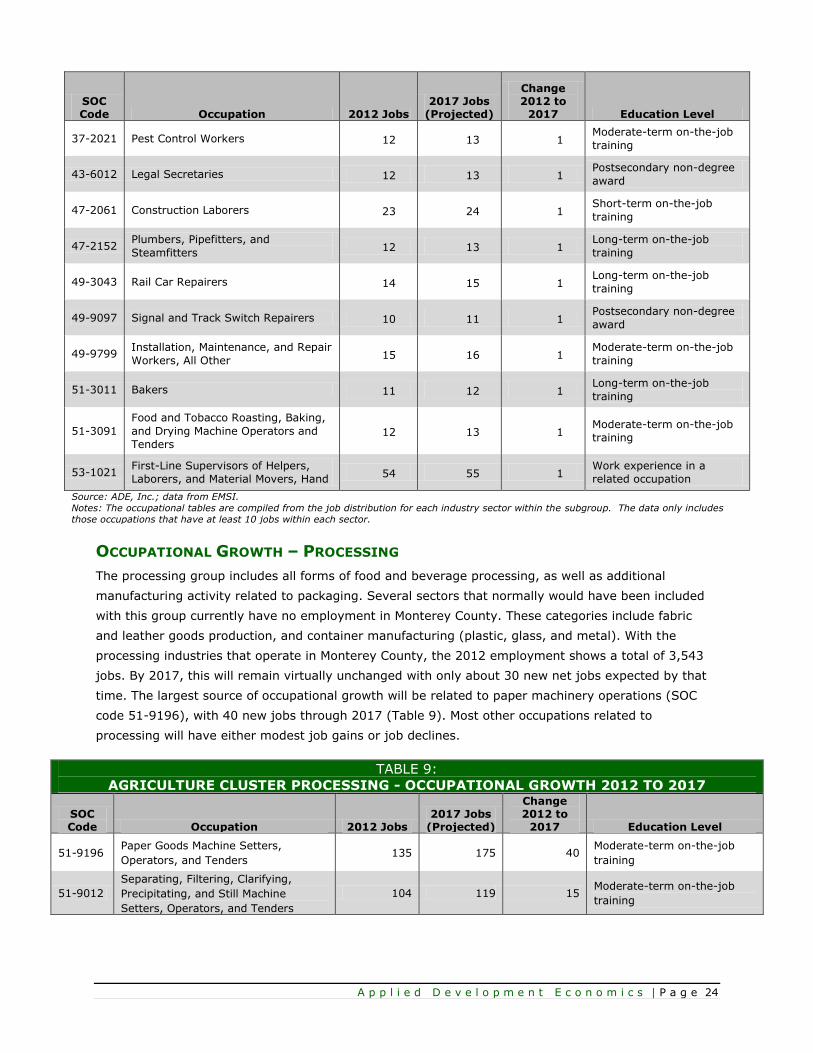
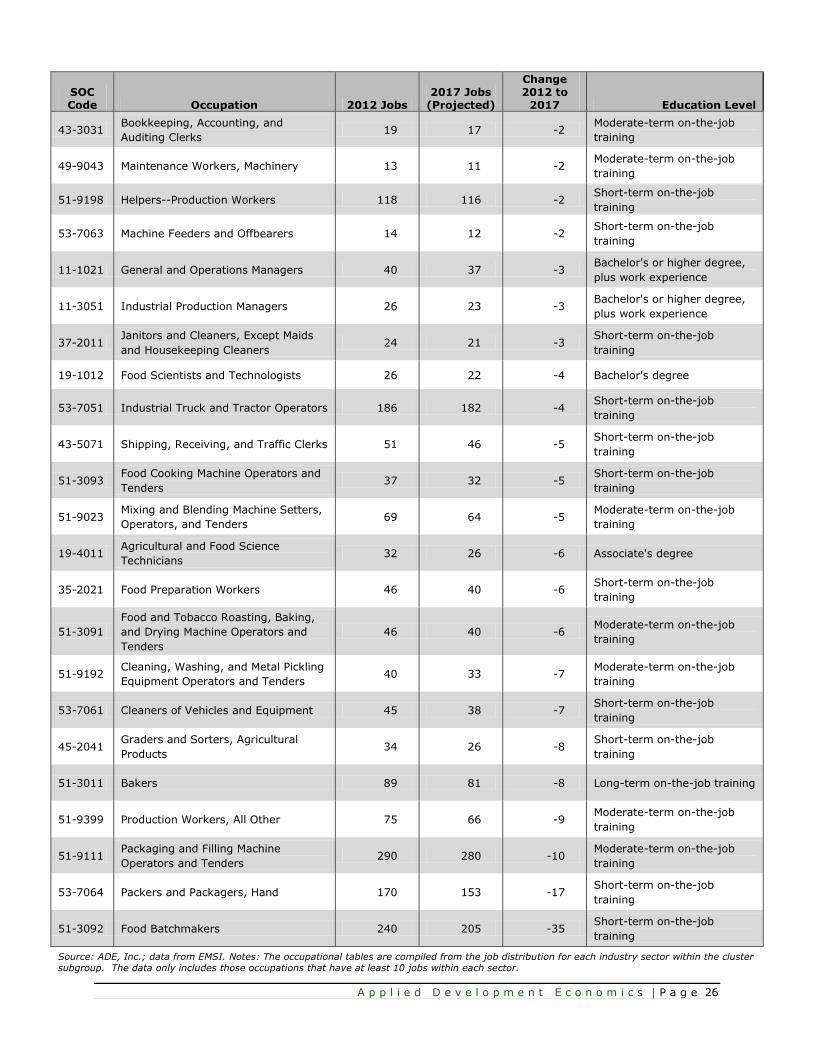
OCCUPATIONAL GROWTH – PROCESSING
The processing group includes all forms of food and beverage processing, as well as additional
manufacturing activity related to packaging. Several sectors that normally would have been included
with this group currently have no employment in Monterey County. These categories include fabric
and leather goods production, and container manufacturing (plastic, glass, and metal). With the
processing industries that operate in Monterey County, the 2012 employment shows a total of 3,543
jobs. By 2017, this will remain virtually unchanged with only about 30 new net jobs expected by that
time. The largest source of occupational growth will be related to paper machinery operations (SOC
code 51-9196), with 40 new jobs through 2017 (Table 9). Most other occupations related to
processing will have either modest job gains or job declines.
TABLE 9:
AGRICULTURE CLUSTER PROCESSING - OCCUPATIONAL GROWTH 2012 TO 2017
SOC Code Occupation 2012 Jobs
2017 Jobs (Projected)
Change 2012 to
2017 Education Level
51-9196 Paper Goods Machine Setters,
Operators, and Tenders 135 175 40
Moderate-term on-the-job
training
51-9012
Separating, Filtering, Clarifying,
Precipitating, and Still Machine
Setters, Operators, and Tenders
104 119 15 Moderate-term on-the-job
training

A p p l i e d D e v e l o p m e n t E c o n o m i c s | P a g e 25
SOC Code Occupation 2012 Jobs
2017 Jobs (Projected)
Change 2012 to
2017 Education Level
41-4012
Sales Representatives, Wholesale and
Manufacturing, Except Technical and
Scientific Products
90 98 8 Moderate-term on-the-job
training
45-2092 Farmworkers and Laborers, Crop,
Nursery, and Greenhouse 77 85 8
Short-term on-the-job
training
49-9041 Industrial Machinery Mechanics 39 45 6 Long-term on-the-job training
51-7042
Woodworking Machine Setters,
Operators, and Tenders, Except
Sawing
11 16 5 Short-term on-the-job
training
41-2031 Retail Salespersons 55 59 4 Short-term on-the-job
training
41-9011 Demonstrators and Product Promoters 31 35 4 Short-term on-the-job
training
51-5112 Printing Press Operators 12 16 4 Moderate-term on-the-job
training
51-9032 Cutting and Slicing Machine Setters,
Operators, and Tenders 32 36 4
Short-term on-the-job
training
53-3031 Driver/Sales Workers 34 38 4 Short-term on-the-job
training
53-7062 Laborers and Freight, Stock, and
Material Movers, Hand 83 87 4
Short-term on-the-job
training
53-3032 Heavy and Tractor-Trailer Truck
Drivers 56 59 3
Short-term on-the-job
training
53-3033 Light Truck or Delivery Services
Drivers 45 48 3
Short-term on-the-job
training
51-1011 First-Line Supervisors of Production
and Operating Workers 83 85 2
Work experience in a related
occupation
35-3031 Waiters and Waitresses 11 12 1 Short-term on-the-job
training
43-5081 Stock Clerks and Order Fillers 28 28 0 Short-term on-the-job
training
51-2092 Team Assemblers 12 12 0 Moderate-term on-the-job
training
53-1021 First-Line Supervisors of Helpers,
Laborers, and Material Movers, Hand 12 12 0
Work experience in a related
occupation
43-4051 Customer Service Representatives 13 12 -1 Short-term on-the-job
training
43-9061 Office Clerks, General 33 32 -1 Short-term on-the-job
training
49-9071 Maintenance and Repair Workers,
General 44 43 -1
Moderate-term on-the-job
training
51-9061 Inspectors, Testers, Sorters,
Samplers, and Weighers 15 14 -1
Moderate-term on-the-job
training
53-1031
First-Line Supervisors of
Transportation and Material-Moving
Machine and Vehicle Operators
13 12 -1 Work experience in a related
occupation
41-2011 Cashiers 21 19 -2 Short-term on-the-job
training
A p p l i e d D e v e l o p m e n t E c o n o m i c s | P a g e 26
SOC Code Occupation 2012 Jobs
2017 Jobs (Projected)
Change 2012 to
2017 Education Level
43-3031 Bookkeeping, Accounting, and
Auditing Clerks 19 17 -2
Moderate-term on-the-job
training
49-9043 Maintenance Workers, Machinery 13 11 -2 Moderate-term on-the-job
training
51-9198 Helpers--Production Workers 118 116 -2 Short-term on-the-job
training
53-7063 Machine Feeders and Offbearers 14 12 -2 Short-term on-the-job
training
11-1021 General and Operations Managers 40 37 -3 Bachelor's or higher degree,
plus work experience
11-3051 Industrial Production Managers 26 23 -3 Bachelor's or higher degree,
plus work experience
37-2011 Janitors and Cleaners, Except Maids
and Housekeeping Cleaners 24 21 -3
Short-term on-the-job
training
19-1012 Food Scientists and Technologists 26 22 -4 Bachelor's degree
53-7051 Industrial Truck and Tractor Operators 186 182 -4 Short-term on-the-job
training
43-5071 Shipping, Receiving, and Traffic Clerks 51 46 -5 Short-term on-the-job
training
51-3093 Food Cooking Machine Operators and
Tenders 37 32 -5
Short-term on-the-job
training
51-9023 Mixing and Blending Machine Setters,
Operators, and Tenders 69 64 -5
Moderate-term on-the-job
training
19-4011 Agricultural and Food Science
Technicians 32 26 -6 Associate's degree
35-2021 Food Preparation Workers 46 40 -6 Short-term on-the-job
training
51-3091
Food and Tobacco Roasting, Baking,
and Drying Machine Operators and
Tenders
46 40 -6 Moderate-term on-the-job
training
51-9192 Cleaning, Washing, and Metal Pickling
Equipment Operators and Tenders 40 33 -7
Moderate-term on-the-job
training
53-7061 Cleaners of Vehicles and Equipment 45 38 -7 Short-term on-the-job
training
45-2041 Graders and Sorters, Agricultural
Products 34 26 -8
Short-term on-the-job
training
51-3011 Bakers 89 81 -8 Long-term on-the-job training
51-9399 Production Workers, All Other 75 66 -9 Moderate-term on-the-job
training
51-9111 Packaging and Filling Machine
Operators and Tenders 290 280 -10
Moderate-term on-the-job
training
53-7064 Packers and Packagers, Hand 170 153 -17 Short-term on-the-job
training
51-3092 Food Batchmakers 240 205 -35 Short-term on-the-job
training
Source: ADE, Inc.; data from EMSI. Notes: The occupational tables are compiled from the job distribution for each industry sector within the cluster subgroup. The data only includes those occupations that have at least 10 jobs within each sector.
A p p l i e d D e v e l o p m e n t E c o n o m i c s | P a g e 27
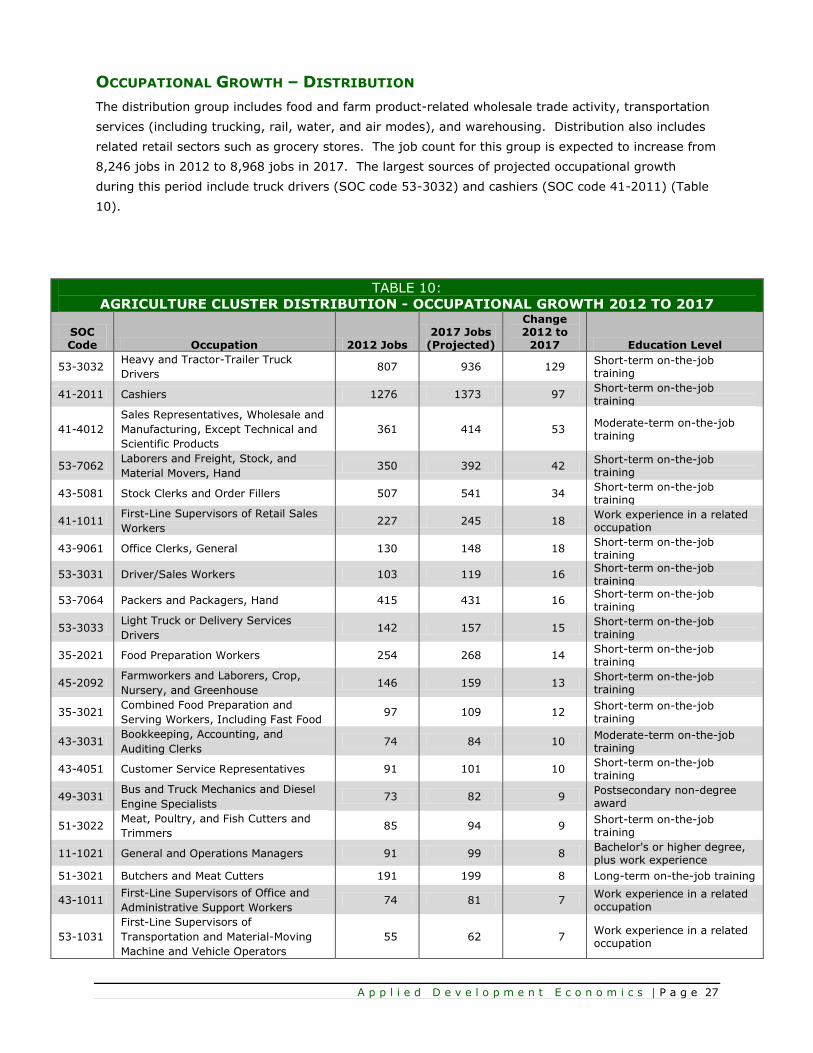
OCCUPATIONAL GROWTH – DISTRIBUTION
The distribution group includes food and farm product-related wholesale trade activity, transportation
services (including trucking, rail, water, and air modes), and warehousing. Distribution also includes
related retail sectors such as grocery stores. The job count for this group is expected to increase from
8,246 jobs in 2012 to 8,968 jobs in 2017. The largest sources of projected occupational growth
during this period include truck drivers (SOC code 53-3032) and cashiers (SOC code 41-2011) (Table
10).
TABLE 10:
AGRICULTURE CLUSTER DISTRIBUTION - OCCUPATIONAL GROWTH 2012 TO 2017
SOC Code Occupation 2012 Jobs
2017 Jobs (Projected)
Change 2012 to
2017 Education Level
53-3032 Heavy and Tractor-Trailer Truck
Drivers 807 936 129
Short-term on-the-job training
41-2011 Cashiers 1276 1373 97 Short-term on-the-job training
41-4012
Sales Representatives, Wholesale and
Manufacturing, Except Technical and
Scientific Products
361 414 53 Moderate-term on-the-job training
53-7062 Laborers and Freight, Stock, and
Material Movers, Hand 350 392 42
Short-term on-the-job training
43-5081 Stock Clerks and Order Fillers 507 541 34 Short-term on-the-job training
41-1011 First-Line Supervisors of Retail Sales
Workers 227 245 18
Work experience in a related occupation
43-9061 Office Clerks, General 130 148 18 Short-term on-the-job training
53-3031 Driver/Sales Workers 103 119 16 Short-term on-the-job training
53-7064 Packers and Packagers, Hand 415 431 16 Short-term on-the-job training
53-3033 Light Truck or Delivery Services
Drivers 142 157 15
Short-term on-the-job training
35-2021 Food Preparation Workers 254 268 14 Short-term on-the-job training
45-2092 Farmworkers and Laborers, Crop,
Nursery, and Greenhouse 146 159 13
Short-term on-the-job training
35-3021 Combined Food Preparation and
Serving Workers, Including Fast Food 97 109 12
Short-term on-the-job training
43-3031 Bookkeeping, Accounting, and
Auditing Clerks 74 84 10
Moderate-term on-the-job training
43-4051 Customer Service Representatives 91 101 10 Short-term on-the-job training
49-3031 Bus and Truck Mechanics and Diesel
Engine Specialists 73 82 9
Postsecondary non-degree award
51-3022 Meat, Poultry, and Fish Cutters and
Trimmers 85 94 9
Short-term on-the-job training
11-1021 General and Operations Managers 91 99 8 Bachelor's or higher degree, plus work experience
51-3021 Butchers and Meat Cutters 191 199 8 Long-term on-the-job training
43-1011 First-Line Supervisors of Office and
Administrative Support Workers 74 81 7
Work experience in a related occupation
53-1031
First-Line Supervisors of
Transportation and Material-Moving
Machine and Vehicle Operators
55 62 7 Work experience in a related occupation

A p p l i e d D e v e l o p m e n t E c o n o m i c s | P a g e 28
SOC Code Occupation 2012 Jobs
2017 Jobs (Projected)
Change 2012 to
2017 Education Level
43-5071 Shipping, Receiving, and Traffic Clerks 126 132 6 Short-term on-the-job training
43-5032 Dispatchers, Except Police, Fire, and
Ambulance 36 41 5
Moderate-term on-the-job training
43-5032 Dispatchers, Except Police, Fire, and
Ambulance 36 41 5
Moderate-term on-the-job training
37-2011 Janitors and Cleaners, Except Maids
and Housekeeping Cleaners 37 41 4
Short-term on-the-job training
53-1021 First-Line Supervisors of Helpers,
Laborers, and Material Movers, Hand 45 49 4
Work experience in a related occupation
53-7051 Industrial Truck and Tractor Operators 196 200 4 Short-term on-the-job training
27-1026 Merchandise Displayers and Window
Trimmers 16 19 3
Moderate-term on-the-job training
29-1051 Pharmacists 19 22 3 First professional degree
29-2052 Pharmacy Technicians 24 27 3 Moderate-term on-the-job training
35-1012 First-Line Supervisors of Food
Preparation and Serving Workers 31 34 3
Work experience in a related occupation
41-1012 First-Line Supervisors of Non-Retail
Sales Workers 27 30 3
Work experience in a related occupation
45-2041 Graders and Sorters, Agricultural
Products 43 46 3
Short-term on-the-job training
51-9111 Packaging and Filling Machine
Operators and Tenders 24 27 3
Moderate-term on-the-job training
11-2022 Sales Managers 22 24 2 Bachelor's or higher degree, plus work experience
13-1022 Wholesale and Retail Buyers, Except
Farm Products 23 25 2 Long-term on-the-job training
31-9095 Pharmacy Aides 14 16 2 Short-term on-the-job
training
41-2021 Counter and Rental Clerks 18 20 2 Short-term on-the-job training
41-9011 Demonstrators and Product Promoters 17 19 2 Short-term on-the-job training
43-4151 Order Clerks 16 18 2 Short-term on-the-job training
51-1011 First-Line Supervisors of Production
and Operating Workers 18 20 2
Work experience in a related occupation
51-3011 Bakers 75 77 2 Long-term on-the-job training
53-7061 Cleaners of Vehicles and Equipment 14 16 2 Short-term on-the-job training
13-1021 Buyers and Purchasing Agents, Farm
Products 14 15 1 Long-term on-the-job training
27-1023 Floral Designers 17 18 1 Short-term on-the-job training
35-3022 Counter Attendants, Cafeteria, Food
Concession, and Coffee Shop 17 18 1
Short-term on-the-job training
41-9799 Sales and Related Workers, All Other 11 12 1 Moderate-term on-the-job training
49-3011 Aircraft Mechanics and Service
Technicians 30 31 1
Postsecondary non-degree award
49-9071 Maintenance and Repair Workers,
General 13 14 1
Moderate-term on-the-job training
51-3092 Food Batchmakers 15 16 1 Short-term on-the-job training
43-4181 Reservation and Transportation Ticket
Agents and Travel Clerks 74 74 0
Short-term on-the-job training
A p p l i e d D e v e l o p m e n t E c o n o m i c s | P a g e 29
SOC Code Occupation 2012 Jobs
2017 Jobs (Projected)
Change 2012 to
2017 Education Level
43-6014
Secretaries and Administrative
Assistants, Except Legal, Medical, and
Executive
16 16 0 Short-term on-the-job training
53-7199 Material Moving Workers, All Other 18 18 0 Material Moving Workers, All Other
41-2031 Retail Salespersons 208 200 -8 Short-term on-the-job training
Source: ADE, Inc.; data from EMSI.
Notes: The occupational tables are compiled from the job distribution for each industry sector within the cluster subgroup. The
data only includes those occupations that have at least 10 jobs within each sector.
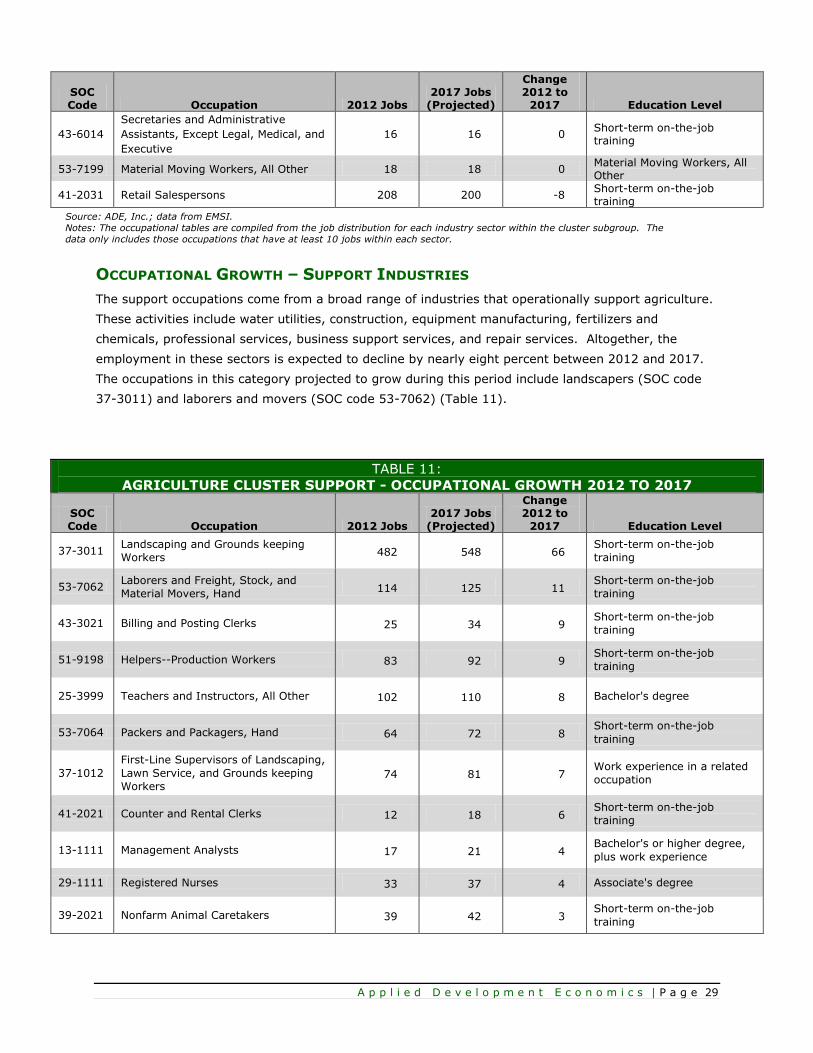
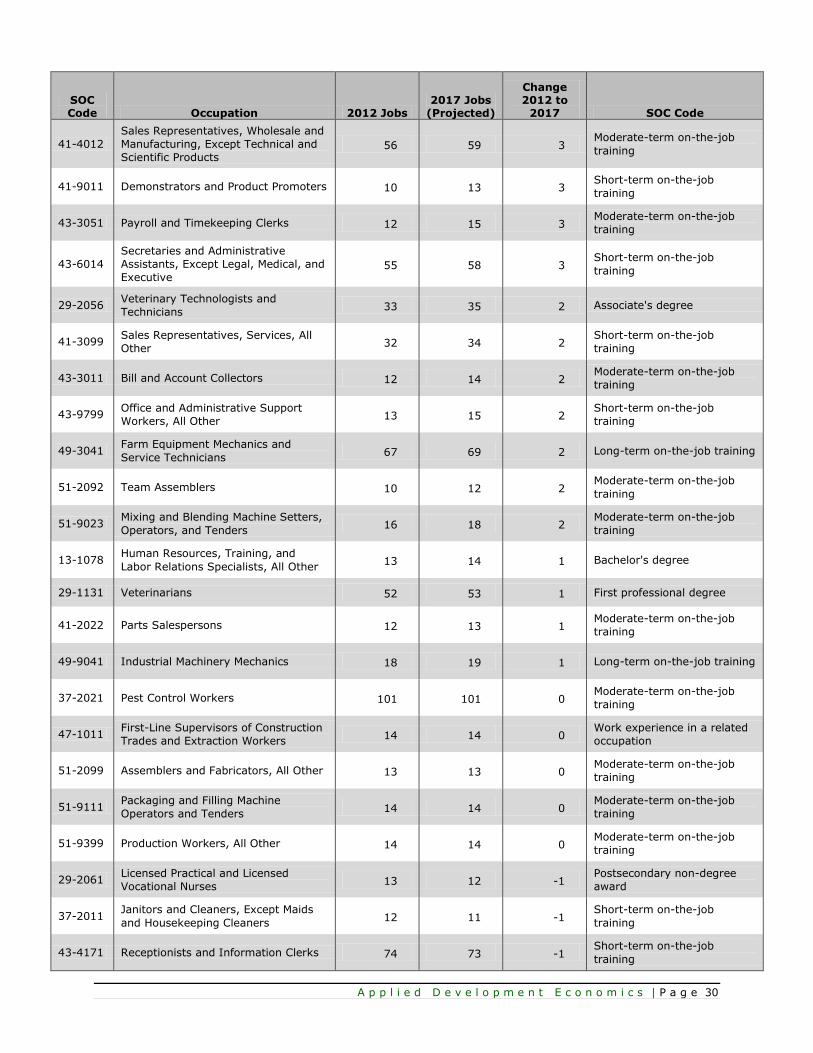
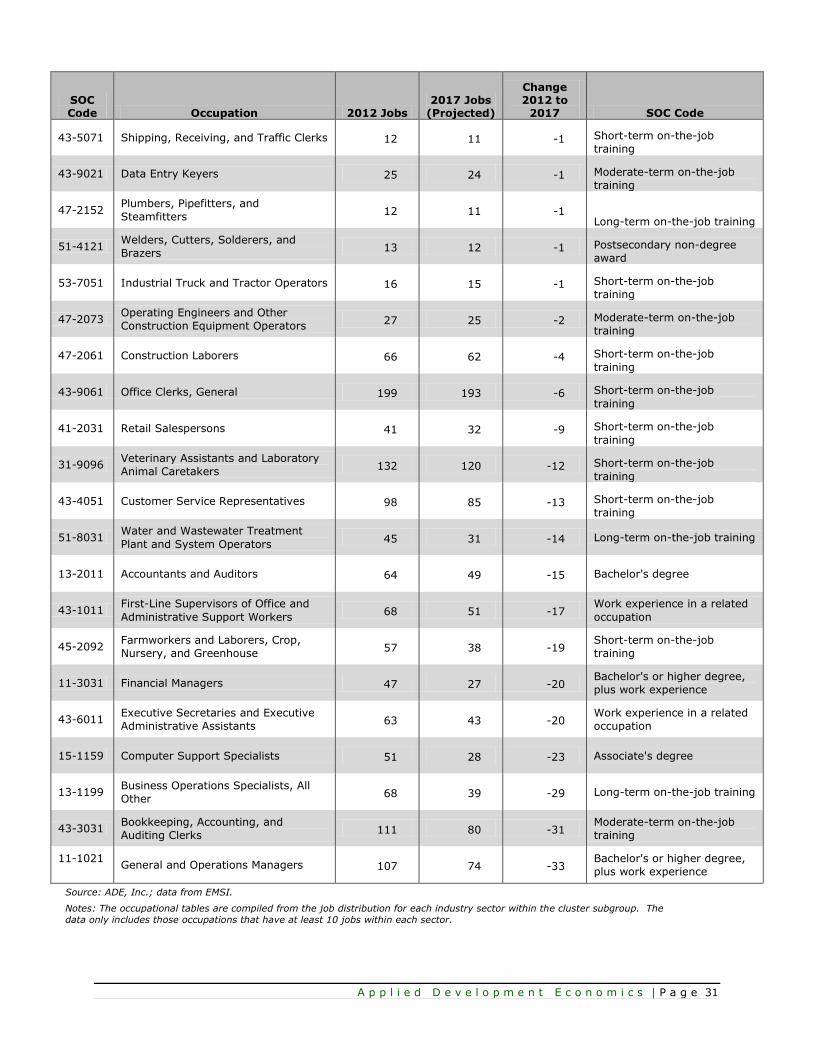
OCCUPATIONAL GROWTH – SUPPORT INDUSTRIES
The support occupations come from a broad range of industries that operationally support agriculture.
These activities include water utilities, construction, equipment manufacturing, fertilizers and
chemicals, professional services, business support services, and repair services. Altogether, the
employment in these sectors is expected to decline by nearly eight percent between 2012 and 2017.
The occupations in this category projected to grow during this period include landscapers (SOC code
37-3011) and laborers and movers (SOC code 53-7062) (Table 11).
TABLE 11:
AGRICULTURE CLUSTER SUPPORT - OCCUPATIONAL GROWTH 2012 TO 2017
SOC Code Occupation 2012 Jobs
2017 Jobs (Projected)
Change 2012 to
2017 Education Level
37-3011 Landscaping and Grounds keeping
Workers 482 548 66
Short-term on-the-job
training
53-7062 Laborers and Freight, Stock, and
Material Movers, Hand 114 125 11
Short-term on-the-job
training
43-3021 Billing and Posting Clerks 25 34 9 Short-term on-the-job
training
51-9198 Helpers--Production Workers 83 92 9 Short-term on-the-job
training
25-3999 Teachers and Instructors, All Other 102 110 8 Bachelor's degree
53-7064 Packers and Packagers, Hand 64 72 8 Short-term on-the-job
training
37-1012
First-Line Supervisors of Landscaping,
Lawn Service, and Grounds keeping
Workers 74 81 7
Work experience in a related
occupation
41-2021 Counter and Rental Clerks 12 18 6 Short-term on-the-job
training
13-1111 Management Analysts 17 21 4 Bachelor's or higher degree,
plus work experience
29-1111 Registered Nurses 33 37 4 Associate's degree
39-2021 Nonfarm Animal Caretakers 39 42 3 Short-term on-the-job
training
A p p l i e d D e v e l o p m e n t E c o n o m i c s | P a g e 30
SOC Code Occupation 2012 Jobs
2017 Jobs (Projected)
Change 2012 to
2017 SOC Code
41-4012
Sales Representatives, Wholesale and
Manufacturing, Except Technical and
Scientific Products 56 59 3
Moderate-term on-the-job
training
41-9011 Demonstrators and Product Promoters 10 13 3 Short-term on-the-job
training
43-3051 Payroll and Timekeeping Clerks 12 15 3 Moderate-term on-the-job
training
43-6014
Secretaries and Administrative
Assistants, Except Legal, Medical, and
Executive 55 58 3
Short-term on-the-job
training
29-2056 Veterinary Technologists and
Technicians 33 35 2 Associate's degree
41-3099 Sales Representatives, Services, All
Other 32 34 2
Short-term on-the-job
training
43-3011 Bill and Account Collectors 12 14 2 Moderate-term on-the-job
training
43-9799 Office and Administrative Support
Workers, All Other 13 15 2
Short-term on-the-job
training
49-3041 Farm Equipment Mechanics and
Service Technicians 67 69 2 Long-term on-the-job training
51-2092 Team Assemblers 10 12 2 Moderate-term on-the-job
training
51-9023 Mixing and Blending Machine Setters,
Operators, and Tenders 16 18 2
Moderate-term on-the-job
training
13-1078 Human Resources, Training, and
Labor Relations Specialists, All Other 13 14 1 Bachelor's degree
29-1131 Veterinarians 52 53 1 First professional degree
41-2022 Parts Salespersons 12 13 1 Moderate-term on-the-job
training
49-9041 Industrial Machinery Mechanics 18 19 1 Long-term on-the-job training
37-2021 Pest Control Workers 101 101 0 Moderate-term on-the-job
training
47-1011 First-Line Supervisors of Construction
Trades and Extraction Workers 14 14 0
Work experience in a related
occupation
51-2099 Assemblers and Fabricators, All Other 13 13 0 Moderate-term on-the-job
training
51-9111 Packaging and Filling Machine
Operators and Tenders 14 14 0
Moderate-term on-the-job
training
51-9399 Production Workers, All Other 14 14 0 Moderate-term on-the-job
training
29-2061 Licensed Practical and Licensed
Vocational Nurses 13 12 -1
Postsecondary non-degree
award
37-2011 Janitors and Cleaners, Except Maids
and Housekeeping Cleaners 12 11 -1
Short-term on-the-job
training
43-4171 Receptionists and Information Clerks 74 73 -1 Short-term on-the-job
training
A p p l i e d D e v e l o p m e n t E c o n o m i c s | P a g e 31
SOC Code Occupation 2012 Jobs
2017 Jobs (Projected)
Change 2012 to
2017 SOC Code
43-5071 Shipping, Receiving, and Traffic Clerks 12 11 -1 Short-term on-the-job
training
43-9021 Data Entry Keyers 25 24 -1 Moderate-term on-the-job
training
47-2152 Plumbers, Pipefitters, and
Steamfitters 12 11 -1
Long-term on-the-job training
51-4121 Welders, Cutters, Solderers, and
Brazers 13 12 -1 Postsecondary non-degree
award
53-7051 Industrial Truck and Tractor Operators 16 15 -1 Short-term on-the-job
training
47-2073 Operating Engineers and Other
Construction Equipment Operators 27 25 -2 Moderate-term on-the-job
training
47-2061 Construction Laborers 66 62 -4 Short-term on-the-job
training
43-9061 Office Clerks, General 199 193 -6 Short-term on-the-job
training
41-2031 Retail Salespersons 41 32 -9 Short-term on-the-job
training
31-9096 Veterinary Assistants and Laboratory
Animal Caretakers 132 120 -12 Short-term on-the-job
training
43-4051 Customer Service Representatives 98 85 -13 Short-term on-the-job
training
51-8031 Water and Wastewater Treatment
Plant and System Operators 45 31 -14 Long-term on-the-job training
13-2011 Accountants and Auditors 64 49 -15 Bachelor's degree
43-1011 First-Line Supervisors of Office and
Administrative Support Workers 68 51 -17
Work experience in a related
occupation
45-2092 Farmworkers and Laborers, Crop,
Nursery, and Greenhouse 57 38 -19
Short-term on-the-job
training
11-3031 Financial Managers 47 27 -20 Bachelor's or higher degree,
plus work experience
43-6011 Executive Secretaries and Executive
Administrative Assistants 63 43 -20
Work experience in a related
occupation
15-1159 Computer Support Specialists 51 28 -23 Associate's degree
13-1199 Business Operations Specialists, All
Other 68 39 -29 Long-term on-the-job training
43-3031 Bookkeeping, Accounting, and
Auditing Clerks 111 80 -31
Moderate-term on-the-job
training
11-1021
General and Operations Managers 107 74 -33
Bachelor's or higher degree,
plus work experience
Source: ADE, Inc.; data from EMSI.
Notes: The occupational tables are compiled from the job distribution for each industry sector within the cluster subgroup. The
data only includes those occupations that have at least 10 jobs within each sector.
A p p l i e d D e v e l o p m e n t E c o n o m i c s | P a g e 32
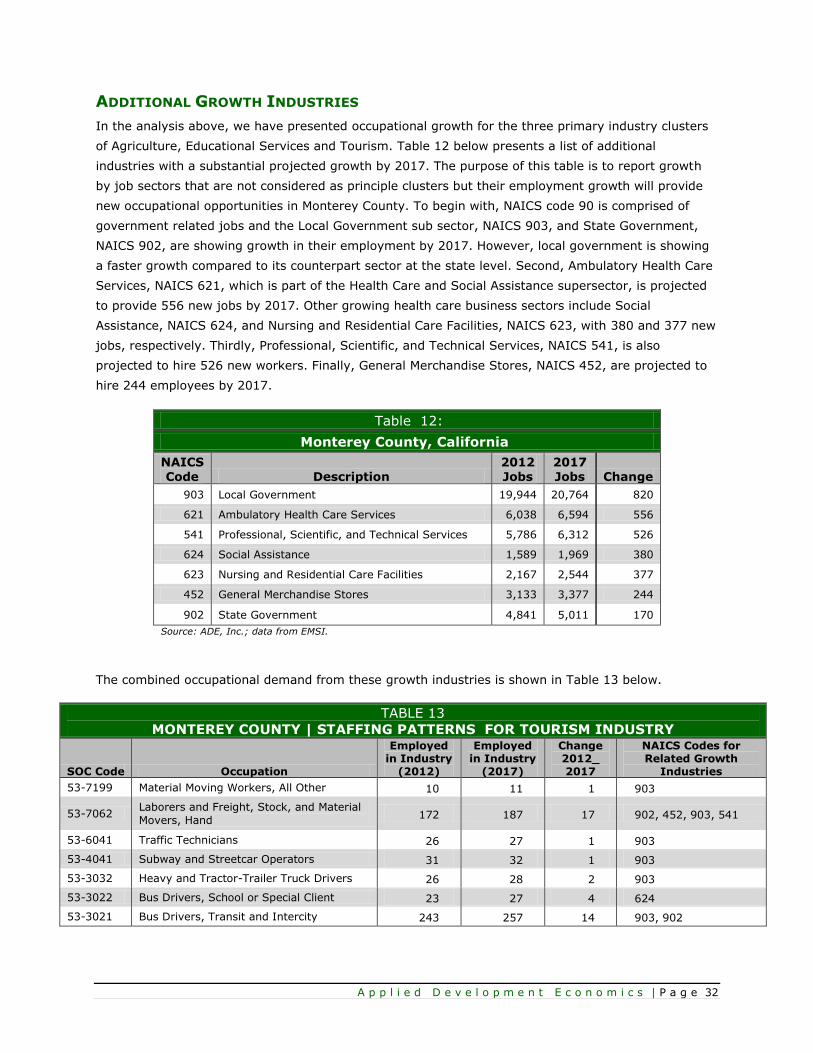
ADDITIONAL GROWTH INDUSTRIES
In the analysis above, we have presented occupational growth for the three primary industry clusters
of Agriculture, Educational Services and Tourism. Table 12 below presents a list of additional
industries with a substantial projected growth by 2017. The purpose of this table is to report growth
by job sectors that are not considered as principle clusters but their employment growth will provide
new occupational opportunities in Monterey County. To begin with, NAICS code 90 is comprised of
government related jobs and the Local Government sub sector, NAICS 903, and State Government,
NAICS 902, are showing growth in their employment by 2017. However, local government is showing
a faster growth compared to its counterpart sector at the state level. Second, Ambulatory Health Care
Services, NAICS 621, which is part of the Health Care and Social Assistance supersector, is projected
to provide 556 new jobs by 2017. Other growing health care business sectors include Social
Assistance, NAICS 624, and Nursing and Residential Care Facilities, NAICS 623, with 380 and 377 new
jobs, respectively. Thirdly, Professional, Scientific, and Technical Services, NAICS 541, is also
projected to hire 526 new workers. Finally, General Merchandise Stores, NAICS 452, are projected to
hire 244 employees by 2017.
Table 12:
Monterey County, California
NAICS Code Description
2012 Jobs
2017 Jobs Change
903 Local Government 19,944 20,764 820
621 Ambulatory Health Care Services 6,038 6,594 556
541 Professional, Scientific, and Technical Services 5,786 6,312 526
624 Social Assistance 1,589 1,969 380
623 Nursing and Residential Care Facilities 2,167 2,544 377
452 General Merchandise Stores 3,133 3,377 244
902 State Government 4,841 5,011 170
Source: ADE, Inc.; data from EMSI.
The combined occupational demand from these growth industries is shown in Table 13 below.
TABLE 13
MONTEREY COUNTY | STAFFING PATTERNS FOR TOURISM INDUSTRY
SOC Code Occupation
Employed in Industry
(2012)
Employed in Industry
(2017)
Change 2012_ 2017
NAICS Codes for Related Growth
Industries
53-7199 Material Moving Workers, All Other 10 11 1 903
53-7062 Laborers and Freight, Stock, and Material
Movers, Hand 172 187 17 902, 452, 903, 541
53-6041 Traffic Technicians 26 27 1 903
53-4041 Subway and Streetcar Operators 31 32 1 903
53-3032 Heavy and Tractor-Trailer Truck Drivers 26 28 2 903
53-3022 Bus Drivers, School or Special Client 23 27 4 624
53-3021 Bus Drivers, Transit and Intercity 243 257 14 903, 902
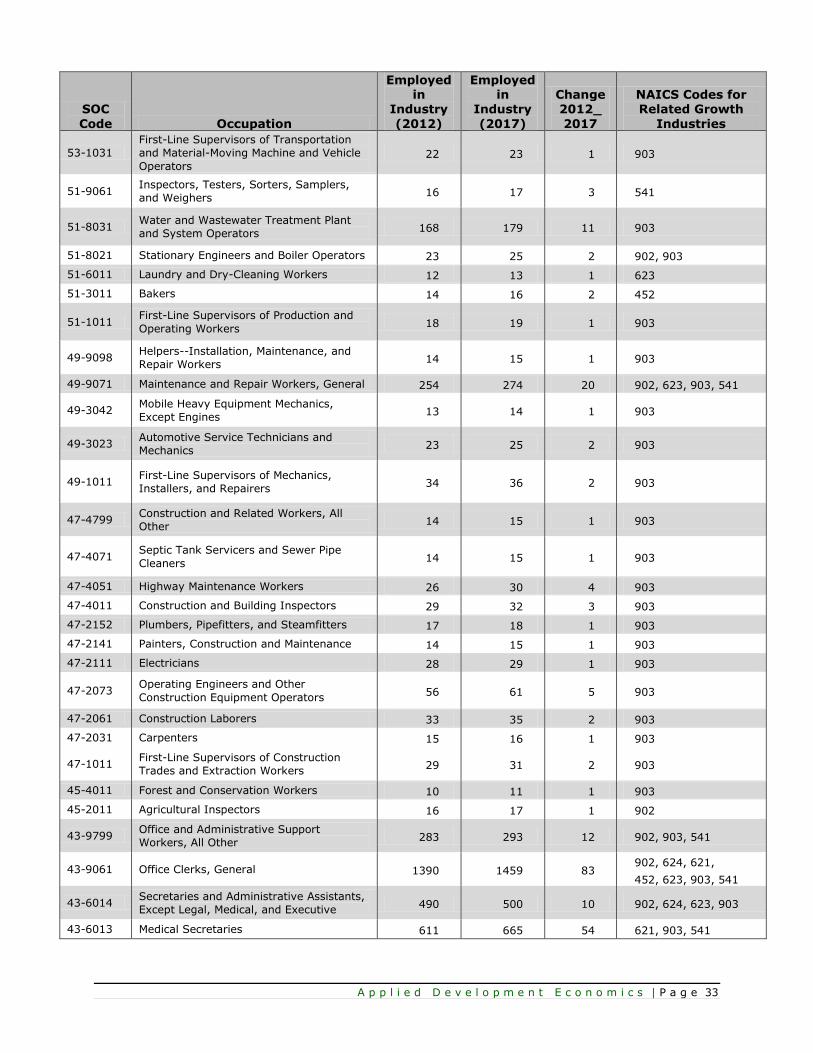
A p p l i e d D e v e l o p m e n t E c o n o m i c s | P a g e 33
SOC
Code Occupation
Employed in
Industry
(2012)
Employed in
Industry
(2017)
Change 2012_
2017
NAICS Codes for Related Growth
Industries
53-1031
First-Line Supervisors of Transportation
and Material-Moving Machine and Vehicle
Operators 22 23 1 903
51-9061 Inspectors, Testers, Sorters, Samplers,
and Weighers 16 17 3 541
51-8031 Water and Wastewater Treatment Plant
and System Operators 168 179 11 903
51-8021 Stationary Engineers and Boiler Operators 23 25 2 902, 903
51-6011 Laundry and Dry-Cleaning Workers 12 13 1 623
51-3011 Bakers 14 16 2 452
51-1011 First-Line Supervisors of Production and
Operating Workers 18 19 1 903
49-9098 Helpers--Installation, Maintenance, and
Repair Workers 14 15 1 903
49-9071 Maintenance and Repair Workers, General 254 274 20 902, 623, 903, 541
49-3042 Mobile Heavy Equipment Mechanics,
Except Engines 13 14 1 903
49-3023 Automotive Service Technicians and
Mechanics 23 25 2 903
49-1011 First-Line Supervisors of Mechanics,
Installers, and Repairers 34 36 2 903
47-4799 Construction and Related Workers, All
Other 14 15 1 903
47-4071 Septic Tank Servicers and Sewer Pipe
Cleaners 14 15 1 903
47-4051 Highway Maintenance Workers 26 30 4 903
47-4011 Construction and Building Inspectors 29 32 3 903
47-2152 Plumbers, Pipefitters, and Steamfitters 17 18 1 903
47-2141 Painters, Construction and Maintenance 14 15 1 903
47-2111 Electricians 28 29 1 903
47-2073 Operating Engineers and Other
Construction Equipment Operators 56 61 5 903
47-2061 Construction Laborers 33 35 2 903
47-2031 Carpenters 15 16 1 903
47-1011 First-Line Supervisors of Construction
Trades and Extraction Workers 29 31 2 903
45-4011 Forest and Conservation Workers 10 11 1 903
45-2011 Agricultural Inspectors 16 17 1 902
43-9799 Office and Administrative Support
Workers, All Other 283 293 12 902, 903, 541
43-9061 Office Clerks, General 1390 1459 83 902, 624, 621,
452, 623, 903, 541
43-6014 Secretaries and Administrative Assistants,
Except Legal, Medical, and Executive 490 500 10 902, 624, 623, 903
43-6013 Medical Secretaries 611 665 54 621, 903, 541
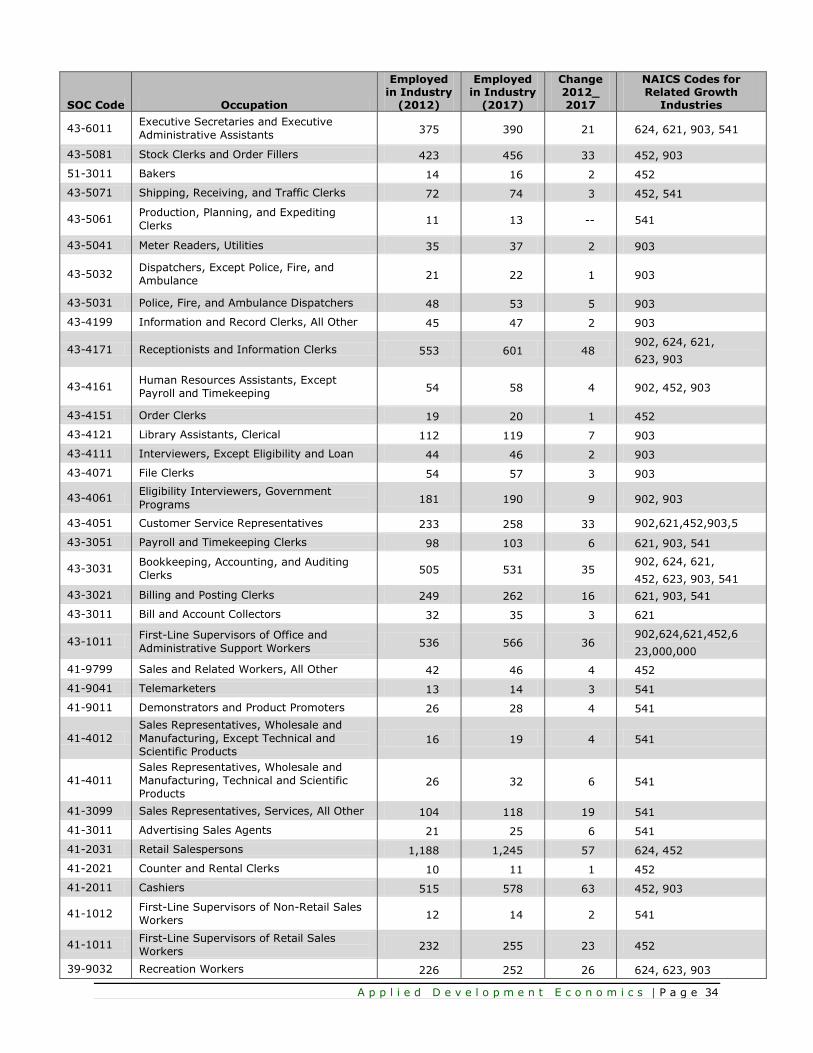
A p p l i e d D e v e l o p m e n t E c o n o m i c s | P a g e 34
SOC Code Occupation
Employed in Industry
(2012)
Employed in Industry
(2017)
Change 2012_ 2017
NAICS Codes for Related Growth
Industries
43-6011 Executive Secretaries and Executive
Administrative Assistants 375 390 21 624, 621, 903, 541
43-5081 Stock Clerks and Order Fillers 423 456 33 452, 903
51-3011 Bakers 14 16 2 452
43-5071 Shipping, Receiving, and Traffic Clerks 72 74 3 452, 541
43-5061 Production, Planning, and Expediting
Clerks 11 13 -- 541
43-5041 Meter Readers, Utilities 35 37 2 903
43-5032 Dispatchers, Except Police, Fire, and
Ambulance 21 22 1 903
43-5031 Police, Fire, and Ambulance Dispatchers 48 53 5 903
43-4199 Information and Record Clerks, All Other 45 47 2 903
43-4171 Receptionists and Information Clerks 553 601 48 902, 624, 621,
623, 903
43-4161 Human Resources Assistants, Except
Payroll and Timekeeping 54 58 4 902, 452, 903
43-4151 Order Clerks 19 20 1 452
43-4121 Library Assistants, Clerical 112 119 7 903
43-4111 Interviewers, Except Eligibility and Loan 44 46 2 903
43-4071 File Clerks 54 57 3 903
43-4061 Eligibility Interviewers, Government
Programs 181 190 9 902, 903
43-4051 Customer Service Representatives 233 258 33 902,621,452,903,5
41 43-3051 Payroll and Timekeeping Clerks 98 103 6 621, 903, 541
43-3031 Bookkeeping, Accounting, and Auditing
Clerks 505 531 35
902, 624, 621,
452, 623, 903, 541
43-3021 Billing and Posting Clerks 249 262 16 621, 903, 541
43-3011 Bill and Account Collectors 32 35 3 621
43-1011 First-Line Supervisors of Office and
Administrative Support Workers 536 566 36
902,624,621,452,6
23,000,000
41-9799 Sales and Related Workers, All Other 42 46 4 452
41-9041 Telemarketers 13 14 3 541
41-9011 Demonstrators and Product Promoters 26 28 4 541
41-4012
Sales Representatives, Wholesale and
Manufacturing, Except Technical and
Scientific Products 16 19 4 541
41-4011
Sales Representatives, Wholesale and
Manufacturing, Technical and Scientific
Products 26 32 6 541
41-3099 Sales Representatives, Services, All Other 104 118 19 541
41-3011 Advertising Sales Agents 21 25 6 541
41-2031 Retail Salespersons 1,188 1,245 57 624, 452
41-2021 Counter and Rental Clerks 10 11 1 452
41-2011 Cashiers 515 578 63 452, 903
41-1012 First-Line Supervisors of Non-Retail Sales
Workers 12 14 2 541
41-1011 First-Line Supervisors of Retail Sales
Workers 232 255 23 452
39-9032 Recreation Workers 226 252 26 624, 623, 903

A p p l i e d D e v e l o p m e n t E c o n o m i c s | P a g e 35
SOC Code Occupation
Employed in Industry
(2012)
Employed in Industry
(2017)
Change 2012_ 2017
NAICS Codes for Related Growth
Industries
39-9031 Fitness Trainers and Aerobics Instructors 27 28 1 903
39-9021 Personal Care Aides 287 390 103 624, 621, 623
39-9011 Childcare Workers 239 246 7 624, 903
39-5012 Hairdressers, Hairstylists, and
Cosmetologists 43 44 1 452
39-3091 Amusement and Recreation Attendants 68 72 4 903
39-3019 Gaming Service Workers, All Other 17 19 2 903
39-3011 Gaming Dealers 47 52 5 903
39-2021 Nonfarm Animal Caretakers 41 43 9 541
39-1021 First-Line Supervisors of Personal Service
Workers 42 48 6 624, 623, 903
37-3011 Landscaping and Grounds keeping
Workers 225 236 11 902, 903
37-2012 Maids and Housekeeping Cleaners 160 180 20 623, 903
37-2011 Janitors and Cleaners, Except Maids and
Housekeeping Cleaners 493 521 29
902,624,621,452,6
23,000,000
37-1012
First-Line Supervisors of Landscaping,
Lawn Service, and Grounds keeping
Workers 28 29 1 903
35-9021 Dishwashers 20 24 4 623
35-9011 Dining Room and Cafeteria Attendants and
Bartender Helpers 13 16 3 623
35-3041 Food Servers, Non-restaurant 95 114 19 623, 903
35-3031 Waiters and Waitresses 32 39 7 623, 903
35-3021 Combined Food Preparation and Serving
Workers, Including Fast Food 76 85 9 452, 623, 903
35-2012 Cooks, Institution and Cafeteria 104 125 21 624, 623
35-1012 First-Line Supervisors of Food Preparation
and Serving Workers 43 47 4 623, 903
33-9099 Protective Service Workers, All Other 22 23 1 903
33-9092 Lifeguards, Ski Patrol, and Other
Recreational Protective Service Workers 68 72 4 903
33-9032 Security Guards 120 129 9 902, 452, 903
33-9011 Animal Control Workers 126 132 6 903
33-3052 Transit and Railroad Police 16 17 1 903
33-3051 Police and Sheriff's Patrol Officers 660 705 45 902, 903
33-3041 Parking Enforcement Workers 78 81 3 903
33-3031 Fish and Game Wardens 12 13 1 902
33-3021 Detectives and Criminal Investigators 28 31 3 902, 903
33-3012 Correctional Officers and Jailers 1131 1168 37 902, 903
33-2021 Fire Inspectors and Investigators 33 34 1 903
33-2011 Firefighters 532 565 33 903
33-1021 First-Line Supervisors of Fire Fighting and
Prevention Workers 32 35 3 903
33-1012 First-Line Supervisors of Police and
Detectives 47 50 3 903
33-1011 First-Line Supervisors of Correctional
Officers 49 51 2 902, 903
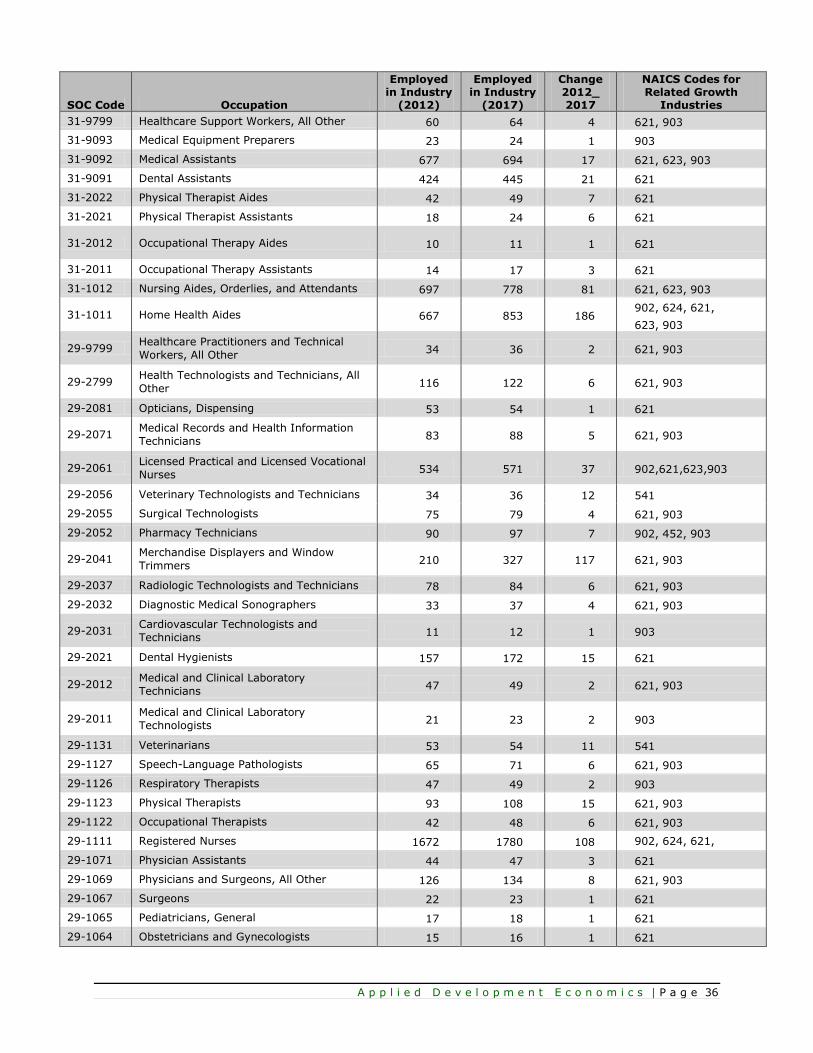
A p p l i e d D e v e l o p m e n t E c o n o m i c s | P a g e 36
SOC Code Occupation
Employed in Industry
(2012)
Employed in Industry
(2017)
Change 2012_ 2017
NAICS Codes for Related Growth
Industries
31-9799 Healthcare Support Workers, All Other 60 64 4 621, 903
31-9093 Medical Equipment Preparers 23 24 1 903
31-9092 Medical Assistants 677 694 17 621, 623, 903
31-9091 Dental Assistants 424 445 21 621
31-2022 Physical Therapist Aides 42 49 7 621
31-2021 Physical Therapist Assistants 18 24 6 621
31-2012 Occupational Therapy Aides 10 11 1 621
31-2011 Occupational Therapy Assistants 14 17 3 621
31-1012 Nursing Aides, Orderlies, and Attendants 697 778 81 621, 623, 903
31-1011 Home Health Aides 667 853 186 902, 624, 621,
623, 903
29-9799 Healthcare Practitioners and Technical
Workers, All Other 34 36 2 621, 903
29-2799 Health Technologists and Technicians, All
Other 116 122 6 621, 903
29-2081 Opticians, Dispensing 53 54 1 621
29-2071 Medical Records and Health Information
Technicians 83 88 5 621, 903
29-2061 Licensed Practical and Licensed Vocational
Nurses 534 571 37 902,621,623,903
29-2056 Veterinary Technologists and Technicians 34 36 12 541
29-2055 Surgical Technologists 75 79 4 621, 903
29-2052 Pharmacy Technicians 90 97 7 902, 452, 903
29-2041 Merchandise Displayers and Window
Trimmers 210 327 117 621, 903
29-2037 Radiologic Technologists and Technicians 78 84 6 621, 903
29-2032 Diagnostic Medical Sonographers 33 37 4 621, 903
29-2031 Cardiovascular Technologists and
Technicians 11 12 1 903
29-2021 Dental Hygienists 157 172 15 621
29-2012 Medical and Clinical Laboratory
Technicians 47 49 2 621, 903
29-2011 Medical and Clinical Laboratory
Technologists 21 23 2 903
29-1131 Veterinarians 53 54 11 541
29-1127 Speech-Language Pathologists 65 71 6 621, 903
29-1126 Respiratory Therapists 47 49 2 903
29-1123 Physical Therapists 93 108 15 621, 903
29-1122 Occupational Therapists 42 48 6 621, 903
29-1111 Registered Nurses 1672 1780 108 902, 624, 621,
623, 903 29-1071 Physician Assistants 44 47 3 621
29-1069 Physicians and Surgeons, All Other 126 134 8 621, 903
29-1067 Surgeons 22 23 1 621
29-1065 Pediatricians, General 17 18 1 621
29-1064 Obstetricians and Gynecologists 15 16 1 621
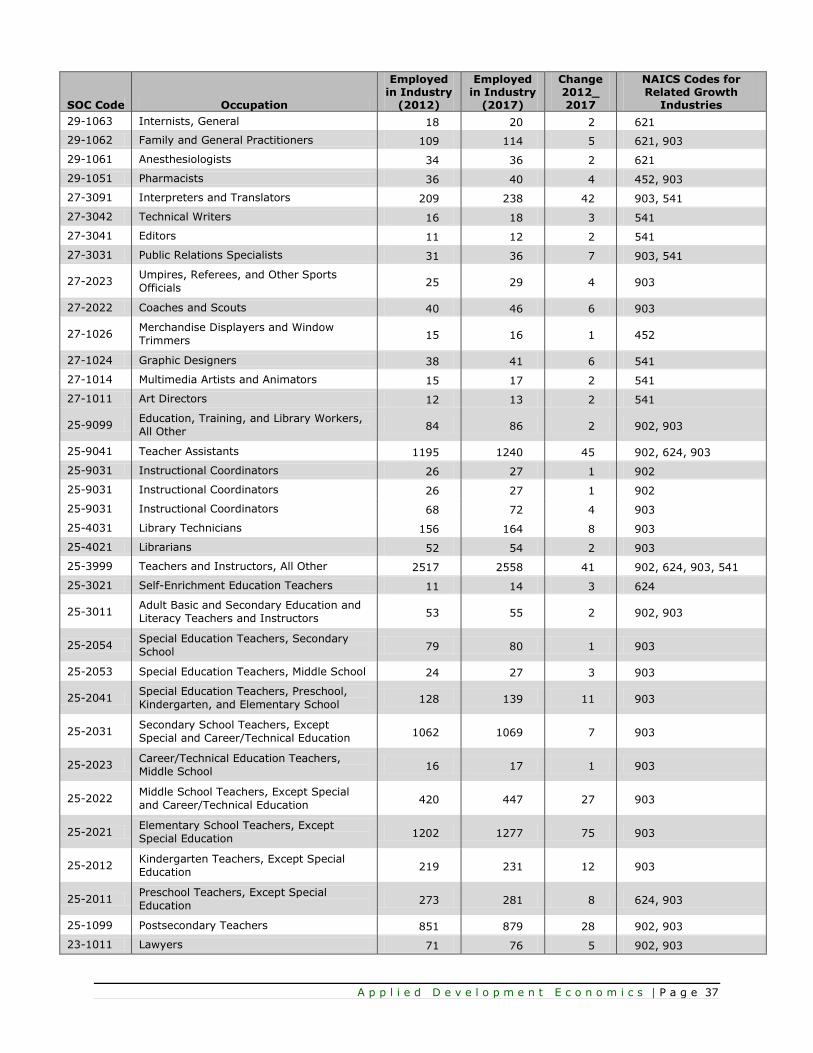
A p p l i e d D e v e l o p m e n t E c o n o m i c s | P a g e 37
SOC Code Occupation
Employed in Industry
(2012)
Employed in Industry
(2017)
Change 2012_ 2017
NAICS Codes for Related Growth
Industries
29-1063 Internists, General 18 20 2 621
29-1062 Family and General Practitioners 109 114 5 621, 903
29-1061 Anesthesiologists 34 36 2 621
29-1051 Pharmacists 36 40 4 452, 903
27-3091 Interpreters and Translators 209 238 42 903, 541
27-3042 Technical Writers 16 18 3 541
27-3041 Editors 11 12 2 541
27-3031 Public Relations Specialists 31 36 7 903, 541
27-2023 Umpires, Referees, and Other Sports
Officials 25 29 4 903
27-2022 Coaches and Scouts 40 46 6 903
27-1026 Merchandise Displayers and Window
Trimmers 15 16 1 452
27-1024 Graphic Designers 38 41 6 541
27-1014 Multimedia Artists and Animators 15 17 2 541
27-1011 Art Directors 12 13 2 541
25-9099 Education, Training, and Library Workers,
All Other 84 86 2 902, 903
25-9041 Teacher Assistants 1195 1240 45 902, 624, 903
25-9031 Instructional Coordinators 26 27 1 902
25-9031 Instructional Coordinators 26 27 1 902
25-9031 Instructional Coordinators 68 72 4 903
25-4031 Library Technicians 156 164 8 903
25-4021 Librarians 52 54 2 903
25-3999 Teachers and Instructors, All Other 2517 2558 41 902, 624, 903, 541
25-3021 Self-Enrichment Education Teachers 11 14 3 624
25-3011 Adult Basic and Secondary Education and
Literacy Teachers and Instructors 53 55 2 902, 903
25-2054 Special Education Teachers, Secondary
School 79 80 1 903
25-2053 Special Education Teachers, Middle School 24 27 3 903
25-2041 Special Education Teachers, Preschool,
Kindergarten, and Elementary School 128 139 11 903
25-2031 Secondary School Teachers, Except
Special and Career/Technical Education 1062 1069 7 903
25-2023 Career/Technical Education Teachers,
Middle School 16 17 1 903
25-2022 Middle School Teachers, Except Special
and Career/Technical Education 420 447 27 903
25-2021 Elementary School Teachers, Except
Special Education 1202 1277 75 903
25-2012 Kindergarten Teachers, Except Special
Education 219 231 12 903
25-2011 Preschool Teachers, Except Special
Education 273 281 8 624, 903
25-1099 Postsecondary Teachers 851 879 28 902, 903
23-1011 Lawyers 71 76 5 902, 903

A p p l i e d D e v e l o p m e n t E c o n o m i c s | P a g e 38
SOC Code Occupation
Employed in Industry
(2012)
Employed in Industry
(2017)
Change 2012_ 2017
NAICS Codes for Related Growth
Industries
21-1798 Community and Social Service Specialists,
All Other 76 86 10 902, 624, 903
21-1093 Social and Human Service Assistants 191 225 34 902, 624, 621,
623, 903
21-1092 Probation Officers and Correctional
Treatment Specialists 184 202 18 902, 903
21-1091 Health Educators 51 55 4 902, 621, 903
21-1023 Mental Health and Substance Abuse Social
Workers 41 51 10 624, 621, 903
21-1022 Healthcare Social Workers 35 38 3 621, 903
21-1014 Mental Health Counselors 11 15 4 621
21-1013 Marriage and Family Therapists 105 121 16 902, 624, 621, 903
21-1012 Educational, Guidance, School, and
Vocational Counselors 222 235 13 902, 624, 903
21-1011 Substance Abuse and Behavioral Disorder
Counselors 71 82 11 624, 621, 903
19-4061 Social Science Research Assistants 14 16 3 541
19-4021 Biological Technicians 21 23 3 541
19-3051 Urban and Regional Planners 35 38 3 903
19-3031 Clinical, Counseling, and School
Psychologists 98 104 6 902, 624, 903
19-3022 Survey Researchers 24 25 3 541
19-2042 Geoscientists, Except Hydrologists and
Geographers 10 11 -- 541
19-2041 Environmental Scientists and Specialists,
Including Health 48 54 8 902, 903, 541
19-1042 Medical Scientists, Except Epidemiologists 91 105 19 902, 541
19-1021 Biochemists and Biophysicists 16 18 3 541
19-1013 Soil and Plant Scientists 28 30 3 541
17-3023 Electrical and Electronics Engineering
Technicians 11 13 3 541
17-2141 Mechanical Engineers 15 19 5 541
17-2072 Electronics Engineers, Except Computer 11 14 4 541
17-2071 Electrical Engineers 21 25 5 541
17-2061 Computer Hardware Engineers 17 20 3 541
17-2051 Civil Engineers 107 116 14 903, 541
17-2011 Aerospace Engineers 29 33 5 541
15-2031 Operations Research Analysts 22 25 4 541
15-1799 Computer Occupations, All Other 40 46 6 902, 541
15-1179 Information Security Analysts, Web
Developers, and Computer Network
Architects
64 80 16 903, 541
15-1159 Computer Support Specialists 285 322 31 902, 903, 541
15-1142 Network and Computer Systems
Administrators 85 100 16 902, 903, 541
15-1141 Database Administrators 44 53 10 903, 541
15-1133 Software Developers, Systems Software 160 212 51 541
15-1132 Software Developers, Applications 112 149 37 541
15-1131 Computer Programmers 60 73 12 541
15-1121 Computer Systems Analysts 75 95 21 902, 903, 541
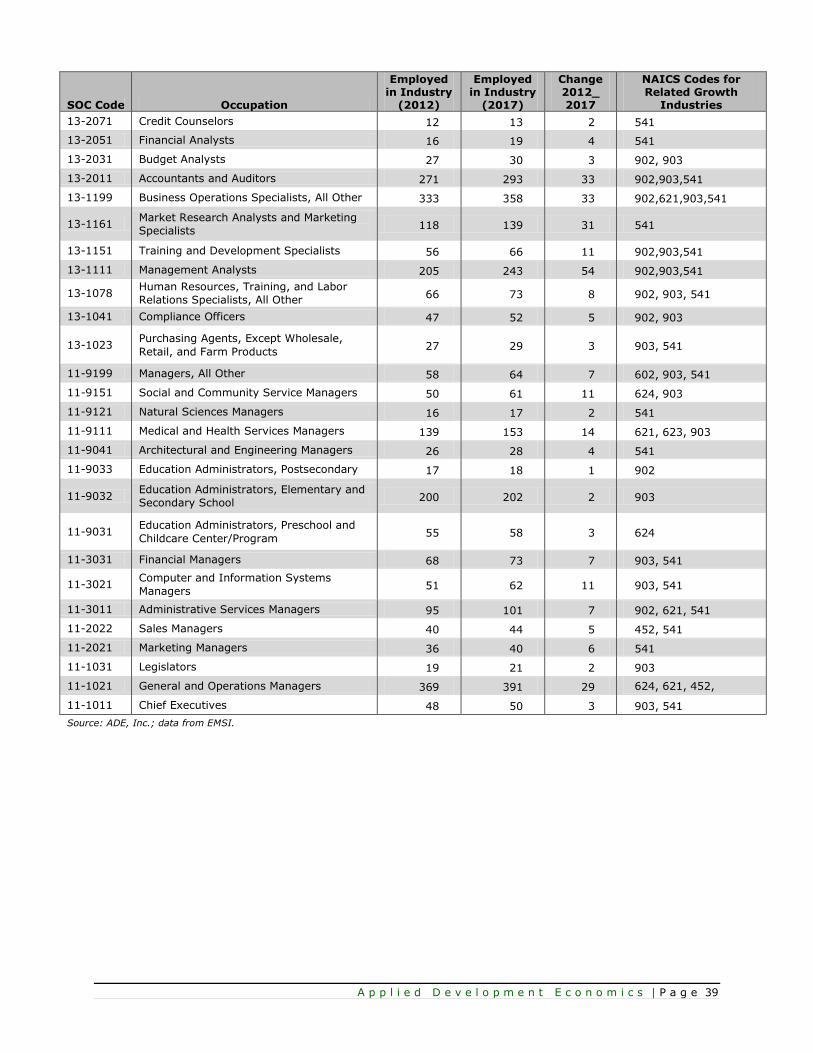
A p p l i e d D e v e l o p m e n t E c o n o m i c s | P a g e 39
SOC Code Occupation
Employed in Industry
(2012)
Employed in Industry
(2017)
Change 2012_ 2017
NAICS Codes for Related Growth
Industries
13-2071 Credit Counselors 12 13 2 541
13-2051 Financial Analysts 16 19 4 541
13-2031 Budget Analysts 27 30 3 902, 903
13-2011 Accountants and Auditors 271 293 33 902,903,541
13-1199 Business Operations Specialists, All Other 333 358 33 902,621,903,541
13-1161 Market Research Analysts and Marketing
Specialists 118 139 31 541
13-1151 Training and Development Specialists 56 66 11 902,903,541
13-1111 Management Analysts 205 243 54 902,903,541
13-1078 Human Resources, Training, and Labor
Relations Specialists, All Other 66 73 8 902, 903, 541
13-1041 Compliance Officers 47 52 5 902, 903
13-1023 Purchasing Agents, Except Wholesale,
Retail, and Farm Products 27 29 3 903, 541
11-9199 Managers, All Other 58 64 7 602, 903, 541
11-9151 Social and Community Service Managers 50 61 11 624, 903
11-9121 Natural Sciences Managers 16 17 2 541
11-9111 Medical and Health Services Managers 139 153 14 621, 623, 903
11-9041 Architectural and Engineering Managers 26 28 4 541
11-9033 Education Administrators, Postsecondary 17 18 1 902
11-9032 Education Administrators, Elementary and
Secondary School 200 202 2 903
11-9031 Education Administrators, Preschool and
Childcare Center/Program 55 58 3 624
11-3031 Financial Managers 68 73 7 903, 541
11-3021 Computer and Information Systems
Managers 51 62 11 903, 541
11-3011 Administrative Services Managers 95 101 7 902, 621, 541
11-2022 Sales Managers 40 44 5 452, 541
11-2021 Marketing Managers 36 40 6 541
11-1031 Legislators 19 21 2 903
11-1021 General and Operations Managers 369 391 29 624, 621, 452,
623, 903, 541 11-1011 Chief Executives 48 50 3 903, 541
Source: ADE, Inc.; data from EMSI.
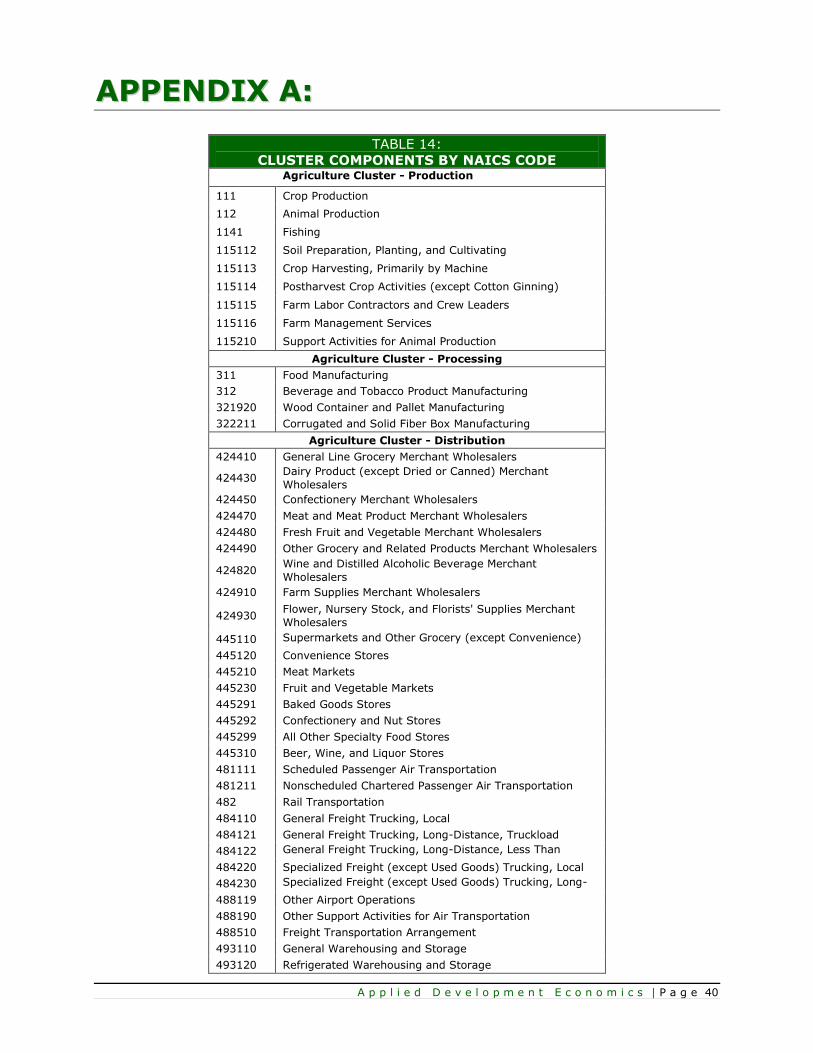
A p p l i e d D e v e l o p m e n t E c o n o m i c s | P a g e 40
AAPPPPEENNDDIIXX AA::
TABLE 14:
CLUSTER COMPONENTS BY NAICS CODE
Agriculture Cluster - Production
111 Crop Production
112 Animal Production
1141 Fishing
115112 Soil Preparation, Planting, and Cultivating
115113 Crop Harvesting, Primarily by Machine
115114 Postharvest Crop Activities (except Cotton Ginning)
115115 Farm Labor Contractors and Crew Leaders
115116 Farm Management Services
115210 Support Activities for Animal Production
Agriculture Cluster - Processing
311 Food Manufacturing
312 Beverage and Tobacco Product Manufacturing
321920 Wood Container and Pallet Manufacturing
322211 Corrugated and Solid Fiber Box Manufacturing
Agriculture Cluster - Distribution
424410 General Line Grocery Merchant Wholesalers
424430 Dairy Product (except Dried or Canned) Merchant
Wholesalers
424450 Confectionery Merchant Wholesalers
424470 Meat and Meat Product Merchant Wholesalers
424480 Fresh Fruit and Vegetable Merchant Wholesalers
424490 Other Grocery and Related Products Merchant Wholesalers
424820 Wine and Distilled Alcoholic Beverage Merchant
Wholesalers
424910 Farm Supplies Merchant Wholesalers
424930 Flower, Nursery Stock, and Florists' Supplies Merchant
Wholesalers
445110 Supermarkets and Other Grocery (except Convenience)
Stores 445120 Convenience Stores
445210 Meat Markets
445230 Fruit and Vegetable Markets
445291 Baked Goods Stores
445292 Confectionery and Nut Stores
445299 All Other Specialty Food Stores
445310 Beer, Wine, and Liquor Stores
481111 Scheduled Passenger Air Transportation
481211 Nonscheduled Chartered Passenger Air Transportation
482 Rail Transportation
484110 General Freight Trucking, Local
484121 General Freight Trucking, Long-Distance, Truckload
484122 General Freight Trucking, Long-Distance, Less Than
Truckload 484220 Specialized Freight (except Used Goods) Trucking, Local
484230 Specialized Freight (except Used Goods) Trucking, Long-
Distance 488119 Other Airport Operations
488190 Other Support Activities for Air Transportation
488510 Freight Transportation Arrangement
493110 General Warehousing and Storage
493120 Refrigerated Warehousing and Storage

A p p l i e d D e v e l o p m e n t E c o n o m i c s | P a g e 41
Agriculture Cluster - Support
221310 Water Supply and Irrigation Systems
237110 Water and Sewer Line and Related Structures
Construction
325314 Fertilizer (Mixing Only) Manufacturing
325320 Pesticide and Other Agricultural Chemical Manufacturing
333111 Farm Machinery and Equipment Manufacturing
423820 Farm and Garden Machinery and Equipment Merchant
Wholesalers
423830 Industrial Machinery and Equipment Merchant Wholesalers
423840 Industrial Supplies Merchant Wholesalers
423850 Service Establishment Equipment and Supplies Merchant
Wholesalers
444220 Nursery, Garden Center, and Farm Supply Stores
522292 Real Estate Credit
532490 Other Commercial and Industrial Machinery and
Equipment Rental and Leasing
541380 Testing Laboratories
541613 Marketing Consulting Services
541840 Media Representatives
541870 Advertising Material Distribution Services
541890 Other Services Related to Advertising
541940 Veterinary Services
551114 Corporate, Subsidiary, and Regional Managing Offices
561110 Office Administrative Services
561311 Employment Placement Agencies
561320 Temporary Help Services
561710 Exterminating and Pest Control Services
561730 Landscaping Services
562920 Materials Recovery Facilities
811310
Commercial and Industrial Machinery and Equipment
(except Automotive and Electronic) Repair and
Maintenance
Source: ADE, Inc.; data from EMSI.
Notes: Industries included in the cluster each account for a minimum of 10 jobs.