live versus virtual: cost benefit analysis for applying
TRANSCRIPT

University of Central Florida University of Central Florida
STARS STARS
Electronic Theses and Dissertations, 2004-2019
2016
Live Versus Virtual: Cost Benefit Analysis for Applying Simulation Live Versus Virtual: Cost Benefit Analysis for Applying Simulation
Towards Army Aviator Flight Minimums Towards Army Aviator Flight Minimums
Dylan Morelle University of Central Florida
Part of the Military Vehicles Commons
Find similar works at: https://stars.library.ucf.edu/etd
University of Central Florida Libraries http://library.ucf.edu
This Masters Thesis (Open Access) is brought to you for free and open access by STARS. It has been accepted for
inclusion in Electronic Theses and Dissertations, 2004-2019 by an authorized administrator of STARS. For more
information, please contact [email protected].
STARS Citation STARS Citation Morelle, Dylan, "Live Versus Virtual: Cost Benefit Analysis for Applying Simulation Towards Army Aviator Flight Minimums" (2016). Electronic Theses and Dissertations, 2004-2019. 5328. https://stars.library.ucf.edu/etd/5328

LIVE VERSUS VIRTUAL: COST BENEFIT ANALYSIS FOR APPLYING SIMULATION TOWARDS ARMY
AVIATOR FLIGHT MINIMUMS
by
DYLAN M. MORELLE B.S. University of Central Florida, 2001
A thesis submitted in partial fulfillment of the requirements for the degree of Master of Science in Modeling and Simulation
in the College of Engineering and Computer Science at the University of Central Florida
Orlando, Florida
Spring Term 2016
Major Professor: J. Peter Kincaid

ii
ABSTRACT
The Longbow Crew Trainer (LCT) is a cost effective, safe alternative to live training in
the AH-64D/E Apache helicopter. Current Army doctrine and regulations have provisions for
the limited use of simulator in lieu of aircraft hours toward semiannual minimum flight hour
requirements. With the defense budget in decline, the Army must find innovative, cost effective
methods to conduct realistic, relevant training to sustain proficiency in their warfighting
capabilities. The LCT fully replicates the cockpit environment through training scenarios for
requisite crew tasks and missions in a realistic, modular, and transportable solution. An attack
helicopter crew can safely train in customizable scenarios ranging from basic aviation tasks to
crew-level missions and gunneries. The Army is currently aligning one LCT per attack battalion
under the Aviation Restructure Initiative. There are 20 Armed Reconnaissance
Battalions/Squadrons in the active component with approximately 35 aircrews per battalion. The
premise of this study was to review cost benefits of training in a virtual environment over a live
environment while exploring the effects on proficiency. The difference in cost per hour between
an AH-64D and the LCT is approximately $3,998. Using this figure and the semiannual flight
hour requirements from the current Aircrew Training Manual in a weighted average between
Flight Activity Category (FAC) 1 and FAC 2 pilot’s flight minimum requirements formed the
basis for four models: Low, Status Quo (baseline), Moderate, and High Virtual Simulation
Models. This study found that while the High Virtual Simulation Model resulted in the greatest
cost savings, the current budget and previous literature does not require such drastic measures.
The Low Virtual Simulation Model resulted in higher costs. Therefore, the Moderate Virtual
Simulation Model, proved most relevant to budget analysts, aviation unit commanders, and pilots
by decreasing annual costs by an estimated $76.2 million without degrading proficiency.

iii
For Kaylin and Austin: Do not fear change. Shape it. Thank you for this opportunity to
further my education. I hope to be an example for you to emulate and this time at UCF
influences your decisions for where to continue your higher educations. Go Knights! Lastly,
this thesis is for all fallen angels lost in training and combat.

iv
ACKNOWLEDGMENTS
I would like to acknowledge those who made this possible. First, I would like to thank
my kids for sacrificing time and providing support through this process. Thanks to the Army for
selecting me for advanced civil schooling at my beloved University of Central Florida. Special
thanks to my advisory committee, Dr. J. Peter Kincaid, Dr. Jonathan Stevens, and Dr. Michael
Proctor for their professional mentorship, advisement, and support. Thanks to Colonels Lonnie
Hibbard, Bernard Banks, and Bill Morris for their friendship and mentorship throughout my
career. Thanks to Ms. Sabrina Gordon for keeping me administratively straight and helping me
navigate through this program. Thanks to Captain Larry Baca and Lieutenant Colonel Michael
McCarthy for acting as a sounding board and classmates through this process. Thanks to Larry
Rood at Headquarters, Department of the Army and John Mings at PEO-STRI. Finally, I would
like to thank Army Aviation and all of the soldiers I have worked with in the first 14 years of my
military career. It was an honor to serve with you and will be an honor to continue service to this
great country. High above the best! Attack!

v
TABLE OF CONTENTS
LIST OF FIGURES ..................................................................................................................... viii
LIST OF TABLES ......................................................................................................................... ix
LIST OF ACRONYMS/ABBREVIATIONS ................................................................................ xi
CHAPTER ONE: INTRODUCTION ............................................................................................ 1
Chapter One Summary ................................................................................................................ 1
Motivation for Analysis .............................................................................................................. 1
Army Aviation Structure ............................................................................................................. 2
Army Rotary-Wing Aviators ....................................................................................................... 3
AH-64D/E Longbow Apache and Simulation Devices ............................................................... 5
AH-64D/E Apache Longbow/Guardian .................................................................................. 6
AH-64 Longbow and Longbow Crew Trainer (LCT) ............................................................. 9
LCT Benefits ......................................................................................................................... 12
LCT Limitations .................................................................................................................... 12
Flight Hour Training Requirements .......................................................................................... 13
Budget ....................................................................................................................................... 15
Description of the Gap .............................................................................................................. 16
CHAPTER TWO: LITERATURE REVIEW .............................................................................. 18
Chapter Two Summary ............................................................................................................. 18
Simulation Training Benefits and Effectiveness ....................................................................... 18
The Balance of Live and Virtual Training ................................................................................ 20
Transfer of Training (TOT) ................................................................................................... 20

vi
TOT Case Studies .................................................................................................................. 21
Tools ...................................................................................................................................... 23
Maximum Simulation ............................................................................................................ 24
Summary of Literature Review ................................................................................................. 26
Research Gap ............................................................................................................................. 27
CHAPTER THREE: METHODOLOGY ..................................................................................... 28
Chapter Three Summary ........................................................................................................... 28
Define the Problem .................................................................................................................... 28
Assumptions .......................................................................................................................... 28
Scope of Analysis .................................................................................................................. 30
Models ....................................................................................................................................... 30
Variables and Equations ........................................................................................................ 31
Low Virtual Simulation Model ............................................................................................. 32
Status Quo (Baseline) Virtual Simulation Model .................................................................. 32
Moderate Virtual Simulation Model ..................................................................................... 33
High Virtual Simulation Model ............................................................................................. 33
Model Summary .................................................................................................................... 33
CHAPTER FOUR: DATA AND ANALYSIS ............................................................................ 35
Chapter Four Summary ............................................................................................................. 35
Data ........................................................................................................................................... 35
Number of Aviators ............................................................................................................... 35
LCT Throughput .................................................................................................................... 36

vii
Cost Factors ........................................................................................................................... 37
Cost Analysis ............................................................................................................................. 38
Low Virtual Simulation Model ............................................................................................. 39
Status Quo Virtual Simulation Model (Baseline) .................................................................. 40
Moderate Virtual Simulation Model ..................................................................................... 40
High Virtual Simulation Model ............................................................................................. 42
Sensitivity Analysis ................................................................................................................... 43
Moderate Virtual Simulation Model POL Sensitivity Analysis ............................................ 44
Model Comparison for POL Sensitivity Analysis ................................................................. 45
Moderate Virtual Simulation Model Training Sensitivity Analysis...................................... 47
Model Comparison for Training Sensitivity Analysis .......................................................... 48
CHAPTER FIVE: DISCUSSION AND RECOMMENDATIONS ............................................. 50
Chapter Five Summary .............................................................................................................. 50
Discussion ................................................................................................................................. 50
Study Benefits ....................................................................................................................... 53
Study Limitations .................................................................................................................. 54
Conclusions ............................................................................................................................... 56
Current Recommendations ........................................................................................................ 57
Recommendations for Further Analysis .................................................................................... 58
APPENDIX A: III CORPS FLYING HOUR PROGRAM COST FACTORS ............................ 59
APPENDIX B: SENSITIVITY ANALYSIS DATA .................................................................... 61
REFERENCES ............................................................................................................................. 66

viii
LIST OF FIGURES
Figure 1: AH-64 Apache Longbow Helicopter (Boeing, n.d.) ...................................................... 7
Figure 2: LCT (Training Support Center, Fort Carson, Colorado, 2012) .................................... 10
Figure 3: LCT Generation 4 Device Layout (Mings, 2016) ........................................................ 10
Figure 4: LCT CPG/Gunner Station (Boeing, n.d.) ..................................................................... 11
Figure 5: Model Comparison for Total Hours Flown Annually per Crew (Graph) ..................... 34
Figure 6: LCT Throughput........................................................................................................... 36
Figure 7: POL Analysis Moderate Virtual Simulation Model Graph .......................................... 45
Figure 8: POL Analysis Model Comparison Graph .................................................................... 46
Figure 9: Training Analysis Moderate Virtual Simulation Model (Graph) ................................. 48
Figure 10: Fuel Analysis Model Comparison (Graph) ................................................................ 49

ix
LIST OF TABLES
Table 1: Total Number of Active Component AH-64 Apache Helicopters .................................. 3
Table 2: United States Army Aviator Designation ........................................................................ 4
Table 3: AH-64D/E Compatible Synthetic Flight Training System (SFTS) ................................. 9
Table 4: AH-64D/E Semiannual Minimum Training Requirements in Hours per System ......... 14
Table 5: Department of Defense Topline Budget ........................................................................ 15
Table 6: Department of the Army Budget ................................................................................... 16
Table 7: Equations ....................................................................................................................... 32
Table 8: Model Comparison for Total Hours Flown Annually per Crew ................................... 34
Table 9: LCT Hourly Cost Factors .............................................................................................. 38
Table 10: Cost Factors ................................................................................................................. 38
Table 11: Fixed Variables ............................................................................................................ 38
Table 12: Low Virtual Simulation Analysis ................................................................................ 39
Table 13: Status Quo Virtual Simulation Analysis ...................................................................... 40
Table 14: Moderate Virtual Simulation Analysis ........................................................................ 41
Table 15: High Virtual Simulation Analysis ............................................................................... 43
Table 16: POL Analysis Moderate Virtual Simulation Model Data ............................................ 44
Table 17: Fuel Analysis Model Comparison Data ....................................................................... 46
Table 18: Training Analysis Moderate Virtual Simulation Model .............................................. 47
Table 19: Training Analysis Model Comparison Data ................................................................ 49
Table 20: Cost Summary (Crew) ................................................................................................ 53
Table 21: Cost Summary (Battalion/Squadron) ........................................................................... 53

x
Table 22: Cost Summary (Army Wide) ........................................................................................ 53
Table 23: III Corps FY16 FHP Cost Factors ............................................................................... 60
Table 24: POL Sensitivity Analysis Data .................................................................................... 62
Table 25: Training Sensitivity Analysis Data .............................................................................. 64

xi
LIST OF ACRONYMS/ABBREVIATIONS
AH Attack Helicopter ARB Attack Reconnaissance Battalion ARI Aviation Restructure Initiative ARNG Army National Guard ATM Aircrew Training Manual ATP Aircrew Training Program AVCATT Aviation Combined Arms Tactical
Trainer Bde Brigade Bn Battalion BCA Budget Control Act BCT Brigade Combat Team CAB Combat Aviation Brigade Cdr Commander CH-47 Cargo Helicopter (Chinook) CPG Copilot-Gunner CMS Combat Mission Simulator CTER Cumulative Transfer
Effectiveness Ratio DA Department of the Army DES Directorate of Evaluations and
Standardization DoD Department of Defense FAC Flight Activity Category FHP Flying Hour Program FLIR Forward Looking Infrared FORSCOM Forces Command FY Fiscal Year HDU Helmet Display Unit HQDA Headquarters, Department of the
Army IE Instrument Flight Examiner IERW Initial Entry Rotary Wing ITER Incremental Transfer Effective
Ratio IMC Instrument Meteorological
Conditions I/O Instructor/Operator IP Instructor Pilot LCT Longbow Crew Trainer LCCS Life Cycle Contract Support

xii
LPT Longbow Procedural Trainer ME Maintenance Test Pilot Evaluator MP Maintenance Test Pilot MTPC Maintenance Test Pilot Course MTOE Modified Table of Organizational
Equipment MTSTT Modernized TADS Selectable
Task Trainer NVG Night Vision Goggles OCO Overseas Contingency Operations OFP Operational Flight Trainer O&M Operation and Maintenance OPTEMPO Operational Tempo PEO-STRI Program Executive Office for
Simulation, Training, & Instrumentation
PC Pilot-in-Command PI Pilot PM Program Manager POI Program of Instruction RL Readiness Level SFTS Synthetic Flight Training System SP Standardization Instructor Pilot TADS Target Acquisition/Designation
System TER Transfer Effective Ratio TOT Transfer of Training UH-60 Utility Helicopter (Blackhawk) UT Unit Trainer XP Experimental Test Pilot

1
CHAPTER ONE: INTRODUCTION
Chapter One Summary
As the introductory chapter, this section presents the motivation for analysis with a
description of the United States Army Aviation structure, aviator categories, a description of the
AH-64D/E with associated simulation devices, and flight hour requirements. Additionally, this
chapter reviews recent defense budget constraints; concluding with a description of the gap.
Motivation for Analysis
With military downsizing and budget constraints a constant reality or looming threat, this
analysis provides budget analyst and commanders the flexibility and monetary information to
make an educated decision when faced with a decreased flight hour budget. Flying is an
inherently dangerous and complex profession. Since July of 2000, there have been 38 aircraft
destroyed and 25 aviators killed in non-combat related aircraft accidents (Allen, 2015).
Conversely, zero aviators were killed in the simulator in the same time.
This study does not consider the cost of an aircraft loss or crew but will address an
increase or decrease in exposure to risk of loss within the analysis. A recent article in the Stars
and Stripes argues that budget cuts negatively affect the training and maintenance across the
military’s rotary-wing fleet. Since January 2015 through January 2016, there has been 42 deaths
and 14 helicopters destroyed across all services, a significant increase from prior years (Copp,
2016).
2
The motivation for this analysis is to identify simulation based alternatives with an
emphasis on minimizing cost and mitigating risk while, at a minimum, maintaining training
proficiency and combat readiness for Army aircrews.
Army Aviation Structure
Just five years ago, the Army was expanding to 13 active component (AC) Combat
Aviation Brigades (CAB). After extensive reorganization due to downsizing and maximization
of combat modularity and effectiveness, the Army currently operates with eleven Combat
Aviation Brigades (CAB). Within each CAB, subordinate battalions own the aircraft. The
subordinate units are the Armed Reconnaissance Battalion (ARB) (24 x AH-64), Armed
Reconnaissance Squadron (ARS) (24 x AH-64 or 30 x OH-58 and 12 x Shadow UAS), Assault
Helicopter Battalions (AHB) (30 x UH-60), General Support Aviation Battalion (GSAB) (12 x
CH-47, 8 x UH-60, 15 x MEDEVAC UH-60), and one Aviation Support Battalion which owns
zero aircraft. Under previous force structure, the brigades were classified as light, medium, or
heavy. This designation referenced deployability, mission sets, and influenced which and how
many aircraft were in the brigade. While the designation still exists on FMSWeb, as of fiscal
year (FY) 15/16 authorization documents, all CABs have the same structure except two. 82d
CAB is the only unit with one squadron of OH-58s and 2d Infantry Division CAB only has one
ARB on the Korean Peninsula (Force Management Support Agency, 2015). This study only
focuses on the AH-64D/E within the ARB and ARS. As part of the Aviation Restructure
Initiative (ARI), the Army will retire all OH-58D helicopters. To fill the tactical reconnaissance
and security requirement, one ARB per CAB will reorganize as an ARS. The ARS retains the 24

3
Apaches, but adds 12 shadows and associated personnel and equipment to their organic structure.
By 2019, each of the 10 divisions in the Army will have one ARB and one ARS within their
respective CAB (Tan, 2015). Research of organizational structure change and the application of
UAS for potential cost and risk mitigation are beyond the research scope for this paper, but is a
topic of great discussion and concern. Table 1 reflects FMSWeb data reflecting FY15 and 16
authorization documents for the total number of AH-64D/E aircraft authorized across the 11 AC
CABs within 20 battalions/squadrons.
Table 1: Total Number of Active Component AH-64 Apache Helicopters
Nomenclature Number of ARB/ARS Number Auth HELICOPTER ADVANCE ATTACK AH-64E: 5 Bn 120 HELICOPTER: ATTACK AH-64D 15 Bn 360 Total 20 Bn 480
Army Rotary-Wing Aviators
In the United States Army’s Aviation branch, both commissioned and warrant officers
branch fly. All Army aviators receive their training at Fort Rucker, Alabama. Upon graduation
from flight school, aviators leave qualified in one of the Army’s advanced helicopters and
usually stay in that aircraft their entire career. The basic level of piloting in the Army is under
the status of “pilot” or PI. No matter the level of expertise or rank, all newly assigned pilots to a
unit arrive with the designation of pilot (PI) at readiness level 3 (RL 3). Pilots increase their
readiness status through a process called readiness level (RL) progression. Depending on the
aviator’s prior service and performance at a former duty location and records evaluation, the
commander decides whether an aviator progresses higher than pilot status during their RL
progression. Once the pilot proves to an instructor pilot, through a series of check rides, that

4
they can complete tasks to standard and possess a knowledge of the local area policies and
procedures, they advance to a fully qualified status of RL 1. Additionally, commanders select
pilots who are ready to go the next level at any point in their tenure depending on the aviator’s
performance.
Beyond the pilot level, aviators progress to various forms of pilot-in-command or PC.
While each unit has different requirements for making pilots-in-command, a foundation of sound
judgment, maturity, pilotage expertise, a mastery of tactics, and local operating policies and
procedures round out the requirements. All flights in an Army helicopter require a PC in one of
the pilot stations (Department of the Army, 2014). While a flight might have two aviators who
are designated PC, only one aviator logs PC time and is the pilot responsible for the flight. In
order to become an instructor pilot or any of the other designations outlined in Table 2, an
aviator must first achieve the status of pilot-in-command followed by specialized training.
Table 2: United States Army Aviator Designation
Designation Secondary Designation Pilot (PI) Pilot-in-Command (PC) Unit Trainer (UT) Instructor Pilot (IP) Instrument Examiner (IE) Standardization Instructor Pilot (SP) Maintenance Test Pilot (MP) Maintenance Test Pilot Examiner (ME) Experimental Text Pilot (XP)
The unit’s personnel authorization does not list or mandate an aviator’s designation.
While there are slots designated for positions such as instructor and maintenance test pilots,
personnel filling a position for an Armament Officer might not be a pilot-in-command, whereas,
5
the aviator filling the Pilot slot, might carry the designation of PC through authorization of the
commander. An ARB/ARS manages the flight training for all aviators in the three flight
companies and a headquarters and headquarters company, which contains all staff officers to
include the battalion/squadron commander, a maintenance company, a support company, and a
portion or all of the staff aviators at the brigade level. Generally, an ARB/ARS has
approximately 70 aviators to manage, with about half of those designated as PI. Each position
has a flight activity category (FAC). The commander designates and aviator’s FAC level in
relation to their assignment or position. An aviator in one of the three flight companies with
direct access to aircraft holds a FAC 1 designation, while a FAC 2 supported aviator at the
brigade level has neither direct access to aircraft nor holds a position where flying is a primary
duty. Aviators at the battalion or brigade staff level are generally designated FAC 2. FAC 3
aviators are usually at the division or higher or in a unit that has access to a simulator but not
aircraft. The FAC 3 aviator has no live flight requirements. This designation is rarely used and
not considered for purposes of this study. The FAC determines how many hours the aviator
must fly in both the aircraft and Longbow Crew Trainer (LCT) semiannually. Based on manning
and force structure, but variable at the commander’s discretion, FAC 1 aviators generally
outnumber FAC 2 aviators at a 3:1 ratio.
AH-64D/E Longbow Apache and Simulation Devices
This section describes the capabilities, history, and associated simulation devices for the
AH-64D/E helicopter. Currently, the Apache uses a mix of four simulation devices: The LCT,
The Aviation Combined Arms Tactical Trainer (AVCATT), Modernized TADS Selectable

6
Task Trainer (MTSTT), and Longbow Procedural Trainer (LPT). The LCT is the only
compatible Synthetic Flight Training System (SFTS). The AVCATT is a collective trainer, the
MTSTT is a procedural trainer, and the LPT is a personal computer based emulator. This
section concludes with an in depth description of the LCT.
AH-64D/E Apache Longbow/Guardian
The AH-64 Apache helicopter is the United States Army’s primary attack and
reconnaissance aerial platform. A proven combat multiplier with more than 3.9 million hours
flown in training and combat for the United States and 11 other countries (The Boeing Company,
n.d.). The Apache is a twin-engine, four-bladed, tandem-piloted helicopter. While both pilots
have full access to aircraft controls, the pilot in the back seat is generally responsible for flying
the aircraft, whereas, the co-pilot/gunner (CPG) can spend the majority of the flight managing
other aircraft or identifying and engaging targets using the Target Acquisition Designation
System (TADS). The helmet in the AH-64 is linked to the aircraft’s sights, sensors, and weapon
systems. Additionally, each pilot has access to full flight symbology with a forward-looking
infrared systems (FLIR) overlay displayed through a helmet display unit (HDU) over the right
eye. Armament includes a combination of 30mm canon ammunition, various 2.75” rockets, and
laser or radar guided Hellfire missiles (Gower Jr., Lilienthal, Kennedy, Fowlkes, & Baltzley,
1987). The Apache was instrumental in the first Gulf War and essential in support of ground
forces throughout the War on Terror.

7
Figure 1: AH-64 Apache Longbow Helicopter (Boeing, n.d.)
The AH-64 Apache developed by Hughes in the late 1970s and delivered in the 1980s by
McDonnell Douglas as the AH-64A Apache, is currently in its third generation under the Boeing
Company as the AH-64E Apache Guardian. Between the Apache and the Guardian was the AH-
64D Apache Longbow, which added a fire-control radar and digitized avionics, displays, and
communication. Over the lifecycle of the Longbow, there were multiple firmware upgrades,
enhancements to survivability, deployability, and ease of maintenance. Additionally, the
Longbow went through three major upgrades called “Blocks.” Fifteen battalions in the current
force pool still own and operate Block II AH-64D Longbows. In 2012, The Block III AH-64D
Longbow was renamed the AH-64E Guardian and with enhanced engines, avionics, networked
communications and fuselage, the Guardian is the future for the Army’s Apache platform (The
Boeing Company, n.d.).
To discuss the airframe and pilots, one would be remised to fail to mention crew chiefs
and maintenance. The crew chiefs do not fly in an Apache as they do in a Blackhawk or
Chinook helicopter. Apache maintenance is on a phased-maintenance methodology. All aircraft
receive a daily service inspection prior to the first flight of the day. There are service checks and
inspections based on hours, dates, and durations. Meaning some inspections occur when an

8
aircraft flies for 10 hours, others every ten days, and for some, one year from when a part was
last serviced. Scheduled maintenance occurs at the 50 hour, 125 hour, 250 hour, and a major
phase overhaul at 500 hours. Unscheduled maintenance keeps crew chiefs engaged and trained
between scheduled maintenance. While crew chiefs conduct some services based on date, a lull
in flights equates to a degradation to the tempo and training iterations for the crew chiefs.
Flight simulations have always been integral to Apache aircrew training, both at the
schoolhouse and at the unit for sustainment training. The AH-64A Apache’s compatible SFTS
was a full-motion, non-deployable CMS with six degrees of freedom. Looking for a more
transportable and deployable option, the Army dropped the full motion capability for seat plates
in the LCT for the AH-64D Longbow. The LCT is the primary flight simulator for all Apache
variants in the Army’s current inventory. Additionally, units can arrange the Aviation Combined
Arms Tactical Trainer in an AH-64D/E configuration for collective task training. The AH-64E
Longbow Modernized TADS Selectable Task Trainer (MTSTT) is a procedural trainer for
increasing a CPG’s reaction time and efficiency in gunnery tasks. Table 3 outlines the associated
compatible SFTS for the AH-64 Longbow and Guardian aircraft (Department of the Army,
2014). This study focuses primarily on the LCT as the only SFTS with the fidelity to train tasks
at the individual and crew level. The primary purpose of the Aviation Combined Arms Tactical
Trainer’s is to train collective tasks and compromises control touch and avionic fidelity to meet
cost and requirements, thus disqualifying the device as a direct substitution for maintaining or
acquiring individual and crew proficiency.

9
Table 3: AH-64D/E Compatible Synthetic Flight Training System (SFTS)
Designation Compatible Aircraft AH-64D Longbow Crew Trainer 2B64D AH–64D AH-64E Longbow Crew Trainer 2B64E AH–64E, AH-64D BLK II AH-64E Longbow Modernized TADS Selectable Task Trainer (MTSTT) AH–64E
Aviation Combined Arms Tactical Trainer None
AH-64 Longbow and Longbow Crew Trainer (LCT)
The LCT trains aviators at the individual and crew level in all tasks to include standard
flight maneuvers, instrument flight, gunnery skills, and mission specific tasks and conditions. In
addition to the aircrew, an instructor/operator (I/O) facilitates the scenario, injects emergencies
or weather conditions, monitors performance, and controls other friendly and enemy vehicles.
One LCT system consists of a device trailer and a service trailer with a self-contained power
multi-fuel generator and environmental control unit. The unit is transportable and deployable.
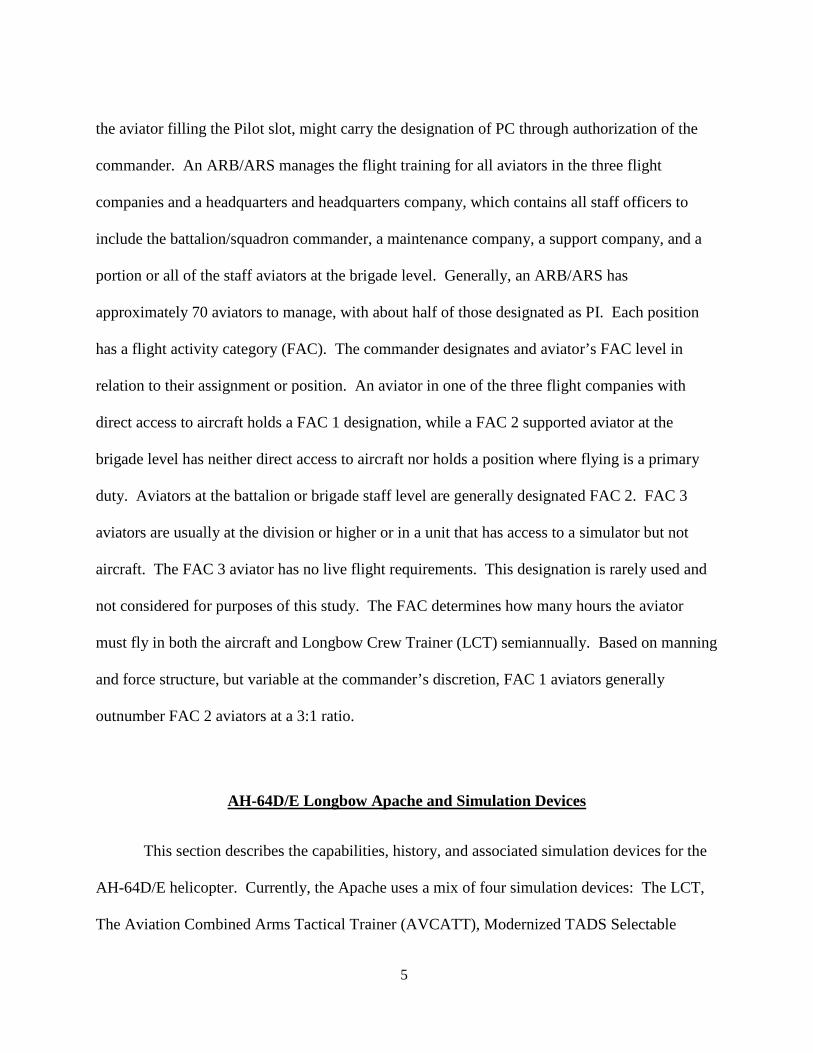
Inside the device trailer, the two pilot stations face away from each other on opposite sides with
the I/O station in the middle. The pilot and copilot/gunner stations are exact replicas of the
respective stations from the aircraft. The I/O has access to both pilot’s video, audio,
instrumentation, and multiple screens and controls to facilitate and monitor training. Aircrews
can fly and train on a number of mission sets from a customizable database to include overwater
training, requisite gunnery tables, mission rehearsals, and combat scenarios. The I/O controls
weather conditions and induces emergency procedures in which the aircraft and instrumentation
reflect conditions relative to the emergency. The I/O can also pause the system mid-scenario or
review the flight afterwards for evaluation purposes.
10
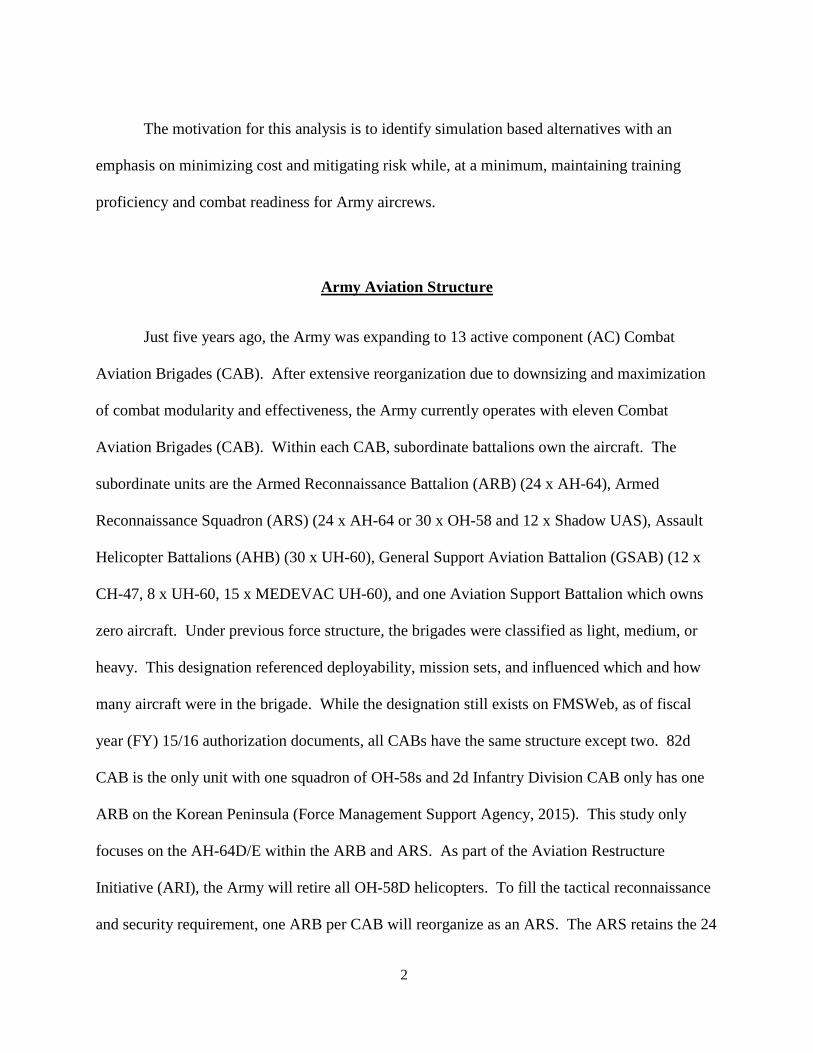
Figure 2: LCT (Training Support Center, Fort Carson, Colorado, 2012)
Figure 3: LCT Generation 4 Device Layout (Mings, 2016)
Pilots wear the same helmets and aviation life support equipment they normally fly
with.in the actual aircraft. The only difference is that the helmet does not bore sight, or align,
with the aircraft using the helmet’s integrated infrared harness as it would in the aircraft.
Instead, the LCT uses a proprietary wired sensor that clips into the top of the helmet. As
depicted in Figure 4, aircraft controls, seats, avionics, and displays are all direct replicas or even

11
the same parts from the aircraft. Five high-resolution displays, wrap around each station for a
field of view of approximately 140 degrees. The LCT uses dynamic motion cueing seating to
provide pilots proprioceptive feedback to provide a deeper level of immersion and reduce
simulation sickness. Pilots communicate between each other, and via the I/O, other aircraft, air
traffic controllers, or ground forces using the the same suite of radios and digital means as found
in the actual aircraft (Department of the Army, 2010). The LCT has no provisions for NVG
training or capability to link multiple devices for collective training.
Figure 4: LCT CPG/Gunner Station (Boeing, n.d.)
As of August 2015, there are twelve LCTs in the active component, nine reserve
component systems, and six systems at Fort Rucker, AL. This distribution equates to one system
for each geographical area to support up to two ARBs. As the Army National Guard transfers
Apaches to the active component, LCT systems transfer as well. By September of 2019, each
ARB will own a respective LCT. When computing throughput and availability, this study
assumes each active component ARB has an LCT, as this is the Army’s tentative end state.

12
LCT Benefits
Some of the benefits of applying LCT flight hours in lieu of live hours to meet
semiannual flight hour minimum requirements include:
1. LCT flight mitigates the risk to aircrews to almost zero.
2. The cost of an LCT flight hour is $3,998 cheaper than a live hour.
3. Unlimited ammunition and fuel.
4. Accurate emergency procedure training.
5. Customizable database for terrain, scenario, and threat systems.
6. Ability to pause, reset, review, and provide real-time feedback to the crew.
7. Poor weather conditions affect live flights and have a minimal affect on the
availability of the LCT.
8. LCT contracted availability rates of 90% (Mings, 2016). Aircraft maintenance
rates vary between units and rarely reach the 90% level.
LCT Limitations
Some of the limitations of applying LCT flight hours in lieu of live hours to meet
semiannual flight hour minimum requirements and limitations of this study include:
1. The LCT does not have the means to train NVGs.
2. The LCT is a crew trainer and is not collective trainer. The LCT does not
replicate multi-ship flight, air-ground integration, or joint attacks at a level
appropriate to gain or maintain proficiency.
3. Loss of confidence in the aircraft due to a lack of iterations and familiarity.

13
4. Crew chiefs and other maintainers do not receive the number of maintenance
tasks requisite to maintain proficiency due to the reduction of hours and
subsequent service requirements on the aircraft.
5. Lack of presence and emersion. The crew will never feel the risk associated with
flying an actual aircraft in the LCT.
Flight Hour Training Requirements
Each aircraft has an Aircrew Training Manual (ATM), which defines flight and LCT
minimum semiannual flight requirements. An aviator can fly more than the minimum but the
hours listed in the ATM are the absolute minimums. AH-64D/E aviators can be both dual-seat
or single-seat designated and fall into one of three flight activity categories (FAC). The seat
designation has no effect on the total number of hours an aviator must fly in a semiannual period.
It only reallocates how many of those hours must be flown in each seat. For example, a dual-seat
designated FAC 1 aviator must fly a minimum of 15 hours in each crew station out of the 70
hours required, whereas a single-seat designated FAC 1 aviator must fly 63 hours in the
designated crew station (Department of the Army, 2013). An aviator’s FAC level affects
semiannual minimums in both the aircraft and simulator. Table 4 details the AH-64D/E
minimum semiannual flight and simulation hour requirements per the AH-64D/E ATM
(Department of the Army, 2013).

14
Table 4: AH-64D/E Semiannual Minimum Training Requirements in Hours per System
FAC
Aircraft Flight Time Minimum Semiannual
Requirement (when maximum allowable simulation hours are
substituted)
Simulator Minimum Semiannual
Requirement (maximum allowable hours
transferable to aircraft flight time requirements)
1 70 (58) 15 (12) 2 50 (38) 9 (12) 3 0 24
Of note, the following is already written in the current ATM, “Trainers and evaluators
may credit instructor/operator (I/O) hours toward their semiannual simulation device flying hour
requirements. All aviators may apply a maximum of 12 simulation hours flown in a semiannual
period toward that period’s semiannual flying hour requirements” (Department of the Army,
2013). As Table 4 illustrates, a FAC 1 aviator may apply 12 of the 15 simulator hours towards
the aircraft semiannual requirement for a revised requirement of 58 live hours. Whereas, a FAC
2 aviator can fly up to three additional simulation hours to apply the full 12 simulator hours
towards live hours for 38 live hours. Interestingly, there is no difference in the standard for
successful execution of a task for a FAC 1 aviator or a FAC 2 aviator. A loose interpretation of
this lack of a difference means a FAC 2 aviator who flies a minimum of 50 hours or 38 hours
semiannually with full simulation applied has the same expectation or standards to accomplish
tasks as that of a FAC 1 aviator who flies 70 hours or 58 hours semiannually with full simulation
applied. Since FAC 1 aviators typically outnumber FAC 2 aviators at a 3:1 ratio and for the
purpose of this study, the resulting weighted minimum semiannual requirement is 65 aircraft
hours and 13.5 simulator hours.

15
Budget
After the attacks on September 11, 2001, the Department of Defense budget skyrocketed
to support The Global War on Terrorism. Overseas contingency operations (OCO) funding
supplements the base budget to support deployment related operations and sustainment. As
shown in Table 5, the peak of the base budget was in 2012 at $530.4 billion with OCO funding
peaking in 2011 at $158.8 billion. Because of the 2011 Budget Control Act (BCA), failure of the
Joint Committee on Deficit Reduction, and sequestration, the 2013 budget was cut by $30 billion
and continued at the reduced levels through 2015. For the first time since 2012, the FY 2016
base budget request is back to pre-sequestration levels. However, the Department of Defense’s
objective is to reduce spending by $487 billion through 2023, so additional cuts are forthcoming.
Additionally, OCO funding is one-third of what it was in 2009 (Under Secretary of Defense
(Comptroller), 2015).
Table 5: Department of Defense Topline Budget
($ in billions)
FY 2009
FY 2010
FY 2011
FY 2012
FY 2013
FY 2014
FY 2015
FY 2016
Base 513.2 527.9 528.2 530.4 495.5 496.3 496.1 534.3 OCO 145.7 162.4 158.8 115.1 82 84.9 64.2 50.9 Other 7.4 0.7 0.1 0.2 0.1 Total 666.3 691 687 645.5 577.6 581.4 560.4 585.2
Manpower is the most expensive item in the Army’s budget. As such, the Department of
the Army continues downsizing of the active component force to 475k in FY 2016 and an
eventual 450k by FY 2018. For the first time since sequestration, the active component will not
require OCO funding. Additionally, the Army continues the ARI by retiring the OH-58D while

16
increasing emergency response to the National Guard by transferring Apaches for Blackhawks
between the active and reserve component. If sequestration continues and manning drops below
the 420k level, the Army will struggle to sustain one prolonged multi-phased contingency
operation. Table 6 denotes the Department of the Army’s budget in relation to the DOD budget
from Table 5 (Army Financial Management, 2015).
Table 6: Department of the Army Budget
($ in billions)
FY 2009
FY 2010
FY 2011
FY 2012
FY 2013
FY 2014
FY 2015
FY 2016
Base 143 144 140 138 127 126 121 127 OCO 92 99 100 67 50 36 28 21 Total 235 243 240 205 177 162 149 148
Description of the Gap
Under sequestration, the services were forced to make cuts and sacrifices in order to meet
budgetary requirements. The Army, in particular, faces difficult decisions in force structure,
modernization, and operation and maintenance (O&M) elements, to include decreased funding
for Army ground and aviation readiness (Funding, 2014). At the division and below level, units
are asked to get creative with shortages in operational tempo (OPTEMPO) funding, specifically
in fuel, maintenance, and repair parts. The 2012 Army Training Strategy, FY 14 U.S. Army’s
Forces Command (FORSCOM), and FY 14 1st Armor Division’s Annual Training Guidance all
reference optimizing simulation to offset reductions to operational funding (McCaffrey, 2012)
(U.S. Army Forces Command, 2013) (1st Armor Division, 2013). Additionally, FORSCOM’s
FY 14 initial flight hour funding to 1st Armor Division’s Combat Aviation Brigade was at a 10.6
hour OPTEMPO instead of the average 11.6 from previous years (U.S. Army Forces Command,
17
G-3 Aviation, 2013). Mathematically, 11.6 hours multiplied by six months equates to the FAC 1
minimum flight requirements of 70 hours. Even a shortage of just one hour in OPTEMPO
funding results in a necessity to apply simulator hours to achieve semiannual flight hour
minimum requirements.

18
CHAPTER TWO: LITERATURE REVIEW
Chapter Two Summary
This chapter covers literature relating to the benefits and effectiveness of simulation for
training and explores the appropriate balance of live and virtual training.
Simulation Training Benefits and Effectiveness
There are a number of articles and studies written outlining the benefits and
disadvantages of simulation. Orlansky et al. (1994) summarizes these advantages and
disadvantages as they relate to flight simulation training.
Advantages (Orlansky, Dahlman, Hammon, Metzko, & Taylor, 1994)
• Trains tasks in the same manner as the live equivalent.
• Cost savings in procurement, usage, and sustainment compared to the live
equivalent.
• Mitigates risk while reducing maintenance costs of live equipment.
• Decreases pollution and environmental impact compared to live equivalent.
• Better facilitates instruction and feedback.
• Cost savings in fuel, ammunition, and support.
• Less risk and costs from damages to equipment by novices unfamiliar with the
system or procedures.

19
• Allows for training untenable or too high risk in live equivalent.
• Replicates a threat environment for force on force rehearsals, scenarios, and
engagements.
Disadvantages (Orlansky, et al., 1994):
• Reducing OPTEMPO using simulation could decrease training readiness and
confidence in the actual aircraft.
• Inaccuracies in aerodynamics, engagements, motion, control inputs, or procedures
can lead to negative habit transfer or misleading expectations in live training or
combat.
• Simulators require funding to procure, field, update, and sustain.
• Motion/simulator sickness
In a 2002 article, E Salas and C.S. Burke state training is effective when (Salas & Burke,
2002):
• The simulation is a tool for teaching and training.
• The simulation is scenario based using cognitive task analysis to train tasks
deliberately.
• The simulation is a tool for assessing individuals and teams.
• An instructor directs training through task-focused or scenario-based training.
• The simulation fidelity is not too much or too little for the training objectives.
• Subject matter experts collaborate with system designers and trainers.
20
The Balance of Live and Virtual Training
The purpose of this study is to understand the cost or impact to increasing or decreasing
the amount of simulation to live training and the related effect on proficiency. To understand the
total cost, one must understand the impact to an aviator’s proficiency when shifting the balance
between the two training environments.
The preponderance of research in the field of simulation training occurred from 1975-
1999. Since then, the focus has been on finding the minimum level of fidelity at the lowest cost
to provide the greatest cost savings. Most of the research between 1975 and 1999 attests that
simulation is an effective tool for cost savings, risk reduction, and is an appropriate supplement
to live training. Very little research sets an upper limit for when simulation impedes
performance or is not worth the output for time, labor, or costs. Additionally, many of the
studies only evaluate initial training, which is far different from sustainment training. This
section of the literature review cites sources that define training transfer, reference similar
research articles with experiments or models that attempt to determine the proper mix of live and
virtual training in relation to an aviator’s efficacy, and summarize when simulator use is
appropriate.
Transfer of Training (TOT)
TOT is the true measure of a simulation device’s value on an aviator’s proficiency as
defined by Muchinsky (2006) as, “the extent to which trainees effectively apply the knowledge,
skills, and attitudes gained in a training context back to the job” (p. 205). Another definition,
more specific to flight simulation states:

21
A flight simulator is effective if the skills that a pilot learns in the simulator can be
performed in the aircraft, that is, if the skills transfer from the simulator to the aircraft.
The effectiveness of training in a flight simulator is a function of the amount of skill
that transfers. Its cost-effectiveness in a pilot-training program depends on the amount
of skill that transfer to the aircraft as well as the ratio of simulator to aircraft operating
costs. (Taylor, Lintern, & Koonce, 1993)
TOT Case Studies
Two case studies that epitomize the value of simulation in reference to TOT,
proficiency, and costs savings are the integration of simulation within the MH-53J Pave Low
and AH-64A Apache qualification courses.
The 1986 MH-53H qualification course was almost exclusively in the aircraft. Due to
decreasing budgets in the early nineties, compounded with the cost of integrating and training
the MH-53J update, the decision was made to incorporate as many simulator and procedural
trainer hours as possible. By 1993, the course was almost half-live and half-simulation. This
resulted in hourly cost savings of approximately $2k (Selix, 1993). The real proof of concept
was in a subsequent study by Rakip, Kelly, Appler & Riley (1993) where Pave Low
crewmembers and commanders evaluated crews. The sample of crews was broken into two
groups: those trained in the simulation era and those who were not. The survey was perception
and opinion based and not centered on any performance measure of proficiency. Those trained
in the simulator era rated higher in all aspects except NVG and aircraft control. Those trained
in the simulator group were mission ready in 2-3 months versus the non-simulation era group

22
who took almost a year to reach the same standard. In this case study, the method in which the
simulator was integrated into the training program not only replaced aircraft hours at a cost
benefit, but also proved advantageous to the aviator’s aptitude (pp. 432-438).
In a similar scenario, the traditional AH-64A qualification course program of instruction
(POI) consisted of 45 hours in the aircraft and 28 hours in the simulator. In an effort to save
money, select students performed tasks in the simulator until achieving task standards. They
then demonstrated their proficiency in an aircraft where evaluators measured the requisite total
aircraft flight time to conduct the task to standard. When compared to students conducting the
traditional POI, the sample population skill was on par with their counterpart but with lower
live aircraft requirements. Therefore, the course was restructured to 25 hours in the aircraft and
56 hours in the simulator for an estimated cost savings of $70k (Wightman & Wright, R.H., in
preparation).
Simulator integration in POIs across the military are now common practice and occur at
the initial, intermediate, and graduate level. Two examples of this practice are the AH-64D
Instructor Pilot Course POI and the AH-64E Transition Course POI. The Instructor Pilot
Couse consists of a total of 82.9 hours with 58.9 hours in the aircraft, 21 hours in the LCT, and
three hours of non-flight time on the LPT/Emulator (United States Army Aviation Center of
Excellence, 2011). The AH-64E Transition Course entails a much heavier simulator load with
10.8 hours in the LCT and 4.4 of instructor led LPT hours versus only 8.5 hours in the actual
aircraft (Project Manager, Apache Attack Helicopter, 2014)

23
Tools
Two tools that attempt to quantify the most efficient balance of live and virtual training
are the FAPV Training Tool and the Transfer Effectiveness Ratio Tool (TER).
The letters in FAPV stand for familiarize, acquire skill, practice skill, and validate skill,
which refer to the steps in the learning process for each of the trained tasks. Used mostly in an
instructional system design manner, the FAPV tool is a Microsoft Excel based program in which
factors such as tasks, training times, student loads, training devices, student/instructor ratios
required on the different devices, and readiness rates are entered into a database. Using
Advanced Learning Environments, the FAPV tool determines whether live, virtual, or
constructive methods are most appropriate for the task and factors the inputs to provide the most
cost effective solution in relation to time, cost, and availability (Frank, Helms, & Voor, 2000).
The second example, applied by Stewart and Nullmeyer (1999), use Transfer, Cumulative
Transfer, and Incremental Transfer Effective Ratio (TER, CTER, and ITER) analysis to
determine the optimal mix of live and virtual training. TER is the ratio of training in the
simulator to the savings in the aircraft. CTER is the combined effects of simulator iterations.
Essentially, it is a linear graph of a set of TERs. The CTER curve provides visual information on
the rate of diminishing returns through increasing simulator iterations. Finally, ITER answers
whether it is worthwhile to conduct one more iteration of the task or where the point of
diminishing returns exists (pp. 9-11). A number of variables affect the CTER. One of which is a
well-developed training plan. A sufficient training plan will bring the CTER closer to 1.0 (Diehl
& Ryan, 1977). The Stewart and Nullmeyer (1999) study on the optimization of simulation for
initial entry rotary wing training through experiments using TER, CTER, and ITER resulted in

24
approximately 2.75 simulator iterations equated to one saved live hour (p. 30). Essentially all
research using this approach results in an eventual diminished returns with an increase in
simulation to replace live iterations.
Maximum Simulation
Looking at simulation purely from a cost savings perspective, 100% simulation training
is the safest and most cost effective solution, but at what point does simulation result in negative
transfer or become too time and resource intensive to achieve the same or better results in the
aircraft? Can virtual training replace all live training or is there associated risk associated with
proficiency due to simulation limitations in fidelity or training quality? Army doctrine,
guidance, and regulation send conflicting or ambiguous messages regarding live and virtual
training intent. Most of the research and experimentation supports simulation as a supplement to
live training, but fails to address how it affects an aviator’s proficiency over time and at various
stages in their career.
The Army Training Strategy states that leaders should increase virtual, constructive, and
gaming capabilities when there is a decrease in live training resources (McCaffrey, 2012). The
Army Strategy is not prescriptive in how commanders should partition the training
environments, nor does it define a maximum allocation. The training circular for developing
aircrew-training programs, TC 3-04.11, clearly says, “Virtual and constructive simulation
training cannot replace live training. However, they can supplement, enhance, and complement
live training to sustain unit proficiency” (Department of the Army, 2009). Finally, the ATM
specifically sets the ratio of live to virtual semiannual minimum flight requirements to 70 live

25
and 15 virtual for FAC 1 aviators and 50 live and 9 virtual for FAC 2 aviators or an approximate
8:2 ratio or 7.6:2.4 ratio with simulation applied to minimum flight requirements for a FAC 2
aviator. Commanders can only substitute 12 live hours with LCT hours semiannually
(Department of the Army, 2013). The statements presented in Army doctrine and guidance
proves the Army accepts simulation as a supplement to live training but not an absolute or even
majority replacement.
A large number of studies exist where researchers examine a simulation’s effect on
performance. In most cases, there is a significant increase in performance, but in a few others,
the results show an insignificant difference between live and simulated performance, lack of
evidence to establish a maximum simulation threshold, or even a degradation in performance due
to a simulation’s shortcomings.
In a 2012 non-experimental study contemplating an increase in simulation for the Initial
Entry Rotary Wing (IERW) phase of Flight School XXI, the research found an increase in
simulation results in the potential for substantial cost savings. However, there was inconclusive
evidence to support a full conversion to simulation would produce students at the same
proficiency level or better. In fact, the study cited several sources where senior Army leadership
perceives that a 100% simulation conversion presents too much risk to a student’s common core
(Blow, 2012). The recommendations for future research section lists a need for “empirical data
regarding the quality of aviator produced after completing various levels of simulator and real
aircraft training” (p. 44).
The Goetz, Harrison, Robertson (2012) study is a great example of simulation providing
an insignificant difference to an aviator’s proficiency. In this study, a sample of twelve
participants trained three hours in a Frasca 141 flight-training device before flying an aircraft.

26
Upon completion of the simulator portion, examiners tracked total flight hours and days to the
participant’s first solo in a Cesna 172 aircraft. The experimental group required a mean time of
17.4 hours and 77.3 days where the historic group flew a solo flight at a mean time of 17.4 hours
and 86.1 days. From a statistical reference, this difference is insignificant.
In contrast, an experiment performed by the Directorate of Simulation sampled CH-47
aviators in the graduate level Maintenance Test Pilot Course (MTPC) and another entering the
second phase of initial training. The entire MTPC was in a virtual environment minus the
evaluation check ride. The initial training sample trained in 75% simulation. Subjects from both
experiments successfully passed evaluations to standard even with a reduction in live aircraft
hours. However, due to fidelity issues and other glitches experienced in the simulator,
instructors had to retrain participants in fine motor and proprioceptive intensive tasks such as
slope landings and ground taxiing (U.S. Army Directorate of Simulation, 2011).
Summary of Literature Review
The literature review illustrates the benefits and limitations of simulation-based training,
defines methods to maximize simulator effectiveness, and addresses the balance of live and
virtual training regarding TOT and proficiency. Most of the literature concerning TOT
advocates that simulation training increase proficiency while reducing costs, but very little
literature defines an optimized level of simulation before risking a degradation to proficiency or
negative transfer. The Army doctrine and leadership offers commanders nonspecific guidance
regarding the amount of simulation application, but maintains a stance that too much simulation
poses an unacceptable risk to proficiency. The literature reviews in several studies note a lack of

27
research and empirical evidence regarding a maximum point of simulation training as it relates to
proficiency for live training replacement. Models and tools exist for calculating the balance of
simulation but require very specific inputs and the majority focuses on instructional design, just
as most studies concentrate on initial training and not mid-career sustainment training in
operational units.
Research Gap
The majority of research relating to simulation based training focuses on initial training,
individual aviators, and accepts that simulation reduces costs by replacing live training iterations
while maintaining, or in some cases, improving proficiency. There is limited research on the
cost savings and proficiency effects simulation application has on mid-career aviators, realistic
crew sample selections, and the point of diminishing returns as they relate to the balance and
optimization of live and virtual training. This paper focuses solely on aviators at operational
units in realistic crew configurations. The models in this study apply simulation shifts to general
pilots (PIs) who generally struggle to meet minimum semiannual flight requirements and units
have the highest potential and lowest risk for applying virtual flight hours to semiannual
requirements. There is insufficient evidence to take anything other than a conservative approach
to the live/virtual ratio reflected in the various models.

28
CHAPTER THREE: METHODOLOGY
Chapter Three Summary
This chapter defines the problem and outlines the assumptions, scope, and methodology
for analyzing potential cost savings associated with replacing live flight hours with virtual hours.
This chapter concludes with defining four models with varying live to virtual ratios.
Define the Problem
The problem is to understand the financial and training significance of balancing live and
virtual aviation training given current or future budget constraints for the purpose of cost
avoidance or savings and aviator proficiency.
Assumptions
The following lists assumptions made for the purposes of this analysis and in many ways
represent a perfect world scenario where all pilots are RL1; all units have an operational LCT,
etc.
• Personnel and equipment strength levels match Modified Table of Organizational
Equipment (MTOE) authorization requirements.
• No units are deployed.
• All Pilots (PI) are Readiness Level 1.

29
• 75% of pilots are FAC 1, 25% FAC 2 for a weighted average baseline semiannual
flight requirement of 65 hours and LCT requirement of 13.5 hours.
• The designation of 50% of authorized pilots is PC, UT, IP, IE, SP, MP, ME, or XP.
The other 50% are PI.
• The Army continues with the Aviation Restructure Initiative by transferring LCTs
and Apaches from the National Guard to the AC. This assumption is highly political
and subject to change. For the purpose of this study, all LCTs and Apaches from the
National Guard transfer to the AC.
• Each ARB manages and has regular access to one LCT
• Crew requirements:
o A crew in a live aircraft is one pilot with the designation (UT, PC, IP, IE, SP,
MP, ME, or XP) and the other pilot is a PI.
o A crew in a virtual aircraft meet the crew requirements listed above (1 x PC
with 1 x PI) with a qualified I/O. Even though a crew in the LCT can consist
of 2 x PI, it does not affect the outcome in this study since the PCs also have
simulator minimums and for every 2 x PI crew, there would have to be a 2 x
PC crew to maximize efficiency in the simulator; but the outcome is the same
since the PC:PI ratio is 1:1.
o In a perfect scenario, crews remain constant with a PC and PI in every live
and LCT period. In this perfect setting, aviators meet all simulation
requirements for minimums, gunnery, and evaluations with zero overage.

30
Scope of Analysis
The scope of the analysis outlined in this study is as follows:
• United States Army active component attack aviation units.
• Authorizations and structure based on FY15 or FY16 FMS-Web data.
• Aircraft and SFTS:
o AH-64D/E Block II and LCT (AH-64E Longbow Crew Trainer 2B64E)
• Analysis only applies to Pilots (PI) based on MTOE authorized strength. Analysis
does not apply to pilots with the following designations: PC, UT, IP, IE, SP, MP,
ME, or XP.
• This analysis does not include FAC 3 aviators since the population is small and
insignificant to the outcome of this study.
• Computations are annual figures based on semiannual requirements.
Models
Using fixed variables for the costs of live and simulator flight hours and numbers of
crews and battalions, the four models have varying ratios for live to virtual flight hour
requirements and/or applying a portion of the simulator hours to satisfy the live flight hour
requirements. The Low Virtual Simulation Model includes the least amount of simulation
flown and applied to live hours and the highest number of live flight hours. Whereas the High
Virtual Simulation Model employs a combination of the highest amount of simulation flown
and applied to flight hour requirements compared to live flight hours. The Status Quo Virtual

31
Simulation Model is the baseline model and consistent with Army doctrine and practices out in
the field. Finally, the Moderate Virtual Simulation Model is a hybrid of the Status Quo and
High Virtual Simulation Models and maximizes simulation applied per current doctrine.
Through a compensatory method, each of the models apply the fixed variables for the
cost of a live flight hour, the cost of a simulator flight hour, the number of crews, the number of
battalions, and varying factors for live and simulator flight hours per crew and the number of
simulation hours applied to live minimums. The limited scope of the analysis is purposeful to
represent savings solely at an hour flown level. Any other factor, such as destroyed aircraft,
loss of life, injury, or ammunition costs, benefit to the side of using more simulation.
Essentially, the cost savings outlined in Chapter 4 represent minimum savings potential.
Variables and Equations
• Fixed Variables
o Cost of live flight hour: cL
o Cost of simulation flight hour: cS
o Number of crews: nC
o Number of units (battalions): nU
• Variables
o Live flight hours/crew: hL
o Simulator hours/crew: hS
o Simulation hours applied to minimums: hA

32
• Equations
Table 7: Equations
Low Virtual Simulation Model
In the Low Virtual Simulation Model, all pilots (PI) increase live flight hour requirements
a maximum of five hours, decrease simulator requirements a maximum of five hours, and apply
zero simulator hours in lieu of live hours semiannually. This model supports the argument for
more live training and less simulation.
Status Quo (Baseline) Virtual Simulation Model
In the Status Quo Virtual Simulation Model, all pilots (PI) meet semiannual requirements
using live flight hours as well as the required simulator hours based on FAC level requirements.
This model supports how units generally execute flight hour requirements.

33
Moderate Virtual Simulation Model
In the Moderate Virtual Simulation Model, all pilots (PI) apply 12 hours of simulated
flight hours to their semiannual flight requirements while simultaneously meeting the required
simulator hours based on FAC level requirements. This model supports options for commanders
per the ATM.
High Virtual Simulation Model
In the High Virtual Simulation Model, all pilots (PI) decrease live flight hour
requirements a maximum of five hours, increase simulator requirements a maximum of five
hours, and apply a maximum of 17 simulator hours in lieu of live hours semiannually. This
model supports the argument for more simulation and less live training from a cost perspective.
Model Summary
Table 8 and Figure 5 present differences between the four models. The Low and Status
Quo Virtual Simulation Models result in 157 total hours flown while the Moderate and High
Virtual Simulation Models result in 133 total hours flown after applying simulation hours in lieu
of live hours. The Commander maintains the authorization of applying simulation time to live
requirements, and if not approved, the aviator must offset the simulation applied to live with
actual flight in the aircraft. All figures are based off of the weighted average for FAC 1 and FAC
2 aviators. The simulation applied to live and simulation hours in addition to simulation applied

34
represents the total simulator minimums required annually. For example, The Moderate Virtual
Simulation Model requires 27 simulation hours flown annually.
Table 8: Model Comparison for Total Hours Flown Annually per Crew
Figure 5: Model Comparison for Total Hours Flown Annually per Crew (Graph)
0 20 40 60 80 100 120 140 160 180
Low
Status-Quo
Moderate
High
Total Hours Flown
Live Hours Sim Applied to Live Simulation Hours in Addition to Sim Applied
35
CHAPTER FOUR: DATA AND ANALYSIS
Chapter Four Summary
This chapter applies figures to the methodology from Chapter 3 and how that applies to
either a fixed or variable factor. Data found in this chapter includes the total number of aviators
and crews, LCT throughput, cost factors for live and virtual flight hours. This chapter concludes
with cost analysis for each of the four models and sensitivity analysis for fuel and training.
Data
This section outlines and explains key figures for conducting the cost analysis such as the
total number of aviators/crews, how much throughput an LCT can manage, and the cost factors
for an hour of live and virtual aviation training in the AH-64D/E and LCT, respectively.
Number of Aviators
As of November of 2015, there are 20 Attack Reconnaissance Battalions in the Active
Component (Force Management Support Agency, 2015). Each battalion supports 70 aviators (35
crews, under perfect crew assignment and balance of PCs and PIs). This equates to
approximately 1400 aviators across the active component assigned to a Combat Aviation
Brigade. For the purpose of this study half of those 1400 are Pilots (PIs) and the other half are
Pilots-in-Command (PC) or equivalent.

36
LCT Throughput
An LCT operates with contract support for maintenance and operation. Contracts include
an I/O for limited hours. Units have the flexibility to surge during gunnery and other simulation
intensive periods for short durations. A standard garrison week is 40 hours or eight hours a day,
five days a week. Units can surge to 50 hours a week for six weeks per contract year. The
standard garrison throughput for a single LCT system is 2140 hours (Mings, 2016).
Per Figure 6, none of the models approach the threshold. Should each ARB/ARS not
have their own LCT system and is sharing it with the other ARB/ARS in the brigade or a
National Guard Unit, then the High Simulation Model could easily surpass the threshold.
Figure 6: LCT Throughput
595 945 945 1295
2140 2140 2140 2140
0%10%20%30%40%50%60%70%80%90%
100%
Low Status-Quo Moderate High
LCT Throughput
LCT Throughput LCT Max Throughput

37
Cost Factors
Given the Apache does not have contractor logistic support, meaning crew chiefs within
the organization perform maintenance and service tasks, the cost factor for one hour in an AH-
64D/E Apache helicopter includes cost projections for petroleum, oil, and lubricants (POL),
consumable repair parts, and depot level repairable parts (Department of the Army, 2014).
Additional costs not factored into this cost factor or within the scope of this study are associated
ammunition, destroyed aircraft, accidental damages, or crew losses. These excluded costs would
only bolster the cost avoidance benefits for simulation usage as ammunition is unlimited and
there is zero risk for destroyed aircraft, accidental damages, or crew losses in the virtual
environment(Department of the Army, 2014). The cost factor of $4,267 is in accordance with
Table 23 in Appendix A: III Corps FY16 Flying Hour Program Cost Factors.
Three sources provide data to formulate a per hour cost factor for the LCT. There are
fixed costs for Life Cycle Contractor Support (LCCS) which include on-site technicians, general
material, and the delta for repair costs above $20k. Over and Above cost factors, again at the
LCCS level, include government directed system relocation impact costs, non-fair wear and tear,
and extended training outside of contracted hours. Finally, garrison cost factors include
contracted I/Os, water, fuel, and electricity, facility costs for improvements and maintenance,
and the security and safety support. Table 9 breaks down the cost estimates for an hour of LCT
simulated flight time. The total cost factor is $268.99 per hour (Mings, 2016).

38
Table 9: LCT Hourly Cost Factors
Table 10 denotes the FY2016 cost factors for the AH-64D/E and the LCT of $4,267 and
$269 per hour, respectfully. The delta between an hour of LCT and and hour in an Apache is
$3,998.
Table 10: Cost Factors
Flight Mode Cost per Hour Live $4,267 Virtual (LCT) $269 Difference $3,998
Cost Analysis
This section combines the factors listed above with the methodology outlined in Chapter
3 to determine the cost analysis for each of the four models. The cost analysis includes costs at
the crew, battalion, and Army level for live, simulation, and total cost. All models use the fixed
variables as noted in Table 11.
Table 11: Fixed Variables

39
Low Virtual Simulation Model
In the Low Virtual Simulation Model, Table 12, 35 crews fly 140 hours in the aircraft,
17 hours in the simulator, and apply zero simulation hours to live flight hours based on the
weighted annual requirements for the FAC 1 to FAC 2 ratio and flight hour requirements from
current Army doctrine. To compute the total cost for the Low Virtual Simulation Model, add
the total live hours per crew to the total simulation hours per crew and multiply the number of
crews by the number of battalions/squadrons in the Army. Crews fly a total of 157 hours
annually. More specifically, the crew flies a total of 140 hours in the aircraft instead of the 130
hours in the Status Quo Virtual Simulation Model. This increases the crew’s exposure time to
risks inherent to flying a live helicopter by 10 hours or 7.8 percent annually. The total cost in
this model is $421,367,100 and the total LCT throughput is 595 hours.
Table 12: Low Virtual Simulation Analysis

40
Status Quo Virtual Simulation Model (Baseline)
In the Status Quo (Baseline) Virtual Simulation Model, Table 13, 35 crews fly 130
hours in the aircraft, 27 hours in the simulator, and apply zero simulation hours to live hours
based on the weighted annual requirements for the FAC 1 to FAC 2 ratio and flight hour
requirements from current Army doctrine. The analysis for this model is fairly simple: add the
total live per crew to the total simulation per crew, multiply the number of crews by the number
of battalions/squadrons in the Army. Crews fly a total of 157 hours annually. The total cost in
this model is $393,381,100 and the total LCT throughput is 945 hours.
Table 13: Status Quo Virtual Simulation Analysis
Moderate Virtual Simulation Model
In the Moderate Virtual Simulation Model, Table 14, 35 crews fly 106 hours in the
aircraft, 27 hours in the simulator, and apply 24 simulation hours to live based on the weighted

41
annual requirements for the FAC 1 to FAC 2 ratio and flight hour requirements from current
Army doctrine. The 24 simulation hours reflect the 12 hours of simulation a commander can
authorize an aviator to use toward flight minimums semiannually as written in current version of
the Attack Helicopter Aircrew Training Manual (Department of the Army, 2013). The weighted
average of 13.5 semiannually result in a total of 27 simulator hours annually, three simulator
hours over the 24 hours used toward flight hour requirements. To compute the total cost, add the
total live per crew to the total simulation per crew, subtract the simulation hours applied to
minimums, and multiply the number of crews by the number of battalions/squadrons in the
Army. Crews fly a total of 133 hours annually. More specifically, the crew flies a total of 106
hours in the aircraft instead of the 130 hours in the Status Quo Virtual Simulation Model. This
reduces the exposure time of the crews to risks inherent to flying a live helicopter by 24 hours or
18.5 percent. The total cost in this model is $317,176,300 and the total LCT throughput is 945
hours.
Table 14: Moderate Virtual Simulation Analysis

42
High Virtual Simulation Model
In the High Virtual Simulation Model, Table 15, 35 crews fly 96 hours in the aircraft,
37 hours in the simulator, and apply 34 simulation hours to live based on the weighted annual
requirements for the FAC 1 to FAC 2 ratio and flight hour requirements from current Army
doctrine. The 34 simulation hours reflect the 12 hours of simulation a commander can
authorize an aviator to use toward flight minimums semiannually as written in current version
of the Attack Helicopter Aircrew Training Manual plus an additional ten hours to compensate
for the reduction in live flight hours. (Department of the Army, 2013). The weighted average
of 13.5 hours plus an additional five hours semiannually result in a total of 37 simulator hours
annually, 3 simulator hours more than the 34 hours used toward flight hour requirements. To
compute the total cost, add the total live per crew to the total simulation per crew, subtract the
simulation hours applied to minimums, and multiply the number of crews by the number of
battalions/squadrons in the Army. Crews fly a combined total of 133 hours annually. More
specifically, the crew flies a total of 96 hours in the aircraft instead of the 130 hours in the
Status Quo Virtual Simulation Model. This reduces the exposure time of the crews to risks
inherent to flying a live helicopter by 34 hours or 26 percent. The total cost in this model is
$287,286,300 and the total LCT throughput is 1295 hours.

43
Table 15: High Virtual Simulation Analysis
Sensitivity Analysis
Sensitivity analysis denotes the influence cost variables have on the different models.
This sensitivity analysis includes changes in operating costs and operational tempo (OPTEMPO)
using the examples of POL costs and training requirements in the form of hourly requirements.
The price of governmental POL is locked and contracted years in advance, therefore this
analysis does not reflect a rapid change, but a change over a significant period of time. The
percentage of POL costs is approximately 11.4% of the total cost per live hour and 5% of the
total cost per LCT hour.
To reflect the impact a fluctuation in POL costs and training requirements have on the
cost analysis, this analysis considers shifts of plus or minus 25% in POL and 20% in training.
This section includes an exemplary analysis for the Moderate Virtual Simulation Model and
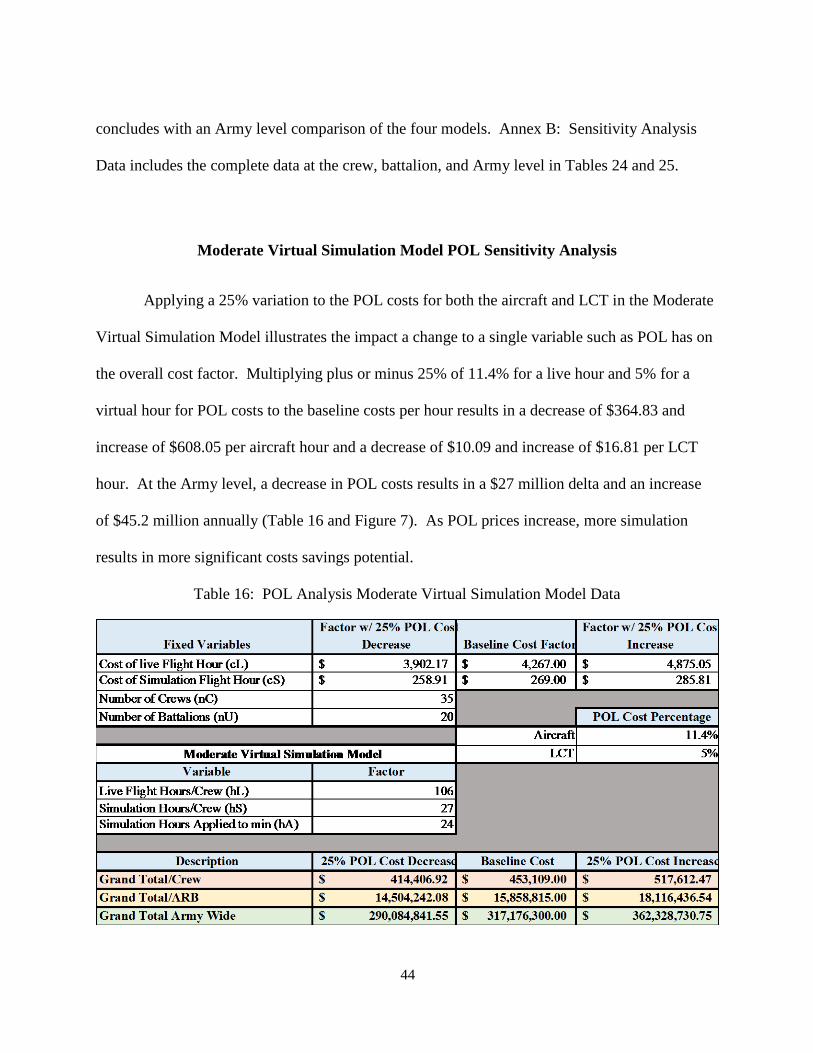
44
concludes with an Army level comparison of the four models. Annex B: Sensitivity Analysis
Data includes the complete data at the crew, battalion, and Army level in Tables 24 and 25.
Moderate Virtual Simulation Model POL Sensitivity Analysis
Applying a 25% variation to the POL costs for both the aircraft and LCT in the Moderate
Virtual Simulation Model illustrates the impact a change to a single variable such as POL has on
the overall cost factor. Multiplying plus or minus 25% of 11.4% for a live hour and 5% for a
virtual hour for POL costs to the baseline costs per hour results in a decrease of $364.83 and
increase of $608.05 per aircraft hour and a decrease of $10.09 and increase of $16.81 per LCT
hour. At the Army level, a decrease in POL costs results in a $27 million delta and an increase
of $45.2 million annually (Table 16 and Figure 7). As POL prices increase, more simulation
results in more significant costs savings potential.
Table 16: POL Analysis Moderate Virtual Simulation Model Data

45
Figure 7: POL Analysis Moderate Virtual Simulation Model Graph
Model Comparison for POL Sensitivity Analysis
In the model comparison for fuel costs, all models reflect an approximate 25% percentage
delta between the decreased factor and the increased factor. The largest percentage delta from
baseline is when POL costs increase resulting in an approximate increase of 14%. A decrease of
the same magnitude results in a percentage delta from baseline of approximately 8.5% for all
models. When POL costs increase, the Low Virtual Simulation Model shows the greatest delta
with approximately $59.8 million, while the High Virtual Simulation Model shows the lowest
delta with approximately $40.9 million. Conversely, when the cost of POL decreases, the delta,
while not nearly as significant as an increase in POL costs, is at a maximum delta of
$290,084,841.55 $317,176,300.00
$362,328,730.75
$-
$50,000,000.00
$100,000,000.00
$150,000,000.00
$200,000,000.00
$250,000,000.00
$300,000,000.00
$350,000,000.00
$400,000,000.00
25% POL Cost Decrease Baseline Cost 25% POL Cost Increase
Total Costs Adjusted ±25% for Fluctuating POL Costs
Grand Total/Crew Grand Total/ARB Grand Total Army Wide

46
approximately $35.9 million in the Low Virtual Simulation Model and minimum delta of only
$24.5 million for the High Virtual Simulation Model. This is due to the amount of live flight
hours which carry the largest POL costs, and when modified, result in the greatest change,
exponentially (Table 17 and Figure 8).
Table 17: Fuel Analysis Model Comparison Data
Figure 8: POL Analysis Model Comparison Graph
$385,493,865.75
$481,155,823.75
$262,769,641.05
$328,203,398.25
$-
$100,000,000.00
$200,000,000.00
$300,000,000.00
$400,000,000.00
$500,000,000.00
$600,000,000.00
25% POL Cost Decrease Baseline Cost 25% POL Cost Increase
Total Costs Adjusted ±25% for Fluctuating POL CostsModel Comparison
Low Status Quo Moderate High

47
Moderate Virtual Simulation Model Training Sensitivity Analysis
Applying a 20% variation to training costs for both the aircraft and LCT in the Moderate
Virtual Simulation Model illustrates the impact a change to a single variable such as training
requirements has on the overall cost factor. Multiplying plus or minus 20% to the baseline
number of training hours results in a delta of 21.2 aircraft hours annually, 5.4 LCT hours, and 4.8
hours applied to live flight minimum annual requirements. At the Army level, the cost delta is
approximately $63.4 million annually (Table 18 and Figure 9).
Table 18: Training Analysis Moderate Virtual Simulation Model

48
Figure 9: Training Analysis Moderate Virtual Simulation Model (Graph)
Model Comparison for Training Sensitivity Analysis
In the model comparison for training costs, the Low Virtual Simulation Model shows the
greatest delta with approximately $84.3 million while the High Virtual Simulation Model shows
the smallest delta with approximately $57.5 million. This is due to the amount of live flight
hours which carry the largest operational costs, and when modified, result in the greatest change
(Table 19 and Figure 10.
$253,741,040.00
$317,176,300.00
$380,611,560.00
$-
$50,000,000.00
$100,000,000.00
$150,000,000.00
$200,000,000.00
$250,000,000.00
$300,000,000.00
$350,000,000.00
$400,000,000.00
25% Training Cost Decrease Baseline Cost 25% Training Cost Increase
Total Costs Adjusted ±20% for Fluctuating Training Requirements
Grand Total/Crew Grand Total/ARB Grand Total Army Wide

49
Table 19: Training Analysis Model Comparison Data
Figure 10: Fuel Analysis Model Comparison (Graph)
$337,093,680.00
$505,640,520.00
$229,845,840.00
$344,768,760.00
$-
$100,000,000.00
$200,000,000.00
$300,000,000.00
$400,000,000.00
$500,000,000.00
$600,000,000.00
20% Training Cost Decrease Baseline Cost 20% Training Cost Increase
Total Costs Adjusted ±20% for Fluctuating Training CostsModel Comparison
Low Status Quo Moderate High Linear (Moderate)

50
CHAPTER FIVE: DISCUSSION AND RECOMMENDATIONS
Chapter Five Summary
Chapter 5 serves as the conclusion chapter with an overall discussion of the topics, data,
analysis through discussion, conclusion, current recommendation, and recommendations for
further research.
Discussion
In this study, we examined the cost benefits of replacing live flight hours with virtual live
hours while addressing concern for the aviator’s proficiency. The study focused on the AH-64
platform, LCT, active component aviation structure, and aviator designation to apply the
methodology to a realistic sample. In this study, that sample was the general pilot or PI who, in a
garrison training environment, generally fly the minimum flight requirements.
The LCT is a viable simulation solution and, as such, the only approved synthetic flight
simulation system for the Apache. When training programs integrate the LCT with the
conditions outlined by the Salas and Burke study, the LCT is a relevant and effective supplement
to a comprehensive training plan. The LCT affords aircrews the ability to accomplish dangerous
or, otherwise unauthorized tasks, such as auto-rotations terminating to the ground and hovering
auto-rotations. Additionally, simulated emergency procedure training in the LCT provides the
crew with realistic conditions, indications, and feedback without exposing the crew to
unnecessary risk. The LCT is an excellent instrument meteorological condition (IMC) and
gunnery/weapons trainer. Unlike a flight in an aircraft, the LCT is unaffected by poor weather

51
and other uncontrollable factors. Lastly, I/Os can pause, reset, and evaluate training in real-time.
On the other hand, the LCT does not have the means to train night vision goggles or multi-ship
flight or collective training without the use of I/O controlled avatars.
Over the past few years, units were forced to make difficult decisions regarding FHP
management due to declining budgets and sequestration. For those who have only experienced
the post-9/11 military, budget management and fiscal stewardship are unfamiliar territory. With
OCO funding and budgets supporting the war fight, units operated with what felt like an
unlimited budget. When sequestration became a reality, units were required to operate at a
significant detriment. While the Army was dealing with sizing and troop level restructuring,
units at the lowest level, were deciding which repair parts to purchase, how to meet annual
training requirements with scarce resources (e.g. fuel, ammunition, and parts), and relevant to
this study, who gets to fly and how do they meet minimum flight requirements. The budget is
back on the rise, but the threat of additional cuts looms. The Army cannot afford to risk
proficiency while reducing costs, thus reducing the training budget. Supplementing live hours
with simulation is a cost effective methodology but, at an unclear point, could potentially affect
the aviator’s skill in the actual aircraft. Budget analysts and commanders need to understand the
effects increasing simulator usage has on costs and aviator proficiency before haphazardly
responding to budget cuts. This study provided four options at different flight hour and price
points while remaining conservative to sustain aviator proficiency. From a safety perspective, a
reduction in exposure to the live environment mitigates risk to the aircrew but if there is a loss in
proficiency due to flying too much simulation, the risk increases despite a reduction in live flight
hours.

52
Tables 20 through 22 consolidate the data analysis from Chapter 4 and compare the
potential cost savings from baseline for each model at the crew, battalion/squadron, and Army
level. Ultimately, the High Virtual Simulation Model provides the most potential for cost
savings of $106,073,800 for each crew annually, but at the expense of live hours. The Low
Virtual Simulation Model comes at a cost increase of $27,986,000 for each crew annually due an
increase in flight hours compared to simulation hours and has very little potential of
implementation due to the higher costs and the trend of using increased simulation. The High
and Low Virtual Simulation Models require changes to current doctrine, specifically with the
amount of LCT hours a commander can authorize an aviator to apply to their semiannual flight
minimum requirements. The Status Quo and Moderate Simulation Virtual Models do not require
changes to doctrine. LCT throughput is never an issue with any of the models, assuming each
battalion owns an LCT or even through proper management when sharing one system.
The final point of discussion is that of the proper amount of simulation without detriment
in proficiency to the crew. In this study, transfer has a direct relationship to proficiency. While
the LCT is a suitable training supplement, it is just that, a supplement for training. The LCT
could never completely replicate the immersion or risk of consequence the crew experiences in
the actual aircraft. Crew chiefs need hours flown on the aircraft, so they can train their
respective maintenance tasks. Additionally, due to limitations of the LCT, live air to ground
integration training as well as joint attacks with aircrews from the other services are only
practicable and most realistic in live conditions. Finally, the current budget affords aircrews to
maintain flight minimums with very little modification. Current Army doctrine and guidance
accepts some simulation supplementation for live training and that apportionment is specifically
defined in the ATM as reflected in the Status Quo and Moderate Virtual Simulation Models.

53
Table 20: Cost Summary (Crew)
Table 21: Cost Summary (Battalion/Squadron)
Table 22: Cost Summary (Army Wide)
Study Benefits
Some of the benefits of this study include:
1. Viable options for budget analyst and commanders to better implement alternative
flying hour program methodologies in fluctuating budgets.
2. Realistic crew applicability.
3. Serves as a prelude to additional analysis and research for other aviation platforms
and cost savings.

54
Study Limitations
Some of the limitations of this study include:
1. Limited compensatory analysis which only applies the cost of an aircraft hour
versus an LCT hour. This study excludes the associated costs for loss of aircraft,
loss of crew, or other overhead costs not applicable to the operations costs of an
aircraft hour.
2. No sampling or experimentations on aircrews to test the validity of the models in
regard to transfer and proficiency.
3. An estimation of crew mix versus a true comprehensive sampling of the Army
Aviation force structure accounting for personnel shortages, turnover, and unit
training readiness.
This study does not adequately address the follow aspects but could benefit from
additional research:
1. To what effect do different simulation motion replication formats have on transfer
of training (e.g. motion plates, 6 DOF)? The LCT has motion plates in the seats
as well as other systems to heighten immersion such as vibration and aural effects,
but the instrument panel is fixed. There is potential that a 6 degree of freedom
simulator could better replicate the proprioceptive sensation fine motor tasks such
as ground taxiing and slope landings require as well as provide feedback for
environmental factors such as crosswinds and turbulence.
2. Many of the commercial fixed-wing airlines conduct some portion of simulation
training in a 6 DOF simulator as specified by the FAA AC120-40b (1991). What

55
risk level does the FAA determine proficiency requiring 6 DOF simulation and
are these risk levels transferable for military rotary-wing training? For the LCT
motion platforms versus 6 DOF platforms, for corresponding flight tasks, what is
the difference in acceptable risk levels?
3. The LCT does not currently offer night vision goggle capability and hence does
not directly train pilots for operation with night vision goggles. The Apache’s
primary night vision sensor is the forward looking infrared, but as proven in
training and combat, crews must train on both the FLIR and NVG systems in case
of damage or failure of the FLIR system. Night flights are the most dangerous
and demanding flight modes.
4. This research assumed LCT throughput was always available and did not address
in terms of cost savings either excess or shortfall in availability of the LCT for
training. An additional variable for sensitivity analysis is LCT throughput as there
appears to be excess LCT availability. The LCT funding accounts for almost 50%
more hours than that needed to meet aviator minimum simulation requirements
for one battalion. Future analysis of requirements, LCT utilization, and
maintenance rates could bring contract costs down to even lower levels.
5. For the range (Low to High) of simulation hour substitution for live hours used in
the sensitivity analysis, no loss of training proficiency is assumed. To assume
continued linearity of equal tradeoff of simulation hours for live hours beyond the
low to high range discussed in this thesis is risky. As seen in repeated studies, a
rapid non-linear increase in pilot proficiency may be observed with initial
simulator training until the pilot reaches a level of proficiency. Similar to an S-

56
curve, once the proficiency asymptote is reached, there are likely diminishing
returns with additional simulation. Conversely replacing live flight time with
simulation time may experience a reverse S curve non-linear loss of proficiency.
At some unknown point substitution of live flight hours with simulation hours
may result in decreasing proficiency and even negative training as seen in the CH-
47 study with asymmetric outcomes such as deadly accidents. This study
intentionally limits the range of sensitivity analysis for substituting live flight
hours with simulation hours to the fore mentioned low and high range to avoid
non-linear loss of pilot proficiency with possible asymmetric outcomes. This
research targets the plateau in the middle of the curve to avoid the inevitable drop
in proficiency.
Conclusions
Although the application of LCT flight hours in lieu of actual flight time to make
semiannual flight hour minimums is not preferred and often rejected at the unit level, this study
proved the cost savings and risk mitigation with marginal risk to proficiency makes the
application of virtual flight hours to semiannual flight minimums a viable option and at times a
necessary alternative. While the effects on proficiency are only theoretical within this study,
additional research and experimentation would narrow the parameters in finding a suitable
balance between live and virtual requirements.

57
Current Recommendations
Given the 2016 budget increase, combined with the Army’s current flying hour budget,
there are no reasons to take any drastic measures or impose mandates to commanders regarding
the use of virtual in lieu of live training. Commanders should continue to promote the use of the
LCT while resourcing training with the proper emphasis to ensure quality training in the
simulator as well as manage flight hours to achieve both live and virtual flight hour minimums
efficiently and effectively. Additionally, live training should place emphasis on refining control
touch, maintaining confidence in the aircraft through pre-flight checks and flight profiles, and
performing tasks not effectively replicated in the LCT. Those tasks include, but are not limited
to, taxiing and airfield operations with other aircraft on the airfield, multi-helicopter operations,
and joint and combined training.
Since the proficiency research is inconclusive and would only be clarified with more
specific research and experimentation, the current recommendation is to maintain a flight hour
program in line with current Army doctrine. Both the Status Quo and Moderate Virtual
Simulation Models meet that recommendation. The Moderate Virtual Simulation Model
produces in the greatest savings from both a monetary and risk perspective. Applying twelve
hours to a PIs semiannual minimum flight requirements is already written in regulation and
therefore, accepted by Army leadership. The negative stigma of applying simulation to flight
minimums is an antiquated approach to managing an FHP. The High Virtual Simulation Model
is feasible but at this point unnecessary and too aggressive in relation to risk to proficiency to
enact.
58
Recommendations for Further Analysis
Applying similar analysis with the Army’s other advanced helicopters is the natural
progression for this research topic. Additionally, the impact on proficiency from shifts in the
balance of live and virtual flight simulation has on the individual crew and aviator remains
unclear. One method of resolving this research gap is through experimental testing of aviator
proficiency with a combination of forward, backwards, or quasi-experimental studies on samples
of aviators at various levels in their respective careers (Hancock, Vincenzi, Wise, & Mouloua,
2008) or applying the tools presented in Chapter 2. Finally, collecting long term data on the
proficiency levels of the aviators with reduced live hours and increased simulation hours in
factors such as evaluation success rates, flight hours to pilot-in-command status, accident or
incident rates and cause, and graduation/grades in graduate aviator courses such as instructor
pilot and maintenance test pilot courses, is essential to understanding the impact decreased live
and increased virtual hours has on an aviator’s proficiency.

59
APPENDIX A: III CORPS FLYING HOUR PROGRAM COST FACTORS

60
Table 23: III Corps FY16 FHP Cost Factors

61
APPENDIX B: SENSITIVITY ANALYSIS DATA

62
Table 24: POL Sensitivity Analysis Data

63

64
Table 25: Training Sensitivity Analysis Data
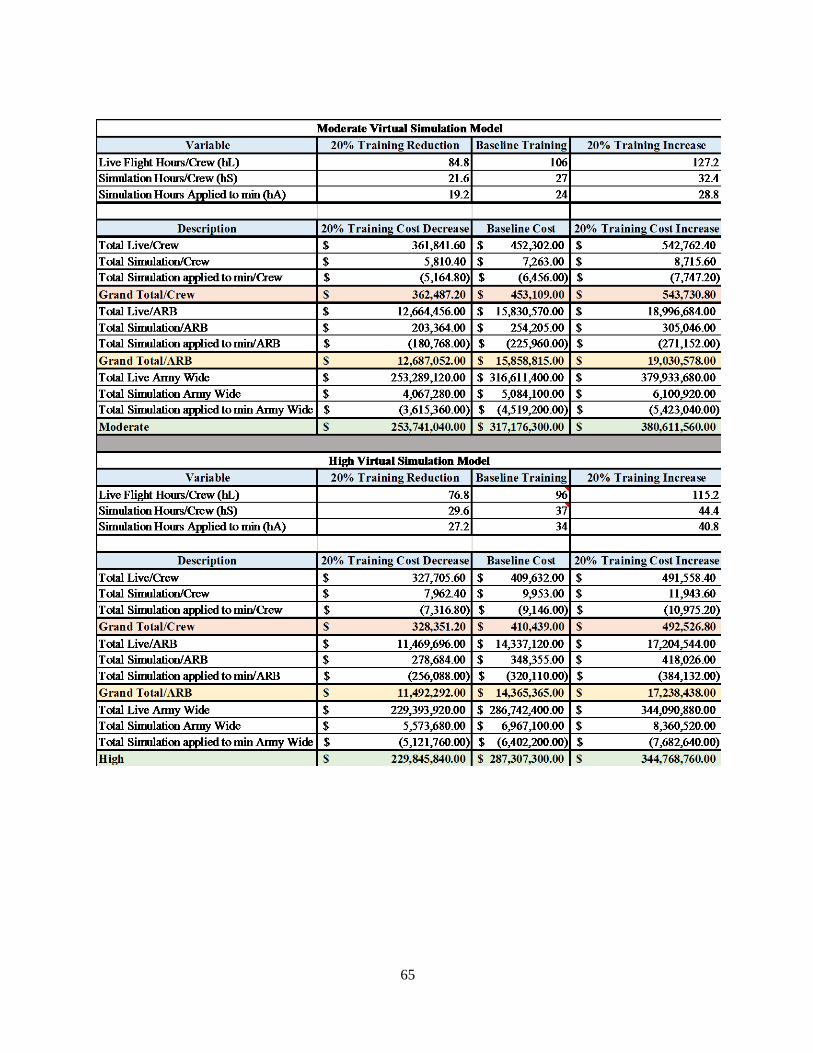
65

66
REFERENCES
1st Armor Division. (2013). FY 14 Annual Training Guidance.
Allen, K. M. (2015, October 16). AH-64 Crews. Retrieved November 4, 2015, from Army Aircrews: http://www.armyaircrews.com/apache.html
Army Financial Management. (2015, February). Assistant Secretary of the Army for Financial Management & Comptroller. Retrieved February 1, 2015, from Budget Materials: http://asafm.army.mil/Documents/OfficeDocuments/Budget/budgetmaterials/fy16//overview.pdf
Blow, C. A. (2012). Flight School in the Virtual Environment: Capabilities and Risks of Executing a Simulations-Based Flight Training Program. No. ATZL-SWV. Army Command and General Staff College Fort Leavenworth KS School of Advanced Military Studies.
Boeing. (n.d.). Data. Retrieved July 30, 2015, from www.boeing.com: http://www.boeing.com/resources/boeingdotcom/defense/ch-47_chinook/images/ch_47_hotspot_background_960x410.png
Boeing. (n.d.). Resources. Retrieved July 29, 2015, from www.boeing.com: http://www.boeing.com/resources/boeingdotcom/defense/ah-64_apache/images/ah_64_hotspot_background_960x410.jpg
Copp, T. (2016, January 25). Slew of Military Helicopter Deaths Raises Question of Whether Budget Cuts Endanger Troops. Retrieved January 28, 2016, from Stars and Stripes: http://www.stripes.com/slew-of-military-helicopter-deaths-raises-question-of-whether-budget-cuts-endanger-troops-1.390587
Department of the Army. (2005). TC 1-251 Aircrew Training Manual Attack Helicopter AH-64D. Washington, D.C.: Headquarters, Department of the Army.
Department of the Army. (2007). FM 3-04.126 Attack Reconnaissance Helicopter Operations. Washington, D.C.: Headquarters, Department of the Army.
67
Department of the Army. (2009). TC 3-04.11 Commander's Aircrew Training Program for Individual, Crew, and Collective Training. Washington, D.C.: Headquarters, Department of the Army.
Department of the Army. (2010). Pamphlet 350-9 Training: Index and Description of Army Training Devices. Washington, D.C., USA: Headquarters, Department of the Army.
Department of the Army. (2013). TC 3-04.42 (TC 1-251) Aircrew Training Manual, Attack Helicopter, AH-64D. Washington, D.C.: Headquarters, Department of the Army.
Department of the Army. (2014). Army Regulation 95-1 Aviation Flight Regulations. Washington, D.C.: Headquarters, Department of the Army.
Department of the Army. (2014). TC 3-04.45 Combat Aviation Gunnery. Washington, D.C.: Headquarters, Department of the Army.
Diehl, A. E., & Ryan, L. E. (1977). Current simulator substitution practices in flight training. No. TAEG-43. Orlando, FL: Training Analysis and Evaluation Group (Navy).
Federal Aviation Administration. (1991, July 29). AC 120-40B Airplane Simulator Qualification. Appendix 1, 12-14. U.S. Department of Transportation.
Force Management Support Agency. (2015). FMSWeb Divisions. Retrieved November 5, 2015, from FMSWeb: https://fmsweb.army.mil/protected/WebTAADS/Frame_Org.asp?DOC_TYPE=MTOE
Frank, G., Helms, R., & Voor, D. (2000, November). Determining the right mix of live, virtual, and constructive training. Proceedings of the 21st Interservice/Industry Training System and Education Conference.
Funding, S. L. (2014, April). Estimated Impacts of Sequestration-Level Funding - FY 2015 Defense Budget.
Goetz, S., Harrison, B., & Robertson, M. (2012). Use of Simulation in Visual Flight Training: The Effect on Time to Solo. Collegiate Aviation Review, 30(2), 1.

68
Gower Jr., D. W., Lilienthal, M. G., Kennedy, R. S., Fowlkes, J. E., & Baltzley, D. R. (1987). Simulator Sickness in the AH-64 Apache Combat Mission Simulator (No. USAARL-88L-88-1). Army Aeromedical Research Lab Fort Rucker AL. Retrieved from http://www.dtic.mil/cgi-bin/GetTRDoc?Location=U2&doc=GetTRDoc.pdf&AD=ADA193419
Hancock, P. A., Vincenzi, D. A., Wise, J. A., & Mouloua, M. (2008). Human factors in simulation and training. CRC Press.
Kakip, R., Kelly, J., Appler, S., & Riley, P. (1993). The role of the MH-53J III E Pave Low weapon system trainer/mission rehearsal system (WST/MRS) in preparing students for Operation Desert Storm, and future operations. Proceedings of the 15th Interservice/Industry Training Systems and Education Conference, 432-438. Washington, D.C.: American Defense Preparedness Association.
McCaffrey, T. (2012, October 3). The Army Training Strategy. 8. Fort Monroe, VA: U.S. Army Training and Doctrine Command.
Mings, J. (2016, March 3). Apache LCT D/E: Hourly LCCS Information Brief. Orlando, FL, USA.
Muchinsky, P. (2006). Psychology applied to work: An introduction of industrial and organizational psychology (Vol. 1). Cengage Learning.
Orlansky, J., Dahlman, C. J., Hammon, C. P., Metzko, J., & Taylor, H. L. (1994). The Value of Simulation for Training. Alexandria: Institute for Defense Analyses.
Project Manager, Apache Attack Helicopter. (2014, April 6). AH-64E Series Transition Course Flight Training Guide. 6.0. Redstone Arsenal, AL.
Salas, E., & Burke, C. S. (2002). Simulation for training is effective when.... Quality and Safety in Health Care, 11(2), 119-120.
Selix, G. (1993). Evolution of a training program: The effects of simulation on the MH-53J Pave Low Combat Crew Qualification Course. Proceedings of the 15th Interservice/Industry Training Systems and Education Conference, 422-431. Washington, D.C.: American Defense Preparedness Association.

69
Stewart, J. E., Dohme, J. A., & Nullmeyer, R. T. (1999). Optimizing Simulator-Aircraft Mix for US Army Initial Entry Rotary Wing Training. (No. ARI-TR-1092). Alexandria, VA: Army Research Institute for the Behavioral and Social Sciences.
Tan, M. (2015, March 16). First of 10 Apache units converts, adds 12 Shadow UASs. Retrieved December 15, 2015, from ArmyTimes: http://www.armytimes.com/story/military/careers/army/2015/03/16/apache-battalion-conversion/70227902/
Taylor, H. L., Lintern, G., & Koonce, J. M. (1993). Quasi-transfer as a predictor of transfer from siulator to airplane. The Journal of general psychology, 120(3), 257-276.
The Boeing Company. (n.d.). AH-64 Apache. Retrieved October 27, 2015, from Boeing: http://www.boeing.com/defense/ah-64-apache/
The Boeing Company. (n.d.). AH-64 Apache Attack Helicopter: Historical Snapshot. Retrieved October 27, 2015, from Boeing: http://www.boeing.com/history/products/ah-64-apache.page
Training Support Center, Fort Carson, Colorado. (2012, August 17). Flight Simulations: Longbow Crew Trainer (LCT). Retrieved July 29, 2015, from carson.army.mil: http://www.carson.army.mil/tsc/_assets/images/sims/lct.jpg
U.S. Army Directorate of Simulation. (2011). CH47D Simulation Test: MTPC Class 11-002 & FSXXI Class 11-919 Command Outbrief. Fort Rucker, AL: U.S. Army Aviation Center of Excellence.
U.S. Army Forces Command. (2013). FY 14 Annual Training Guidance.
U.S. Army Forces Command. (2014, May 29). FY 15 Aviation Cost Factors. Fort Bragg, North Carolina, United States of America.
U.S. Army Forces Command, G-3 Aviation. (2013, September). FY 14 Flying Hour Program Budget - 1AD CAB.

70
Under Secretary of Defense (Comptroller). (2015, February). DoD Budget Request. Retrieved January 28, 2016, from Defense Budget Materials - FY 2016: http://comptroller.defense.gov/Portals/45/Documents/defbudget/fy2016/FY2016_Budget_Request_Overview_Book.pdf
United States Army Aviation Center of Excellence. (2011, February). Flight Training Guide: AH-64D IPC and IP/MOI Full Training Block I/II (Draft). Fort Rucker, AL.
Wightman, D., & Wright, R.H. (in preparation). Simulator-based training in the AH-64 Aircraft Qualification Course: Proof of concept.