can cost-benefit analysis guide education policy in...
TRANSCRIPT
DRAFT
December 20, 2007
Can Cost-Benefit Analysis Guide Education Policy in
Developing Countries?
Emmanuel Jimenez and Harry Anthony Patrinos
The World Bank

If the true test of the value of an economic theory is longevity, the human capital model
passes with flying colors. Its basics are simple and empirically testable (and generally
validated). An individual will invest in his or her human capital—an additional year of
schooling or on-the-job training—as long as the marginal gain from that investment exceeds its
added cost. The gains extend over a lifetime and are discounted to the present. If some of these
gains accrue to others, governments need to stimulate individuals to take them into account in
making decisions. Public action may also be needed if poor individuals cannot mobilize the
resources to finance the investment now, despite a promise of big gains in the future.
This human capital framework has been a driving force for the huge investments in
education in developing countries in the past 40 years. In addition to education’s social benefits,
the recognition of its long-term economic benefits has spurred finance and budget ministries to
action. In global terms, education spending has mushroomed from 3.7 percent in 1970 to 4.5
percent of GDP in 2002 (see Figure 1). This has led, by some accounts, to profound increases in
the number of young people going to school, particularly at primary levels. There were more
than 688 million children enrolled in primary schools globally in 2005, up 6 percent from 1999
alone. Worldwide average schooling level for the population was 5.0 years of schooling in 1970
attained across 103 countries (based on calculations from Barro and Lee’s (2000) database).
There was a 31 percent increase by 1999, when average schooling went up 1.5 years of schooling
to above 6.5 years.

2
Figure 1: Worldwide Education Spending as % of GDP
3
4
5
1970 1975 1980 1985 1990 1995 2000
Ed spending % of GDP Linear (Ed spending % of GDP)
Because the framework is one of an economic investment, cost-benefit analysis (CBA)
should be an important tool in making key decisions about the amount and types of investments.
As reviewed in section 1 of this paper, the methods to apply this tool are well-established. And,
as described in section 2, the applications of these methods have played a strong role in
advocating for greater overall spending on education as a national priority.
But CBA has been less successful as a guide to set priorities for public policy. Section 3
shows that using such analysis, and specifically quantified analysis of rates of return (ROR), net
present value (NPV) or even cost-effectiveness (CE), to guide aggregate government spending
has not been widespread. And at the micro level, CBA has also not been used extensively in
justifying specific education projects. Why not? We argue that some key methodological
shortcomings have been responsible: specifically, the difficulty of estimating social, as opposed

3
to private, benefits; the complexity of measuring the costs and benefits of other dimensions of
education other than access to a year of attending an educational institution; and attribution of
outcomes to actual interventions. Addressing these issues are the key research challenges for the
future.
While research on the computation of more robust quantifications of costs and benefits
continues, CBA should still be used to guide public investment. We argue in Section 4 that the
discipline of a describing the costs and benefits of a project does help decision-making – far
more than the practice of simply saying that such investments are ‘socially’ justified. Combined
with sound overall sectoral analysis, CBA is crucial to providing the rigorous framework that
allows public authorities to make tough choices among competing investment projects.
1. Applying Cost-Benefit Analysis to Education: Principles
The application of cost-benefit analysis (CBA) to education is straightforward and is
well-treated in some of the most recent textbooks in development economics (see Perkins,
Radelet and Lindauer 2006). A schematic of the benefits and costs of investing in an additional
year of education beyond the primary level is shown in Figure 2. The private benefit (B) of
investing in another year of education is the gain in earnings for the rest of a person’s working
life. The private cost (C) will include any fees or direct cost that the individual pays plus the
opportunity cost in terms of foregone income. Because these values occur over time, they must
be discounted to the present to be comparable. The Net Present Value (NPV) is the difference
between the discounted values of the net present streams of benefits and costs.

4
Figure 2: Stylized Age-Earnings Profile
A rational investor – in this case a student or his/her family – will undertake the
investment – such as an additional level of schooling – if the net present value is positive.
Another criterion would be to calculate the internal rate of return and compare it with the returns
from alternative investments. From this schematic, if t represents a unit of time, the private rate
of return to education (r) is computed straightforwardly from the following formula:
∑ Bt /(1+r)t = ∑ Ct /(1+r)t
The social benefit (SB) is the monetized value of the gains to others in society, such as
the positive effects of having educated people interact with each other, greater social cohesion,
Costs
18 23
5 42
65 0
Earnings
Direct cost
Age
Time (years)
Secondary School Leavers
University Graduates
Benefits

5
and so on. The social cost (SC) is the monetized value of the cost to others in society, such as
the fiscal cost if the education is subsidized, including the deadweight cost of mobilizing public
resources. The social return is computed by replacing B and C by SB and SC in the equation
above.
Estimating these returns has led to a mini-cottage industry of scholarship (for a review,
see Psacharopoulos and Patrinos 2004). One method is to compare earnings profiles for people
with different educational levels. In the case of university education, for example, the formula to
compute the private rate of return is:
( )( ) ∑∑
==
++=+
− 5
1
42
1)1)((
1 t
tus
tt
tsu rCWrWW
where (Wu-Ws) is the earnings differential between a university graduate (subscript u) and a
secondary school graduate (subscript s, the control group). Cu represents the direct costs of
university education (tuition and fees, books), and Ws denotes the student’s foregone earnings or
indirect costs. A similar calculation can be made for the other levels of education. However,
there is an important asymmetry between computing the returns to primary education and those
to the other levels. Primary school children, mostly aged 6 to 12 years, do not forego earnings
during the entire length of their studies. On the assumption that children aged 11 and 12 help in
agricultural labor, two or three years of foregone earnings while in primary schooling have been
used in the empirical literature (Psacharopoulos 1995).
To compute the social rates of return to education, which are the appropriate guide for
public investment, one must make adjustments. On the cost side, the costs would need to include
society’s spending on education. Hence, in the above example, Cu would include the rental of

6
buildings and professorial salaries. Gross earnings (that is, before taxes and other deductions)
should be used in a social rate of return calculation, and such earnings should also include
income in-kind where this information is available. A key assumption in a social rate of return
calculation is that observed wages are a good proxy for the marginal product of labor, especially
in a competitive economy using data from the private sector of the economy. Civil service pay
scales are irrelevant for a social rate of return calculation, although they may be used in a private
one. The social attribute of the estimated rate of return refers to the inclusion of the full resource
cost of the investment (direct cost and foregone earnings).
Ideally, the social benefits should include non-monetary or external effects of education
(for example, lower fertility or lives saved because of improved sanitation conditions followed
by a more educated woman who never participates in the formal labor market). Given the scant
empirical evidence on the external effects of education, social rate of return estimates are usually
based on directly observable monetary costs and benefits of education. Since the costs are higher
in a social rate of return calculation relative to the one from the private point of view, estimated
social returns are typically lower than a private rate of return. The difference between the private
and the social rate of return reflects the degree of public subsidization of education.
The discounting of actual net age-earnings profiles is the most appropriate method of
estimating the returns to education because it takes into account the most important part of the
early earning history of the individual. However, this method requires comprehensive data – one
must have a sufficient number of observations in a given age-educational level cell for
constructing “well-behaved” age-earnings profiles (that is, not intersecting with each other).

7
The earnings function method, also known as the Mincerian method (see Mincer 1974),
involves the fitting of a function of log-wages (LnW) – usually hourly or weekly, using years of
schooling (S), years of labor market experience (X) and its square (X2) as independent variables.
Thus, the basic earnings function is:
ln Wi = α + βSi + γ1Xi + γ2Xi2 + εi
In this semi-log specification, the coefficient on years of schooling (β) can be interpreted as the
average private rate of return to one additional year of schooling, regardless of the educational
level this year of schooling refers to. Also, the earnings function method can be used to estimate
returns to education at different levels by converting the continuous years of schooling variable
(S) into a series of dummy variables, say Dp, Ds and Du, to denote the fact that a person has
completed the corresponding level of education (primary, secondary, university), and that, of
course, there are also people in the sample with no education in order to avoid matrix singularity.
Then, after fitting an extended earnings function using the above dummies instead of years of
schooling in the earnings function, the private rate of return to different levels of education can
be derived. Again, care has to be taken regarding the foregone earnings of primary school-aged
children. Although convenient because it requires less data, this method is slightly inferior to the
previous one as it, in fact, assumes flat age-earnings profiles for different levels of education (see
Psacharopoulos and Layard 1979).
8
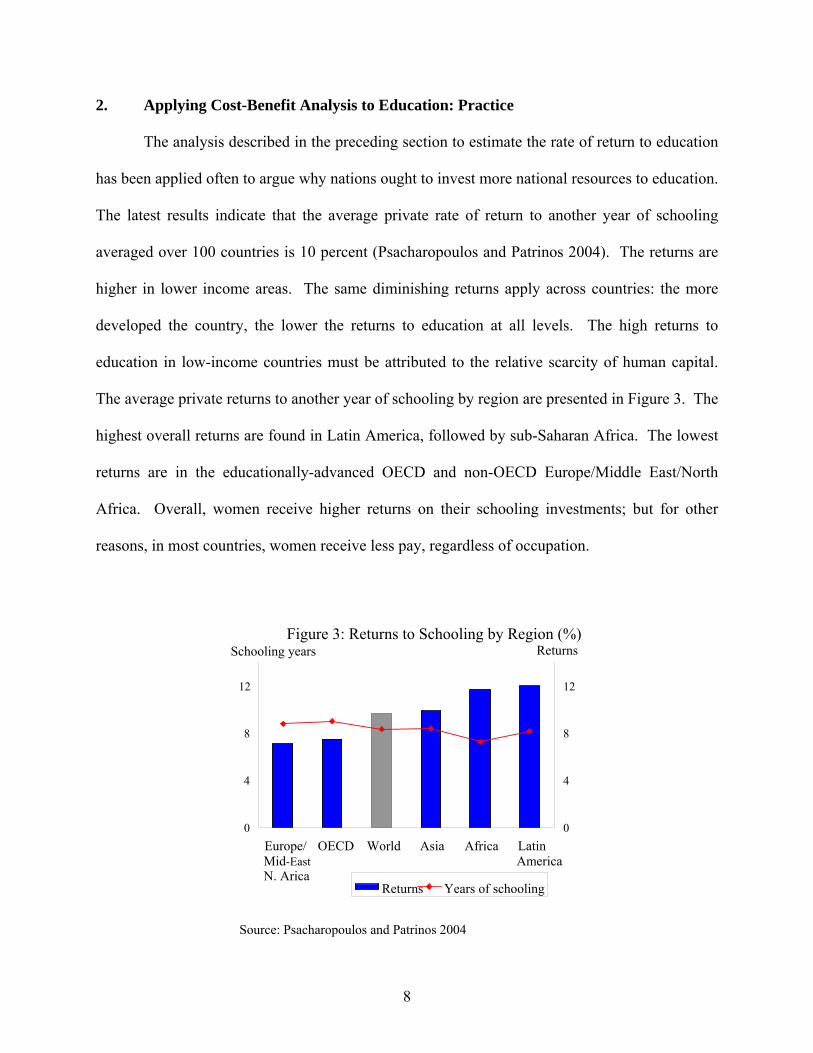
2. Applying Cost-Benefit Analysis to Education: Practice
The analysis described in the preceding section to estimate the rate of return to education
has been applied often to argue why nations ought to invest more national resources to education.
The latest results indicate that the average private rate of return to another year of schooling
averaged over 100 countries is 10 percent (Psacharopoulos and Patrinos 2004). The returns are
higher in lower income areas. The same diminishing returns apply across countries: the more
developed the country, the lower the returns to education at all levels. The high returns to
education in low-income countries must be attributed to the relative scarcity of human capital.
The average private returns to another year of schooling by region are presented in Figure 3. The
highest overall returns are found in Latin America, followed by sub-Saharan Africa. The lowest
returns are in the educationally-advanced OECD and non-OECD Europe/Middle East/North
Africa. Overall, women receive higher returns on their schooling investments; but for other
reasons, in most countries, women receive less pay, regardless of occupation.
Source: Psacharopoulos and Patrinos 2004
Figure 3: Returns to Schooling by Region (%)
0
4
8
12
Europe/ Mid-East N. Arica
OECD World Asia Africa Latin America
Schooling years
0
4
8
12
Returns
Returns Years of schooling
9
For a long time the returns on educational investment were higher at lower levels of
schooling. The scarcity of human capital in low-income countries provided a significant
premium to investing in education. The high returns on primary education provide an added
justification for making education a priority in developing countries. Over time, on average, the
rate of return to education has fallen. This decline coincides with a significant increase in
average years of schooling for the population as a whole. During the last 12 years, average
returns on schooling have declined by 0.6 percentage points (Psacharopoulos and Patrinos 2004).
At the same time, average schooling levels have increased. Therefore, and according to theory,
everything else being the same, an increase in the supply of education has led to a slight decrease
in the returns on schooling. That is, if there are no “shocks” – such as changes in technology –
that increase the demand for schooling, then an increase in overall schooling levels should lead
to a decrease in the returns to schooling.
Over the recent decades, we have seen the returns to schooling decline in many low-
income countries, while the technological revolution has increased demand for skilled labor in
some developed countries and the returns to schooling have increased. Amidst the fluctuations,
there has been a downward trend in the returns to schooling since the 1980s. The proportion of
the population with secondary schooling and above has risen markedly over the decades while
the proportion of the population with only primary has declined. This means that primary
education has become almost universal; subsequently the returns to primary schooling have
declined the most over time. For secondary education, both rate of returns and the proportion of

10
population have risen together until the 1980s when the proportion of the secondary education
population appears to be inversely related to the private rate of return to secondary education.
Estimates such as these have been used extensively in policy fora to argue that more
needed to be invested in education, especially basic education. For example, in the campaigns
for “Education for All,” analysts have used these rates of return as a call to action. While
education is seen by many as a basic human right, these economic arguments are seen as
essential to releasing the national resources to invest in schools and universities. In the 2002
Education for All Global Monitoring Report it is stated that “available estimates of rates of
return for developing countries consistently show that both private and social returns to primary
schooling are higher than at secondary and tertiary levels. Their magnitudes are generally greater
than typical returns to capital in other economic sectors” (UNESCO 2002: 34). The Global
Campaign for Education (2005: 3) argues that: “education, especially for girls, empowers
families to break the cycle of poverty for good. Young women with a primary education are
twice as likely to stay safe from AIDS, and their earnings will be 10-20 per cent higher for every
year of schooling completed. Evidence gathered over 30 years shows that educating women is
the single most powerful weapon against malnutrition – more effective even than improving food
supply. Without universal primary education, the other Millennium Development Goals –
stopping AIDS, halving the number of people living in poverty, ending unnecessary hunger and
child death, amongst others – are not going to be achieved.”
3. Limits to Applying Cost-Benefit Analysis to Guide Public Investments
While compelling for advocacy nationally and even globally, the rate of return estimates
have proven to be less useful as a guide for setting government spending priorities at the

11
aggregate level. For example, the World Bank’s Public Expenditure Reviews (PERs) are
undertaken:
“to assist the borrowers in understanding their development problems and potential solutions as
well as help illuminate the World Bank’s own country assistance strategy. One of the major
factors contributing to the success of the ensuing country lending program is therefore the quality
of analysis undertaken in the PER. In an effort to improve the treatment in PERs of human
development issues in general, and education sector issues in particular,
the Human Development Network of the World Bank has formulated guidance notes for
analyzing public expenditure in the human development sectors.”
(http://go.worldbank.org/6837YTCIR0)
When one looks at these guidance notes for education, including the section helpfully labeled,
“Bottom line: How much is enough? Is public spending adequate and sustainable?” there is no
mention of CBA.
At the micro level, the record is also, at best, mixed. Cost-benefit analysis was originally
developed to guide public investments, especially in infrastructure, that are packaged as
individual ‘projects’ which have well-defined time-bound objectives. While a great deal of
education recurrent spending goes towards salaries, much public investment for capital,
including that funded by international donors, are “projectized.”
Has CBA been used to justify these projects? The short answer is “not really.” The
World Bank, as the world’s premier investor in such projects, shows that while most have some
sort of economic justification, only 39 percent were judged “good,” and a further 35 percent
12
were judged acceptable; the remaining 26 percent were judged marginal. Only 39 percent had a
good cost-benefit analysis.
So, why has CBA, despite being so ‘naturally’ suited to guide educational investments,
not been used to inform choices? The main reason is that, while it has been relatively
straightforward to obtain estimates of the private returns to education, credible estimates of the
social returns, which are necessary for public investment analysis, remain elusive. Indeed, until
recently, education projects in developing countries were “exempt” from cost-benefit analysis
because the benefits of such projects were “social” and were considered inherently
unmeasurable. The World Bank’s Operational Policy – part of the procedures and policies
defining lending and supervision activities of the World Bank for World Bank credits – 10.04,
Economic Evaluation of Investment Operations (April 1994), states that “if the project is
expected to generate benefits that cannot be measured in monetary terms, the analysis (a) clearly
defines and justifies the project objectives, reviewing broader sectoral or economywide programs
to ensure that the objectives have been appropriately chosen, and (b) shows that the project
represents the least-cost way of attaining the stated objectives.” Besides a lack of formal cost-
benefit analysis in education projects, this exemption also meant that education projects did not
specify outcomes; it was also extremely rare to find any unit costs or quantitative analysis of
alternatives. It also led some economists to consider the sector as “soft” and to reluctance among
some finance ministers to borrow for education. While we would agree that the true benefits are
difficult to measure, it is nevertheless possible to measure them.
Aside from the inability to obtain credible and robust estimates of social returns, two
other critical constraints have prevented CBA from being a truly practical tool in public decision-

13
making. One is the CBA’s shortcomings in accounting for the diverse nature of the outcomes of
educational investments – beyond a year spent in school. And the other is the lack of evidence in
attributing outcomes to investments. We discuss the need for more progress to be made in
research in these areas.
Estimating social returns
Getting the counterfactual right. Traditional CBA assumes that the public sector is the
sole financier and provider of education. The alternative to the public investment is often
assumed to be no education at all. Therefore, the cost of the project is simply the cost of
alternative investments to education (and the cost of mobilizing public funds, although that is
often overlooked as well – see Devarajan, Squire and Suthiwart-Narueput 1997).
This simplistic assumption leads to problems in the analysis and could lead to an
overestimate of the returns to the investment. In many countries, especially beyond basic
education, the public sector is no longer a monopolist. What does this imply for CBA? At the
very least, the counterfactual needs to take the effect on the private sector into account. When
there is an active private sector, the expansion of public schools could simply draw students
away from private schools. For example, in the Philippines, the share of the public sector has
shifted from 1/3 of all secondary school students to 2/3. A recent study estimates that a project
to expand public secondary schools would lead to an increase in enrollment that was 40 to 50
percent less than might be expected because of the substitution effect away from private schools
(Jimenez and Sawada 2001). This phenomenon has spread to primary schools (see Table 1). In
Pakistan, private schools at the primary level now account for 30 percent of total enrollment

14
(Andrabi et al. 2007). In India, almost 20 percent of rural students are enrolled in private
schools, and almost 30 percent are in private schools in urban areas (Kingdon 2007).
Table 1: Private Enrollment Share, Selected Countries (%) Primary Secondary
1990 2005 Δ 1990 2005 Δ Benin 3 12 300 8 25 213 Bolivia 10 9 -14 26 16 -39 Brazil 14 10 -28 35 12 -65 Burkina Faso 9 14 56 41 39 -5 Chile 39 51 31 49 52 6 Colombia 15 19 27 39 24 -38 Eritrea 31 8 -74 11 6 -45 Indonesia 18 17 -6 49 44 -10 Jordan 23 30 30 6 16 167 Netherlands 69 69 0 83 83 0 Peru 13 16 23 15 22 47 Senegal 9 12 33 24 23 -3 South Africa 1 2 100 2 3 50 Thailand 10 16 60 16 13 -19 Togo 25 42 68 17 28 65 Tunisia 1 1 0 12 5 -58 United States 10 10 0 10 9 -10 Venezuela 14 14 0 26 25 -4 Source: UNESCO, OECD, EDSTATS
CBA also needs to estimate the “social” benefits and costs of the intervention by
accounting for externalities, redistribution and correcting for other market failures.
Accounting for Externalities. The benefits of education may extend to others beyond the
individual student. So, the true benefit from a year of education cannot be captured by the
difference in earnings as a result of that year. According to Lucas (1988), for example, a worker's
schooling enhances his or her own productivity as well as those of co-workers, thereby giving

15
rise to classical externalities or spillover effects. The general level of education in the workforce
also expands production possibilities, by facilitating the discovery, adaptation and use of more
economically rewarding, albeit technologically more demanding and knowledge-intensive,
production processes.
Besides its direct impact on economic production, education can yield other, community-
level benefits. These non-market effects include the possible contribution of education to
improving social equity, strengthening national cohesiveness, reducing environmental stress
through its effect on fertility and population growth, reducing crime rates, and so on (see Table 2
for a partial list).
Some studies have succeeded in identifying positive externalities, and have quantified
them (see Weisbrod 1964; Haveman and Wolfe 1984; Wolfe and Zuvekas 1997). If one could
include externalities to typical estimates, then social rates of return might well be higher than
private rates of return on education, perhaps more than double (Haveman and Wolfe 1984;
Wolfe and Zuvekas 1997). Rauch (1993) finds higher social returns (at 8.1 percent), compared
to private returns (4.8 percent), by comparing worker’s educational level and increases in wages
with average educational level attained in United States metropolitan statistical areas. Acemoglu
and Angrist (2000) also find higher social returns (9.1 percent versus 7.4 percent) by
instrumenting quarter of birth dummies for individual education, and compulsory school
attendance laws and child labor laws in states of birth for average education (see also Moretti
2002).

16
Table 2: Nonmarket and External Benefits of Education Benefit type Findings
Child education Parental education affects child’s educational level & achievement Child health Child’s health positively related to parental education Fertility Mother’s education lowers daughter's births Own health More education increases life expectancy Spouse’s health More schooling improves spouse’s health & lowers mortality Job search efficiency More schooling reduces cost of search, increases mobility Desired family size More schooling improves contraceptive efficiency Technological change Schooling helps R&D, diffusion Social cohesion Schooling increases voting & reduces alienation Crime Education reduces criminal activity Source: Based on and adapted from Wolfe and Zuvekas (1997)
Externalities may be generated at all levels of education, but their magnitude may differ,
implying different levels of subsidies. Many analysts would agree that lower levels of education
produce more externalities than higher levels. Literacy and other knowledge imparted at the
lower levels of education are generally seen as an effective means for achieving national identity
and cohesiveness. Unfortunately, there is very little empirical evidence on the magnitude of
externalities across education levels, though there are some intriguing new results. A one-year
rise in the average primary schooling of neighboring farmers is associated with a 4.3 percent rise
in output, compared to a 2.8 percent effect of one's own primary education in Uganda (Appleton
2000). Another study found that neighboring farmers' education raises productivity by 56
percent, while one's own education raises productivity by only 2 percent in Ethiopia (Appleton
2000); however, the 56 percent figure seems rather high. Overall, the results are inconclusive. In
India, researchers have argued that, because other members of a household benefit from having
even just one literate member who can read and write for them, the ‘true’ literacy rate is
underestimated (Basu and Foster 1998).

17
Not having information about the magnitude of externalities can lead to inconclusive
policy analysis. For example, for purely measurement reasons, most rate of return computations
obtain estimates of social rates of return that are lower than those for private returns: social and
private benefits are assumed to be the same because the former are almost impossible to
estimate; and while the private costs include only the opportunity costs of children, the social
costs are assumed to include the costs to the government as well. Taken at face value, this would
imply that education should be privately provided and, in fact, need not be subsidized at all. The
fact that the projects went ahead anyway with public funding may have been the right policy
conclusion. Nevertheless, clearly the decision did not arise from the quantitative analysis.
Estimating distributional objectives. Income redistribution and poverty reduction are by
now well-accepted social benefits (see World Bank 2006). Because it is so difficult in
developing countries to use taxes and other revenues to redistribute income, societies must use
spending to do so. Investments in education can be an important tool because it not only
redistributes present income, it redistributes the opportunity to earn over the long term.
It is difficult to capture the redistribution objective in standard cost-benefit analysis, as
shown elsewhere in this volume. The theory of how to do so has been well established for many
years. Squire and van der Tak’s (1975) pioneering work showed how the standard rate of return
formula could be adjusted with the proper distribution weights to come up with the right
magnitude. In practice, however, it has been difficult to define such weights.

18
Recent analyses of the incidence of public spending indicate that the extent to which the
social deviates from private benefits will vary by level of education. In fact, when one takes
redistribution into account, the social benefit to primary education would be boosted relative to
that of other levels of education. This point is illustrated in Table 3 which shows that the poorest
quintile in several countries do not benefit from public subsidies to tertiary education.
Table 3: Proportion of Public Subsidy Received by the Poorest Quintile by Education Level
Primary Secondary Tertiary
Colombia, 1992 39 21 5
Kenya, 1992/93 22 7 2
Ghana, 1991/92 22 15 6
Mexico, 1996 30 19 a 1
Morocco, 1998/9 17 4 2 a For junior secondary education; for senior secondary education, the proportion is 5% Source: Filmer 2003
Correcting for Market Failures. Another reason that wage differentials fail to capture the
true returns to education is because of imperfect labor markets. The screening literature, for
example, argues that the estimated earnings gains may overestimate the value of education
because these gains are not necessarily due to the added productivity of the young student but
because of the labor market values the sorting that schooling does between the highly and lowly
skilled. If so, then, correcting for such information failures may be a better investment than the
large capital and recurrent costs needed to expand a school system. This would argue for a social
benefit curve that is lower than the private one depicted in Figure 2. However, we know of no
studies in developing countries that can provide evidence of this.

19
Accounting for diverse educational outcomes
Most education projects no longer just aim to expand the number of years education,
which has been the only outcome used in most CBA. As stated earlier, many countries have
made exceptional progress in its goal of access to primary education. As projects expand their
objectives to include quality improvements and more efficient management, CBA that measures
only the returns to staying another year in school is no longer adequate.
Present techniques are ill-equipped to contend with a more diverse set of project
outcomes. In the World Bank’s assessment, only 64 percent of all project appraisal documents
included provision for testing for learning performance which was judged good. Two others (9
percent) were judged acceptable. Six projects (27 percent) were judged to be only marginal in
their arrangements for testing for learning performance. (One project financed only technical
assistance and so testing was not applicable.)
One issue is how to estimate the rate of return, not to inducing another child to stay in
school one more year, but to having that child learn more than he or she would have otherwise.
The literature on what affects learning outcomes has been fraught with many pitfalls. The role of
improved schooling, a central part of most development strategies, has become controversial
because expansion of school attainment has not guaranteed improved economic conditions. The
evidence is just beginning to be gathered. Hanushek and Woessmann (2007) review the role of
education in promoting economic well-being, focusing on the role of educational quality. They
conclude that there is strong evidence that the cognitive skills of the population – rather than

20
mere school attainment – are powerfully related to individual earnings, to the distribution of
income, and to economic growth. New empirical results show the importance of both minimal
and high-level skills, the complementarity of skills and the quality of economic institutions, and
the robustness of the relationship between skills and growth. International comparisons
incorporating expanded data on cognitive skills reveal much larger skill deficits in developing
countries than generally derived from just school enrollment and attainment. The magnitude of
change needed makes it clear that closing the economic gap with industrial countries will require
major structural changes in schooling institutions.
Glewwe and Kremer (2006) argue that schools in developing countries face significant
challenges. These include distortions in educational budgets often leading to inefficient
allocation and spending of funds; weak teacher incentives leading to problems such as high rates
of teacher absenteeism; and curriculums often focused excessively on the strongest students and
not well-matched with the typical student, especially considering the high rates of teacher and
student absenteeism. Numerous school reform initiatives have been proposed, ranging from
programs designed to strengthen links between teacher pay and performance, to reforms to
decentralize budget authority, to voucher and school choice programs. Although the evidence is
scarce on teacher incentive programs in developing countries, results from Israel suggest that
teacher incentives positively and significantly affected student education outcomes (and mainly
for weaker students). Results from Kenya suggest that teacher incentives increased teachers’
efforts on short-run outcomes (test scores) but not on stimulating long-run learning (through
changes in teacher attendance, student dropout rates, or pedagogy) (Glewwe, Ilias and Kremer
2003). Decentralization programs appear promising, but the results of decentralization policies
21
appear to be very heavily dependent on the details of implementation. Finally, a school choice
program in Colombia yielded dramatic benefits for participants (Angrist et al. 2002; Angrist,
Bettinger and Kremer 2006), but evidence from voucher programs in Chile (Hsieh and Urquiola
2006) and developed countries suggests that more research is needed to gauge the
generalizability of such program impacts.
In short, more research is needed on the effects of such initiatives, which are often the
components of education projects, on what students learn.
Attribution
Many projects seek to expand the educational system of a country. One problem is
attributing any change in outcomes to the project, as opposed to the myriad of other factors
which could lead to an expansion of enrollment. This could in principle be corrected for by
comparing expected educational outcomes in a project site with those places not included in the
project. However, it could be that the population in a project site is not strictly comparable with
those outside the project. Educational authorities, for example, could target disadvantaged areas
and this could lead to an underestimate of project benefits because the expected gain in the
project areas would be less due to the characteristics of people there.
The attribution problem can be addressed when proper impact evaluations of earlier
projects are used for prospective evaluations. This is still a work in progress. At the World
Bank, for example, only 26 per cent of all education projects approved in the 2006 fiscal year
contained evidence from, or a plan for, an impact evaluation.

22
Impact evaluations of projects and programs provide important information for decision
makers in determining how to prioritize and fund interventions (Cook 2003; Barrow and Rouse
2005). Sometimes the additional cost of doing a thorough impact evaluation is actually quite
small. When projects are results-oriented and require baseline data, an intelligently designed
initial collection of data can determine whether or not an impact evaluation will be feasible –
sometimes without any additional data collection. The main cost of a random assignment study
is the cost of collecting data, and the cost of collecting data for a bad study is just as high as
collecting data for a good one (Angrist 2004).
Critics sometimes claim that impact evaluations only tell us whether something has an
impact without telling us why and how. But a good impact evaluation can provide reliable
evidence about how the outcome is achieved when it simultaneously collects information on
processes and intermediate outcomes. Impact evaluations are not a replacement for theories,
models, needs assessments, and monitoring, all of which are needed to complement the analysis
of impact. However, it is equally true that the knowledge gained from impact evaluations is a
necessary complement to these other kinds of analyses (Savedoff and others 2005).
While policymakers are keen to know the likely impacts on student academic
achievement of various policy interventions, retrospective studies offer only limited guidance.
Even the best retrospective studies suffer from serious estimation problems, the most serious
being omitted variable bias with respect to school and teacher characteristics, unobserved child
and household characteristics that are correlated with observed school and teacher variables, and

23
measurement error in school and teacher data. This has turned attention in recent years to many
studies based on natural experiments and randomized trials.
Evidence from recent natural experiments in middle-income countries suggests that
increases in school resources (as measured by the student-teacher ratio) raise academic
achievement on reading tests (but not math tests) among black students in South Africa (Case
and Deaton 1999). Case and Deaton (1999) examined education outcomes in South Africa using
data collected in 1993, when government funding for schools was highly centralized and blacks
had virtually no political representation of any kind. The authors argue that blacks did not control
the funds provided to their children’s schools and that tight migration controls limited their
ability to migrate to areas with better schools. Studies using Israeli data indicate that reducing
class size raises reading scores and (less often) math scores (Angrist and Lavy 1999) and that
providing computers has no effect on academic performance (Angrist and Lavy 2002).
Randomized trials offer evidence from some relatively poorer developing countries as
well. In Nicaragua, workbooks and radio instruction had significant impacts on pupils' math
scores, and the impact of radio education was particularly high (Jamison et al. 1981). Provision
of textbooks raised performance on academic tests in the Philippines (Tan, Lane and Coustere
1997), but in Kenya the only effect of textbooks was among the better students (most likely
because the textbooks were too difficult for many students) (Glewwe, Kremer and Moulin 2006).
Evidence from Kenya also suggests little impact on test scores of reductions in class size
(Glewwe, Kremer and Moulin 2006), flip charts (Glewwe et al. 2004) and deworming medicine
(Miguel and Kremer 2004), although school meals were found to have positive impacts on test
scores as long as teachers were well trained (Vermeersch and Kremer 2004). A remedial

24
education program in urban India, focused on improving the learning environment in public
schools, appears to have increased test scores at a low cost (Banerjee et al. 2000).
While these natural experiments and randomized trials are beginning to build a database
of results that are less likely to suffer from the estimation problems that plague retrospective
studies, a much larger set of results is needed before they can be used in CBA and general
conclusions can be drawn for policymakers. But even, some results are evident. One
interpretation of these results is that in many developing countries, the most effective means of
improving school quality may be through addressing the problem of weak teaching. The
remedial education program in urban India, the radio mathematics program in Nicaragua, and the
computer instruction program in India all provided inputs which addressed the problem of weak
teaching, whereas programs which provided inputs that were dependent on use by the teachers
themselves (such as the flipcharts and, to some extent, the textbook program in Kenya) were less
effective.
4. Can Cost-Benefit Analysis still be a useful guide for education policy?
Given the difficulties of calculating social rates of return in education, one might be
tempted to eschew cost-benefit analysis all together. In fact, as noted earlier, some agencies
have done exactly that, by exempting education projects, say, from undergoing CBA, which
infrastructure projects go through. The argument simply is that education investments are
worthwhile to do for non-economic reasons and in that case, policy analysts need only ensure
that it is provided at least cost.

25
If CBA is narrowly construed to be rate of return or NPV calculation, then, we believe
that, for the reasons outlined earlier, it will continue to have limited applicability in real-world
policy settings for education. The empirical literature to date is simply too limited for analysts
to obtain robust estimates of social benefits. However, if CBA is defined less as an exercise to
calculate one figure, such as an IRR or NPV that is the go or no-go decision criterion, and more
as a rigorous argumentation that the benefits of an investment outweigh the costs, even if not all
of them are quantified, then they can greatly improve policy-making.
Such an analysis will be necessary to convince policy makers, especially core economic
ministries such as finance, budget or planning, to allocate the appropriate budget for education,
especially as developing countries make crucial decisions that go well-beyond expanding
primary education, where the social benefits are uncontroversial. Almost all countries recognize
the need to provide basic education for all as a sine qua non of nationhood. But the trade-offs
become more obvious as countries decide how much to invest in improving what goes on in
schools, in expanding access to secondary and even tertiary level institutions, and in rationalizing
the technical and vocational education curriculum with an academic one. In these decisions,
CBA, even if it does not produce the ‘classical’ IRR, is crucial in informing the tough choices
that policy makers need to make.
Research shows that good project economic analysis, including cost-benefit analysis, is
strongly associated with better project outcomes. In fact the quality of the cost-benefit analysis
is associated with higher quality of project outcomes. The probability of less than satisfactory
project outcomes given a poor economic analysis rating at the design stage is four times higher

26
than that for a project with good quality economic analysis (Vawda et al. 2003). Moreover, from
a political economy point of view, simply arguing that it is worthwhile to invest in education
because it is a social responsibility may not carry much weight in hard-nosed discussions with
finance and budget ministries that must make hard choices across all sectors.
Such results have prompted large institutions that finance much of education spending in
developing countries, such as the World Bank, to reevaluate the earlier exemptions against CBA
and to begin go reemphasize CBA as part of its economic analysis of projects. The economic
analysis of a project is supposed to help select and design projects that contribute to the welfare
of a country. Various tools of economic analysis help determine the economic and fiscal impact
of the project, including the impact on society and the major stakeholders involved, as well as the
project’s risks and sustainability (see Box 1)
.
Box 1: A Good Economic Analysis Answers the Questions 1. What is the objective of the project? This helps identify tools for the analysis. A clearly defined objective also helps in identifying the possible alternatives to the project. 2. What will be the impact of the project? This question concerns a counterfactual as the difference between the situation with or without the project is crucial for assessing the incremental costs and benefits of the project. 3. Are there any alternatives to the project? If so how would costs and benefits of the alternatives to achieve the same goal compare to the project in question? 4. Is there economic justification of each separable component of the project? 5. Who gains and who loses if the project is implemented? The analysis has to make sure that the most benefit accrues to the poor. 6. What is the fiscal impact of the project? 7. Is the project financially sustainable and what are the risks involved? 8. Are there any other externalities? What is the environmental impact of the project?
Source: Belli 1996

27
Even if one cannot do a CBA that produces an IRR for an entire project, it is often very
useful to do such calculations on a subset of project components where quantification is more
feasible. This type of CBA, limited though it may be, can still produce very useful practical
guidance, as shown in the Ethiopia example below. In other cases, it may be better to simply
limit oneself to cost-effective analysis, as shown in the example from the Philippines which
follows the discussion on Ethiopia.
CBA on a project component: Ethiopia
The World Bank’s Ethiopia Education Sector Development Program (ESDP) is
noteworthy for its complexity. The ESDP is an expenditure program to restructure and expand
Ethiopia's educational system, aims to improve overall educational attainment while achieving
greater social equity. Its longer-term objective is to achieve universal basic education by 2015.
The project to support it has many components, including the building, upgrading and renovation
of primary schools, curricular reform, teacher upgrading, book provision at the basic education
level. At the secondary level, the program contributes to the expansion of secondary school
facilities, curriculum revision, teacher upgrading, and instructional materials and equipment. For
technical and vocational education and training, the program supports employer and market
surveys and the encouragement of private participation. For teacher training the program
contributes to upgrading and expansion of teacher training facilities, curriculum revision,
distance education, head teacher training, and establishment of national standards. The fifth
component assists in the expansion of the tertiary sector. Finally, an institutional development
component supports planning, financial management, implementation, and monitoring and
evaluation capacities of the Ministry of Education. A comprehensive CBA of such a program

28
would not be feasible given issues pointed out in the earlier sections of estimating social returns,
the distributive effects and attribution. Moreover, the data in Ethiopia are sparse and of low
quality.
The economic analysis of this project was guided by the questions listed in Box 1. The
work included fiscal impact analysis, institutional risk analysis, analysis of alternatives, and
poverty analysis, all supported by broader country and economic work. A crucial part of the
work also includes cost-benefit analysis of one part of the project – which could have led to
different design alternatives had it not been undertaken.
One of the main activities is the building, upgrading and renovation of primary schools.
In fact, there will be 2,423 new first cycle primary schools built within walking distance of
communities. The massive civil works campaign requires the coordinated effort of planners,
educators, communities and contractors. New primary school construction alone is a costly
exercise (912 million Ethiopian Birr or US$ 325 million), representing 25 percent of the capital
expenditure of ESDP. These schools will need to accommodate the students required to enroll in
order for the project to attain the enrollment targets set in the ESDP.
To make it a good investment, the schools will have to last beyond the period of the
ESDP, so that Ethiopia can attain the goal of universal primary education by the year 2015, as set
in the Government plan. In order for schools to last, maintenance becomes an issue.
Historically, schools in Ethiopia have been built with a variety of materials, depending on local
conditions, donor involvement and community participation. During the previous regime,

29
enrollment drives necessitated the construction of chika – mud and thatch – schools, which are
quick and cheap to construct, but require heavy maintenance and in any case do not last many
years. In more recent years a variety of cheap techniques have been used in order to increase
enrollments, including open-air schools. Parents and communities do not appreciate the chika
schools, which do not resist termites and wash away in the rain. The building of chika schools
also contributes to the depletion of forests. Routine maintenance of school buildings is not a
tradition in Ethiopia. Very little maintenance and repair activities have been performed over the
years. However, it is demonstrated that the community is more interested in maintaining the
element schools because they value them more than the chika schools. Still, school committees
are not interested in maintaining schools, regardless of government proclamation. It is
necessary, therefore, that the government makes routine maintenance a priority and take
appropriate policy decisions. Any kind of chika structure requires more maintenance than
schools built by element (hollow concrete block, stone, concrete element).
Under ESDP, schools will be built by something other than chika, unless there are no
local alternatives. Chika schools are considered uneconomical and should be abandoned. But
does this make economic sense? CBA was employed to answer this question.
Household survey data was used to estimate the returns to schooling. In 1996, in
Ethiopia the returns to schooling are high. Overall, another year of schooling is associated with a
23 percent gain in earnings. Returns are high for both males and females, at 23 and 22 percent;
in rural and urban areas, at 21 and 15 percent; and by level, that is, primary, secondary and
university, at 25, 24 and 27 percent. So while these estimates might tell us that education overall

30
is a good investment in Ethiopia, they offer no guidance on what level is more appropriate, nor
do they give any guidance about the main investment objective, getting more children into
school, or more specifically what sort of buildings should be constructed.
Chika schools certainly are a cheap initial investment (Table 4). However, the
maintenance requirements are heavy and even a fully maintained chika school will not last much
longer than ten years.
Table 4: Cost Comparison of School Buildings, 1992 Birr* Capital Recurrent Life time Cost/year
Material (Investment) (Maintenance) (years) Lifetime Concrete element 213,000 2,130 40 7,455 Stone 189,284 1,893 40 6,625 Brick 170,400 5,000 30 10,680 Hollow Concrete Block 127,800 1,278 30 5,538 Chika 85,200 6,000 10 14,520 Corrugated Iron Sheet 31,950 5,000 10 8,195
The question of which technology to adopt for school buildings depends on crossover
discount rates (Hirshleifer 1958). The lower the discount rate the more attractive are materials
other than chika. Using information on construction, transportation and maintenance costs, a
cost-benefit analysis was carried out to determine which building material would be the best
choice for ESDP, assuming a 30 year time profile, so that concrete and stone involve one project,
brick and hollow concrete block involve 1.33 projects, and chika and corrugated iron sheet
involve four projects. The results of the analysis are summarized in Table 5. Fully maintained,
hollow concrete block is a much better alternative. Assuming a discount rate of 12 percent, then
the preferred investment option is hollow concrete block.

31
Table 5: Summary Cost-Benefit Analysis of School Buildings
Internal Rates of Return* Transportation Difficulties:
Cost Escalation Material Full Maintenance Half Maintenance 10% 20% 30%
Concrete element 6% 9% 7% 5% 2% Stone 8% 11% 10% 8% 6% Brick 5% 12% 10% 6% 3% Hollow Concrete Block 17% 23% 19% 14% 8% Chika (base case) (base case) (base ) (base) (base) Note: Since the estimates of the life span of school buildings is arbitrary, then it is assumed that concrete, stone, brick and concrete block buildings last for 40 years. Since stone is not transported, but only the concrete necessary, the transportation cost increases are reduced to 5, 10 and 15 percent * Internal rate of return calculations based on savings due to selection of material versus chika
However, maintenance is an issue in Ethiopia. Experience shows that school
buildings are not well maintained in Ethiopia. Chika requires heavy maintenance. There is no
indication that this will take place. Therefore, the assumption of full maintenance is not realistic.
For this reason, a sensitivity analysis considers the more realistic case that maintenance will be
less than adequate. For simplicity’s sake, half of the required maintenance is assumed to take
place. Effectively, this makes all alternative technologies preferable to chika construction.
Given the fact that parents and communities are more likely to get involved in the maintenance
of element schools, then the returns to switching to an alternative technology are likely
underestimated here. With the more realistic assumption of half maintenance, brick and stone,
and possibly concrete element, are good investments.
The choice of technology of course depends also on the availability of local materials. It
may simply not be possible to transport certain materials to remote areas. For many rural areas
there will be impossible transportation problems. In such cases there is no alternative other than

32
building with chika. In less severe cases there may be roads, but the cost of transporting
materials may be prohibitive. To examine this problem, sensitivity analysis was carried
assuming scenarios of cost escalation due to transportation difficulties using orders of magnitude
of 10 to 30 percent. The results show that even in the case of hollow concrete block there are
instances when it is not a good investment. All of the alternatives to chika have a lower present
value. However, the total undiscounted cost of using the different alternatives is different and
they have differing time profiles. Therefore, the alternative one chooses may depend on the
opportunity cost of capital. In the cases examined here, the higher the opportunity cost of capital
assumed the greater the likelihood of choosing chika over the alternative. This is because with
the chika model one is postponing investment. In other words, there is a discount rate at which
chika becomes the preferred option, despite higher undiscounted total cost or lower present value
of the alternatives. To illustrate this example, the case of chika versus hollow concrete block
(HCB) is used. The present value of the two methods, assuming half maintenance costs, is
plotted along with the associated discount rate (Figure 4). As is shown in the graph, there is a
discount rate at which building chika schools is preferred to HCB. This is known as the
crossover discount rate (Gittinger 1995), which is 23 percent in the case highlighted. This is the
same as the internal rate of return calculated for the benefits (cost-savings) stream presented
above for the case of half-maintenance, which is (hopefully) the realistic scenario.

33
Figure 4
Graphic Derivation of Crossover Discount Rate, Choice Between Chika and Hollow Concrete Block Alternatives in
Ethiopia
100,000
150,000
200,000
250,000
10 15 20 25
Discount rate(percent)
Pres
ent v
alue
(birr
)
Chika
HCBCrossover discount rate
Lose the Social Benefits: Cost-effectiveness analysis in the Philippines
Another practical method that can be used when social benefits are not estimable is to use
cost-effective analysis. Cost-effectiveness is appropriate whenever the project has a single goal
that is not measurable in monetary terms: for example, to provide education to as many children
as possible but through several interventions that simultaneously increase reading speed,
comprehension, and vocabulary, but that are not equally effective in achieving each of the goals.
Comparing among methods to achieve these aims requires that we reduce the three goals to a
single measure, for which we need some weighting scheme.

34
An example of how to apply this technique is a project in the Philippines. Concern about
high dropout rates and poor student performance in elementary schools led the Philippine
government to embark on a long-term plan for improvement. Under the 10-year Program for
Comprehensive Elementary Education Development launched in 1982, the government invested
an estimated $800 million (in 1981 prices), with support from the World Bank, in such inputs as
textbooks, equipment, resource materials, staff training and classroom facilities. In 1990, a
follow-up Bank-financed project continued support for investments totaling $410 million (1990
prices) over a-4-year period. To inform the design of the future investments, Tan, Lane and
Coustere (1995) used data generated under the previous two World Bank operations to assess the
cost-effectiveness of alternative inputs to improve student learning. The authors first estimated
the relation between selected school inputs and student learning using regression analysis, and
then estimated the costs of the relevant input. The available data permitted evaluating the
individual effects on student learning of workbooks, classroom furniture, class size, teacher
qualifications, and preschool education, controlling for variations in student's initial levels of
learning and their family background, as well as for differences in classroom and school
management practices. Simple division of the costs by the corresponding regression coefficients
gave the desired cost-effectiveness ratios.
The results showed that in this particular case smaller classes and higher teacher
qualifications had no effect on student performance, and therefore could be ruled out as priorities
for policy intervention. Three school inputs – workbooks, classroom furniture, and preschool
education – had unambiguously positive effects on learning. Because in this case preschool
education was costly, it was less cost-effective than the other two inputs.

35
5. Conclusions
We have argued that CBA is still a potentially important tool in the economists’ arsenal.
But it is essential that research especially on the social benefits of education, make further
progress if it is to be used on a day-to-day basis to calculate credible rates of return
quantitatively. To make CBA a more useful tool, we have also called for more research on the
effects of policy interventions on outcomes beyond access to a year in school and what they earn
as a result, such as on what children actually learn. Such research should focus on ensuring that
the interventions can actually be attributed to observed outcomes. This is now being done with
the push for more impact evaluation (Duflo 2004; Duflo and Kremer 2004).
In the meantime, we think that it is still worthwhile to go through the discipline of noting
the benefits and costs even if social IRR or NPVs of comprehensive education projects cannot be
calculated robustly. Research shows that projects that have some form of competently done
CBA have better outcomes than those which do not. We have given examples where CBA on
individual project components where it is feasible to estimate benefits and costs or cost-effective
analysis have made significant contributions to project design.

36
References
Acemoglu, D. and J. Angrist. 2000. “How Large Are Human Capital Externalities? Evidence
from Compulsory Schooling Laws.” NBER Macroannual.
Andrabi, T., J. Das and AI. Khwaja. 2007. “Religious School Enrollment in Pakistan: A Look at
the Data.” Comparative Education Review 51(4): 446-477.
Angrist, J.D. 2004. “American Education Research Changes Tack.” Oxford Review of Economic
Policy 20(2): 198-212.
Angrist, J. and V. Lavy. 2002. “New evidence on classroom computers and pupil learning.”
Economic Journal 112(482): 735–786.
Angrist, J. and V. Lavy. 1999. “Using Maimonides’ rule to estimate the effect of class size on
children’s academic achievement.” Quarterly Journal of Economics 114(2): 533–576.
Angrist, J. and V. Lavy. 1996. “The Effect of Teen Childbearing and Single Parenthood on
Childhood Disabilities and Progress in School.” National Bureau of Economic Research
Working Paper No. 5807.
Angrist, J., E. Bettinger, E. Bloom, E. King, and M. Kremer. 2002. “Vouchers for Private
Schooling in Colombia: Evidence from a Randomized Natural Experiment.” American
Economic Review 92(5): 1535–58.
Angrist, J., E. Bettinger, and M. Kremer. 2006. “Long-Term Educational Consequences of
Secondary School Vouchers: Evidence from Administrative Records in Colombia.”
American Economic Review 96(3): 847-862.
Appleton, S. 2000. “Education and Health at the Household Level in Sub-Saharan Africa.”
Center for International Development Working Paper No. 33. Cambridge, MA: Harvard
University.

37
Banerjee, A., S. Jacob, M. Kremer, J. Lanjouw and P. Lanjouw. 2000. “Promoting school
participation in rural Rajasthan: Results from some prospective trials.” Mimeo. MIT.
Barro, R.J. and J.-W. Lee. 2000. “International Data on Educational Attainment: Updates and
Implications.” CID Working Paper No. 42.
Barrow, L. and C. Rouse. 2005. “Causality, Causality, Causality: The View of Education Inputs
and Outputs from Economics.” Working Paper 2005-15, Federal Reserve Bank of
Chicago.
Basu, K. and J.E. Foster. 1998. “On Measuring Literacy.” World Bank Policy Research
Working Paper No. 1997.
Belli, P. 1996. Handbook on Economic Analysis of Investment Operations. Washington, DC:
World Bank.
Case, A. and A. Deaton. 1999. “School inputs and educational outcomes in South Africa.”
Quarterly Journal of Economics 114(3): 1047–1085.
Cook, T.D. 2003. “Why have educational evaluators chosen not to do randomized experiments?”
Annals of American Academy of Political and Social Science 589: 114-149.
Devarajan, S., L. Squire and S. Suthiwart-Narueput. 1997. “Beyond Rate of Return:
Reorienting Project Appraisal.” World Bank Research Observer 12(1): 35-46.
Duflo, E. 2004. “Scaling Up and Evaluation,” in F. Bourguignon and B. Pleskovic, eds.,
Accelerating Development, World Bank and Oxford University Press: Washington, DC
and Oxford.
Duflo, E. and M. Kremer. 2004. “Use of Randomization in the Evaluation of Development
Effectiveness,” in O. Feinstein, G.K. Ingram and G.K. Pitman, eds., Evaluating
38
Development Effectiveness (World Bank Series on Evaluation and Development, Vol 7),
Transaction Publishers: New Brunswick, NJ.
Filmer, D. 2003. “The incidence of public expenditures on health and education.” Background
Note for World Development Report 2004, World Bank.
Gittinger, J.P. 1995. Economic Analysis of Agricultural Projects (second edition). Baltimore:
Johns Hopkins University Press.
Glewwe, P. and M. Kremer. 2006. “Schools, Teachers, and Education Outcomes in Developing
Countries,” in E.A. Hanushek and F. Welch, eds., Handbook of the Economics of
Education, Volume 2. Elsevier.
Glewwe, P., N. Ilias and M. Kremer. 2003. “Teacher Incentives.” Poverty Action Lab Paper
No. 11.
Glewwe, P., M. Kremer, S. Moulin and E. Zitzewitz. 2004. “Retrospective vs. prospective
analyses of school inputs: The case of flip charts in Kenya.” Journal of Development
Economics 74: 251–268.
Glewwe, P., M. Kremer and S. Moulin. 2006. “Textbooks and test scores: Evidence from a
randomized evaluation in Kenya.” Mimeo. University of Minnesota and Harvard
University.
Global Campaign for Education. 2005. Missing the Mark: A School Report on Rich Countries’
Contribution to Universal Primary Education by 2015.
Haveman, R.H. and B. Wolfe. 1984. “Schooling and Economic Well-Being: The Role of Non-
Market Effects.” Journal of Human Resources 19(3):128-140.
Hirshleifer, J. 1958. “On the Theory of Optimal Investment Decision.” Journal of Political
Economy 66(4): 329-352.

39
Hsieh, C.-T. and M. Urquiola. 2006. “The effects of generalized school choice on achievement
and stratification: Evidence from Chile's voucher program.” Journal of Public Economics
90 (8-9): 1477-1503.
Jamison, D., B. Searle, K. Galda and H. Stephen. 1981. “Improving elementary mathematics
education in Nicaragua: An experimental study of the impact of textbooks and radio on
achievement.” Journal of Educational Psychology 73(4): 556–567.
Jimenez, E. and Y. Sawada. 2001. “Public for private: the relationship between public and
private school enrollment in the Philippines.” Economics of Education Review 20(4):
389-399.
Kingdon, G. 2007. “The progress of school education in India.” Oxford Review of Economic
Policy 23(2): 168–195.
Lucas, R. 1988. “On the mechanics of economic development.” Journal of Monetary Economics
22(1): 3-42.
Miguel, E. and M. Kremer. 2004. “Worms: Identifying impacts on education and health in the
presence of treatment externalities.” Econometrica 72(1): 159–217.
Mincer, J. 1974. Schooling, Experience and Earnings. New York: Columbia University Press.
Moretti, E. 2002. “Estimating the social return to higher education: evidence from longitudinal
and repeated cross-section data.” NBER Working Paper 9108, Cambridge, MA.
Perkins, D.R., S. Radelet and D.L. Lindauer. 2006. Economics of Development (6th edition).
New York: WW Norton.
Psacharopoulos, G. 1995. “The Profitability of Investment in Education: Concepts and
Methods.” Human Capital Development and Operations Policy Working Papers Number
63, World Bank, Washington DC.

40
Psacharopoulos, G. and R. Layard. 1979. “Human capital and earnings: British evidence and a
critique.” Review of Economic Studies.
Psacharopoulos, G. and H.A. Patrinos. 2004. "Returns to investment in education: a further
update." Education Economics 12(2): 111-134.
Rauch, J. 1993. “Productivity gains from geographic concentration of human capital, Evidence
from the Cities.” Journal of Urban Economics 34: 384–400.
Savedoff, W.D., R. Levine and N. Birdsall. 2005. “When Will We Ever Learn?
Recommendations to Improve Social Development through Enhanced Impact
Evaluation.” Consultation Draft, Center for Global Development, Washington, DC.
Squire, L. and H.G. van der Tak. 1975. Economic Analysis of Projects. Washington, DC:
World Bank and Johns Hopkins University Press.
Tan, J.-P., J. Lane and P. Coustere. 1997. “Putting inputs to work in elementary schools: What
can be done in the Philippines?” Economic Development and Cultural Change 45(4):
857–879.
UNESCO. 2002. EFA Global Monitoring Report 2002. Paris: UNESCO.
Vawda, A.Y., P. Moock, J.P. Gittinger and H.A. Patrinos. 2003. “Economic Analysis of World
Bank Education Projects and Project Outcomes.” International Journal of Educational
Development 23: 645-660.
Vermeersch, C. and M. Kremer. 2004. “School meals, educational attainment, and school
competition: Evidence from a randomized evaluation.” World Bank Policy Research
Working Paper WPS3523.
Weisbrod, B.A. 1964. External Benefits of Education. Princeton, NJ: Princeton University,
Industrial Relations Section.

41
Wolfe, B. and S. Zuvekas. 1997. “Non-Market Effects of Education.” International Journal of
Education Research 27(6): 491-502.
World Bank. 2006. World Development Report 2006: Equity and Development.