literature review - research
TRANSCRIPT

Literature Review Bonded interactions in silica polymorphs,
silicates, and siloxane molecules G. V. Gibbs, A. F. Wallace, D. F. Cox, R . T. Downs, N. L. Ross,
and K. M. Rosso American Mineralogist, Volume 94, 2009
The Peters Group Bryan Goldsmith

Chemical Bonds
Chemical bond is the result of the net electrostatic attraction exerted on the nuclei of a pair of atoms by the electron density accumulated between the nuclei (Feynman 1939)

The chemical bond is not a quantum mechanical observable!
Charles Coulson
“A chemical bond is not a real thing: it does not exist, no one has ever seen it, no one ever can. It is a figment of our imagination. “ (1955)
Hybridization of ethylene

• No chemical bonds, only bonded interactions (Bader 1985) • Electron density (ED) is an observable
Bader’s Model for Electron Density
Electron density embodies all the information that can be known about a ground state material, including its kinetic, potential and total energies. (Parr and Yang 1989)
‘The electron density provides a description of the distribution of charge throughout real space and is the bridge between the concept of state functions in Hilbert space and the physical model of matter in real space.’’
ˆ( ) ( )r rρ ψ ρ ψ=

Electron Density Distribution Bonded atoms are connected by well defined continuous pathways of maximum ED.
Theory of Atoms in Molecules © Copyright 1995 by Richard F.W. Bader. All rights reserved. http://www.chemistry.mcmaster.ca/aim/aim_0.html

density
Bond Paths and bridging Si-O bonded interactions for H6Si2O7
Bond Critical Point (bcp). Denote this po( ) = 0 int as cr rρ∇
Bond path: Path of maximum electron density between bonded pair
A) level line relief ED map calculated between ρ(r) = 0.0 and 0.3 a.u. (1 a.u. = 6.748 e/Å3 ).
B3LYP/6-311(2d,p) functional and basis set
B) level line contour map calculated between ρ(r) = 0.0 and 1.0 a.u. in intervals of 0.05 a.u.
• ρ(rc) = 0.136 a. u
c- ρ(r ) , bond length , strength of interaction ↑ ↓ ↑
550 a. u
160 a.u
Si
OH
OH
OH
OSi
OH
OH
OH
B)
A)
Real-space carrier of quantum mechanical exchange. (Pendas 2007 )
- Can count bond paths to find coordination number of atomrSi
ro

density
density
(a) Set of level isosurfaces of the ED distribution calculated at intervals of 0.0275 a.u. at the B3LYP/6-11(2d,p) level around one of the Si-O bridging bond paths ‘Zoom’ on to bond critical point - ρ(r) = 0.13 level (ρ(rc) = 0.136 e/Å3 ) - Single-sheeted hyperboloid around the Si-O bond path - Cylindrical distribution represents sigma-bond character
2 23
21
1( ) ( ) ( ) ( ) ( ) ( )2
( ) ( ) tr( )=
c c c ij c
c cij
ii j i
r r r r r r r H r r
r rH diagonalizex x x
ρ ρ ρ
ρ ρλ=
= + − ∇ + − −
∂ ∂=∂ ∂ ∂∑
=0
Principal components of curvature

a) O atom with the contribution of one core orbital neglected b) Isolated Si atom Cutoff at ± 15 a. u.
density
density
(1 a.u. = 24.099 e/Å5)
The Laplacian as a tool for locating Lewis acid and base sites
∇2ρ(r ) < 0 = Sink (Concentrated) Lewis Base ∇2ρ(r ) > 0 = Source (Depleted) Lewis Acid
Valence shell charge concentration (VSCC) Distance to outmost shell of local ED from nucleus For oxygen: - Outmost shell of local ED (0.66 Å) - Comparable to atomic radius (0.65 Å) (Bragg 1920) - Max radial charge density of shell (0.60 Å) (Slater 1964)
- Diffuse, low lying valence shell - Farther away from nucleus than oxygen
(Bader 1984)
Example using L(r) = –∇2ρ(r) level line relief maps for isolated oxygen and silicon

density
density
level line relief map for the H6Si2O7 molecule calculated at the B3LYP/6-311(2d,p) level in the plane containing the Si-O-Si angle. The map was cut off at ±5 a.u. level.
density
density coestite
H6Si2O7
Si-O-Si angle ~144o for O4 and H6Si2O7
- Similar ED maximum Si-O-Si angle is 180o for O1 - If H6Si2O7 has Si-O-Si 180o looks like O1
(Gibbs 2003)
Supports hypothesis that the forces that govern the structures and properties of the silica polymorphs are largely short-ranged
Zoom in local maximum ED for oxygen and compare to coestite oxygens

Lewis base sites
Oxygen atom Max ED (a.u.) <Si-O-Si
O1 7.59 180
O4 7.84 149.7
O3 7.93 144.2
O2 7.93 142
O5 7.97 136.7
Hydrogen incorporation in coestite at high temperature and pressure
H
Smyth (2006): Ad hoc electrostatic site model. Concluded O1 is most likely to be protonated ,contrary to findings of Koch-Muller et al. (2001) infrared study.
Similar trend exists in siloxane molecules Supports hypothesis that bonded interactions in siloxane molecules are similar for that of silica polymorphs
Coestite

Si-O bond critical point properties
- λ1 and λ2 (curvature) measure extent to which the ED is locally concentrated perpendicular to the bond path - λ3 measure extent to which the ED is concentrated along bond path at rc
- λ3 , great ED in atomic basis and shielding increases
λ3 e/Å5 ∇2ρ(r ) e/Å5
|λ12| = 0.5| (λ1 +λ2)|
↑

Superimposed upon the calculated data are model experimental bond critical point properties determined for stishovite with high-resolution single-crystal synchrotron diffraction data by Kirfel et al. (2001) plotted as blue circles, and model properties determined for coesite high-resolution single-crystal data by Gibbs et al. (2003b) plotted as black circles.

a) Comparison of <R(Si-O)>, the average of the two Si-O bond lengths comprising each of the nonequivalent Si-O-Si angles b) the five nonequivalent Si-O-Si angles for coesite plotted with respect to pressure. data obtained by optimizing the coesite structure as a function of pressure red symbols, represent experimental data determined by Levien and Prewitt (1981) blue ones, represent experimental data determined by Angel et al. (2003) : Si-O1 bonded interactions : Si-O2 bonded interactions : Si-O3 bonded interactions : Si-O4 bonded interactions Si-O5 bonded interactions.
Geometry optimized bond lengths and angles for coestite compared to experiment bond values as a function of pressure
,
, ,
,◊ ◊

Siloxane molecules and silicates
The ρ(rc) values calculated for silicate crystals (diamonds) and the model experimental ρ(rc) values determined for coesite (solid triangles) and stishovite (solid squares), plotted with respect to the Brown and Shannon (1973) empirical bond strength, s, calculated with the experimental Si-O bond lengths (Gibbs et al. 2004).
density y
Empirical bond strength
ρ(rc) (e/Å3)
4.5[( ( ) /1.625]s R Si O= −
Correlation for empirical bond strength of Si-O in silicates
Brown and Shannon (1973)

Comparison of the bond critical point properties calculated for silicate crystals (open red squares) with the bond critical point properties calculated for a variety of geometry optimized siloxane molecules (blue spheres).
Comparison of the bond critical point properties calculated for silicate crystals
Hquarts Si-O = 467 kJ/mol HH2Si2O7 Si-O = 462 kJ/mol
λ3 e/Å5 ∇2ρ(r ) e/Å5
Similar ED distribution between coestite and H2Si2O7
Molecules, (cluster models) are well suited to study larger silica system
Conclusion
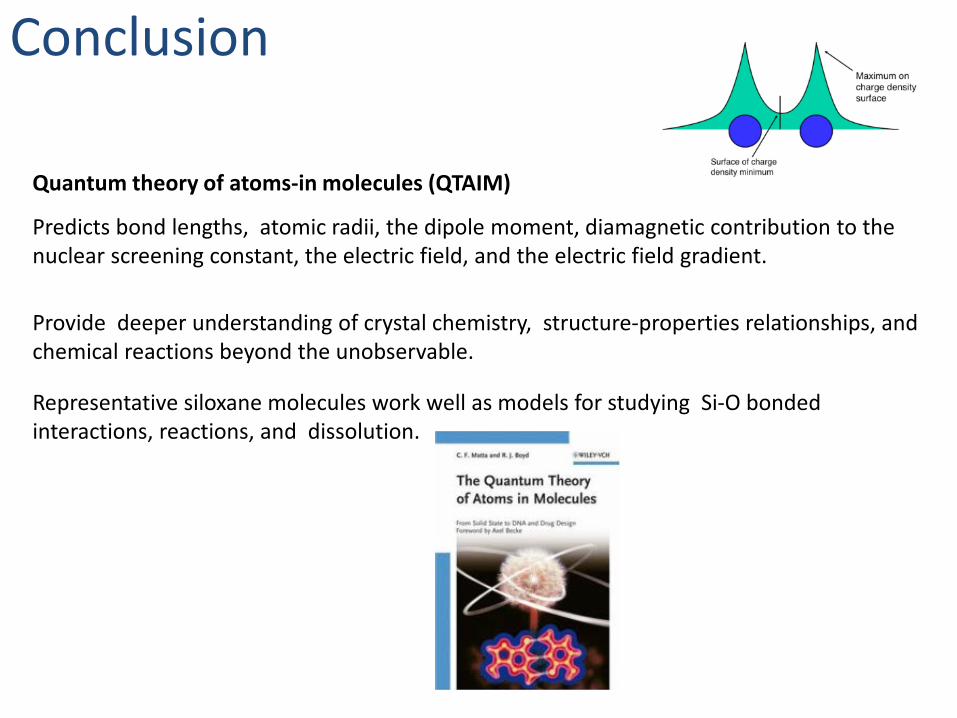
Provide deeper understanding of crystal chemistry, structure-properties relationships, and chemical reactions beyond the unobservable.
Predicts bond lengths, atomic radii, the dipole moment, diamagnetic contribution to the nuclear screening constant, the electric field, and the electric field gradient.
Quantum theory of atoms-in molecules (QTAIM)
Representative siloxane molecules work well as models for studying Si-O bonded interactions, reactions, and dissolution.