listed infrastructure
TRANSCRIPT

Listed Infrastructure:A Secular Investment OpportunityAn Emerging Asset Class
Listed infrastructure is a compelling way to invest in a rapidly growing sector of the global economy, combining the attributes of private infrastructure investments with the benefits of liquidity, transparency and daily market pricing. Institutional investors are increasingly making allocations to listed infrastructure, typically as a carve-out from global equities or within their alternatives portfolios.
Drawing on our research and the support of two case studies, we explore the macro themes driving infrastructure investment in developed and emerging economies. We then compare and contrast listed infrastructure to global equities and to their direct infrastructure counterparts. We conclude that listed infrastructure should be recognized separately within an asset allocation framework—either as a standalone allocation or as a complement to direct infrastructure investments in an alternatives portfolio.
cohenandsteers.com
Table of ConTenTsThe Global Opportunity for Infrastructure Investment ........... 2
A Case for Listed Infrastructure ........ 7
Listed Infrastructure as a Direct Investment Complement .................. 16
Case Study 1 .......................................... 20
Case Study 2 .......................................... 22
Conclusion ............................................. 24

Cohen & Steers Global Listed Infrastructure
2
exhibit 2. iNFRAStRUCtURe iNveStmeNt CApitAl AS A peRCeNt OF GDp hAS beeN DeCliNiNG
as of December 31, 2009.source: Goldman sachs. note: Gross fixed capital formation was used as a proxy for infrastructure spending.
The Global opportunity for Infrastructure Investment
The fundamental case for infrastructure spending—massive global investment needed for both critical upgrades to existing networks in developed countries and to address powerful demographic trends in developing regions—is becoming more widely appreciated and understood. With governments around the world facing operating deficits and unsustainable debt-to-GDP ratios, private capital is gaining importance as part of the financing solution.
The massive global infrastructure investment opportunity is driven by two distinct trends: • Developed markets face the daunting task of replacing and upgrading their
antiquated infrastructure networks (roads, bridges, electricity and water transmission, etc.).
• Emerging economies face critical investment needs to support profound demographic changes—population growth, urbanization and rising standards of living.
On a global basis, the total price tag is expected to surpass $40 trillion by the year 2030. Importantly, government balance sheets are stretched and will rely increasingly on the private sector to fund these critical investments. We have already seen over the past 12 months a significant increase in infrastructure privatization announcements by governments. These announcements have come from a cross-section of the many businesses that comprise the infrastructure asset class, such as those listed in Exhibit 1.
exhibit 1. iNFRAStRUCtURe SUbSeCtORS iN DevelOpeD AND emeRGiNG eCONOmieS
Transportation Energy Utilities Communications
Toll Roads storage and Transportation electric Utilities Wireless Towersairports Renewable energy Gas Utilities satellite services
Marine Ports Water
(1) oeCD is the orginisation for the economic Co-operation and Development.
Global infrastructure capital investment could surpass $40 trillion by 2030.
Developed Markets: A History of UnderinvestmentDeveloped economies suffer from massive underinvestment in their infrastructure systems. Over the last 50 years, the world has seen a steady decline of infrastructure spending as a percentage of GDP. Exhibit 2 below shows this trend for the OECD(1) countries.
Developed economies suffer from massive underinvestment in infrastructure.
15%
20%
25%
30%
20092002199519881981197419671960

cohenandsteers.com cohenandsteers.com3
exhibit 3. iNFRAStRUCtURe SUbSeCtORSpoor Grades from the American Society of Civil engineers
Subject2009
Grade Comments
aviation D airports will face the challenge of accommodating increasing numbers of regional jets and new super-jumbo jets.
bridges C It will cost $9.4 billion a year for 20 years to overhaul the nation’s 160,000 deficient bridges.
Dams D More than $10 billion is needed over the next 12 years to address all critical non-federal dams.
Drinking Water D- america faces a shortfall of $11 billion annually to replace aging facilities and comply with safe drinking water regulations.
energy (national grid)
D+ Growth in electricity demand and investment in new power plants has not been matched by investment in new transmission facilities.
navigable Waterways
D- a single barge traveling the nation's waterways can move the same amount of cargo as 58 semi-trucks—at 1/10 the cost. but almost 50% of the 257 locks operated by the U.s. army Corps of engineers are functionally obsolete. It will cost up to $125 billion to replace the present system.
Rail C- The freight railroad industry needs to spend $175–$195 billion over the next 20 years to maintain existing infrastructure and expand for freight growth.
Roads D- Poor road conditions cost U.s. motorists $54 billion a year in repairs and operating costs—$275 per motorist. americans spend 3.5 billion hours a year stuck in traffic, at a cost of $63.2 billion annually to the economy.
Transit D Transit use increased faster than any other mode of transportation—up 21% between 1993 and 2002— as federal investment during this period stemmed the decline of existing transit infrastructure. but reduced federal spending in real dollars since 2001 threatens this turnaround.
U.S. Infrastructure G.P.A. = D
A = exceptional B = Good C = Mediocre D = Poor F = failing
Total Investment Needs = $2.2 Trillion(1)
as of December 31, 2009.source: american society of Civil engineers (asCe).(1) estimated five-year need—does not include security investment needs.each category was evaluated by asCe on the basis of condition and performance, capacity vs. need, and funding vs. need.
The United States, for example, consistently scores very poorly in terms of the quality of its infrastructure assets.
Correcting the “D” grade on the quality of U.S. infrastructure assets could require a $2.2 trillion capital investment.
(2) source: Citigroup Global Markets as of 12/31/2010.
Global investment requirements in the utility sector alone are staggering. It has been estimated that European utilities will spend nearly $1.3 trillion between 2010 and 2020(2) as they respond to government-imposed environmental regulations and the need to embark on a large-scale asset replacement cycle. Importantly, in regions and subsectors where we have seen underinvestment, the supply-and-demand balance for infrastructure services can be tight, leading to rising returns on capital for existing assets. Increasing environmental and zoning restrictions, coupled with inflationary pressures, could further strengthen returns and the underlying value of existing assets.

Cohen & Steers Global Listed Infrastructure
4
Emerging Markets: Demographic Shifts Drive Infrastructure Investment Several powerful demographic trends—particularly urbanization and rising standards of living—are driving a significant increase in infrastructure spending in the developing world. Exhibit 4 clearly illustrates this trend in the BRIC countries (Brazil, Russia, India and China), through a long-term comparison of historical and projected disposable income for these regions, relative to developed economies. The wide-sweeping effects of rising incomes are transforming modes of transportation, with car ownership and air travel becoming more prevalent and in line with greater personal wealth.
exhibit 4. iNCOmeS ARe RiSiNG At A FASteR pACe iN emeRGiNG mARketSDisposable income Over $10,000
as of March 2010.source: U.s. Census bureau.
0
50
100
150
200
250
300
350
400
2019E2017E2015E2013E2011E2009E200720052003200119991997199519931991
Euro AreaUnited StatesBRIC
Num
ber o
f Hou
seho
lds (
in m
illio
ns)
Urbanization and rising standards of living are driving infrastructure spending in emerging economies.
Relative to developed economies, there is still a significant disparity in the access of emerging economies to basic infrastructure services.
But today, there is still an enormous disparity in access to basic services—water, electric power, roads and vehicles—in emerging relative to developed economies. In Exhibit 5 on the following page, we compare such access in the U.S. to that in Europe, Japan and the four BRIC nations—with all data indexed to U.S. levels (U.S.=100) in each infrastructure service category. In India, for example, we show that the number of passenger vehicles per capita amounts to just 2% of the vehicles per capita in the U.S.

cohenandsteers.com cohenandsteers.com5
exhibit 5. ACCeSS tO iNFRAStRUCtURe SeRviCeS by COUNtRy
Data Indexed to U.S. = 100
Passenger Vehicles
Road Network Length
Hospital Beds
Rail Line Length
Telephone Subscribers
Internet Users
Air Transport
PassengersElectricity
Consumption
Improved Sanitation Facilities
U.s. 100 100 100 100 100 100 100 100 100
eU3(1) 85 45 104 64 120 88 53 52 100
Japan 87 42 156 24 89 94 32 61 100
Russia 34 30 129 101 104 29 9 45 87
brazil 25 43 32 24 60 48 10 15 77
China 4 12 30 8 50 22 6 15 65
India 2 13 20 9 17 10 2 4 28
Per Capita Km/Capita Per Capita Km/Capita Per Capita Per Capita Per Capita Kwh Per Capita
Population % With access
as of December 31, 2010. source: Goldman sachs.(1) average of eU3. eU3 = Germany, france and the United Kingdom.
exhibit 6. URbANizAtiON iS DRiviNG emeRGiNG mARket GROwthpercentage of Urban population
as of December 31, 2010.source: Morgan stanley Research, UnPD.
0%
20%
40%
60%
80%
100%
20502040203020202010200019901980197019601950
Germany JapanUnited StatesEmerging Markets
ProjectedActual
A $300 billion market-cap opportunity in emerging markets:
• spread across 14 countries
• a universe of approximately 85 companies
• subsectors that include utilities, pipelines, water companies, towers, toll roads, airports and marine ports
Exhibit 6 compares the percentage of total population living in cities, looking back to 1950 and projecting to 2050. The projections show a much faster pace of urban growth in emerging markets.

Cohen & Steers Global Listed Infrastructure
6
Governments Turn to the Private Sector Historically, governments have played a major role in financing infrastructure. But with the impact of the global recession, unfolding sovereign debt concerns and resulting financial constraints, they are relying more and more on private capital to drive infrastructure investments. Exhibit 7 shows the deteriorating trend in developed market balance sheets, with average debt/GDP rising from about 78% to roughly 100% since 2008.
exhibit 8. ReCeNt ANNOUNCemeNtS tO pRivAtize GOveRNmeNt iNFRAStRUCtURe ASSetS
Date Country Target Amount Infrastructure-Related Assets for Sale
6/2/2009 australia (Queensland) a$15.0b Rails, ports, forestry10/12/2009 United Kingdom £16.0b Rails, aviation, postal assets3/16/2010 Portugal €6.0b Transport, energy, communications, mining7/14/2010 lithuania $6.6b energy,transport, industrials7/23/2010 Ireland not disclosed airports, rails, ports, utilities9/30/2010 Greece €3.0b Railways, water companies, marinas, airports, other infrastructure10/1/2010 India $8.9b shipping, oil, coal10/6/2010 france not disclosed Regional airports10/26/2010 Turkey $5.0b bridges, toll roads11/17/2010 Russia $31.9b oil, rails, airlines, shipping, utilities11/30/2010 India not disclosed shipping, oil, coal12/1/2010 spain €9.0b airports1/26/2011 new Zealand nZ$6.8b energy, transport
as of January 31, 2011.source: Cohen & steers.
exhibit 7. GOveRNmeNt Debt AS A peRCeNt OF GDp1980–2011
as of December 31, 2010.source: Goldman sachs.
Emerging MarketsDeveloped Markets BRICs
0%
20%
40%
60%
80%
100%
120%
2010200820062004200220001998199619941992199019881986198419821980
As a result, governments around the world are also turning to infrastructure asset sales to recapitalize their own stretched balance sheets. Whereas the private sector went through the recapitalization process in 2008–2009, the public sector is still in the early stages of deleveraging. On a global basis, municipal, state and federal governments have specifically targeted the sale of infrastructure assets. Exhibit 8 below highlights a handful of the many announced privatization programs.
Governments are selling infrastructure assets as a means of contributing to the paydown of sovereign debt.

cohenandsteers.com cohenandsteers.com7
Listed companies, with their improved balance sheets and broad access to the capital markets, are in a strong position to help finance these privatizations. Importantly, governments understand that management teams will show discipline when it comes to capital allocation—only investing in projects with reasonable allowed rates of return and adequate regulatory transparency.
a Case for listed Infrastructure
The characteristics that support the investment case for infrastructure also contribute to their low correlation with broader equity and fixed income markets. Infrastructure businesses are usually regulated and monopolistic, leading to relatively stable and predictable revenues and cash flows that are often linked to inflation. We explore each of these characteristics below.
Unique Business CharacteristicsInfrastructure companies generally benefit from four characteristics, which can contribute to their stable income and growth:
• Long-lived assets—electrical grids, natural gas pipelines, water treatment plants, toll roads and wireless towers are just a few infrastructure assets with long life spans and stable cash flows.
• High barriers to entry—strict zoning restrictions and large capital requirements make it difficult or prohibitive for competitors to enter the market.
• Monopolistic structure—infrastructure companies are often regulated with minimal competition. It’s important to note that regulation cuts both ways—while clear regulatory frameworks enhance the predictability of cash flows and can lower a company’s financial risk profile, that same company can be targeted by austerity measures in a less stable and unpredictable regulatory and political environment (particularly during periods of strained economic conditions).
• Inelastic demand—infrastructure provides essential services that tend to be resistant to economic downturns.
Furthermore, private-sector infrastructure capital investment tends to be relatively insulated from economic cycles. In fact, as we have seen recently, it tends to rise in times of economic difficulty. Infrastructure companies generally remain near the top of the pecking order in terms of access to capital, given their relatively strong balance sheets, predictable cash flows and regulated business models. Utilities, for example, were successful in issuing significant amounts of both debt and equity in 2009, when access to capital was limited for most companies.
As a result of these characteristics, infrastructure as an asset class has shown lower volatility and low long-term correlations relative to other asset classes—particularly in the period preceding the global financial crisis.
Infrastructure assets tend to be long-lived, with high barriers to entry, monopolistic structures and inelastic demand.
Historically, infrastructure capital spending has been relatively insulated from economic cycles.

Cohen & Steers Global Listed Infrastructure
8
Exhibit 9 below shows the correlations between infrastructure and other asset classes based on an index of companies we believe best represent the asset class. As a proxy for infrastructure, Cohen & Steers identified an infrastructure universe (the “Infrastructure Universe”) that included 350 companies. Ned Davis then created an equal-weighted index based on this universe in the subsectors listed below.
exhibit 9. ASSet ClASS CORRelAtiONS
March 31, 1995–December 31, 2007
Assets Infrastructure Equity Bonds REITs Commodities Gold
Infrastructure 1.00Equity 0.68 1.00Bonds 0.28 0.05 1.00REITs 0.58 0.34 0.19 1.00Commodities 0.09 -0.05 0.14 0.02 1.00Gold 0.33 0.16 0.43 0.18 0.33 1.00
March 31, 1995–February 28, 2011
Assets Infrastructure Equity Bonds REITs Commodities Gold
Infrastructure 1.00Equity 0.77 1.00Bonds 0.35 0.18 1.00REITs 0.58 0.54 0.21 1.00Commodities 0.29 0.21 0.12 0.18 1.00Gold 0.27 0.14 0.50 0.09 0.25 1.00
as of february 28, 2011.source: ned Davis Research.Past performance is no guarantee of future results. equity is represented by the MsCI World (net) Index; bonds are represented by the barclays Capital aggregate Global bond Index; ReITs are represented by the fTse naReIT all ReIT Index; Commodities are represented by the s&P GsCI® (Commodities Index); Gold is represented by the CoMeX Gold spot Price. see index definitions on page 25.
Historically, global infrastructure has shown a low correlation to other asset classes.
The elevated correlations between listed infrastructure and broad equities during the credit crisis resulted from: 1) the decline of infrastructure asset values given the high cost and low availability of debt (which had a significant impact, given higher-than-average leverage in the asset class) and 2) higher correlations across all risky asset classes, which was macro driven.
With meaningful deleveraging over the past three years, we expect that the key characteristics of infrastructure (largely regulated assets that provide stable, visible and often inflation-linked cash flows) will lead the sector to behave once again like a distinct asset class. We believe correlations with other asset classes will fall. The trend may be furthered by the increasing adoption of security structures focused on income delivery (see page 15). As Exhibit 10 shows, we have already begun to see evidence of declining correlations.
Transportation Energy Utilities CommunicationsToll RoadsAirportsMarine Ports
Storage and TransportationRenewable Energy
Electric UtilitiesGas UtilitiesWater
Wireless TowersSatellite Services
See page 25 for more information on the Infrastructure Universe.
Based on our findings, listed infrastructure before the crisis was only moderately correlated with global equities, but showed very little correlation to bonds and commodities.

cohenandsteers.com cohenandsteers.com9
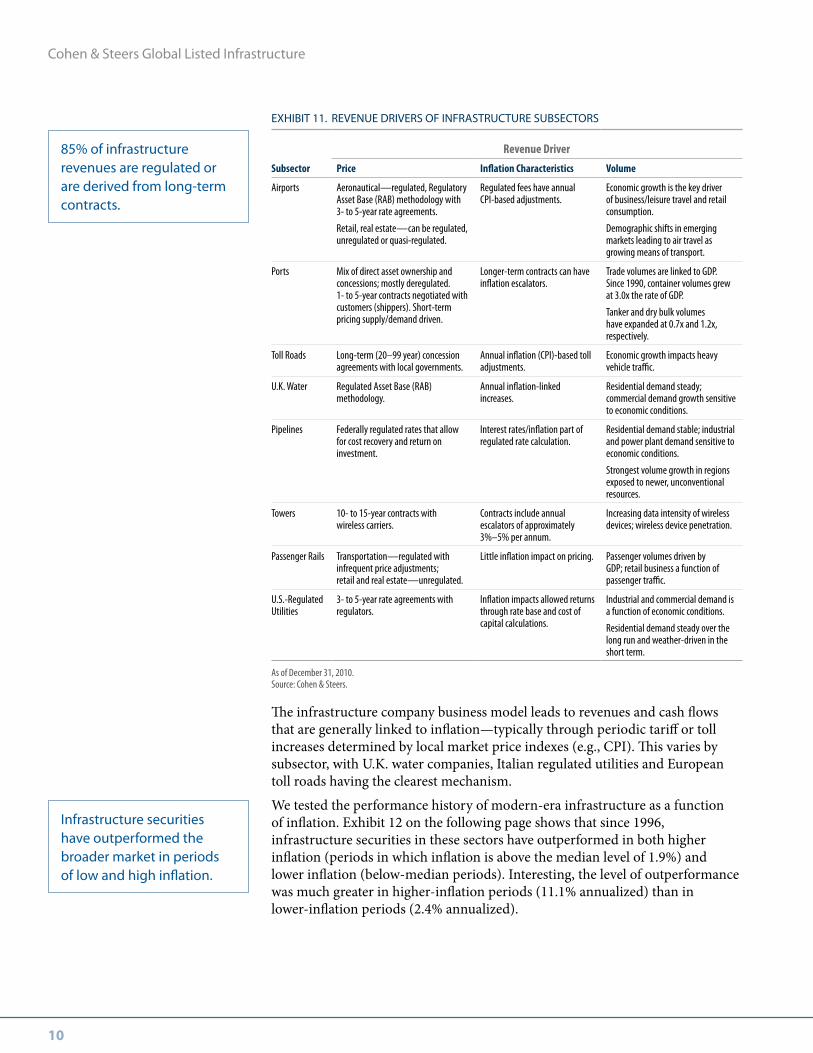
Revenue Streams Are Contracted and Often Linked to InflationStable and visible cash flows are a hallmark of infrastructure companies. The contractual nature of their revenues and the ability to pass on higher costs allow infrastructure companies to maintain real revenue growth and enhance the likelihood of long-term outperformance and inflation protection.
More than 75% of the cash flows generated by the companies in our universe are derived from regulated businesses. If we include cash flows supported by long-term contracts, more than 85% of cash flows have the attribute of greater predictability.
Revenues and cash flows are generally a function of two drivers—price and volume.
• Prices are a function of the regulatory or concession framework and typically have periodic inflation-linked adjustments.
• Volume tends to be a function of a region’s underlying economic conditions (GDP, etc.). In Exhibit 11, we outline the revenue drivers for several important infrastructure subsectors.
Stable and visible cash flows are a hallmark of infrastructure companies.
exhibit 10. CORRelAtiON OF iNFRAStRUCtURe SeCURitieS with GlObAl eqUitieSmSCi world (net) index Rolling One-month periods, 1999–2011
as of february 28, 2011.source: ned Davis Research.Past performance is no guarantee of future results. Infrastructure is represented by the Infrastructure Universe described in the index definitions on page 25. Global equities are represented by the MsCI World (net) Index. see index definitions on page 25.
0.00.10.20.30.40.50.60.70.80.91.0
201020092008200720062005200420032002200120001999
0.73
Pre-Crisis Average1999–2007 = 0.67
Crisis Average2008–2009 = 0.87
Cohen & Steers Global Listed Infrastructure
10
The infrastructure company business model leads to revenues and cash flows that are generally linked to inflation—typically through periodic tariff or toll increases determined by local market price indexes (e.g., CPI). This varies by subsector, with U.K. water companies, Italian regulated utilities and European toll roads having the clearest mechanism.
We tested the performance history of modern-era infrastructure as a function of inflation. Exhibit 12 on the following page shows that since 1996, infrastructure securities in these sectors have outperformed in both higher inflation (periods in which inflation is above the median level of 1.9%) and lower inflation (below-median periods). Interesting, the level of outperformance was much greater in higher-inflation periods (11.1% annualized) than in lower-inflation periods (2.4% annualized).
Infrastructure securities have outperformed the broader market in periods of low and high inflation.
85% of infrastructure revenues are regulated or are derived from long-term contracts.
exhibit 11. ReveNUe DRiveRS OF iNFRAStRUCtURe SUbSeCtORS
Revenue Driver
Subsector Price Inflation Characteristics Volume
airports aeronautical—regulated, Regulatory asset base (Rab) methodology with 3- to 5-year rate agreements.
Retail, real estate—can be regulated, unregulated or quasi-regulated.
Regulated fees have annual CPI-based adjustments.
economic growth is the key driver of business/leisure travel and retail consumption.
Demographic shifts in emerging markets leading to air travel as growing means of transport.
Ports Mix of direct asset ownership and concessions; mostly deregulated. 1- to 5-year contracts negotiated with customers (shippers). short-term pricing supply/demand driven.
longer-term contracts can have inflation escalators.
Trade volumes are linked to GDP. since 1990, container volumes grew at 3.0x the rate of GDP.
Tanker and dry bulk volumes have expanded at 0.7x and 1.2x, respectively.
Toll Roads long-term (20–99 year) concession agreements with local governments.
annual inflation (CPI)-based toll adjustments.
economic growth impacts heavy vehicle traffic.
U.K. Water Regulated asset base (Rab) methodology.
annual inflation-linked increases.
Residential demand steady; commercial demand growth sensitive to economic conditions.
Pipelines federally regulated rates that allow for cost recovery and return on investment.
Interest rates/inflation part of regulated rate calculation.
Residential demand stable; industrial and power plant demand sensitive to economic conditions.
strongest volume growth in regions exposed to newer, unconventional resources.
Towers 10- to 15-year contracts with wireless carriers.
Contracts include annual escalators of approximately 3%–5% per annum.
Increasing data intensity of wireless devices; wireless device penetration.
Passenger Rails Transportation—regulated with infrequent price adjustments; retail and real estate—unregulated.
little inflation impact on pricing. Passenger volumes driven by GDP; retail business a function of passenger traffic.
U.s.-Regulated Utilities
3- to 5-year rate agreements with regulators.
Inflation impacts allowed returns through rate base and cost of capital calculations.
Industrial and commercial demand is a function of economic conditions.
Residential demand steady over the long run and weather-driven in the short term.
as of December 31, 2010. source: Cohen & steers.

cohenandsteers.com cohenandsteers.com11
exhibit 13. hiStORiCAl vOlAtility AND RiSk-ADjUSteD RetURNSmarch 31, 1995–january 31, 2011
Total Return Standard Deviation Sharpe Ratio
Infrastructure 13.6% 14.1% 0.74
Global equities 6.3% 15.9% 0.19
as of December 31, 2010. source: ned Davis Research.Past performance is no guarantee of future results. Infrastructure is represented by the Infrastructure Universe described in the index definitions on page 25. Global equities are represented by the MsCI World (net) Index. see index definitions on page 25.
Quantifying VolatilityThe relatively predictable and stable cash flows of infrastructure companies generally lead to lower volatility of returns compared with the broad equity markets. Exhibit 13 below shows that the 13-year historical average standard deviation of returns for infrastructure securities is 14.1%, versus 15.9% for the broad equity market. Additionally, relative risk-adjusted returns have been exceptionally strong, with an infrastructure Sharpe ratio of 0.74, versus 0.19 for the MSCI World (net) Index over the same period.
exhibit 12. exCeSS tOtAl RetURN peRFORmANCe OF iNFRAStRUCtURe vS. GlObAl eqUitieS january 1996–january 2011
as of January 31, 2011.source: Cohen & steers, ned Davis Research.Past performance is no guarantee of future results. Infrastructure is represented by the Infrastructure Universe described in the index definitions on page 25. Global equities are represented by the MsCI World (net) Index. see index definitions on page 25.
-5%
0%
5%
10%
15%
20%
Higher Inflation Lower Inflation
MSCI World (net) Index Total Return Infrastructure Total Return
While there is typically a lag between realized inflation and actual tariff increases, these results make intuitive sense as investors are likely to act coincidently with inflation, but the stocks will discount in advance of the ensuing positive tariff news.
The volatility of infrastructure company returns has generally been lower than that of broad equity markets.
Infrastructure outperformed by 2.4%
Infrastructure outperformed by 11.1%

Cohen & Steers Global Listed Infrastructure
12
Including such peripheral sectors would likely lead a portfolio to be more cyclical and more highly correlated with the broader equity markets—two characteristics core infrastructure investors seek to avoid.
We have also analyzed trends in volatility over time. Our research demonstrates that infrastructure volatility has consistently been at or below that of the global equity markets, and that current volatility has fallen to pre-credit crisis levels.
exhibit 14. SeCtOR COmpARiSON OF betAS: 10-yeAR AveRAGeFebruary 28, 2001–February 28, 2011
as of february 28, 2011.source: ned Davis Research.Median beta for Infrastructure (core) is based on a north american subset of the Infrastructure Universe described on page 25. Median betas for other groups are based on medians for the companies in each GICs classification.
0.0
0.5
1.0
1.5
2.0
Construction and Engineering
Core Infrastructure Oil & Gas Exploration and Production
Materials
0.61
1.31 1.301.09
We have observed that the greater the company’s focus on “core” infrastructure, the lower the volatility of its cash flows and stock-price performance.
The varying degrees of sensitivity to credit market and economic conditions creates opportunity for active managers.
Importantly, while the listed infrastructure asset class as a whole is less volatile than the broader equity markets, each infrastructure subsector has a varying degree of sensitivity to credit market and economic conditions. Accordingly, subsector price performance can vary significantly over time, which creates opportunities for active managers who understand the macro drivers of infrastructure businesses.
The most extreme example of this performance variability occurred in 2008, when global marine ports fell 62%, representing the worst-performing infrastructure subsector, while the defensive regulated utilities subsector fell only 20%. This makes sense: with the shortest contracts of any infrastructure subsector and dependence on global trade, ports were the most sensitive to rapidly deteriorating global economic conditions. As the global economy rebounded in 2009, that trend reversed, with marine ports rising 96% and regulated utilities, the most defensive subsector, up just 11%.
As we further evaluate these subsectors, we have observed that the greater the focus on “core” infrastructure—owners and operators of infrastructure assets— the lower the volatility of cash flows and returns. Some infrastructure managers have an extremely broad definition of the sector, sometimes including materials, engineering and construction and mining components. Using a universe of North American companies, Exhibit 14 shows the higher betas of these sectors relative to “core” infrastructure over the past 10 years.

cohenandsteers.com cohenandsteers.com13
Infrastructure volatility has consistently been below that of global equity markets.
We also evaluated historical volatility on a regional basis, and most countries showed the same pattern of volatility, returning to pre-crisis levels. Notably, and as expected given continued sovereign-debt concerns, Spain stands out as a market with significant listed infrastructure securities. As shown in Exhibit 16, volatility remains above historical levels.
exhibit 15. GlObAl iNFRAStRUCtURe COmpANieS: ROlliNG 30-DAy vOlAtility2001–2011
as of february 18, 2011.source: ned Davis Research.Past performance is no guarantee of future results. Infrastructure is represented by the Infrastructure Universe described in the index definitions on page 25. Global equities are represented by the MsCI World (net) Index. see index definitions on page 25.
0%
20%
40%
60%
80%
20112010200920082007200620052004200320022001
Volatility has returned to “pre-crisis”
levels
exhibit 16. SpANiSh iNFRAStRUCtURe COmpANieS: ROlliNG 30-DAy vOlAtility2001–2011
as of february 16, 2011.source: ned Davis Research.Past performance is no guarantee of future results.spain’s infrastructure companies represented in the above chart comprise that country’s representation in the Infrastructure Universe described in the index definitions on page 25.
0%
20%
40%
60%
80%
100%
20112010200920082007200620052004200320022001
Volatility remains above
“pre-crisis” levels
Pre-Crisis Average Volatility = 15%
Pre-Crisis Average Volatility = 9%

Cohen & Steers Global Listed Infrastructure
14
exhibit 17. beNeFitS OF iNCReASiNG A GlObAl iNFRAStRUCtURe SeCURitieS AllOCAtiON10 years ended February 28, 2011
Annualized Return 5.64% 5.89% 6.12%Cumulative Return 71.51% 75.59% 79.26%Standard Deviation 12.73% 12.65% 12.56%
20%
10%
20%
10%
5%
25%
10%23%
10%
22%
10%
5%
25%
5%
U.S. Large Cap Equities U.S. Small Cap Equities International Equities Global Bonds
Developed Real Estate Securities Infrastructure Securities Cash
25%
10%
25%
10%5%
25%
Performance Summary for BenchmarksIndexes 1 Year 3 Years 5 Years 10 Years
barclays Capital aggregate Global bond Index 5.84% 4.48% 6.64% 6.75%Citigroup 3-Month T-bill Index 0.26% 0.57% 2.19% 2.17%fTse ePRa/naReIT Developed Index 29.25% -1.17% 1.97% 10.13%MsCI eafe Index 20.54% -2.14% 2.91% 5.34%Russell 2000 Index 32.60% 7.80% 3.80% 7.06%s&P 500 Index 22.58% 2.20% 2.87% 2.62%Ubs Global 50/50 Infrastructure & Utilities Index 16.44% -3.20% 5.25% 8.66%
as of february 28, 2011.source: barclays, Citigroup, Cohen & steers, fTse, MsCI, Russell & Company, standard & Poors.Past performance is no guarantee of future results. Global bonds are represented by the barclays Capital aggregate Global bond Index; Cash is represented by the Citigroup 3-Month T-bill Index; Developed Real estate securities are represented by the fTse ePRa/naReIT Developed Real estate Index; International equities are represented by the MsCI eafe Index; small Cap U.s. equities are represented by the Russell 2000 Index; large Cap equities are represented by the s&P 500 Index; Infrastructure securities are represented by the Ubs Global 50/50 Infrastructure & Utilities Index. see index definitions on page 25.
10% Infrastructure0% Infrastructure 5% Infrastructure
U.S. stocks, global stocks, bonds, developed real estate securities, infrastructure securities and cash are represented by the indexes listed in the chart below.
Adding an allocation to listed infrastructure over the past decade has increased returns with slightly less volatility.
To illustrate how an allocation to global infrastructure can enhance returns, without adding to risk, we analyzed the risk/return profiles of three portfolios with increasing allocations to infrastructure securities. For the 10 years ended December 31, 2010, a portfolio with a 10% allocation to infrastructure would have returned 0.48% more per year than a portfolio with no allocation to this sector. Volatility, as measured by standard deviation, would have decreased slightly.

cohenandsteers.com cohenandsteers.com15
• In November 2010, several large institutions announced the formation of a new U.S.-based energy transmission and distribution real estate investment trust (REIT). The trust—the first of its kind dedicated to energy networks (electricity transmission wires and natural gas pipelines)—provides a tax-efficient method of investing in infrastructure assets and will pay out nearly all of its taxable income to investors.
• In March 2011, Hong Kong-based conglomerate Hutchinson Whampoa spun off several of its mature marine port assets into a Singapore-listed business trust. This structure will allow the company to distribute a high percentage of cash flows, with a dividend yield likely two times higher than its Hong Kong-listed peers.
• American Tower Corp., one of the largest listed cellular tower owners in the world, recently announced that it is considering a conversion to the REIT structure for the tax year beginning January 1, 2012. (See the case study on page 20 for a description of the cellular tower business profile.)
• Master Limited Partnerships (MLPs) are another tax-efficient vehicle that target infrastructure assets. These partnerships do not have entity-level taxation and own and operate energy pipeline and midstream assets in the United States. The MLP universe, which has grown from a market capitalization of less than $25 billion in 2001 to nearly $200 billion today, offers investors attractive income (an average distribution yield of 5.7%), growth in distribution rates (averaging 8% since 2005) and low correlations with other asset classes. This tax-efficient vehicle has proven effective in infrastructure capital formation.
Case in point: Recent announcements suggest this trend is already underway:
Capital allocation trends in listed infrastructure point to a rising focus on income delivery.
The assets underlying listed infrastructure securities—toll roads, airports, power plants and transmission wires—generally produce high cash flow yields. However, not all of that excess cash is being returned to investors in the form of dividends. Management teams often choose to reinvest free cash flow, given the attractive rates of return on organic and external growth projects across the infrastructure spectrum— reflecting the fact that we are in the early stage of the infrastructure investment cycle.
However, given the significance of the income component of infrastructure assets’ return profiles, we expect infrastructure companies to increasingly organize structurally as tax-efficient investment vehicles designed for income delivery.
Cohen & Steers Global Listed Infrastructure
16
listed Infrastructure as a Direct Investment Complement
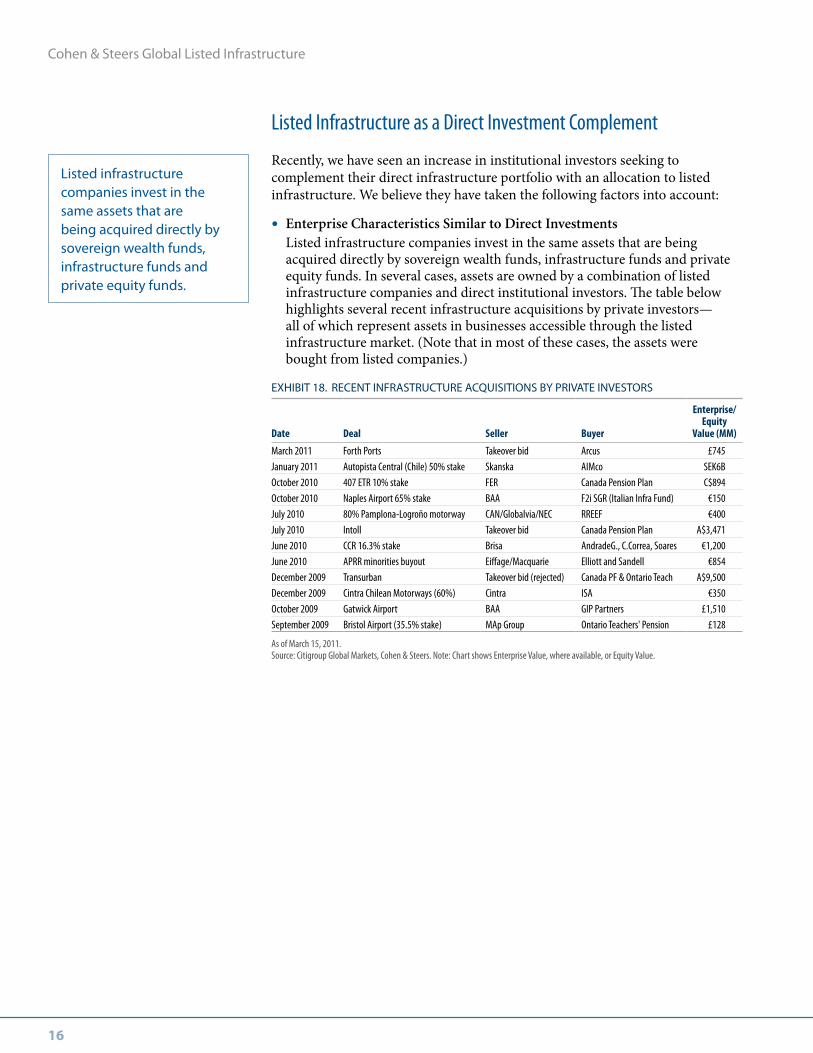
Recently, we have seen an increase in institutional investors seeking to complement their direct infrastructure portfolio with an allocation to listed infrastructure. We believe they have taken the following factors into account:
• Enterprise Characteristics Similar to Direct Investments Listed infrastructure companies invest in the same assets that are being
acquired directly by sovereign wealth funds, infrastructure funds and private equity funds. In several cases, assets are owned by a combination of listed infrastructure companies and direct institutional investors. The table below highlights several recent infrastructure acquisitions by private investors—all of which represent assets in businesses accessible through the listed infrastructure market. (Note that in most of these cases, the assets were bought from listed companies.)
exhibit 18. ReCeNt iNFRAStRUCtURe ACqUiSitiONS by pRivAte iNveStORS
Date Deal Seller Buyer
Enterprise/Equity
Value (MM)
March 2011 forth Ports Takeover bid arcus £745January 2011 autopista Central (Chile) 50% stake skanska aIMco seK6boctober 2010 407 eTR 10% stake feR Canada Pension Plan C$894 october 2010 naples airport 65% stake baa f2i sGR (Italian Infra fund) €150July 2010 80% Pamplona-logroño motorway Can/Globalvia/neC RReef €400July 2010 Intoll Takeover bid Canada Pension Plan a$3,471 June 2010 CCR 16.3% stake brisa andradeG., C.Correa, soares €1,200June 2010 aPRR minorities buyout eiffage/Macquarie elliott and sandell €854December 2009 Transurban Takeover bid (rejected) Canada Pf & ontario Teach a$9,500 December 2009 Cintra Chilean Motorways (60%) Cintra Isa €350october 2009 Gatwick airport baa GIP Partners £1,510september 2009 bristol airport (35.5% stake) Map Group ontario Teachers' Pension £128
as of March 15, 2011.source: Citigroup Global Markets, Cohen & steers. note: Chart shows enterprise Value, where available, or equity Value.
Listed infrastructure companies invest in the same assets that are being acquired directly by sovereign wealth funds, infrastructure funds and private equity funds.

cohenandsteers.com cohenandsteers.com17
Market liquidity permits the construction and rebalancing of infrastructure portfolios in relatively short periods of time.
• The Liquidity Advantage The global financial crisis of 2008 highlighted the need for investors to
demand a return premium for illiquidity. Unfortunately, sufficient data are not available to determine if that premium has been delivered in the private equity infrastructure asset class. However, our experience in the real estate markets demonstrates that it has not—investors still have not been adequately rewarded for illiquidity risk. Specifically, for the 15-year period ended 2009, our research shows that the investments with liquidity, REITs, outperformed core and value-added funds by 410 and 500 basis points, respectively.(1)
Listed infrastructure markets provide a high level of liquidity relative to the long lock-up periods and limited secondary markets for private infrastructure investment vehicles. Listed investments benefit from transaction-driven, real-time pricing and can be sold at any time, while lock-ups on direct infrastructure investments can last anywhere from 5 to 15 years.
Market liquidity also permits the construction and rebalancing of infrastructure portfolios in relatively short periods of time. Unlisted infrastructure portfolios can take several years to organize and invest fully.
The listed infrastructure investment universe is very large, with $1.9 trillion in market capitalization. The majority of the opportunity ($1.6 trillion) is in developed markets, although the emerging market universe is growing rapidly, given the faster pace of asset privatizations in those countries.
Using the UBS Global 50/50 Infrastructure & Utilities Index as a representative infrastructure portfolio, we calculated the index position size-weighted average daily liquidity per security at US$62 million, with only a handful of companies trading less than US$5 million per day.
Exhibit 19 on the following page shows the time it would take to fully invest a global listed infrastructure portfolio. To remove any bias, we used the UBS Global 50/50 Infrastructure & Utilities index as a proxy for the portfolio weightings (100 companies). We then assumed the ability to invest up to 20% of the daily average trading value of each security without market impact. Our analysis shows that a $100 million portfolio could be fully invested within one day, a $200 million portfolio within three days, and a $500 million portfolio within five days. While still investable in a timely manner, we would note that it could take somewhat longer to invest a more concentrated, actively managed portfolio.
(1) The Truth About Real Estate published by Cohen & steers in May 2010.
Listed infrastructure is highly liquid; direct investments can have long lock-ups and limited secondary markets.

Cohen & Steers Global Listed Infrastructure
18
Most listed infrastructure companies are conservatively leveraged.
The diversification of listed infrastructure can reduce the risks of concentrated exposure to regional regulations, and economic and market conditions.
• The Stability Provided by Moderate Leverage Direct infrastructure investments are often more highly leveraged to
enhance total return potential. Comparatively, most listed infrastructure companies are now conservatively leveraged, as illustrated in the cross- section of sectors below.
exhibit 19. SAmple time FRAme tO CONStRUCt A GlObAl iNFRAStRUCtURe pORtFOliO
Portfolio Size
$100,000,000 $200,000,000 $500,000,000
one Day 97% 72% 52%Three Days 100% 99% 79%five Days 100% 100% 96%
as of December 31, 2010.source: Cohen & steers estimates.
exhibit 20. Debt AS A peRCeNt OF eNteRpRiSe vAlUe
Subsector Net Debt/EV Geography Net Debt/EV
Railways 51% Japan 58%Water 45% australia/new Zealand 51%Integrated Utilities 44% north america 49%Transmission & Distribution 43% europe 42%Toll Roads 41% asia ex-Japan 37%airports 37% latin america 14%Communications 27%Marine Ports 16%
as of December 31, 2010.source: Cohen & steers. Data represent a sampling of companies included in the Infrastructure Universe described in the index definitions on page 25. eV = enterprise Value.
• Diversification Benefits at the Portfolio and Security Level Listed infrastructure offers a diverse investment opportunity at both the
portfolio and security levels. With portfolios typically comprising between 50 and 90 securities, investors gain access to broad, liquid investment opportunities across all subsectors and geographies. Additionally, each company in an investment portfolio is typically the owner of several (if not dozens of) infrastructure assets, often across many subsectors and geographies. Direct infrastructure funds typically invest in just a handful of assets, often concentrated in a few geographies and/or subsectors.

cohenandsteers.com cohenandsteers.com19
Diversification is critical to infrastructure investing, for several reasons: — Foremost, listed infrastructure investors can benefit from diversified
regulatory and political environments. Regulation is, in our view, the largest risk faced by the asset class, and regulatory risk varies significantly across both geography and subsector. A concentrated portfolio—such as seen with direct infrastructure funds—also leads to concentrated regulatory exposure.
— Diversification can also reduce potential volatility related to varying regional economic and market conditions.
— Sovereign risks among regions can lead to dramatically different asset-level and market performance, as seen in 2010 during the sovereign credit crisis in peripheral Europe.
• Access to Themes Not Always Available Through Private Investments One of the attractive aspects of listed infrastructure is that investors can
access a broad set of liquid investment themes across all geographies and subsectors—some of which would likely entail significant hurdles when trying to invest directly in the same assets. Often, public companies have premier assets that cannot be accessed privately. A high-quality management team can also add value, beyond the enterprise value of the assets, through strategic development, acquisitions and dispositions.
On the following pages, we highlight examples of companies that fall under two compelling and investable infrastructure themes: U.S.-based cellular towers, and toll roads in Brazil and China.
Often, public companies have premier assets that cannot be accessed through private investment.

Cohen & Steers Global Listed Infrastructure
20
U.S. cellular tower companies, which own towers and lease space to telecommunication carriers to place equipment, have attractive business models and stable, predictable cash flows. Leases signed by wireless carriers for tower space typically average 10 years in duration, with very low churn, and they generally include annual inflation-linked revenue escalators. Because tower operating and maintenance costs are modest and fixed, new leases and revenue escalations flow directly to a company’s bottom line. Accordingly, unlevered internal rates of return tend to be in the low- to mid-teen range, on average across the industry.
The fundamental case for tower companies revolves around the increasingly data-intensive nature of wireless devices, as well as the increased penetration of those devices. With the recent boom in popularity of devices such as the iPhone, iPad and Blackberries, data usage in the U.S. has grown 16% annually from 2007–2010 and is expected to grow at 22% per year through 2020. The current U.S. wireless infrastructure is insufficient to meet this demand, which is forcing wireless carriers to invest heavily in their networks. Fundamentals outside the United States also remain strong, with American Tower Corp. having the most exposure (Latin America and India) of the listed companies.
Case Study #1: U.s. Tower Companies
exhibit A. U.S. wiReleSS DAtA USAGe Data mOU equivalents (in billions)
as of february 28, 2011.source: Goldman sachs.
0
5,00010,00015,00020,00025,00030,00035,000
2020E2019E2018E2017E2016E2015E2014E2013E2012E2011E201020092008
exhibit b. U.S. SmARtphONe peNetRAtiON
as of february 28, 2011.source: Goldman sachs.
0%10%20%30%40%50%60%70%
2020E2019E2018E2017E2016E2015E2014E2013E2012E2011E201020092008

cohenandsteers.com cohenandsteers.com21
Network infrastructure upgrades drive leasing demand for sites on cell towers. Currently, major carriers like Verizon and AT&T are investing in new 4G wireless networks to meet the growing data demand. Likewise the Sprint/Clearwire joint venture is building out a 4G/WiMax network, and new wireless carrier market entrants could drive further demand for tower cell sites. These network upgrades are driving 10%-plus annual growth in U.S. tower company revenues.
All three publicly traded U.S. tower companies are currently structured as corporations; however, expected conversions to the REIT structure will likely attract a broader investor base as their dividend payouts increase. American Tower Corp. (AMT), the leading listed tower company globally, has stated that it intends to convert to a REIT in 2012 or 2013; Crown Castle International (CCI) and SBA Communications (SBAC) may follow suit in 2013 or 2014. Based on current free cash flow estimates, the towers could pay dividends in 2013 that support yields of 6.0–6.5%.
exhibit D. Five-yeAR tOtAl RetURNS U.S. Cell tower Companies vs. the mSCi world (net) index
as of february 28, 2011.source: bloomberg.Past performance is no guarantee of future results.see index definitions on page 25.
0
50
100
150
200
201120102009200820072006
Crown Castle International American Tower Corp. SBA Communications MSCI World (net) Index
+87.2%+69.5%
+34.5%+17.6%
2006 = 100
exhibit C. pUbliCly tRADeD U.S.-FOCUSeD COmpANieS
Name Ticker Country Market Cap (US$ MM) Free Cash Flow Yield
american Tower Corp. aMT United states 20,432 6.4%
Crown Castle International CCI United states 11,940 7.1%
sba Communications sbaC United states 4,525 6.6%
as of february 28, 2011.source: bloomberg, Cohen & steers estimates.Past performance is no guarantee of future results. free cash flow yield is shown after CaPeX but before discretionary dividends.
Case Study #1: U.s. Tower Companies

Cohen & Steers Global Listed Infrastructure
22
exhibit b. liSteD tOll ROAD COmpANieS: bRAzil AND ChiNA
Name Ticker Country Market Cap (US$ MM) Dividend Yield
obrascon Huarte lain brasil oHlb3.bZ brazil 2,431 1.0%
CCR sa CCRo3.bZ brazil 12,639 4.0%
ecoRodovias eCoR3.bZ brazil 4,293 3.3%
shenzhen expressway 548.HK China 1,569 4.0%
anhui expressway 995.HK China 1,506 3.6%
Jiangsu expressway 177.HK China 5,045 5.0%
sichuan expressway 107.HK China 2,757 1.7%
Zhejiang expressway 576.HK China 3,832 4.8%
GZI Transport 1052.HK China 882 5.8%
as of february 28, 2011.source: bloomberg, Cohen & steers.
Emerging markets infrastructure growth is another compelling theme easily accessible to listed infrastructure investors. Brazil, for example, is in the early stages of a rapid increase in infrastructure investment driven by: 1) substantial underinvestment during the 1980–1990s, 2) strong economic growth, 3) rapidly increasing automobile ownership, 4) continued urbanization, and 5) the 2014 World Cup and the 2016 Olympics.
A beneficiary of this trend will be toll road operators, several of which are listed in Brazil. Some, such as CCR SA, are plays on continued urbanization and infrastructure needs in urban areas. Others, including EcoRodovias, are leveraged to export growth, in that they operate roads between the interior agricultural producing regions and the coastal ports. Exhibit B lists public toll road companies in Brazil and China.
exhibit A. Five-yeAR tOtAl RetURNSCCR SA vs. the mSCi world (net) index
as of february 28, 2011.source: bloomberg.Past performance is no guarantee of future results.see index definitions on page 25.
0
50
100
150
200
250
300
201120102009200820072006
CCR SA MSCI World (net) Index
+192.9%
+17.6%
2006 = 100
Case Study #2: emerging Market Toll Road operators

cohenandsteers.com cohenandsteers.com23
Rising vehicle ownership in China is also a powerful and investable theme, given the size of its economy and a currently low ownership rate. Exhibit C below shows the vehicle penetration rate of various regions of the world, with per-capita economic
strength being a key driver of car ownership. Chinese toll roads have an average dividend yield of 4%, with cash flows benefiting from double-digit traffic growth.
exhibit D. bRAzil: mONthly DOmeStiC vehiCle ReGiStRAtiONS (units seasonally adjusted)
as of november 30, 2010.source: fenabrave, Goldman sachs.
100,000
150,000
200,000
250,000
300,000
350,000
400,000
2010200920082007200620052004
Num
ber o
f Reg
istra
tions
exhibit e. ChiNA: milliONS OF vehiCleS SOlD ANNUAlly1998–2011
as of february 28, 2011.source: IsI.
0
5
10
15
20
25
20112010200920082007200620052004200320022001200019991998
Num
ber o
f Veh
icles
Sold
(MM
)
exhibit C. vehiCle peNetRAtiON peR COUNtRy
as of December 31, 2010.source: abertis, Cohen & steers.
0
100
200
300
400
500
600
700
800
900
0 10,000 20,000 30,000 40,000 50,000GDP per Capita
Cars
per 1
,000
Peop
le
Ireland
China
Czech Republic EnglandPortugal
ItalyFrance
Russia
Germany
Poland
India Turkey
Australia
Mexico Brazil
Chile
Croatia
SloveniaSpain
United States
Case Study #2: emerging Market Toll Road operators

Cohen & Steers Global Listed Infrastructure
24
Conclusion
Our case studies illuminate some of the unique characteristics and competitive advantages of listed infrastructure, while pointing to the sector’s ease of access across a broad base of themes and geographies. But overall, listed infrastructure shares a common profile with its direct investment counterparts—long-lived assets, often with high barriers to entry and a monopolistic structure. Quality management teams can further enhance the value of these businesses through accretive capital allocation decisions. But the unique value-add comes from the transparency, liquidity and daily pricing advantages of public securities markets.
Depending on the asset allocation framework of the individual investor, listed infrastructure tends to be treated as a carve-out allocation from global equities, or a component of a real asset portfolio. In our view, both approaches make sense:
• An allocation as a carve-out of global equities recognizes that listed infrastructure is an equity product, while appreciating its defensive attributes and characteristics.
• An allocation as part of a real asset “bucket”—either standalone or as a complement to direct infrastructure investments—recognizes the unique asset profiles, inflation linkages and long-term performance characteristics of the underlying businesses.
Within either framework, listed infrastructure offers an attractive total return proposition with the combination of stable, predictable dividends and attractive long-term cash flow growth. Given the current average dividend yield of 4% for this asset class, combined with long-term cash flow growth in the range of 5–6%, we can foresee annual total return potential of approximately 10% over the next five years.

cohenandsteers.com cohenandsteers.com25
Index Definitions
The s&P 500 Index is a gauge of the U.s. equities market. It includes a sample of 500 leading companies in leading industries of the U.s. economy.
The MsCI World (net) Index consists of a wide selection of stocks traded in 23 developed countries. It is weighted for market capitalization and is considered an important benchmark of the state of global stock markets.
The Russell 2000 Index measures the performance of the 2,000 smallest companies in the Russell 3000 Index.
The Citigroup 3-Month T-bill Index measures monthly return equivalents of yield averages that are not marked to market. The Three-Month Treasury bill Indexes consist of the last three three-month Treasury bill issues.
The barclays Capital U.s. aggregate bond Index represents securities that are seC-registered, taxable and dollar denominated. The index covers the U.s. investment-grade fixed rate bond market, with components for government and corporate securities, mortgage pass-through securities and asset-backed securities.
The barclays Capital Global aggregate Index provides a broad-based measure of the global investment-grade fixed income markets. The three major components of this index are the U.s. aggregate, the Pan-european aggregate, and the asian-Pacific aggregate Indices. The index also includes eurodollar and euro-Yen corporate bonds, Canadian government, agency and corporate securities, and UsD investment grade 144a securities.
The fTse naReIT all ReIT Index is a headline index that consists of all publicly traded ReITs in accordance with Rule 1.1.1. The fTse naReIT all ReIT Index is not free float adjusted, and constituents are not required to meet minimum size and liquidity criteria.
The fTse ePRa/naReIT Developed Real estate (net) Index (net of dividend withholding taxes) is an unmanaged market-weighted total return index which consists of many companies from developed markets whose floats are larger than $100 million and derive more than half of their revenue from property-related activities.
The Ubs Global 50/50 Infrastructure & Utilities Index (net of dividend withholding taxes) tracks a 50% exposure to global developed market utilities sector and a 50% exposure to global developed market infrastructure sector. The utilities sector excludes the sub-sector generation utilities. The index is free-float market capitalization weighted and is reconstituted annually with quarterly rebalances.
The Dow Jones-Ubs Commodity Index is composed of futures contracts on physical commodities and represents nineteen separate commodities traded on U.s. exchanges, with the exception of aluminum, nickel and zinc.
The s&P GsCI® (Commodities Index) is a composite index of commodity sector returns representing an unleveraged, long-only investment in commodity futures that is broadly diversified across the spectrum of commodities. The returns are calculated on a fully collateralized basis with full reinvestment. The combination of these attributes provides investors with a representative and realistic picture of realizable returns attainable in the commodities markets.
The Infrastructure Universe is represented by an equal-weighted index created by an independent, third-party research firm (ned Davis Research Group) based upon a universe of companies provided by Cohen & steers. The universe includes over 350 companies in all infrastructure sub-sectors included in both the Ubs Global 50/50 Infrastructure & Utilities Index and the s&P Global Infrastructure Index. The universe has no market capitalization restrictions and includes both developed and emerging markets.

Cohen & Steers Global Listed Infrastructure
26
The views and opinions in the preceding commentary are as of the date of publication and are subject to change. This material represents an assessment of the market environment at a specific point in time, should not be relied upon as investment advice, is not intended to predict or depict performance of any investment and does not constitute a recommendation or an offer for a particular security. We consider the information in this presentation to be accurate, but we do not represent that it is complete or should be relied upon as the sole source of suitability for investment. Past performance does not guarantee future results. There is no guarantee that any historical trend illustrated above will be repeated in the future, and there is no way to predict precisely when such a trend will begin. There is no guarantee that a market forecast made in this commentary will be realized.
Risks of Investing in Global Infrastructure Securities: Infrastructure issuers may be subject to regulation by various governmental authorities and may also be affected by governmental regulation of rates charged to customers, operational or other mishaps, tariffs and changes in tax laws, regulatory policies and accounting standards. foreign securities involve special risks, including currency fluctuation and lower liquidity. some global securities may represent small and medium-sized companies, which may be more susceptible to price volatility than larger companies.
foR Use bY QUalIfIeD InsTITUTIonal anD PRofessIonal InVesToRs oR THeIR aDVIsoRs onlY.

cohenandsteers.com cohenandsteers.com27
About Cohen & SteersCohen & Steers is a manager of portfolios specializing in U.S. and international real estate securities, large cap value stocks, listed infrastructure and utilities, and preferred securities. The company also manages alternative investment strategies such as hedged real estate securities portfolios and private real estate multimanager strategies for qualified investors. Headquartered in New York City, with offices in London, Brussels, Hong Kong and Seattle, Cohen & Steers serves individual and institutional investors through a broad range of investment vehicles.
Copyright © 2011 Cohen & Steers, Inc. All rights reserved.

Corporate Headquarters280 Park Avenue, 10th Floor New York, New York 10017 212.832.3232 phone 212.832.3622 fax cohenandsteers.com
Offices:
21 Sackville Street, 4th Floor London W1S 3DN United Kingdom +44.207.460.6350 phone
166 Chaussée de la Hulpe 1170 Brussels Belgium +32.2.679.0660 phone
1202, Citibank Tower Citibank Plaza 3 Garden Road, Central Hong Kong +852.3667.0080 phone
1201 Third Avenue, Suite 3810 Seattle, Washington 98101 206.788.4240 phone
for information, call us at:800.330.7348
Come visit us online at: cohenandsteers.com
eD2006 0311