infrastructure investment: combining listed with … · infrastructure investment: combining listed...
TRANSCRIPT
INFRASTRUCTURE INVESTMENT: COMBINING LISTED WITH UNLISTED
SEPTEMBER 2014PREPARED BY CONSILIA CAPITAL

1
About the author
Alex formed Consilia Capital in 2012 and has over 30 years experience in real estate finance and global capital markets. He is a visiting lecturer at Cass Business School.
ALEX MOSS Managing Director, Consilia Capital
2
Although there has been significant work undertaken by both practitioners and academics on the beneficial impact of adding listed real estate to an unlisted real estate portfolio (Moss and Farrelly 2013), and indeed the role of real estate in a multi-asset portfolio, there has been little work undertaken on the impact of combining listed and unlisted infrastructure funds. We believe that now is the time to look at this topic, given the noticeable increase in allocations to infrastructure by both institutional and retail investors over the last five years. This has been driven by a desire from investors for income, inflation hedging characteristics, a low correlation with other asset classes, and, where possible, liquidity.
The listed real estate market has grown from a small niche opportunity in the 1960’s to a stand-alone asset class today. The early years of the United States (US) Real Estate Investment Trust (REIT) market showed strong performance. Many investors would have likely questioned the future opportunity and potentially missed out on a rewarding investment opportunity over the next 50 years.
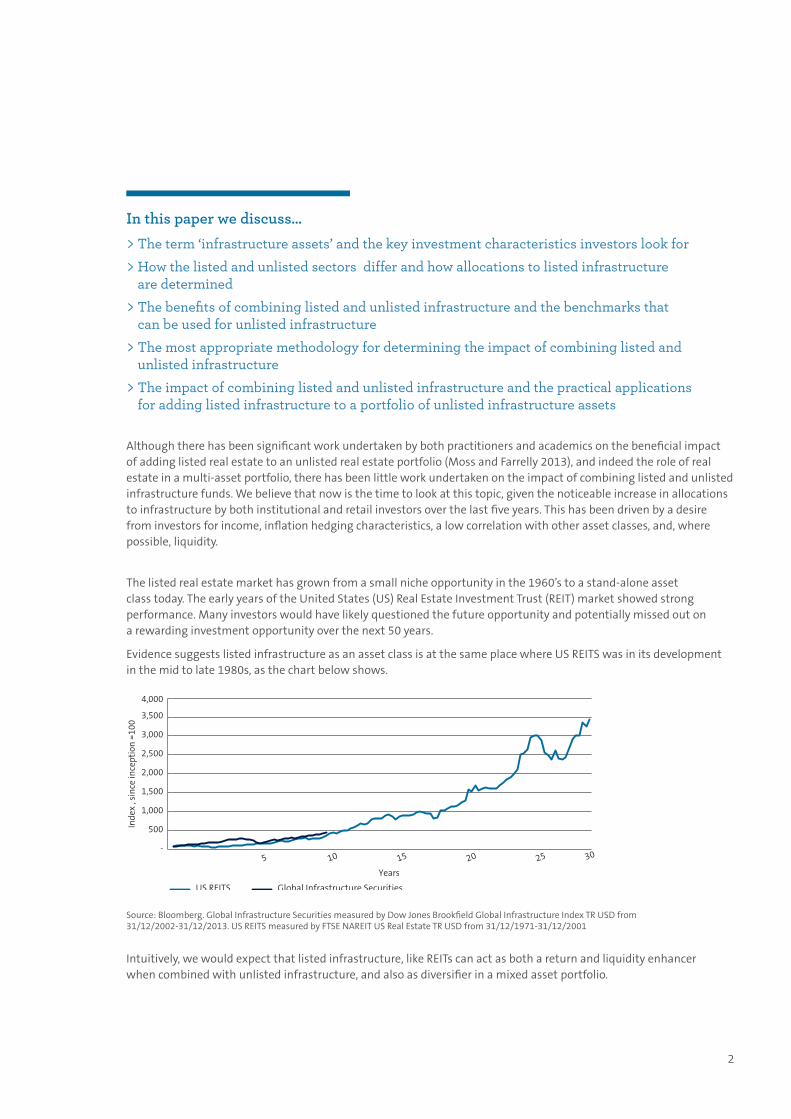
Evidence suggests listed infrastructure as an asset class is at the same place where US REITS was in its development in the mid to late 1980s, as the chart below shows.
In this paper we discuss…
> The term ‘infrastructure assets’ and the key investment characteristics investors look for
> How the listed and unlisted sectors differ and how allocations to listed infrastructure are determined
> The benefits of combining listed and unlisted infrastructure and the benchmarks that can be used for unlisted infrastructure
> The most appropriate methodology for determining the impact of combining listed and unlisted infrastructure
> The impact of combining listed and unlisted infrastructure and the practical applications for adding listed infrastructure to a portfolio of unlisted infrastructure assets
Source: Bloomberg. Global Infrastructure Securities measured by Dow Jones Brookfield Global Infrastructure Index TR USD from 31/12/2002-31/12/2013. US REITS measured by FTSE NAREIT US Real Estate TR USD from 31/12/1971-31/12/2001
US REITS Global Infrastructure Securities
-
500
1,000
1,500
2,000
2,500
3,000
3,500
4,000
5 10 15 20 25
Years
Inde
x , s
ince
ince
ptio
n =
100
30
Intuitively, we would expect that listed infrastructure, like REITs can act as both a return and liquidity enhancer when combined with unlisted infrastructure, and also as diversifier in a mixed asset portfolio.
3
We believe there are three factors in particular that should be considered when looking at the impact of including listed infrastructure compared to that of listed real estate.
Differences in the nature of the investible universe Unlike real estate where the geography of the assets (both regional and country level), and structure of the vehicle (e.g. REIT v.s. REOC) can be as important as the generic sub-sector type (e.g. retail, office etc.), for infrastructure the key clusters are defined by specific industrial, rather than geographic groupings.
Lack of a universal unlisted infrastructure benchmark Real estate has benefitted enormously from the existence of private market indices, at both the fund and asset level. Although there are regional variations in the frequency and quality of data, IPD now produce a Global Property Index that can be used as a benchmark proxy for unlisted real estate. For infrastructure there is not currently a standard global infrastructure Index commonly used, and there are a number of different return requirements from infrastructure investors. We therefore have to examine the impact of adding listed infrastructure to a variety of different benchmarks to assess the impact.
Smaller time series available In broad terms, global infrastructure data is available from around 2007 compared to real estate data which is available back to the early 1980’s. It is therefore not possible to undertake an analysis of infrastructure performance over several cycles.
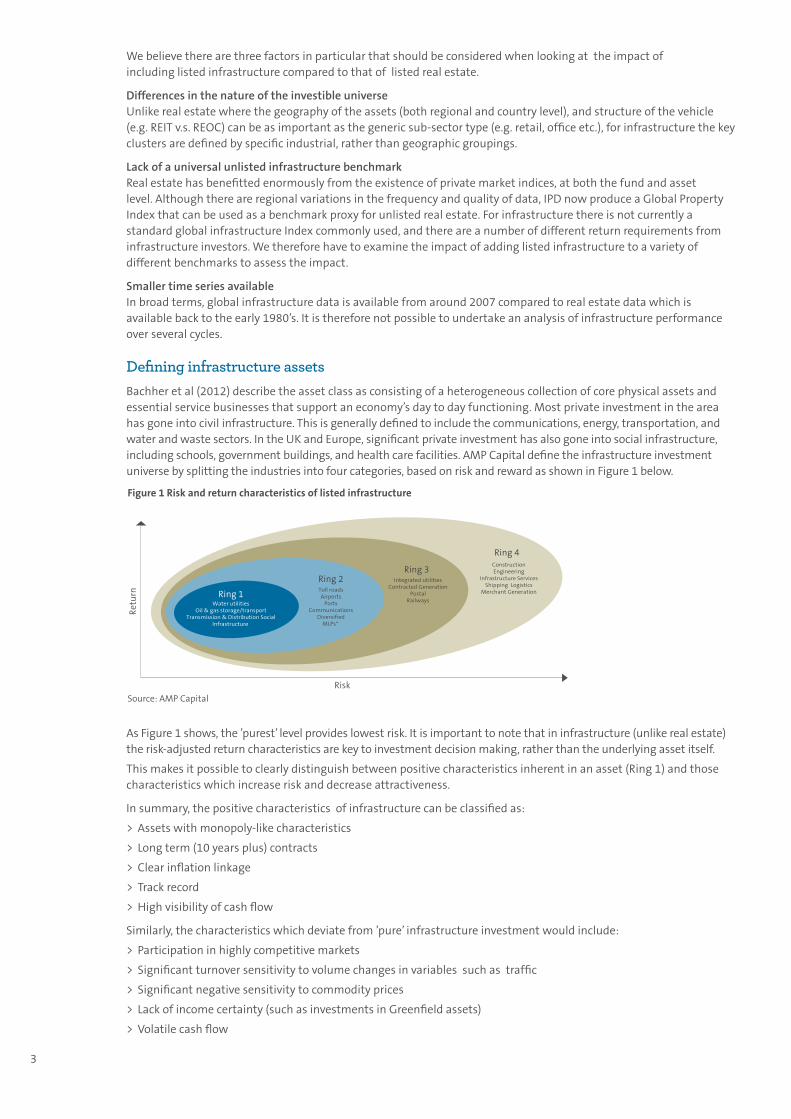
Defining infrastructure assetsBachher et al (2012) describe the asset class as consisting of a heterogeneous collection of core physical assets and essential service businesses that support an economy’s day to day functioning. Most private investment in the area has gone into civil infrastructure. This is generally defined to include the communications, energy, transportation, and water and waste sectors. In the UK and Europe, significant private investment has also gone into social infrastructure, including schools, government buildings, and health care facilities. AMP Capital define the infrastructure investment universe by splitting the industries into four categories, based on risk and reward as shown in Figure 1 below.
Source: AMP Capital
Figure 1 Risk and return characteristics of listed infrastructure
Water utilitiesOil & gas storage/transport
Transmission & Distribution SocialInfrastructure
Ring 1
Ring 2
Risk
Retu
rn
Ring 3
Ring 4
Toll roadsAirports
PortsCommunications
DiversifiedMLPs*
Integrated utilitiesContracted Generation
PostalRailways
ConstructionEngineering
Infrastructure ServicesShipping Logistics
Merchant Generation
As Figure 1 shows, the ’purest’ level provides lowest risk. It is important to note that in infrastructure (unlike real estate) the risk-adjusted return characteristics are key to investment decision making, rather than the underlying asset itself.
This makes it possible to clearly distinguish between positive characteristics inherent in an asset (Ring 1) and those characteristics which increase risk and decrease attractiveness.
In summary, the positive characteristics of infrastructure can be classified as:
> Assets with monopoly-like characteristics
> Long term (10 years plus) contracts
> Clear inflation linkage
> Track record
> High visibility of cash flow
Similarly, the characteristics which deviate from ’pure’ infrastructure investment would include:
> Participation in highly competitive markets
> Significant turnover sensitivity to volume changes in variables such as traffic
> Significant negative sensitivity to commodity prices
> Lack of income certainty (such as investments in Greenfield assets)
> Volatile cash flow

4
What are the key investment characteristics investors look for? Unlike other asset classes, investors use infrastructure for a variety of different roles in portfolio management. One of the best ways of understanding the requirements from an infrastructure allocation is to look at the institutional benchmarks for that asset class. Bachher et al (2012) looked at the available benchmark families for infrastructure and found that investors have different goals, leaving no single ‘right’ way to benchmark the asset class. In a survey of the benchmarks used by institutional investors, they found that there was not even a consensus on the style of the benchmark. The types used, which by definition reflect the investment characteristics of infrastructure, were:
> Absolute return
> Inflation based (CPI + )
> Inflation plus risk premium (CPI + Bond and equity premiums)
> Fixed income index
> Hybrid approaches
The variety of benchmarks used reflects not only the lack of long–term time series data for the asset class, but more particularly the different roles infrastructure can be expected to play in portfolio management. Unsurprisingly, different strategic approaches necessitate different benchmarks. Despite the differences, there does appear to be a consensus among institutional investors that infrastructure fits somewhere between regular equities and fixed income on the risk-reward spectrum. They found that some investors were looking to infrastructure to provide equity-like returns with bond-like risks and serving as a first-order proxy for long-dated liabilities.
In summary, we can identify the main required investment characteristics of infrastructure as:
> Attractive risk-adjusted returns, complementing a diversified portfolio
> Reliable inflation-linked returns
> Low correlation and volatility compared with traditional asset classes
> Stable long-term yields, with the potential for capital growth
> Defensive characteristics emanating from the provision of essential services
> Potential for value enhancement through active management of the assets
How do the listed and unlisted sectors differ?As with real estate, the underlying returns of listed and unlisted infrastructure can be expected to converge over the medium term, but over the shorter term there are obvious structural differences relating to liquidity and volatility. These are summarised in Figure 2 below.
There are also however, differences in terms of the investable universe of listed and unlisted infrastructure. This includes by asset and industry type (whereby listed infrastructure can provide opportunities not available in the unlisted sector), in addition to its structural benefits, such as liquidity and diversification.
Source: AMP Capital
Figure 2 Characteristics of listed and unlisted infrastructure
Listed Unlisted
Geographic Diversity Very high Low
Asset Diversity Very high Low
Liquidity Very high Low
Daily Valuations Yes No
Control Low Low to Very high
Volatility of valuation High Low
Transaction cost Low High
Portfolio Turnover High Low
Investment horizon Medium Term (5 years) Long Term (10 years)

5
How are allocations to listed infrastructure determined?One of the key issues to understand is how allocators and investment consultants view the exposure to listed infrastructure. We undertook a brief, informal, and non-attributable survey of allocators and consultants and asked three questions:
1) Does the allocation to listed infrastructure come from the infrastructure allocation, or from elsewhere (i.e. bonds, equities, other real assets)?
2) Typically, who will cover the listed infrastructure holdings?
3) What are the key factors in comparing listed with unlisted (e.g. tax, asset quality etc)?
The responses received suggest:
> The allocation typically comes from the infrastructure bucket, rather than equity or bond allocations. In particular, as well as permanent allocations, there appears to be a trend for temporary allocations to listed infrastructure, prior to investment in unlisted infrastructure funds. This can last for around 12 months, and also helps reduce the impact of fund vintage on performance.
> Listed infrastructure holdings tend to be monitored primarily by the infrastructure team.
> In general terms, allocators focus on factors such as liquidity and general diversification when assessing the merits of listed infrastructure rather than a comparison of the quality of assets available, and any differences in tax treatment.
Combining listed and unlisted infrastructure
Complementary or substitutes?
Rob Pereira (2008) looked at whether listed assets and their unlisted counterparts should be treated by investors as substitutes or complements. If these two forms of investment are substitutes, then investors can swap one for the other. However, if it can be established that there are benefits to holding both together in a portfolio, then they should be treated as complementary. The notion that listed and unlisted counterparts may be complements derives from their differences. Some of the key points of difference include:
> Drivers of risk and return
> Sources of excess returns
> Basis of pricing
> Liquidity
> Implementation and Governance
He concluded that economic theory might suggest that it should not matter to an investor whether an asset was in a listed or an unlisted form. However, in reality it does matter, as there are material differences between the listed and unlisted sectors of most asset classes. The report highlighted some of these differences, which occur in aspects such as the underlying sources of risk and return, basis of pricing, liquidity, implementation and governance.
The appropriate response in terms of allocation can be expected to vary across investors. Tolerance for illiquidity and time horizon can be key decision variables in this respect. Investors with a strong need for liquidity should place tight constraints on the use of unlisted assets. Time horizon can influence the degree to which listed and unlisted counterparts might be viewed as substitutes or complements. When performance is viewed from a short time perspective using monthly or quarterly data, returns on unlisted assets lag their listed counterparts and have significantly lower volatility and correlations. Therefore, listed and unlisted assets in the same asset class can behave in a complementary fashion. As the time frame lengthens, risk and returns for listed and their unlisted counterparts tend to converge so they become closer to being substitutes. Nevertheless, there will still remain enough differences in the underlying exposures and the drivers of risk and return to ensure that listed and unlisted assets are never complete substitutes.
For most investors there are likely to be clear advantages from holding both forms, unless severely constrained by liquidity or other binding concerns. This approach provides investors with greater flexibility to take advantage opportunistically of any significant pricing divergences that occur between listed assets and their unlisted counterparts.
The impact of including global listed infrastructure in a mixed asset portfolio
Oyedele et al (2012) looked at global listed infrastructure investment performance compared with other global asset classes such as stocks, bonds, real estate investment trusts, property, hedge funds and private equity over the timeframe 2001-2010. The study is supportive of the argument that the inclusion of infrastructure in a mixed asset portfolio enhances investment performance. The role of global infrastructure in a multiasset portfolio is shown to be more risk reduction rather than enhancement of return. From a practical viewpoint, the systematic allocation of between 10 and 18% of infrastructure into a global investment portfolio can significantly enhance diversification benefits for investors.
6
So, which benchmarks should we use for listed and unlisted infrastructure?To determine whether there are benefits for investors to combine listed and unlisted assets in a portfolio, we need to identify the most suitable benchmarks. Here, we analyse a number of possibilities.
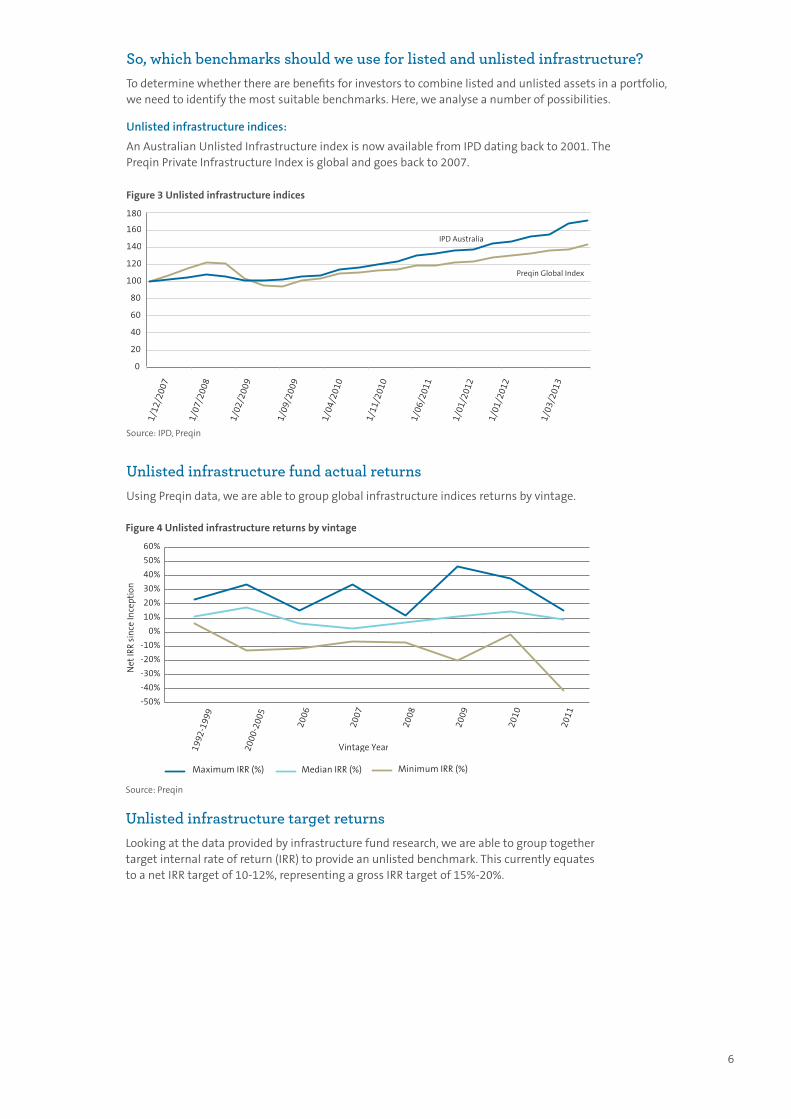
Unlisted infrastructure indices:
An Australian Unlisted Infrastructure index is now available from IPD dating back to 2001. The Preqin Private Infrastructure Index is global and goes back to 2007.
Unlisted infrastructure fund actual returnsUsing Preqin data, we are able to group global infrastructure indices returns by vintage.
Source: IPD, Preqin
Figure 3 Unlisted infrastructure indices
0
20
40
60
80
100
120
140
160
180
IPD Australia
Preqin Global Index
1/07
/200
8
1/02
/200
9
1/09
/200
9
1/04
/201
0
1/11
/201
0
1/06
/201
1
1/01
/201
2
1/01
/201
2
1/03
/201
3
1/12
/200
7
-50%
-40%
-30%
-20%
-10%
0%
10%
20%
30%
40%
50%
60%
1992
-199
9
2000
-200
5
2006
2007
2008
2009
2010
2011
Net
IRR
sin
ce In
cept
ion
Vintage Year
Maximum IRR (%) Median IRR (%) Minimum IRR (%)
Source: Preqin
Figure 4 Unlisted infrastructure returns by vintage
Unlisted infrastructure target returnsLooking at the data provided by infrastructure fund research, we are able to group together target internal rate of return (IRR) to provide an unlisted benchmark. This currently equates to a net IRR target of 10-12%, representing a gross IRR target of 15%-20%.
7
Source: Consilia Capital, Bloomberg
Figure 6 Listed Infrastructure indices
0
0.5
1
1.5
2
2.5
3
3.5
4
4.5
Brookfield Macquarie NMX S&P
31/1
0/20
03
31/0
8/20
04
31/1
2/20
02
31/1
2/20
12
31/1
2/20
07
30/0
6/20
05
30/0
4/20
06
28/0
2/20
07
30/0
6/20
10
Source: Consilia Capital, Bloomberg
Figure 5 NAV indices
0
20
40
60
80
100
120
ishares NAV Index MacQ NAV Index
1/09
/200
8
1/06
/200
9
1/03
/201
0
1/12
/201
0
1/09
/201
1
1/12
/200
7
1/03
/201
3
1/06
/201
2
Figure 7 Equal weighted fund indicators
0
20
40
60
80
100
120
140
160
180
31/0
8/20
07
30/0
6/20
08
31/1
0/20
06
26/0
2/20
10
31/1
2/20
10
30/0
4/20
09
31/0
8/20
12
28/0
6/20
13
31/1
0/20
11
30/0
4/20
14
Source: Consilia Capital, Bloomberg
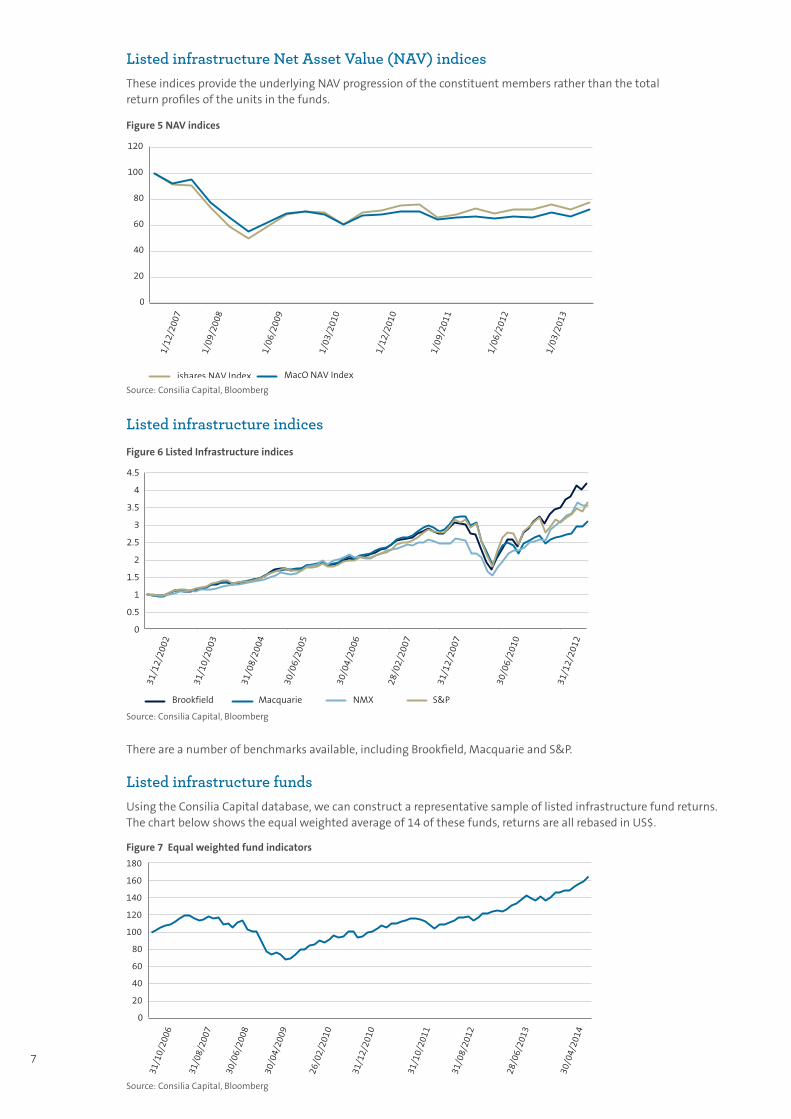
Listed infrastructure Net Asset Value (NAV) indicesThese indices provide the underlying NAV progression of the constituent members rather than the total return profiles of the units in the funds.
Listed infrastructure indices
There are a number of benchmarks available, including Brookfield, Macquarie and S&P.
Listed infrastructure fundsUsing the Consilia Capital database, we can construct a representative sample of listed infrastructure fund returns. The chart below shows the equal weighted average of 14 of these funds, returns are all rebased in US$.
Unlisted Listed
0
20
40
60
80
100
120
140
160
1/10
/200
8
1/08
/200
9
1/12
/200
7
1/06
/201
0
1/02
/201
2
1/12
/201
2
1/04
/201
1
Source: Consilia Capital, Bloomberg. For further details on how performance has been calculated, please contact Consilia Capital.
Figure 8 Listed v.s. unlisted performance
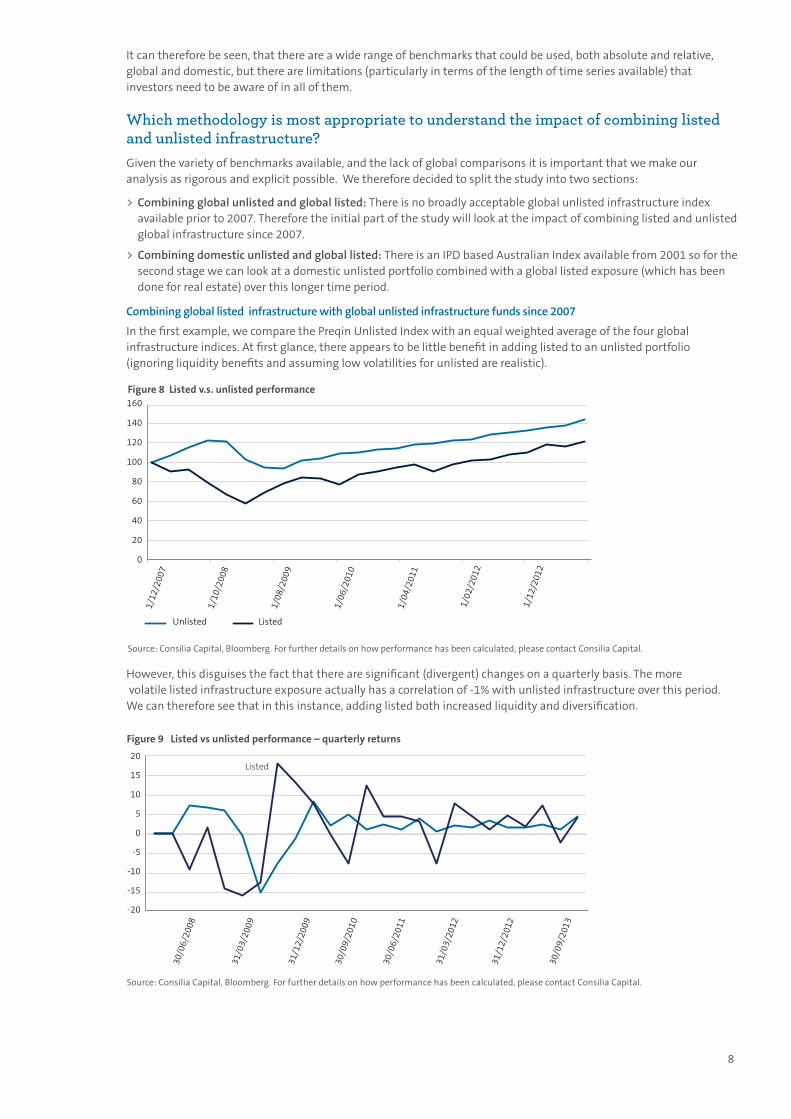
It can therefore be seen, that there are a wide range of benchmarks that could be used, both absolute and relative, global and domestic, but there are limitations (particularly in terms of the length of time series available) that investors need to be aware of in all of them.
Which methodology is most appropriate to understand the impact of combining listed and unlisted infrastructure? Given the variety of benchmarks available, and the lack of global comparisons it is important that we make our analysis as rigorous and explicit possible. We therefore decided to split the study into two sections:
> Combining global unlisted and global listed: There is no broadly acceptable global unlisted infrastructure index available prior to 2007. Therefore the initial part of the study will look at the impact of combining listed and unlisted global infrastructure since 2007.
> Combining domestic unlisted and global listed: There is an IPD based Australian Index available from 2001 so for the second stage we can look at a domestic unlisted portfolio combined with a global listed exposure (which has been done for real estate) over this longer time period.
Combining global listed infrastructure with global unlisted infrastructure funds since 2007
In the first example, we compare the Preqin Unlisted Index with an equal weighted average of the four global infrastructure indices. At first glance, there appears to be little benefit in adding listed to an unlisted portfolio (ignoring liquidity benefits and assuming low volatilities for unlisted are realistic).
However, this disguises the fact that there are significant (divergent) changes on a quarterly basis. The more volatile listed infrastructure exposure actually has a correlation of -1% with unlisted infrastructure over this period. We can therefore see that in this instance, adding listed both increased liquidity and diversification.
8
Figure 9 Listed vs unlisted performance – quarterly returns
-20
-15
-10
-5
0
5
10
15
20Listed
31/0
3/20
09
30/0
6/20
08
30/0
9/20
10
31/1
2/20
09
31/0
3/20
12
31/1
2/20
12
30/0
6/20
11
30/0
9/20
13
Source: Consilia Capital, Bloomberg. For further details on how performance has been calculated, please contact Consilia Capital.
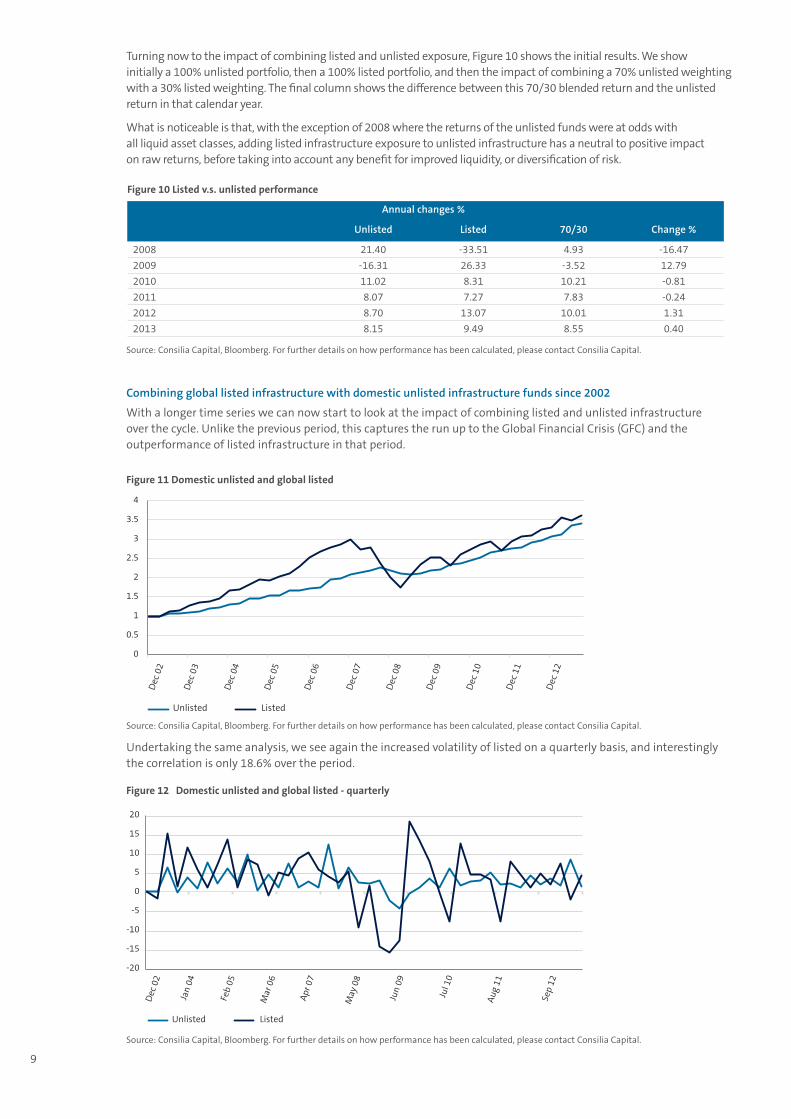
Turning now to the impact of combining listed and unlisted exposure, Figure 10 shows the initial results. We show initially a 100% unlisted portfolio, then a 100% listed portfolio, and then the impact of combining a 70% unlisted weighting with a 30% listed weighting. The final column shows the difference between this 70/30 blended return and the unlisted return in that calendar year.
What is noticeable is that, with the exception of 2008 where the returns of the unlisted funds were at odds with all liquid asset classes, adding listed infrastructure exposure to unlisted infrastructure has a neutral to positive impact on raw returns, before taking into account any benefit for improved liquidity, or diversification of risk.
Combining global listed infrastructure with domestic unlisted infrastructure funds since 2002
With a longer time series we can now start to look at the impact of combining listed and unlisted infrastructure over the cycle. Unlike the previous period, this captures the run up to the Global Financial Crisis (GFC) and the outperformance of listed infrastructure in that period.
Undertaking the same analysis, we see again the increased volatility of listed on a quarterly basis, and interestingly the correlation is only 18.6% over the period.
9
Figure 11 Domestic unlisted and global listed
0
0.5
1
1.5
2
2.5
3
3.5
4
Unlisted Listed
Dec
02
Dec
03
Dec
04
Dec
05
Dec
06
Dec
07
Dec
08
Dec
09
Dec
10
Dec
11
Dec
12
Source: Consilia Capital, Bloomberg. For further details on how performance has been calculated, please contact Consilia Capital.
Figure 12 Domestic unlisted and global listed - quarterly
-20
-15
-10
-5
0
5
10
15
20
Unlisted Listed
Dec
02
Jan
04
Feb
05
Mar
06
Apr
07
May
08
Jun
09
Jul 1
0
Aug
11
Sep
12
Source: Consilia Capital, Bloomberg. For further details on how performance has been calculated, please contact Consilia Capital.
Annual changes %
Unlisted Listed 70/30 Change %
2008 21.40 -33.51 4.93 -16.47
2009 -16.31 26.33 -3.52 12.79
2010 11.02 8.31 10.21 -0.81
2011 8.07 7.27 7.83 -0.24
2012 8.70 13.07 10.01 1.31
2013 8.15 9.49 8.55 0.40
Source: Consilia Capital, Bloomberg. For further details on how performance has been calculated, please contact Consilia Capital.
Figure 10 Listed v.s. unlisted performance
10
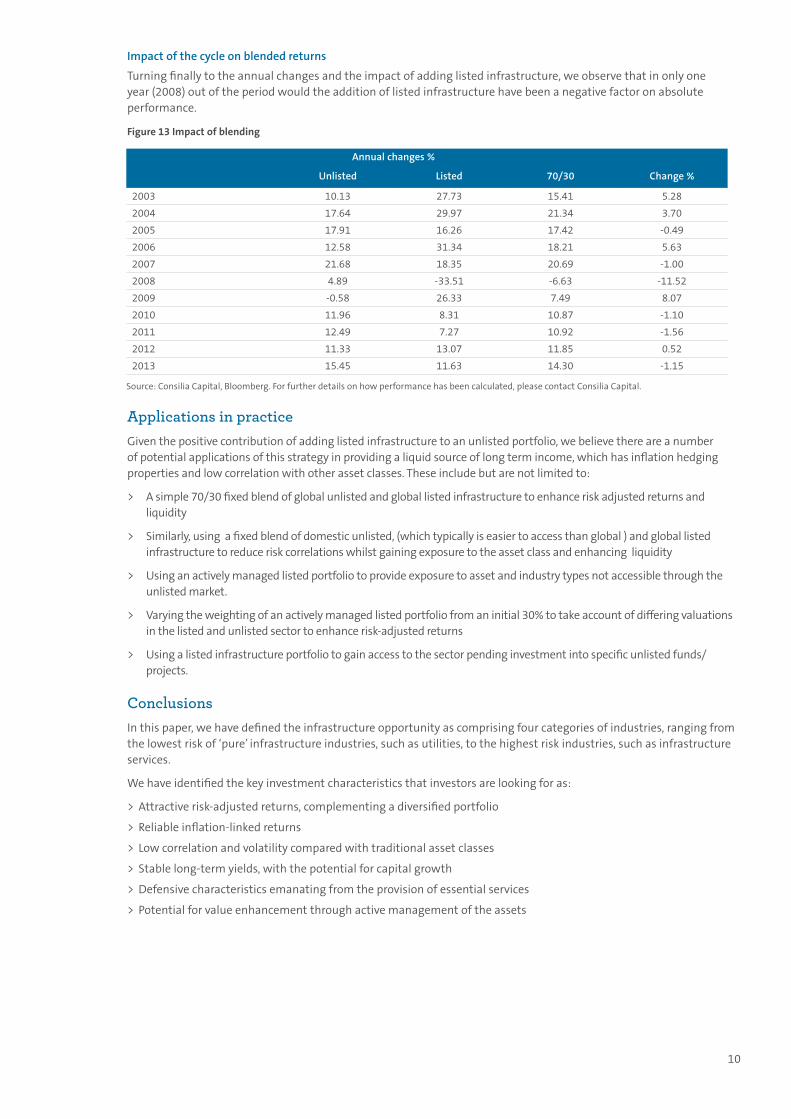
Impact of the cycle on blended returns
Turning finally to the annual changes and the impact of adding listed infrastructure, we observe that in only one year (2008) out of the period would the addition of listed infrastructure have been a negative factor on absolute performance.
Figure 13 Impact of blending
Applications in practiceGiven the positive contribution of adding listed infrastructure to an unlisted portfolio, we believe there are a number of potential applications of this strategy in providing a liquid source of long term income, which has inflation hedging properties and low correlation with other asset classes. These include but are not limited to:
> A simple 70/30 fixed blend of global unlisted and global listed infrastructure to enhance risk adjusted returns and liquidity
> Similarly, using a fixed blend of domestic unlisted, (which typically is easier to access than global ) and global listed infrastructure to reduce risk correlations whilst gaining exposure to the asset class and enhancing liquidity
> Using an actively managed listed portfolio to provide exposure to asset and industry types not accessible through the unlisted market.
> Varying the weighting of an actively managed listed portfolio from an initial 30% to take account of differing valuations in the listed and unlisted sector to enhance risk-adjusted returns
> Using a listed infrastructure portfolio to gain access to the sector pending investment into specific unlisted funds/projects.
ConclusionsIn this paper, we have defined the infrastructure opportunity as comprising four categories of industries, ranging from the lowest risk of ‘pure’ infrastructure industries, such as utilities, to the highest risk industries, such as infrastructure services.
We have identified the key investment characteristics that investors are looking for as:
> Attractive risk-adjusted returns, complementing a diversified portfolio
> Reliable inflation-linked returns
> Low correlation and volatility compared with traditional asset classes
> Stable long-term yields, with the potential for capital growth
> Defensive characteristics emanating from the provision of essential services
> Potential for value enhancement through active management of the assets
Annual changes %
Unlisted Listed 70/30 Change %
2003 10.13 27.73 15.41 5.28
2004 17.64 29.97 21.34 3.70
2005 17.91 16.26 17.42 -0.49
2006 12.58 31.34 18.21 5.63
2007 21.68 18.35 20.69 -1.00
2008 4.89 -33.51 -6.63 -11.52
2009 -0.58 26.33 7.49 8.07
2010 11.96 8.31 10.87 -1.10
2011 12.49 7.27 10.92 -1.56
2012 11.33 13.07 11.85 0.52
2013 15.45 11.63 14.30 -1.15
Source: Consilia Capital, Bloomberg. For further details on how performance has been calculated, please contact Consilia Capital.
11
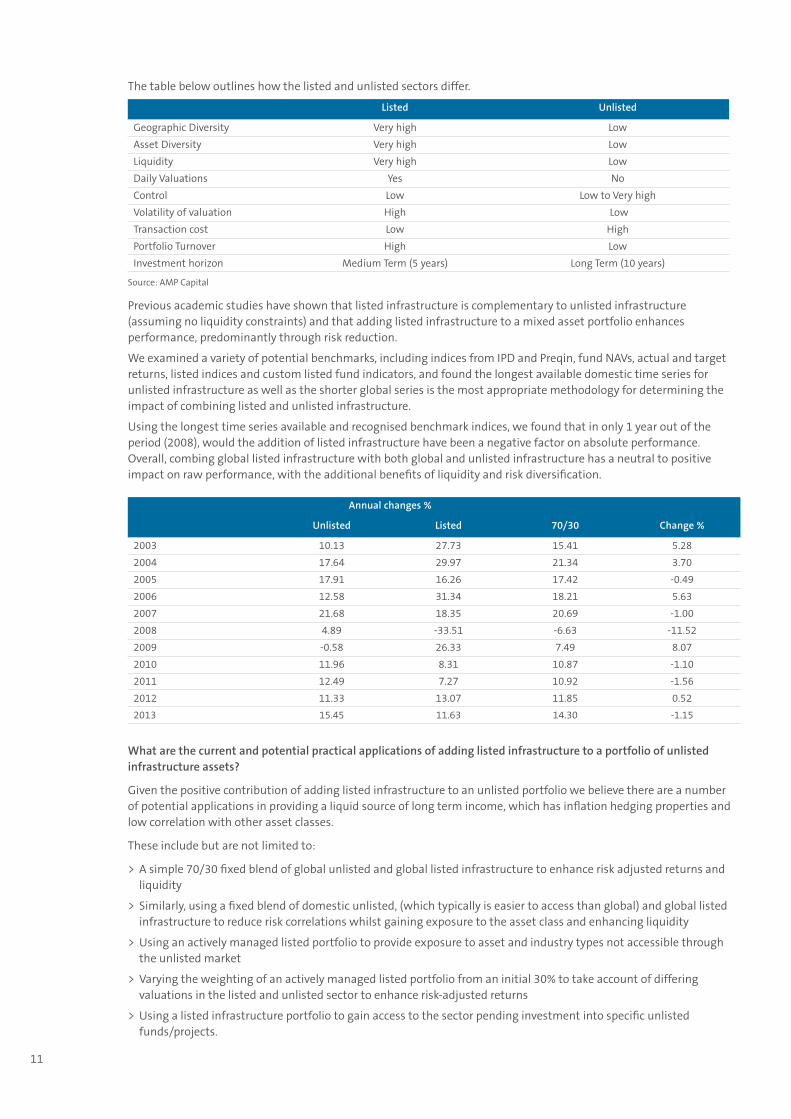
The table below outlines how the listed and unlisted sectors differ.
Previous academic studies have shown that listed infrastructure is complementary to unlisted infrastructure (assuming no liquidity constraints) and that adding listed infrastructure to a mixed asset portfolio enhances performance, predominantly through risk reduction.
We examined a variety of potential benchmarks, including indices from IPD and Preqin, fund NAVs, actual and target returns, listed indices and custom listed fund indicators, and found the longest available domestic time series for unlisted infrastructure as well as the shorter global series is the most appropriate methodology for determining the impact of combining listed and unlisted infrastructure.
Using the longest time series available and recognised benchmark indices, we found that in only 1 year out of the period (2008), would the addition of listed infrastructure have been a negative factor on absolute performance. Overall, combing global listed infrastructure with both global and unlisted infrastructure has a neutral to positive impact on raw performance, with the additional benefits of liquidity and risk diversification.
Annual changes %
Unlisted Listed 70/30 Change %
2003 10.13 27.73 15.41 5.28
2004 17.64 29.97 21.34 3.70
2005 17.91 16.26 17.42 -0.49
2006 12.58 31.34 18.21 5.63
2007 21.68 18.35 20.69 -1.00
2008 4.89 -33.51 -6.63 -11.52
2009 -0.58 26.33 7.49 8.07
2010 11.96 8.31 10.87 -1.10
2011 12.49 7.27 10.92 -1.56
2012 11.33 13.07 11.85 0.52
2013 15.45 11.63 14.30 -1.15
Source: AMP Capital
Listed Unlisted
Geographic Diversity Very high Low
Asset Diversity Very high Low
Liquidity Very high Low
Daily Valuations Yes No
Control Low Low to Very high
Volatility of valuation High Low
Transaction cost Low High
Portfolio Turnover High Low
Investment horizon Medium Term (5 years) Long Term (10 years)
What are the current and potential practical applications of adding listed infrastructure to a portfolio of unlisted infrastructure assets?
Given the positive contribution of adding listed infrastructure to an unlisted portfolio we believe there are a number of potential applications in providing a liquid source of long term income, which has inflation hedging properties and low correlation with other asset classes.
These include but are not limited to:
> A simple 70/30 fixed blend of global unlisted and global listed infrastructure to enhance risk adjusted returns and liquidity
> Similarly, using a fixed blend of domestic unlisted, (which typically is easier to access than global) and global listed infrastructure to reduce risk correlations whilst gaining exposure to the asset class and enhancing liquidity
> Using an actively managed listed portfolio to provide exposure to asset and industry types not accessible through the unlisted market
> Varying the weighting of an actively managed listed portfolio from an initial 30% to take account of differing valuations in the listed and unlisted sector to enhance risk-adjusted returns
> Using a listed infrastructure portfolio to gain access to the sector pending investment into specific unlisted funds/projects.

12
ReferencesBachher, J, Orr, R. and Settel D. (2012), Benchmarks for Unlisted Infrastructure, CFA Institute.
Bailey, Jeffrey V. (1992a) Are Manager Universes Acceptable Performance Benchmarks? Journal of Portfolio Management, vol.18, no.3 (spring):9-12.
Bailey, Jeffrey V. (1992b). Evaluating Benchmark Quality, Financial Analysts Journal, vol 48, no 3 (May/June):33-39.
Foster P. (2007), Infrastructure Investment: Crossing the divide from Asset to Investment Characteristics Portfolio Construction Conference, Sydney.
Moss A., Farrelly K, (2013), The performance implications of adding global listed real estate to an unlisted real estate portfolio: A case study for UK Defined Contribution funds. EPRA.
Moss A, Baum A, (2012), Are listed real estate stocks managed as part of the real estate allocation?, EPRA.
Moss A., Baum A., (2012), The use of listed real estate securities in asset management. A literature review and summary of current practical applications, EPRA.
Oyedele J., Adair A., & McGreal S. (2014), Performance of Global listed infrastructure investment in a mixed asset portfolio, Journal of Property Research, 31:1, 1-25.
Newell G., Peng & De Francesco (2011), The Performance of unlisted infrastructure in investment portfolios, Journal of Property Research, 28:1, 59-74.

All investing involves risk, and you should consider investment risks before making an investment decision. One of the key risks of investing in infrastructure assets is illiquidity, and it should be noted that this risk still remains even if listed and unlisted infrastructure assets are blended. While every care has been taken in the preparation of this paper, AMP Capital Investors Limited (ABN 59 001 777 591, AFSL 232497) and makes no representation or warranty as to the accuracy or completeness of any statement in it including, without limitation, any forecasts. Past performance is not a reliable indicator of future performance. This paper has been prepared for the purpose of providing general information, without taking account of any particular investor’s objectives, financial situation or needs. An investor should, before making any investment decisions, consider the appropriateness of the information in this paper, and seek professional advice, having regard to the investor’s objectives, financial situation and needs. This paper is solely for the use of the party to whom it is provided and must not be provided to any other person or entity without the express written consent of AMP Capital.
This paper, unless otherwise specified, is current at the date of publication and will not be updated or otherwise revised to reflect information that subsequently becomes available, or circumstances existing or changes occurring after that date.