linear equations in two variables and their graphs...
TRANSCRIPT
Confirming Pages
Linear Equations in TwoVariables and Their GraphsIf you pick up any package of food and read the label, you will find a long list that
usually ends with some mysterious looking names. Many of these strange
elements are food additives. A food additive is a substance or a mixture of
substances other than basic foodstuffs that is present in food as a result of
production, processing, storage, or packaging. They can be natural or synthetic
and are categorized in many ways: preservatives, coloring agents, processing aids,
and nutritional supplements, to name a few.
Food additives have been around since prehistoric humans discovered that
salt would help to preserve meat. Today, food additives can include simple
ingredients such as red color from Concord grape skins, calcium, or an enzyme.
Throughout the centuries there
have been lively discussions on
what is healthy to eat. At the
present time the food industry
is working to develop foods that
have less cholesterol, fats, and
other unhealthy ingredients.
Although they frequently
have different viewpoints, the
food industry and the Food and
Drug Administration (FDA) are
working to provide consumers
with information on a healthier
diet. Recent developments such
as the synthetically engineered
tomatostirredgreatcontroversy,
even though the FDA declared
the tomato safe to eat.
3.1 Graphing Lines in theCoordinate Plane
3.2 Slope
3.3 Equations of Lines inSlope-Intercept Form
3.4 The Point-Slope Form
3.5 Variation
3.6Graphing LinearInequalities in TwoVariables
3Chapter
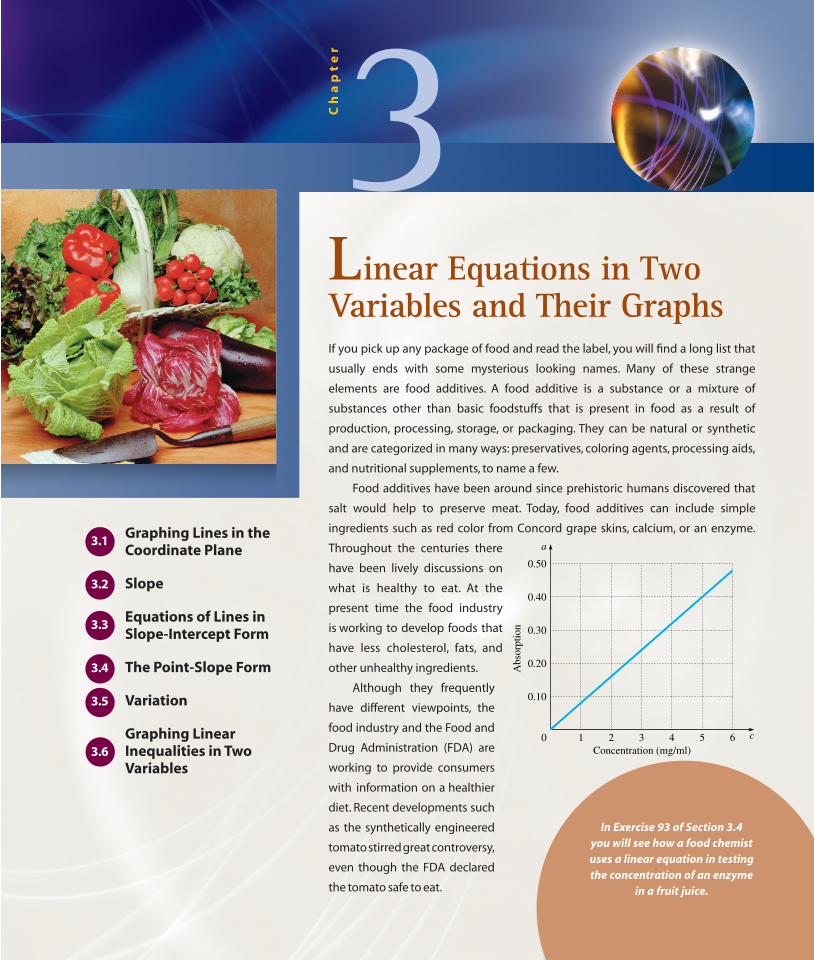
In Exercise 93 of Section 3.4 you will see how a food chemistuses a linear equation in testingthe concentration of an enzyme
in a fruit juice.
c
a
1 2 3 4 5 6Concentration (mg/ml)
0
0.10
0.20
0.30
0.40
0.50
Abs
orpt
ion
dug33491_ch03a.qxd 9/14/07 3:51 PM Page 171
Confirming Pages
172 Chapter 3 Linear Equations in Two Variables and Their Graphs 3-2
In This Section
U1V Ordered Pairs
U2V The Rectangular CoordinateSystem
U3V Plotting Points
U4V Graphing a Linear Equationin Two Variables
U5V Graphing a Line UsingIntercepts
U6V Applications
3.1 Graphing Lines in the Coordinate Plane
In Chapter 1 you learned to graph numbers on a number line.We also used numberlines to illustrate the solution to inequalities in Chapter 2. In this section, you willlearn to graph pairs of numbers in a coordinate system made up of a pair of numberlines. We will use this coordinate system to illustrate the solution to equations andinequalities in two variables.
U1V Ordered PairsThe equation y � 2x � 1 is an equation in two variables. This equation is satisfied ifwe choose a value for x and a value for y that make it true. If we choose x � 2 andy � 3, then y � 2x � 1 becomes
y x
↓ ↓3 � 2(2) � 13 � 3.
Because the last statement is true, we say that the pair of numbers 2 and 3 satisfies theequation or is a solution to the equation. We use the ordered pair (2, 3) to representx � 2 and y � 3. The format is to always write the value for x first and the value for ysecond. The numbers in an ordered pair are called coordinates. In the pair (2, 3) thefirst coordinate or x-coordinate is 2 and the second coordinate or y-coordinate is 3.
The ordered pair (3, 2) does not satisfy y � 2x � 1, because for x � 3and y � 2, we have
2 � 2(3) � 1.
The variable corresponding to the first coordinate of an ordered pair is called theindependent variable and the variable corresponding to the second coordinate is calledthe dependent variable. The value for the first coordinate is selected arbitrarily and thevalue for the second coordinate is determined from the first coordinate by a rule suchas y � 2x � 1. Of course, if the ordered pair must satisfy a simple equation, then wecan find either coordinate when given the other coordinate.
CAUTION
U Helpful Hint V
In this chapter, you will be doing a lotof graphing. Using graph paper willhelp you understand the conceptsand help you recognize errors. Foryour convenience, a page of graphpaper can be found on page 252 ofthis text. Make as many copies of it as you wish.
E X A M P L E 1 Finding solutions to an equationEach of the ordered pairs below is missing one coordinate. Complete each ordered pair sothat it satisfies the equation y � �3x � 4.
a) (2, ) b) ( , �5) c) (0, )
Solutiona) The x-coordinate of (2, ) is 2. Let x � 2 in the equation y � �3x � 4:
y � �3 � 2 � 4
� �6 � 4
� �2
The ordered pair (2, �2) satisfies the equation.
dug33491_ch03a.qxd 9/14/07 3:51 PM Page 172
Confirming Pages
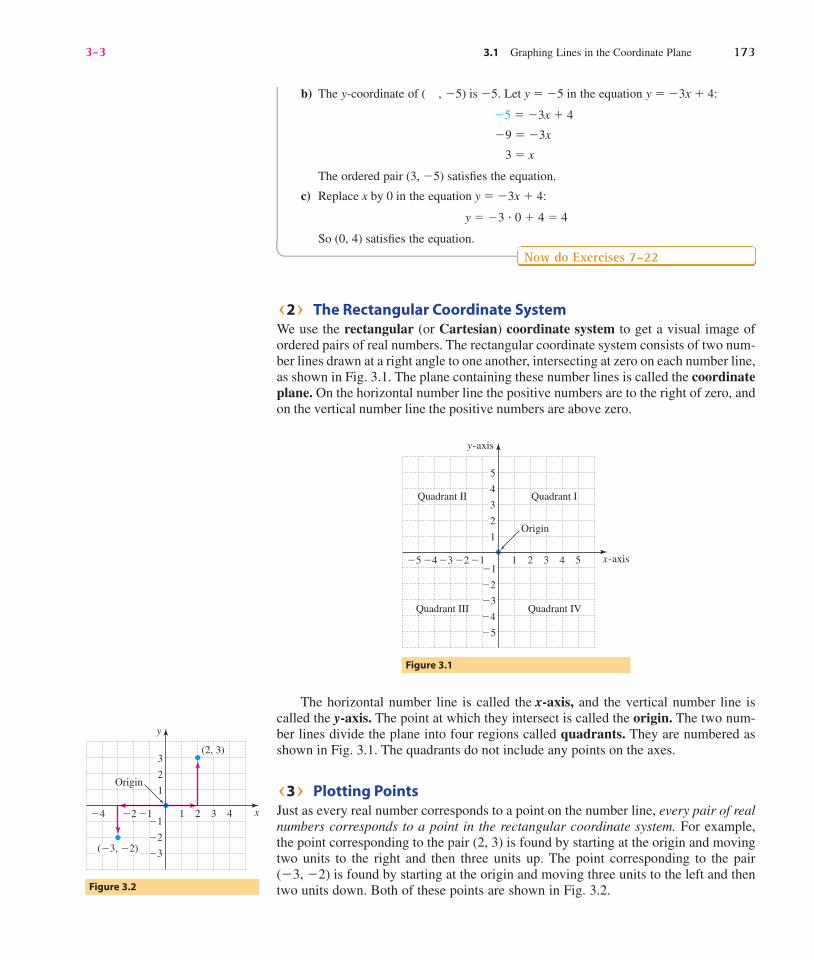
U2V The Rectangular Coordinate SystemWe use the rectangular (or Cartesian) coordinate system to get a visual image ofordered pairs of real numbers. The rectangular coordinate system consists of two num-ber lines drawn at a right angle to one another, intersecting at zero on each number line,as shown in Fig. 3.1. The plane containing these number lines is called the coordinateplane. On the horizontal number line the positive numbers are to the right of zero, andon the vertical number line the positive numbers are above zero.
The horizontal number line is called the x-axis, and the vertical number line iscalled the y-axis. The point at which they intersect is called the origin. The two num-ber lines divide the plane into four regions called quadrants. They are numbered asshown in Fig. 3.1. The quadrants do not include any points on the axes.
U3V Plotting PointsJust as every real number corresponds to a point on the number line, every pair of realnumbers corresponds to a point in the rectangular coordinate system. For example,the point corresponding to the pair (2, 3) is found by starting at the origin and movingtwo units to the right and then three units up. The point corresponding to the pair(�3, �2) is found by starting at the origin and moving three units to the left and thentwo units down. Both of these points are shown in Fig. 3.2.
Figure 3.1
y-axis
x-axis�5 4 5�1
�2
�3
�4
1
3
2 3
�5
2
1
4
5
Quadrant II Quadrant I
Origin
Quadrant IVQuadrant III
�1�3�4 �2
3-3 3.1 Graphing Lines in the Coordinate Plane 173
b) The y-coordinate of ( , �5) is �5. Let y � �5 in the equation y � �3x � 4:
�5 � �3x � 4
�9 � �3x
3 � x
The ordered pair (3, �5) satisfies the equation.
c) Replace x by 0 in the equation y � �3x � 4:
y � �3 � 0 � 4 � 4
So (0, 4) satisfies the equation.
Now do Exercises 7–22
Figure 3.2
y
x�1�4 4�1
�2
�3
1
3
3�2
2
1
2
(2, 3)
(�3, �2)
Origin
dug33491_ch03a.qxd 9/14/07 3:51 PM Page 173

Confirming Pages
When we locate a point in the rectangular coordinate system, we are plotting orgraphing the point. Because ordered pairs of numbers correspond to points in thecoordinate plane, we frequently refer to an ordered pair as a point.
174 Chapter 3 Linear Equations in Two Variables and Their Graphs 3-4
E X A M P L E 2 Plotting pointsPlot the points (2, 5), (�1, 4), (�3, �4), and (3, �2).
SolutionTo locate (2, 5), start at the origin, move two units to the right, and then move up five units.To locate (�1, 4), start at the origin, move one unit to the left, and then move up four units.All four points are shown in Fig. 3.3.
Now do Exercises 23–50
Figure 3.3
y
x�1�4 4�1
�2
�3
1
3
3�2
2
1
2�3
�4
�5
4
5(2, 5)(�1, 4)
(3, �2)
(�3, �4)
U4V Graphing a Linear Equation in Two VariablesIn Chapter 2 we defined a linear equation in one variable as an equation of the formax � b, where a � 0. Every linear equation in one variable has a single real numberin its solution set. The graph of the solution set is a single point on the number line. Alinear equation in two variables is defined similarly.
Linear Equation in Two Variables
A linear equation in two variables is an equation of the form
Ax � By � C,
where A and B are not both zero.
Consider the linear equation �2x � y � �1. It is simple to find ordered pairs thatsatisfy the equation if it is solved for y as y � 2x � 1. Now if x is replaced by 4, we gety � 2 � 4 � 1 � 7. So the ordered pair (4, 7) satisfies this equation. Since there are infi-nitely many real numbers that could be used for x, there are infinitely many orderedpairs in the solution set. To get a better understanding of the solution set to a linear equa-tion we look at its graph. It can be proved that the graph of the solution set is a straight
dug33491_ch03a.qxd 9/14/07 3:51 PM Page 174
Confirming Pages
line in the coordinate plane. We will not prove this statement. Proving it requires a geo-metric definition of a straight line and is beyond the scope of this text. However, it iseasy to graph the straight line by simply plotting a selection of points from the solutionset and drawing a straight line through the points, as shown in Example 3.
3-5 3.1 Graphing Lines in the Coordinate Plane 175
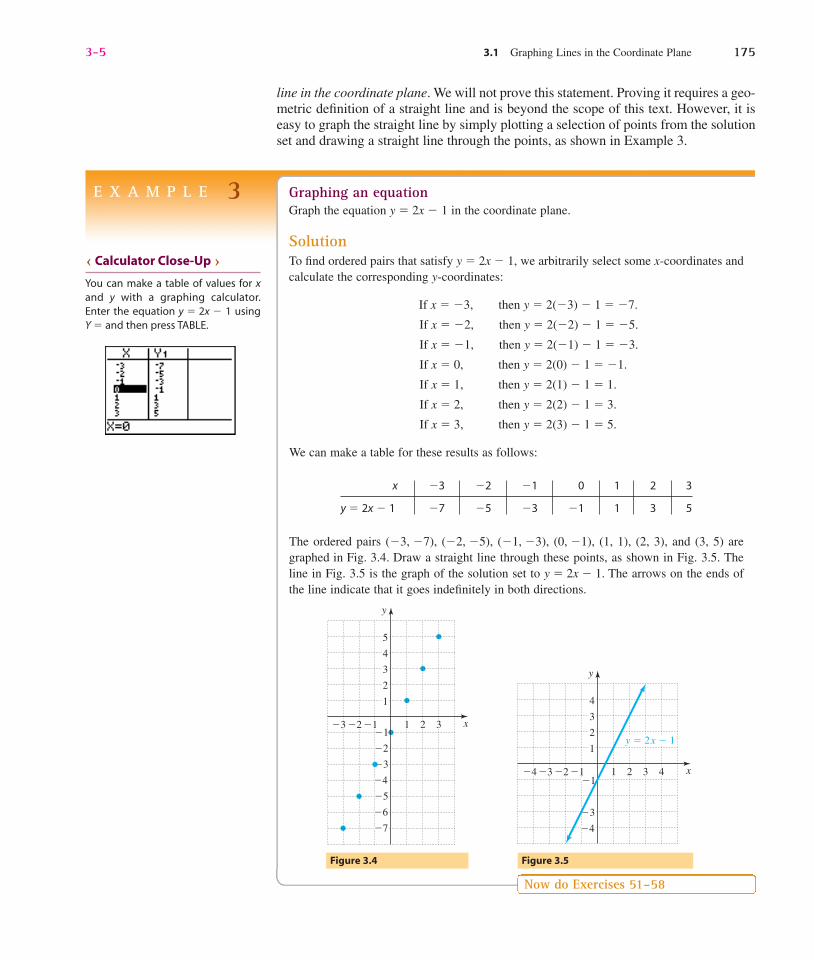
E X A M P L E 3 Graphing an equationGraph the equation y � 2x � 1 in the coordinate plane.
SolutionTo find ordered pairs that satisfy y � 2x � 1, we arbitrarily select some x-coordinates andcalculate the corresponding y-coordinates:
If x � �3, then y � 2(�3) � 1 � �7.
If x � �2, then y � 2(�2) � 1 � �5.
If x � �1, then y � 2(�1) � 1 � �3.
If x � 0, then y � 2(0) � 1 � �1.
If x � 1, then y � 2(1) � 1 � 1.
If x � 2, then y � 2(2) � 1 � 3.
If x � 3, then y � 2(3) � 1 � 5.
We can make a table for these results as follows:
The ordered pairs (�3, �7), (�2, �5), (�1, �3), (0, �1), (1, 1), (2, 3), and (3, 5) aregraphed in Fig. 3.4. Draw a straight line through these points, as shown in Fig. 3.5. Theline in Fig. 3.5 is the graph of the solution set to y � 2x � 1. The arrows on the ends ofthe line indicate that it goes indefinitely in both directions.
Now do Exercises 51–58
Figure 3.5Figure 3.4
y
x�1 1
2
1
2
�4
3
�14�2�3�4 3
4
�3
y � 2x � 1�1
y
x�1
�2
1
3
3�2
2
1
2�3
�4
�5
4
5
�6
�7
�3
x �3 �2 �1 0 1 2 3
y � 2x � 1 �7 �5 �3 �1 1 3 5
U Calculator Close-Up V
You can make a table of values for xand y with a graphing calculator.Enter the equation y � 2x � 1 usingY � and then press TABLE.
dug33491_ch03a.qxd 9/14/07 3:51 PM Page 175
Confirming Pages
A linear equation in two variables is an equation of the form Ax � By � C, whereA and B are not both zero. Note that we can have A � 0 if B � 0, and we can haveB � 0 with A � 0. So equations such as x � 8 and y � 2 are linear equations.Equations such as x � y � 5 � 0 and y � 2x � 3 are also called linear equationsbecause they could be rewritten in the form Ax � By � C. Equations such as
y � 2x2 or y � �5x
� are not linear equations.
176 Chapter 3 Linear Equations in Two Variables and Their Graphs 3-6
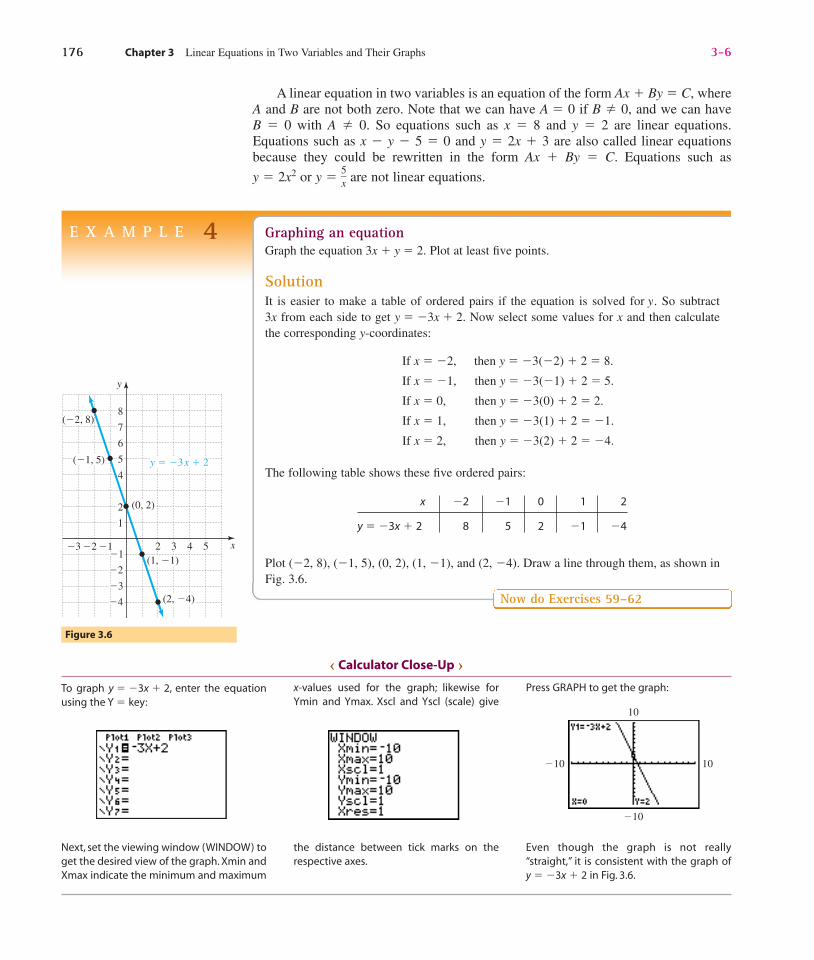
E X A M P L E 4 Graphing an equationGraph the equation 3x � y � 2. Plot at least five points.
SolutionIt is easier to make a table of ordered pairs if the equation is solved for y. So subtract3x from each side to get y � �3x � 2. Now select some values for x and then calculatethe corresponding y-coordinates:
If x � �2, then y � �3(�2) � 2 � 8.
If x � �1, then y � �3(�1) � 2 � 5.
If x � 0, then y � �3(0) � 2 � 2.
If x � 1, then y � �3(1) � 2 � �1.
If x � 2, then y � �3(2) � 2 � �4.
The following table shows these five ordered pairs:
Plot (�2, 8), (�1, 5), (0, 2), (1, �1), and (2, �4). Draw a line through them, as shown inFig. 3.6.
Now do Exercises 59–62
x �2 �1 0 1 2
y � �3x � 2 8 5 2 �1 �4
Figure 3.6
y
x�1
�2
3�2
2
1
2�3
�4
4
5
�3
�14 5
6
7
8
y � �3x � 2
(�2, 8)
(�1, 5)
(0, 2)
(1, �1)
(2, �4)
U Calculator Close-Up V
To graph y � �3x � 2, enter the equationusing the Y � key:
x-values used for the graph; likewise forYmin and Ymax. Xscl and Yscl (scale) give
Press GRAPH to get the graph:
Next, set the viewing window (WINDOW) toget the desired view of the graph. Xmin andXmax indicate the minimum and maximum
the distance between tick marks on therespective axes.
Even though the graph is not really“straight,” it is consistent with the graph ofy � �3x � 2 in Fig. 3.6.
�10
10
10�10
dug33491_ch03a.qxd 9/14/07 3:51 PM Page 176

Confirming Pages
If x � 3 occurs in the context of equations in a single variable, then x � 3has only one solution, 3. In the context of equations in two variables,x � 3 is assumed to be a simplified form of x � 0 � y � 3, and it has infi-nitely many solutions (all of the ordered pairs on the line in Fig. 3.8).
All of the equations we have considered so far have involved single-digitnumbers. If an equation involves large numbers, then we must change the scale on thex-axis, the y-axis, or both to accommodate the numbers involved. The change of scaleis arbitrary, and the graph will look different for different scales.
CAUTION
3-7 3.1 Graphing Lines in the Coordinate Plane 177
E X A M P L E 5 Horizontal and vertical linesGraph each linear equation.
a) y � 4 b) x � 3
Solutiona) The equation y � 4 is a simplification of 0 � x � y � 4. So if y is replaced with 4,
then we can use any real number for x. For example, (�1, 4) satisfies 0 � x � y � 4because 0(�1) � 4 � 4 is correct. The following table shows five ordered pairsthat satisfy y � 4.
Figure 3.7 shows a horizontal line through these points.
b) The equation x � 3 is a simplification of x � 0 � y � 3. So if x is replacedwith 3, then we can use any real number for y. For example,(3, �2) satisfies x � 0 � y � 3 because 3 � 0(�2) � 3 is correct.The following table shows five ordered pairs that satisfy x � 3.
Figure 3.8 shows a vertical line through these points.
Now do Exercises 63–74
Figure 3.8Figure 3.7
y
x�1
�2
1
2
1
2
�4
3
�3
�14 5
x � 3(3, 2)
(3, �2)
y
x�1 3�2
2
3
1
21�3�4
5
4
y � 4
(�2, 4) (2, 4)
x � 3 3 3 3 3 3
y �2 �1 0 1 2
x �2 �1 0 1 2
y � 4 4 4 4 4 4
U Calculator Close-Up V
You cannot graph the vertical linex � 3 on most graphing calculators.The only equations that can begraphed are ones in which y is writtenin terms of x.
dug33491_ch03a.qxd 9/14/07 3:51 PM Page 177
Confirming Pages
U5V Graphing a Line Using InterceptsWe know that the graph of a linear equation is a straight line. Because it takes onlytwo points to determine a line, we can graph a linear equation using only two points.The two points that are the easiest to locate are usually the points where the line crossesthe axes. The point where the graph crosses the x-axis is the x-intercept. They-coordinate of the x-intercept is zero. The point where the graph crosses the y-axis isthe y-intercept. The x-coordinate of the y-intercept is zero.
178 Chapter 3 Linear Equations in Two Variables and Their Graphs 3-8
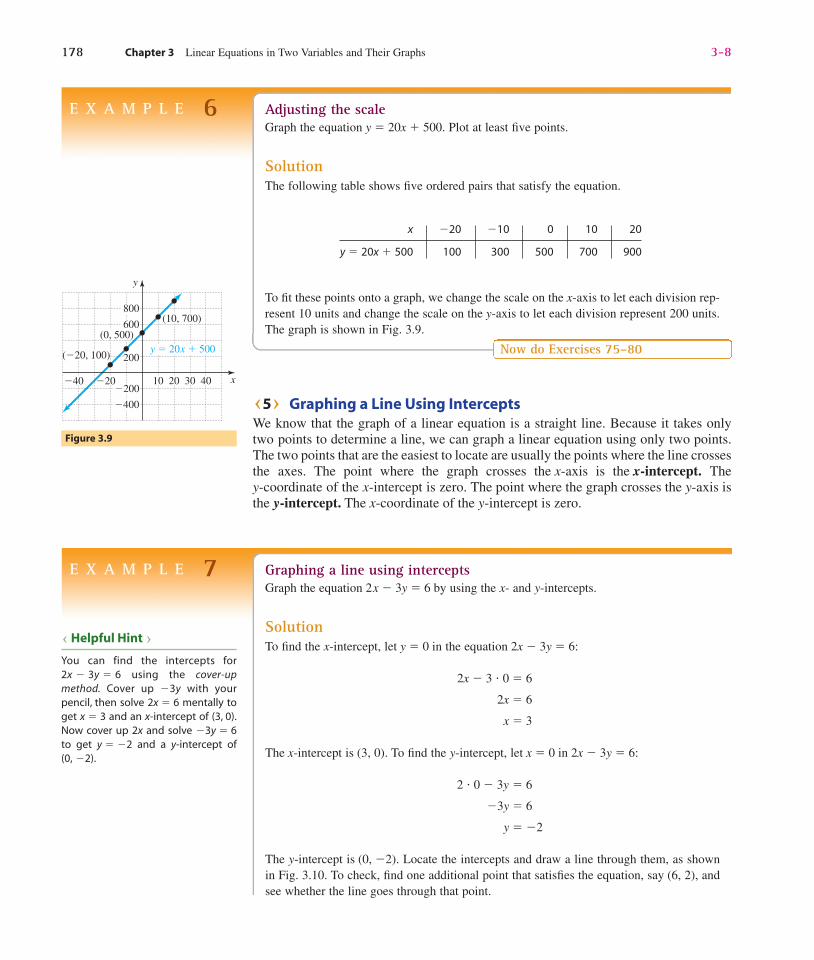
E X A M P L E 6 Adjusting the scaleGraph the equation y � 20x � 500. Plot at least five points.
SolutionThe following table shows five ordered pairs that satisfy the equation.
To fit these points onto a graph, we change the scale on the x-axis to let each division rep-resent 10 units and change the scale on the y-axis to let each division represent 200 units.The graph is shown in Fig. 3.9.
Now do Exercises 75–80
x �20 �10 0 10 20
y � 20x � 500 100 300 500 700 900
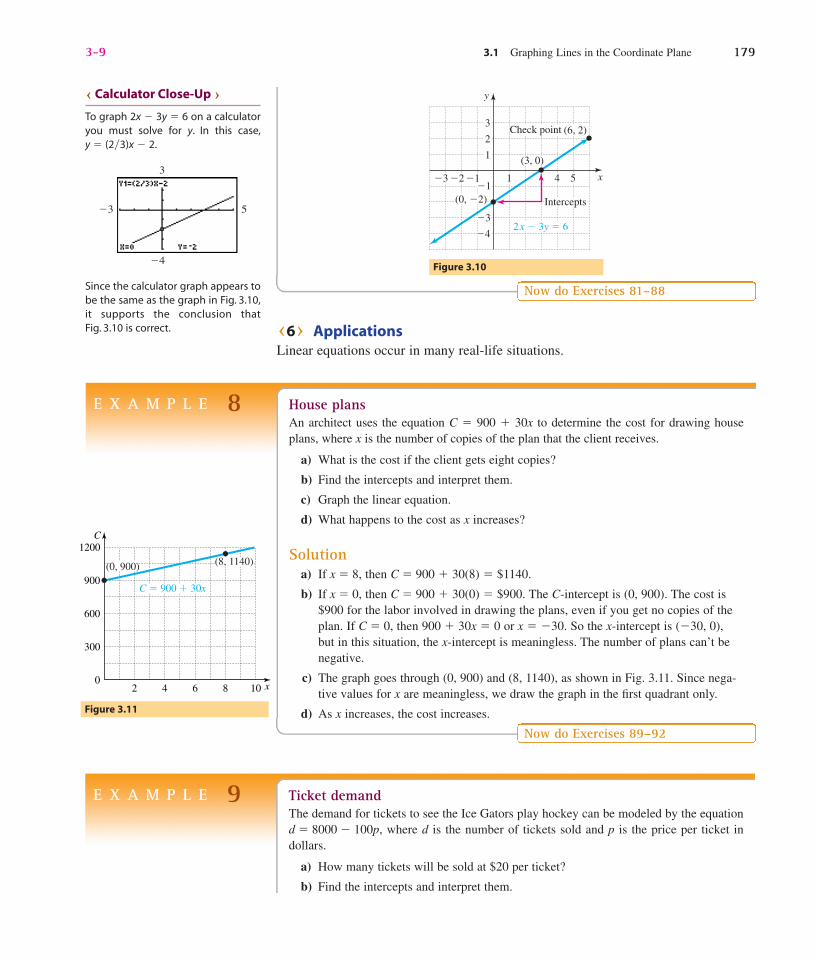
E X A M P L E 7 Graphing a line using interceptsGraph the equation 2x � 3y � 6 by using the x- and y-intercepts.
SolutionTo find the x-intercept, let y � 0 in the equation 2x � 3y � 6:
2x � 3 � 0 � 6
2x � 6
x � 3
The x-intercept is (3, 0). To find the y-intercept, let x � 0 in 2x � 3y � 6:
2 � 0 � 3y � 6
�3y � 6
y � �2
The y-intercept is (0, �2). Locate the intercepts and draw a line through them, as shownin Fig. 3.10. To check, find one additional point that satisfies the equation, say (6, 2), andsee whether the line goes through that point.
Figure 3.9
y
x10 20 4030�40
�400
�200
800
200y � 20x � 500
(�20, 100)
(0, 500)
(10, 700)600
�20
U Helpful Hint V
You can find the intercepts for2x � 3y � 6 using the cover-upmethod. Cover up �3y with yourpencil, then solve 2x � 6 mentally toget x � 3 and an x-intercept of (3, 0).Now cover up 2x and solve �3y � 6to get y � �2 and a y-intercept of(0, �2).
dug33491_ch03a.qxd 9/14/07 3:51 PM Page 178
Confirming Pages
U6V ApplicationsLinear equations occur in many real-life situations.
3-9 3.1 Graphing Lines in the Coordinate Plane 179
Now do Exercises 81–88
Figure 3.10
y
x�1 1
2
1
�4
3
�14 5�2�3
�32x � 3y � 6
(0, �2)
(6, 2)Check point
Intercepts
(3, 0)
U Calculator Close-Up V
To graph 2x � 3y � 6 on a calculatoryou must solve for y. In this case,y � (2�3)x � 2.
Since the calculator graph appears tobe the same as the graph in Fig. 3.10,it supports the conclusion thatFig. 3.10 is correct.
3
�4
�3 5
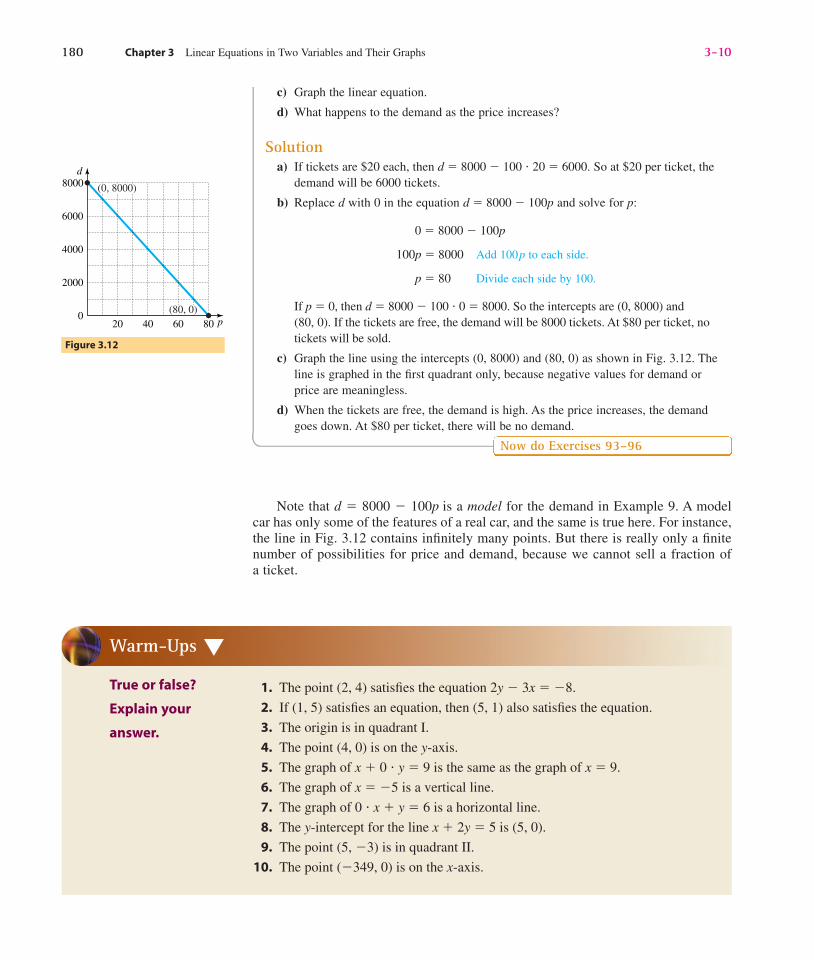
E X A M P L E 8 House plansAn architect uses the equation C � 900 � 30x to determine the cost for drawing houseplans, where x is the number of copies of the plan that the client receives.
a) What is the cost if the client gets eight copies?
b) Find the intercepts and interpret them.
c) Graph the linear equation.
d) What happens to the cost as x increases?
Solutiona) If x � 8, then C � 900 � 30(8) � $1140.
b) If x � 0, then C � 900 � 30(0) � $900. The C-intercept is (0, 900). The cost is$900 for the labor involved in drawing the plans, even if you get no copies of theplan. If C � 0, then 900 � 30x � 0 or x � �30. So the x-intercept is (�30, 0),but in this situation, the x-intercept is meaningless. The number of plans can’t benegative.
c) The graph goes through (0, 900) and (8, 1140), as shown in Fig. 3.11. Since nega-tive values for x are meaningless, we draw the graph in the first quadrant only.
d) As x increases, the cost increases.
Now do Exercises 89–92
Figure 3.11
x
C
2 4 6 8 100
300
600
900
1200
(0, 900) (8, 1140)
C � 900 � 30x
E X A M P L E 9 Ticket demandThe demand for tickets to see the Ice Gators play hockey can be modeled by the equationd � 8000 � 100p, where d is the number of tickets sold and p is the price per ticket indollars.
a) How many tickets will be sold at $20 per ticket?
b) Find the intercepts and interpret them.
dug33491_ch03a.qxd 9/14/07 3:52 PM Page 179
Confirming Pages
180 Chapter 3 Linear Equations in Two Variables and Their Graphs 3-10
Warm-Ups ▼
True or false?
Explain your
answer.
1. The point (2, 4) satisfies the equation 2y � 3x � �8.
2. If (1, 5) satisfies an equation, then (5, 1) also satisfies the equation.
3. The origin is in quadrant I.
4. The point (4, 0) is on the y-axis.
5. The graph of x � 0 � y � 9 is the same as the graph of x � 9.
6. The graph of x � �5 is a vertical line.
7. The graph of 0 � x � y � 6 is a horizontal line.
8. The y-intercept for the line x � 2y � 5 is (5, 0).
9. The point (5, �3) is in quadrant II.
10. The point (�349, 0) is on the x-axis.
Note that d � 8000 � 100p is a model for the demand in Example 9. A modelcar has only some of the features of a real car, and the same is true here. For instance,the line in Fig. 3.12 contains infinitely many points. But there is really only a finitenumber of possibilities for price and demand, because we cannot sell a fraction ofa ticket.
c) Graph the linear equation.
d) What happens to the demand as the price increases?
Solutiona) If tickets are $20 each, then d � 8000 � 100 � 20 � 6000. So at $20 per ticket, the
demand will be 6000 tickets.
b) Replace d with 0 in the equation d � 8000 � 100p and solve for p:
0 � 8000 � 100p
100p � 8000 Add 100p to each side.
p � 80 Divide each side by 100.
If p � 0, then d � 8000 � 100 � 0 � 8000. So the intercepts are (0, 8000) and(80, 0). If the tickets are free, the demand will be 8000 tickets. At $80 per ticket, notickets will be sold.
c) Graph the line using the intercepts (0, 8000) and (80, 0) as shown in Fig. 3.12. Theline is graphed in the first quadrant only, because negative values for demand orprice are meaningless.
d) When the tickets are free, the demand is high. As the price increases, the demandgoes down. At $80 per ticket, there will be no demand.
Now do Exercises 93–96
Figure 3.12
p
d
20 40 60 800
2000
4000
6000
8000 (0, 8000)
(80, 0)
dug33491_ch03a.qxd 9/14/07 3:52 PM Page 180

Confirming Pages
Reading and Writing After reading this section, write outthe answers to these questions. Use complete sentences.
1. What is an ordered pair?
2. What is the rectangular coordinate system?
3. What name is given to the point of intersection of thex-axis and the y-axis?
4. What is the graph of an equation?
5. What is a linear equation in two variables?
6. What are intercepts?
U1V Ordered Pairs
Complete each ordered pair so that it satisfies the givenequation. See Example 1.
7. y � 3x � 9: (0, ), ( , 24), (2, )
8. y � 2x � 5: (8, ), (�1, ), ( , �1)
9. y � �3x � 7: (0, ), ��13
�, �, ( , �5)
10. y � �5x � 3: (�1, ), ���12
�, �, ( , �2)
11. y � 1.2x � 54.3: (0, ), (10, ), ( , 54.9)
12. y � 1.8x � 22.6: (1, ), (�10, ), ( , 22.6)
13. 2x � 3y � 6: (3, ), ( , �2), (12, )
14. 3x � 5y � 0: (�5, ), ( , �3), (10, )
15. 0 � y � x � 5: ( , �3), ( , 5), ( , 0)
16. 0 � x � y � �6: (3, ), (�1, ), (4, )
Use the given equations to find the missing coordinates in thefollowing tables.
17. y � �2x � 5 18. y � �x � 4
19. y � �13
� x � 2 20. y � ��12
� x � 1
21. y � 20x � 400 22. 200x � y � 50
x y
��12�
100
0
0
�12�
x y
�30
0
�10
0
600
x y
�2
�1
1
�12
�
x y
�6
�3
2
3
x y
�2
0
2
0
�2
x y
�2
0
2
�3
�7
Exercises
U Study Tips V• It is a good idea to work with others, but don’t be misled.Working a problem with help is not the same as working a problem on your
own.• Math is personal. Make sure that you can do it.
Boost your grade at mathzone.com!> Practice
Problems> NetTutor
> Self-Tests> e-Professors> Videos
3.1
dug33491_ch03a.qxd 9/14/07 3:52 PM Page 181
Confirming Pages
182 Chapter 3 Linear Equations in Two Variables and Their Graphs 3-12
U3V Plotting Points
Plot the points on a rectangular coordinate system. See Example 2.
23. (1, 5) 24. (4, 3)
25. (�2, 1) 26. (�3, 5)
27. �3, ��12
�� 28. �2, ��13
��29. (�2, �4) 30. (�3, �5)
31. (0, 3) 32. (0, �2)
33. (�3, 0) 34. (5, 0)
35. (�, 1) 36. (�2, �)
37. (1.4, 4) 38. (�3, 0.4)
For each point, name the quadrant in which it lies or the axison which it lies.
39. (�3, 45) 40. (�33, 47) 41. (�3, 0)
42. (0, �9) 43. (�2.36, �5) 44. (89.6, 0)
45. (3.4, 8.8) 46. (4.1, 44) 47. ���12
�, 50�
48. ��6, ��12
�� 49. (0, �99) 50. (�, 0)
U4V Graphing a Linear Equation in Two Variables
Graph each equation. Plot at least five points for each equation.Use graph paper. See Examples 3–5. If you have a graphingcalculator, use it to check your graphs when possible.
51. y � x � 1 52. y � x � 1
53. y � 2x � 1 54. y � 3x � 1
55. y � 3x � 2 56. y � 2x � 3
57. y � x 58. y � �x
59. y � 1 � x 60. y � 2 � x
dug33491_ch03a.qxd 9/14/07 3:52 PM Page 182

Confirming Pages
3-13 3.1 Graphing Lines in the Coordinate Plane 183
61. y � �2x � 3 62. y � �3x � 2
63. y � �3 64. y � 2
65. x � 2 66. x � �4
67. 2x � y � 5 68. 3x � y � 5
69. x � 2y � 4 70. x � 2y � 6
71. x � 3y � 6 72. x � 4y � 5
73. y � 0.36x � 0.4 74. y � 0.27x � 0.42
Graph each equation. Plot at least five points for eachequation. Use graph paper. See Example 6. If you havea graphing calculator, use it to check your graphs.
75. y � x � 1200 76. y � 2x � 3000
77. y � 50x � 2000 78. y � �300x � 4500
dug33491_ch03a.qxd 9/14/07 3:52 PM Page 183
Confirming Pages
184 Chapter 3 Linear Equations in Two Variables and Their Graphs 3-14
79. y � �400x � 2000 80. y � 500x � 3
U5V Graphing a Line Using Intercepts
For each equation, state the x-intercept and y-intercept. Then graph the equation using the intercepts and a third point.See Example 7.
81. 3x � 2y � 6 82. 2x � y � 6
83. x � 4y � 4 84. �2x � y � 4
85. y � �34
� x � 9 86. y � ��12
� x � 5
87. �12
� x � �14
� y � 1 88. �13
� x � �12
� y � 3
U6V Applications
Solve each problem. See Examples 8 and 9.
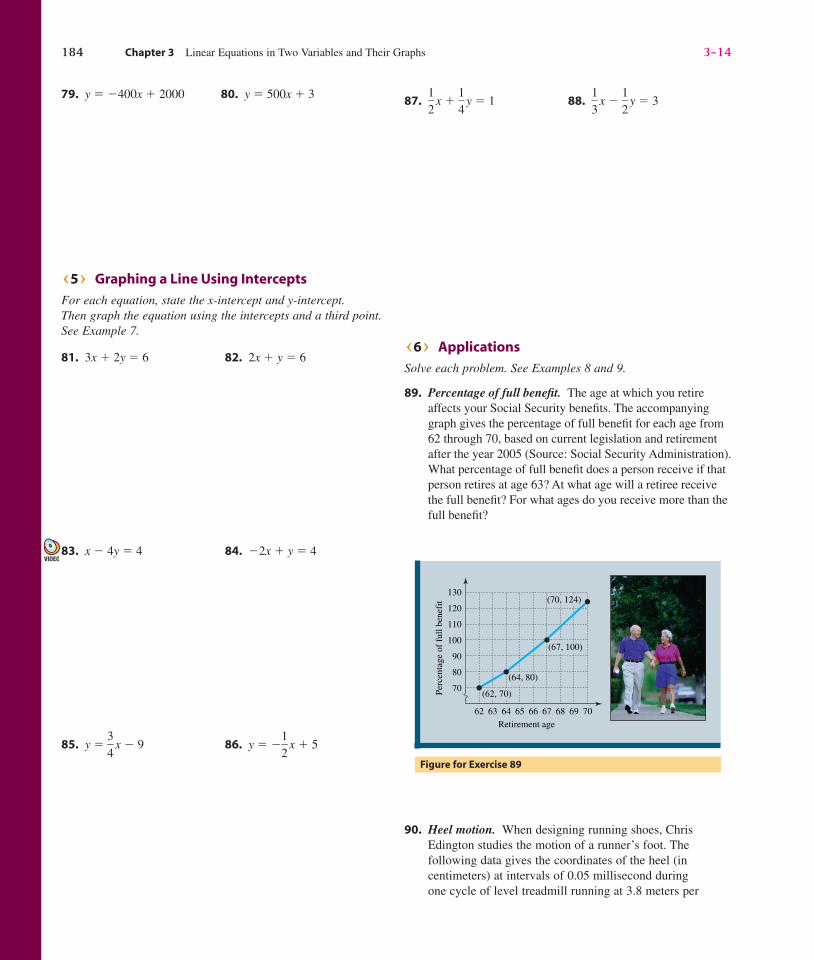
89. Percentage of full benefit. The age at which you retireaffects your Social Security benefits. The accompanyinggraph gives the percentage of full benefit for each age from62 through 70, based on current legislation and retirementafter the year 2005 (Source: Social Security Administration).What percentage of full benefit does a person receive if thatperson retires at age 63? At what age will a retiree receivethe full benefit? For what ages do you receive more than thefull benefit?
Figure for Exercise 89
62 63 64 65 66 67 68 69 70Retirement age
70
80
90
100
110
120
130
Perc
enta
ge o
f fu
ll be
nefi
t (70, 124)
(62, 70)
(64, 80)
(67, 100)
90. Heel motion. When designing running shoes, ChrisEdington studies the motion of a runner’s foot. Thefollowing data gives the coordinates of the heel (incentimeters) at intervals of 0.05 millisecond duringone cycle of level treadmill running at 3.8 meters per
dug33491_ch03a.qxd 9/14/07 3:52 PM Page 184
Confirming Pages
3-15 3.1 Graphing Lines in the Coordinate Plane 185
second (Sagittal Plane Kinematics, Milliron andCavanagh):
(31.7, 5.7), (48.0, 5.7), (68.3, 5.8), (88.9, 6.9),
(107.2, 13.3), (119.4, 24.7), (127.2, 37.8),
(125.7, 52.0), (116.1, 60.2), (102.2, 59.5),
(88.7, 50.2), (73.9, 35.8), (52.6, 20.6),
(29.6, 10.7), (22.4, 5.9)
Graph these ordered pairs to see the heel motion.
91. Medicaid spending. The cost in billions of dollars forfederal Medicaid (health care for the poor) can be modeledby the equation
C � 3.2n � 65.3,
where n is the number of years since 1990 (Health CareFinancing Administration, www.hcfa.gov).
a) What was the cost of federal Medicaid in 2000?b) In what year will the cost reach $150 billion?c) Graph the equation for n ranging from 0 through 20.
92. Dental services. The national cost C in billions of dollarsfor dental services can be modeled by the linear equation
C � 2.85n � 30.52,
where n is the number of years since 1990 (Health CareFinancing Administration, www.hcfa.gov).
a) Find and interpret the C-intercept for the line.b) Find and interpret the n-intercept for the line.c) Graph the line for n ranging from 0 through 20.
d) If this trend continues, then in what year will the cost ofdental services reach 100 billion?
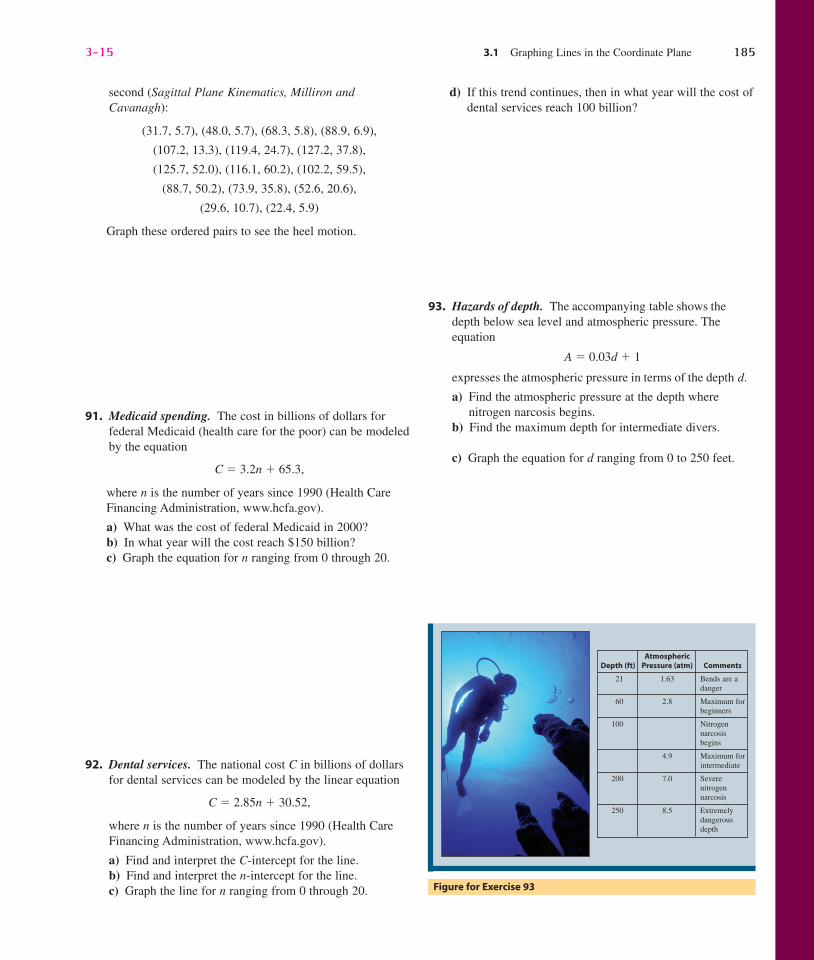
93. Hazards of depth. The accompanying table shows thedepth below sea level and atmospheric pressure. Theequation
A � 0.03d � 1
expresses the atmospheric pressure in terms of the depth d.
a) Find the atmospheric pressure at the depth wherenitrogen narcosis begins.
b) Find the maximum depth for intermediate divers.
c) Graph the equation for d ranging from 0 to 250 feet.
Figure for Exercise 93
AtmosphericDepth (ft) Pressure (atm) Comments
21 1.63 Bends are adanger
60 2.8 Maximum forbeginners
100 Nitrogennarcosis begins
4.9 Maximum forintermediate
200 7.0 Severe nitrogennarcosis
250 8.5 Extremelydangerousdepth
dug33491_ch03a.qxd 9/14/07 3:52 PM Page 185
Confirming Pages
186 Chapter 3 Linear Equations in Two Variables and Their Graphs 3-16
94. Demand equation. Helen’s Health Foods usually sells400 cans of ProPac Muscle Punch per week when the priceis $5 per can. After experimenting with prices for sometime, Helen has determined that the weekly demand canbe found by using the equation
d � 600 � 40p,
where d is the number of cans and p is the price per can.
a) Will Helen sell more or less Muscle Punch if she raisesher price from $5?
b) What happens to her sales every time she raises herprice by $1?
c) Graph the equation.
d) What is the maximum price that she can charge andstill sell at least one can?
95. Advertising blitz. Furniture City in Toronto had $24,000to spend on advertising a year-end clearance sale. A 30-second radio ad costs $300, and a 30-second local televisionad costs $400. To model this situation, the advertisingmanager wrote the equation 300x � 400y � 24,000. Whatdo x and y represent? Graph the equation. How manysolutions are there to the equation, given that the numberof ads of each type must be a whole number?
96. Material allocation. A tent maker had 4500 square yards ofnylon tent material available. It takes 45 square yards ofnylon to make an 8 � 10 tent and 50 square yards to makea 9 � 12 tent. To model this situation, the manager wrote
the equation 45x � 50y � 4500. What do x and yrepresent? Graph the equation. How many solutions arethere to the equation, given that the number of tents ofeach type must be a whole number?
Graphing Calculator ExercisesGraph each straight line on your graphing calculator usinga viewing window that shows both intercepts. Answers may vary.
97. 2x � 3y � 1200 98. 3x � 700y � 2100
99. 200x � 300y � 6 100. 300x � 5y � 20
101. y � 300x � 1 102. y � 300x � 6000
dug33491_ch03a.qxd 9/14/07 3:52 PM Page 186
Confirming Pages
Math at Work Predicting the Future
No one knows what the future may bring, but everyone plans for and tries to predict thefuture. Stock market analysts predict the profits of companies, pollsters predict the out-comes of elections, and urban planners predict sizes of cities. These predictions of thefuture are often based on the trends of the past.
Consider the accompanying table, which shows the population of the United Statesin millions for each census year from 1950 through 2000. It certainly appears that thepopulation is going up and it would be a safe bet to predict that the population in 2010
will be somewhat larger than 279 million. We get adifferent perspective if we look at the accompanyinggraph of the population data. Not only does the graphshow an increasing population, it shows the popula-tion increasing in a linear manner. Now we can makea prediction based on the line that appears to fit thedata. The equation of this line, the regression line, isy � 2.47x � 4666, where x is the year and y is thepopulation. The equation of the regression line can befound with a computer or graphing calculator. Now ifx � 2010, then y � 2.47(2010) � 4666 � 299. So wecan predict 299 million people in 2010.
PopulationYear (millions)
1950 152
1960 180
1970 204
1980 227
1990 249
2000 279
Popu
latio
n (m
illio
ns)
350
300
200
250
1950 1970 1990 2010Year
150
Figure 3.13
6�100�
6%GRADE
SLOW VEHICLESKEEP RIGHT
3.2 Slope
In Section 3.1 you learned that the graph of a linear equation is a straight line. In thissection, we will continue our study of lines in the coordinate plane.
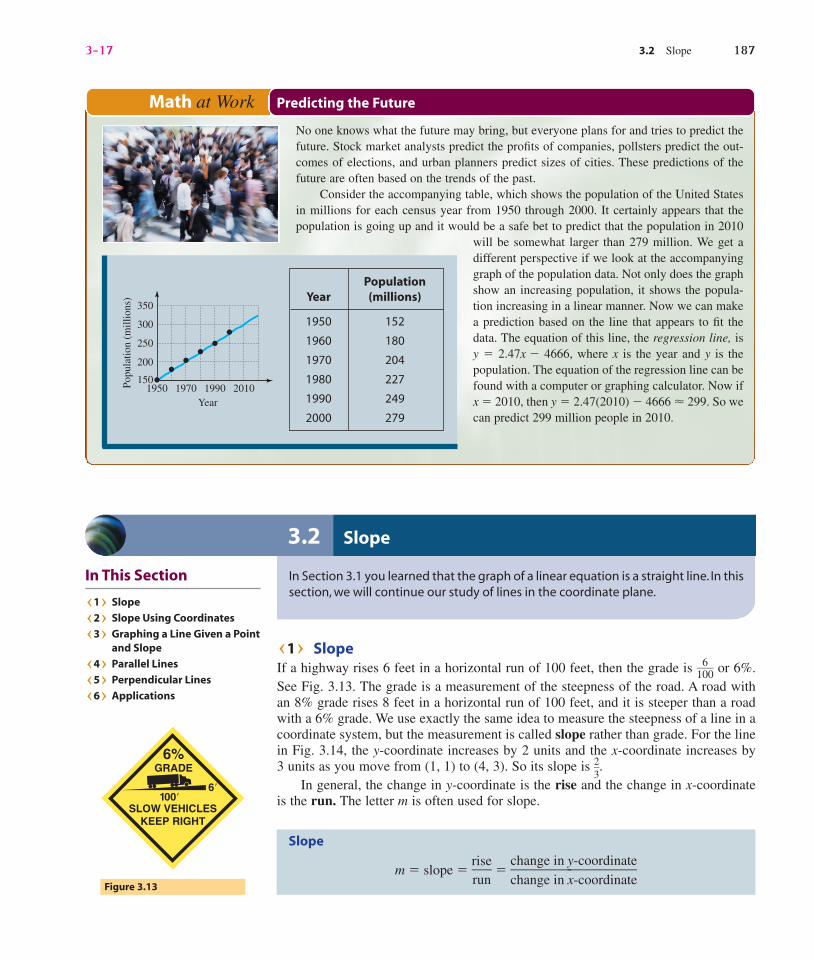
U1V SlopeIf a highway rises 6 feet in a horizontal run of 100 feet, then the grade is �
1600� or 6%.
See Fig. 3.13. The grade is a measurement of the steepness of the road. A road withan 8% grade rises 8 feet in a horizontal run of 100 feet, and it is steeper than a roadwith a 6% grade. We use exactly the same idea to measure the steepness of a line in acoordinate system, but the measurement is called slope rather than grade. For the linein Fig. 3.14, the y-coordinate increases by 2 units and the x-coordinate increases by3 units as you move from (1, 1) to (4, 3). So its slope is �
23
�. In general, the change in y-coordinate is the rise and the change in x-coordinate
is the run. The letter m is often used for slope.
In This Section
U1V Slope
U2V Slope Using Coordinates
U3V Graphing a Line Given a Pointand Slope
U4V Parallel Lines
U5V Perpendicular Lines
U6V Applications
Slope
m � slope � �rriusne
� � �cchhaannggee
iinn
��y
x
--ccoooorrddiinnaattee
�
3-17 3.2 Slope 187
dug33491_ch03a.qxd 9/14/07 3:52 PM Page 187
Confirming Pages
The change in y is always in the numerator, and the change in x is alwaysin the denominator.
The ratio of rise to run is the ratio of the lengths of the two legs of any right tri-angle whose hypotenuse is on the line. As long as one leg is vertical and the other is
CAUTION
188 Chapter 3 Linear Equations in Two Variables and Their Graphs 3-18
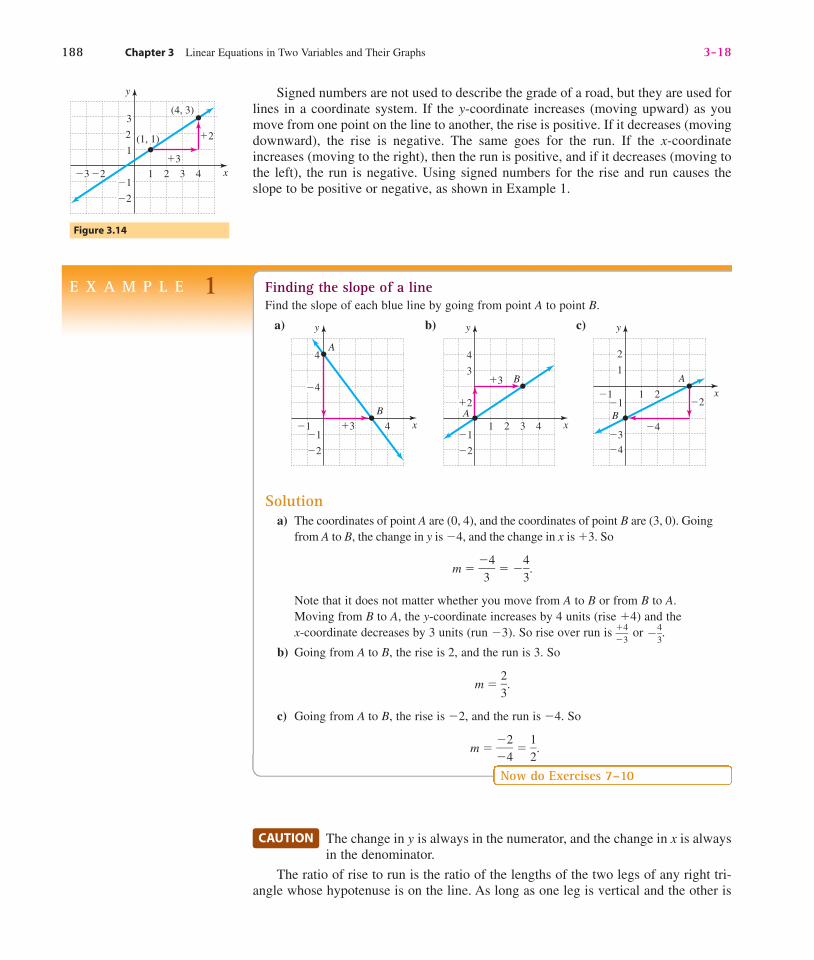
Signed numbers are not used to describe the grade of a road, but they are used forlines in a coordinate system. If the y-coordinate increases (moving upward) as youmove from one point on the line to another, the rise is positive. If it decreases (movingdownward), the rise is negative. The same goes for the run. If the x-coordinateincreases (moving to the right), then the run is positive, and if it decreases (moving tothe left), the run is negative. Using signed numbers for the rise and run causes theslope to be positive or negative, as shown in Example 1.
E X A M P L E 1 Finding the slope of a lineFind the slope of each blue line by going from point A to point B.
a) b) c)
Solutiona) The coordinates of point A are (0, 4), and the coordinates of point B are (3, 0). Going
from A to B, the change in y is �4, and the change in x is �3. So
m � ��
34� � ��
43
�.
Note that it does not matter whether you move from A to B or from B to A.Moving from B to A, the y-coordinate increases by 4 units (rise �4) and the x-coordinate decreases by 3 units (run �3). So rise over run is �
�
�
43
� or ��43
�.
b) Going from A to B, the rise is 2, and the run is 3. So
m � �23
�.
c) Going from A to B, the rise is �2, and the run is �4. So
m � ��
�
24
� � �12
�.
Now do Exercises 7–10
2
y
x�1
1
2
1A
�1
�3
�4
�4
�2B
3
y
x�1
1
3
2
�2
4
4
B
A�2
�3
y
x�1
�2
4
4
B
A
�1
�4
�3
Figure 3.14
y
x�1
1
3
3
2
2
�2
4
1�3
�2
(4, 3)
(1, 1)
�3 �2
dug33491_ch03a.qxd 9/14/07 3:52 PM Page 188
Confirming Pages
3-19 3.2 Slope 189
Coordinate Formula for Slope
The slope of the line containing the points (x1, y1) and (x2, y2) is given by
m � �yx
2
2
�
�
yx
1
1�,
provided that x2 � x1 � 0.
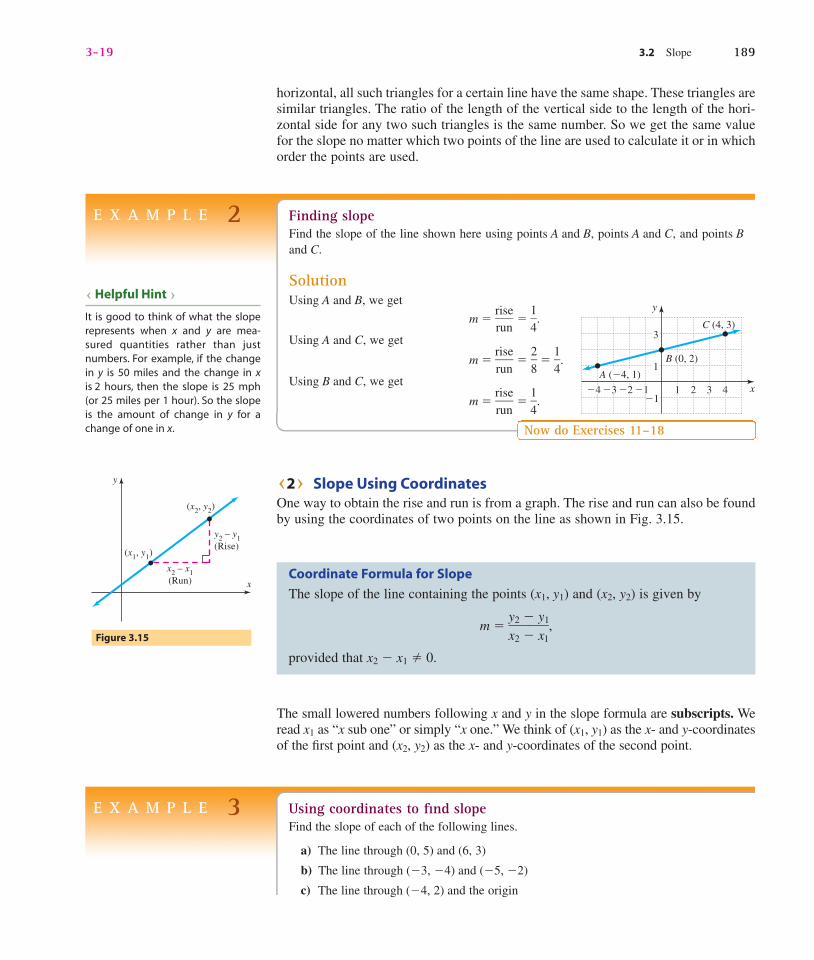
E X A M P L E 2 Finding slopeFind the slope of the line shown here using points A and B, points A and C, and points Band C.
SolutionUsing A and B, we get
m � �rriusne
� � �14
�.
Using A and C, we get
m � �rriusne
� � �28
� � �14
�.
Using B and C, we get
m � �rriusne
� � �14
�.
Now do Exercises 11–18
y
x�1�4 4�1
1
3
3�2
1
2�3
C (4, 3)
B (0, 2)
A (�4, 1)
U Helpful Hint V
It is good to think of what the sloperepresents when x and y are mea-sured quantities rather than justnumbers. For example, if the changein y is 50 miles and the change in xis 2 hours, then the slope is 25 mph(or 25 miles per 1 hour). So the slopeis the amount of change in y for achange of one in x.
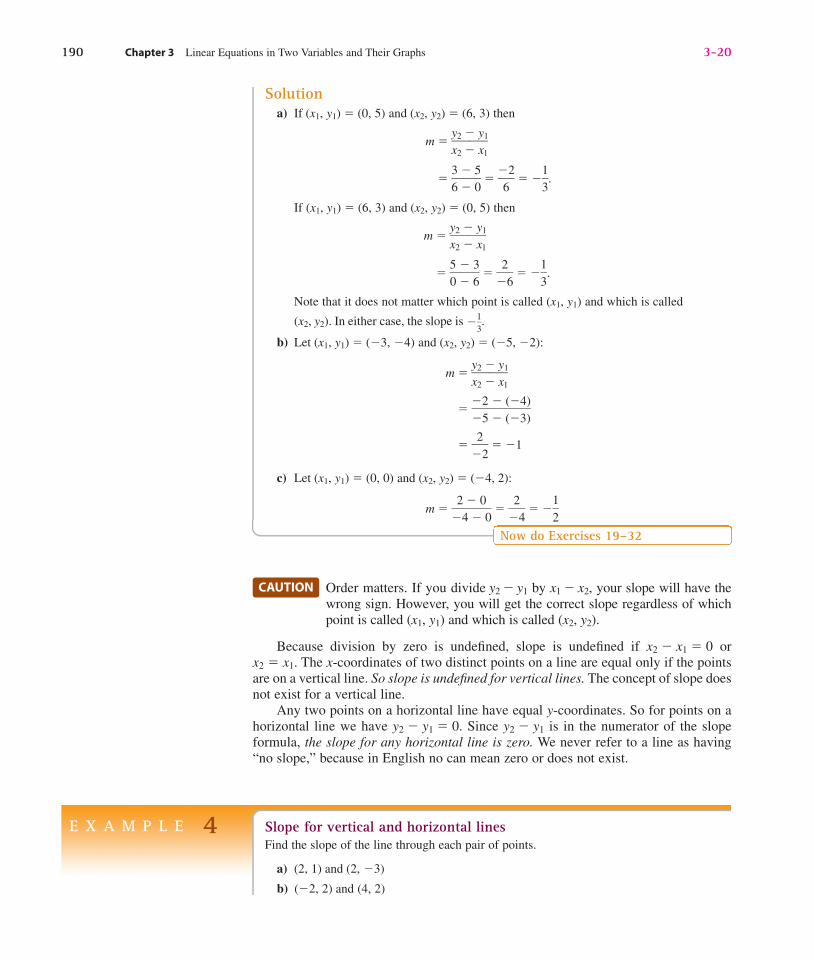
U2V Slope Using CoordinatesOne way to obtain the rise and run is from a graph. The rise and run can also be foundby using the coordinates of two points on the line as shown in Fig. 3.15.
Figure 3.15
y
x
(x1, y1)
x2 – x1(Run)
y2 – y1(Rise)
(x2, y2)
horizontal, all such triangles for a certain line have the same shape. These triangles aresimilar triangles. The ratio of the length of the vertical side to the length of the hori-zontal side for any two such triangles is the same number. So we get the same valuefor the slope no matter which two points of the line are used to calculate it or in whichorder the points are used.
The small lowered numbers following x and y in the slope formula are subscripts. Weread x1 as “x sub one” or simply “x one.” We think of (x1, y1) as the x- and y-coordinatesof the first point and (x2, y2) as the x- and y-coordinates of the second point.
E X A M P L E 3 Using coordinates to find slopeFind the slope of each of the following lines.
a) The line through (0, 5) and (6, 3)
b) The line through (�3, �4) and (�5, �2)
c) The line through (�4, 2) and the origin
dug33491_ch03a.qxd 9/14/07 3:52 PM Page 189
Confirming Pages
Order matters. If you divide y2 � y1 by x1 � x2, your slope will have thewrong sign. However, you will get the correct slope regardless of whichpoint is called (x1, y1) and which is called (x2, y2).
Because division by zero is undefined, slope is undefined if x2 � x1 � 0 orx2 � x1. The x-coordinates of two distinct points on a line are equal only if the pointsare on a vertical line. So slope is undefined for vertical lines. The concept of slope doesnot exist for a vertical line.
Any two points on a horizontal line have equal y-coordinates. So for points on ahorizontal line we have y2 � y1 � 0. Since y2 � y1 is in the numerator of the slopeformula, the slope for any horizontal line is zero. We never refer to a line as having“no slope,” because in English no can mean zero or does not exist.
CAUTION
190 Chapter 3 Linear Equations in Two Variables and Their Graphs 3-20
Solutiona) If (x1, y1) � (0, 5) and (x2, y2) � (6, 3) then
m � �yx
2
2
�
�
yx
1
1�
� �36
�
�
50
� � ��
62� � ��
13
�.
If (x1, y1) � (6, 3) and (x2, y2) � (0, 5) then
m � �yx
2
2
�
�
yx
1
1�
� �50 �
�
63
� � ��
26� � ��
13
�.
Note that it does not matter which point is called (x1, y1) and which is called
(x2, y2). In either case, the slope is ��13
�.
b) Let (x1, y1) � (�3, �4) and (x2, y2) � (�5, �2):
m � �yx
2
2
�
�
yx
1
1�
� ��
�
25 �
�
((�
�
34))
�
� ��
22� � �1
c) Let (x1, y1) � (0, 0) and (x2, y2) � (�4, 2):
m � ��
24�
�
00
� � ��
24� � ��
12
�
Now do Exercises 19–32
E X A M P L E 4 Slope for vertical and horizontal linesFind the slope of the line through each pair of points.
a) (2, 1) and (2, �3)
b) (�2, 2) and (4, 2)
dug33491_ch03a.qxd 9/14/07 3:52 PM Page 190
Confirming Pages
3-21 3.2 Slope 191
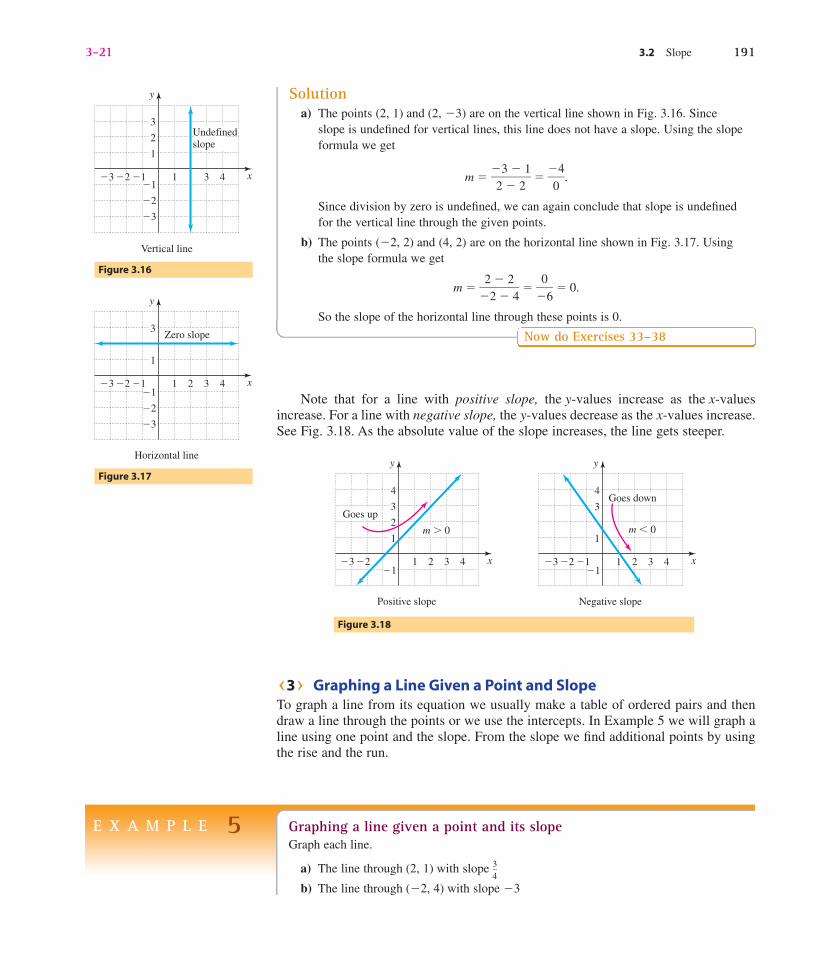
Solutiona) The points (2, 1) and (2, �3) are on the vertical line shown in Fig. 3.16. Since
slope is undefined for vertical lines, this line does not have a slope. Using the slopeformula we get
m � ��
23�
�
21
� � ��
04�.
Since division by zero is undefined, we can again conclude that slope is undefinedfor the vertical line through the given points.
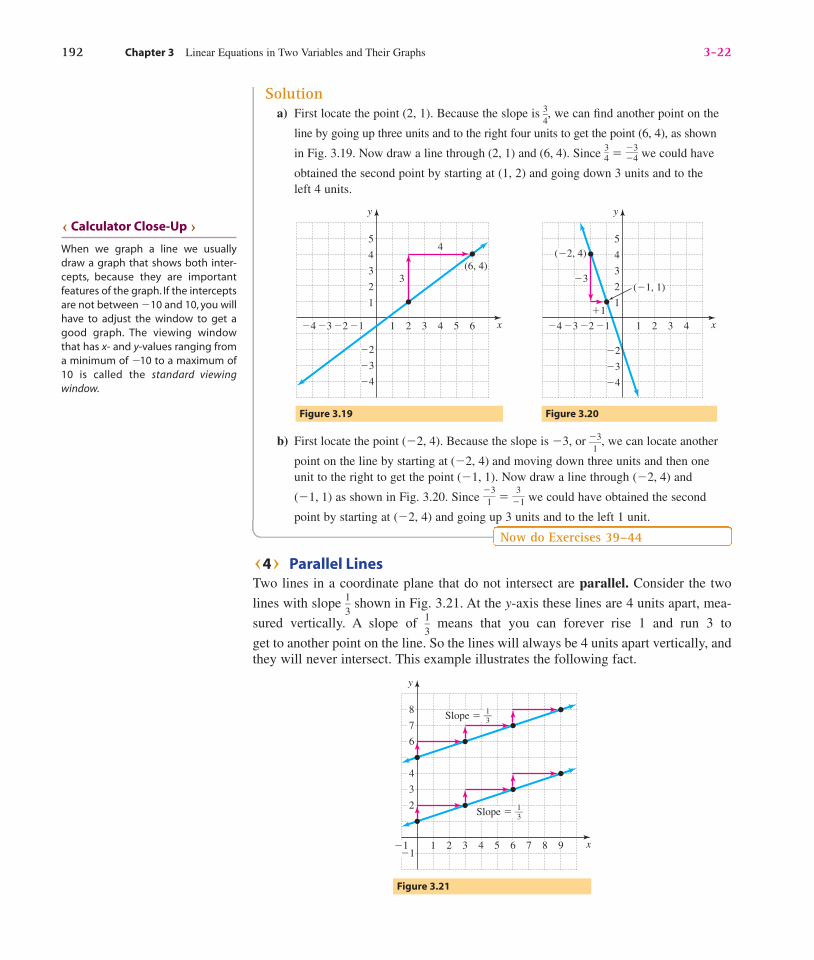
b) The points (�2, 2) and (4, 2) are on the horizontal line shown in Fig. 3.17. Usingthe slope formula we get
m � ��
22�
�
24
� � ��
06� � 0.
So the slope of the horizontal line through these points is 0.
Now do Exercises 33–38
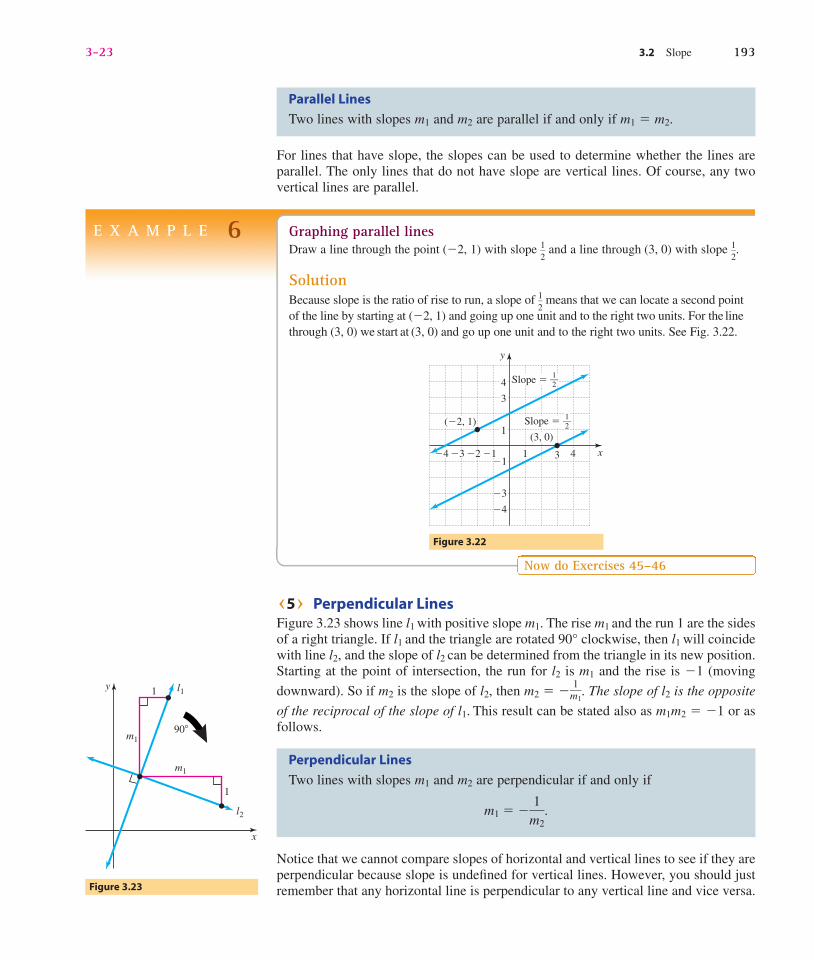
Note that for a line with positive slope, the y-values increase as the x-valuesincrease. For a line with negative slope, the y-values decrease as the x-values increase.See Fig. 3.18. As the absolute value of the slope increases, the line gets steeper.
U3V Graphing a Line Given a Point and SlopeTo graph a line from its equation we usually make a table of ordered pairs and thendraw a line through the points or we use the intercepts. In Example 5 we will graph aline using one point and the slope. From the slope we find additional points by usingthe rise and the run.
Figure 3.18
1
y
x�1 2�1
3
3�2
1
�3
Negative slope
4
4Goes down
m � 0
�2
y
x2�1
1
3
3
1
�3
Positive slope
4
4
2Goes up
m � 0
Figure 3.16
y
x�1 4�1
1
3
3�2
1
�3
�2
�3
2
Vertical line
Undefinedslope
Figure 3.17
y
x�1 2�1
1
3
3�2
1
�3
�2
�3
Horizontal line
4
Zero slope
E X A M P L E 5 Graphing a line given a point and its slopeGraph each line.
a) The line through (2, 1) with slope �34
�
b) The line through (�2, 4) with slope �3
dug33491_ch03a.qxd 9/14/07 3:52 PM Page 191
Confirming Pages
U4V Parallel LinesTwo lines in a coordinate plane that do not intersect are parallel. Consider the two
lines with slope �13
� shown in Fig. 3.21. At the y-axis these lines are 4 units apart, mea-
sured vertically. A slope of �13
� means that you can forever rise 1 and run 3 to
get to another point on the line. So the lines will always be 4 units apart vertically, andthey will never intersect. This example illustrates the following fact.
Figure 3.21
y
x
Slope � 1—3
2
3
4
6
7
8
1 2 3 4 5 6 7 8 9
Slope � 1—3
�1�1
192 Chapter 3 Linear Equations in Two Variables and Their Graphs 3-22
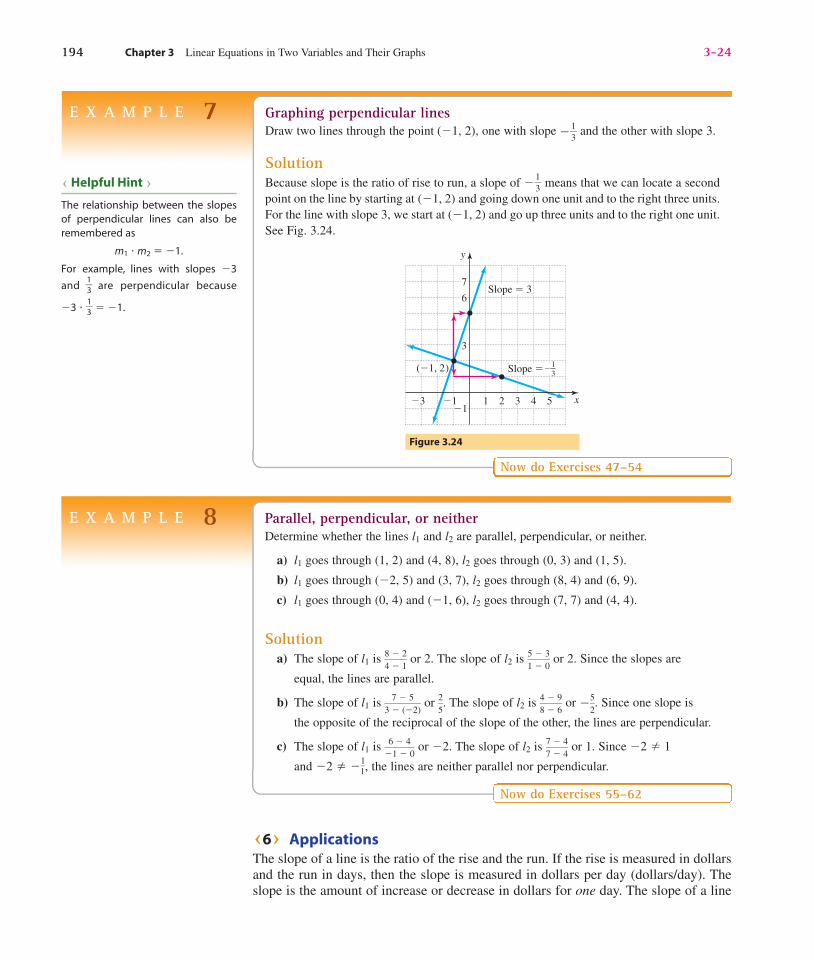
Solutiona) First locate the point (2, 1). Because the slope is �
34
�, we can find another point on the
line by going up three units and to the right four units to get the point (6, 4), as shown
in Fig. 3.19. Now draw a line through (2, 1) and (6, 4). Since �34
� � ���
34
� we could have
obtained the second point by starting at (1, 2) and going down 3 units and to theleft 4 units.
b) First locate the point (�2, 4). Because the slope is �3, or ��
13�, we can locate another
point on the line by starting at (�2, 4) and moving down three units and then oneunit to the right to get the point (�1, 1). Now draw a line through (�2, 4) and
(�1, 1) as shown in Fig. 3.20. Since ��
13� � �
�
31� we could have obtained the second
point by starting at (�2, 4) and going up 3 units and to the left 1 unit.
Now do Exercises 39–44
Figure 3.20Figure 3.19
�2 �1
y
x�3�4 1
3
4
5
3
2
2
�2
�3
�4
4
1�1
(�1, 1)
(�2, 4)
�3
�2 �1
y
x�3�4 1
3
4
5
3
2
2
�2
�3
�4
4 5 6
1
3
4
(6, 4)
U Calculator Close-Up V
When we graph a line we usuallydraw a graph that shows both inter-cepts, because they are importantfeatures of the graph. If the interceptsare not between �10 and 10, you willhave to adjust the window to get agood graph. The viewing windowthat has x- and y-values ranging froma minimum of �10 to a maximum of10 is called the standard viewingwindow.
dug33491_ch03a.qxd 9/14/07 3:52 PM Page 192
Confirming Pages
For lines that have slope, the slopes can be used to determine whether the lines areparallel. The only lines that do not have slope are vertical lines. Of course, any twovertical lines are parallel.
3-23 3.2 Slope 193
Perpendicular Lines
Two lines with slopes m1 and m2 are perpendicular if and only if
m1 � ��m1
2�.
Parallel Lines
Two lines with slopes m1 and m2 are parallel if and only if m1 � m2.
Figure 3.23
y
m1
m1
l1
l2
x
90�
1
1
U5V Perpendicular LinesFigure 3.23 shows line l1 with positive slope m1. The rise m1 and the run 1 are the sidesof a right triangle. If l1 and the triangle are rotated 90° clockwise, then l1 will coincidewith line l2, and the slope of l2 can be determined from the triangle in its new position.Starting at the point of intersection, the run for l2 is m1 and the rise is �1 (moving
downward). So if m2 is the slope of l2, then m2 � ��m1
1�. The slope of l2 is the opposite
of the reciprocal of the slope of l1. This result can be stated also as m1m2 � �1 or asfollows.
Graphing parallel linesDraw a line through the point (�2, 1) with slope �
12
� and a line through (3, 0) with slope �12
�.
SolutionBecause slope is the ratio of rise to run, a slope of �
12
� means that we can locate a second pointof the line by starting at (�2, 1) and going up one unit and to the right two units. For the linethrough (3, 0) we start at (3, 0) and go up one unit and to the right two units. See Fig. 3.22.
Now do Exercises 45–46
Figure 3.22
1�4
y
x�1 4�1
3
3�2
1
�3
4
�3
�4
(�2, 1)
(3, 0)
Slope � 1—2
Slope � 1—2
E X A M P L E 6
Notice that we cannot compare slopes of horizontal and vertical lines to see if they areperpendicular because slope is undefined for vertical lines. However, you should justremember that any horizontal line is perpendicular to any vertical line and vice versa.
dug33491_ch03a.qxd 9/14/07 3:52 PM Page 193
Confirming Pages
194 Chapter 3 Linear Equations in Two Variables and Their Graphs 3-24
E X A M P L E 7 Graphing perpendicular linesDraw two lines through the point (�1, 2), one with slope ��
13
� and the other with slope 3.
SolutionBecause slope is the ratio of rise to run, a slope of ��
13
� means that we can locate a secondpoint on the line by starting at (�1, 2) and going down one unit and to the right three units.For the line with slope 3, we start at (�1, 2) and go up three units and to the right one unit.See Fig. 3.24.
Now do Exercises 47–54
Figure 3.24
y
x�3 4 5�1
6
3
1
7
2 3�1
Slope � 3
(�1, 2) Slope ��13
U Helpful Hint V
The relationship between the slopesof perpendicular lines can also beremembered as
m1 � m2 � �1.
For example, lines with slopes �3
and �13
� are perpendicular because
�3 � �13
� � �1.
E X A M P L E 8 Parallel, perpendicular, or neitherDetermine whether the lines l1 and l2 are parallel, perpendicular, or neither.
a) l1 goes through (1, 2) and (4, 8), l2 goes through (0, 3) and (1, 5).
b) l1 goes through (�2, 5) and (3, 7), l2 goes through (8, 4) and (6, 9).
c) l1 goes through (0, 4) and (�1, 6), l2 goes through (7, 7) and (4, 4).
Solutiona) The slope of l1 is �8
4�
�
21
� or 2. The slope of l2 is �51
�
�
30
� or 2. Since the slopes are
equal, the lines are parallel.
b) The slope of l1 is �3
7�
�
(�52)
� or �25
�. The slope of l2 is �48
�
�
96
� or ��52
�. Since one slope is
the opposite of the reciprocal of the slope of the other, the lines are perpendicular.
c) The slope of l1 is ��
61�
�
40
� or �2. The slope of l2 is �77
�
�
44
� or 1. Since �2 � 1
and �2 � ��11
�, the lines are neither parallel nor perpendicular.
Now do Exercises 55–62
U6V Applications The slope of a line is the ratio of the rise and the run. If the rise is measured in dollarsand the run in days, then the slope is measured in dollars per day (dollars/day). Theslope is the amount of increase or decrease in dollars for one day. The slope of a line
dug33491_ch03a.qxd 9/14/07 3:52 PM Page 194
Confirming Pages
is the rate at which the dependent variable is increasing or decreasing. It is the amountof change in the dependent variable per a change of one unit in the independentvariable. In some cases, the slope is a fraction, but whole numbers sound better forinterpretation. For example, the birth rate at a hospital of �
13� birth/day might sound
better stated as one birth per three days.
3-25 3.2 Slope 195
E X A M P L E 9
50 100 1500
20
40
60
(120, 0)Vel
ocity
(m
ph)
Distance (feet)
(0, 60)y
x
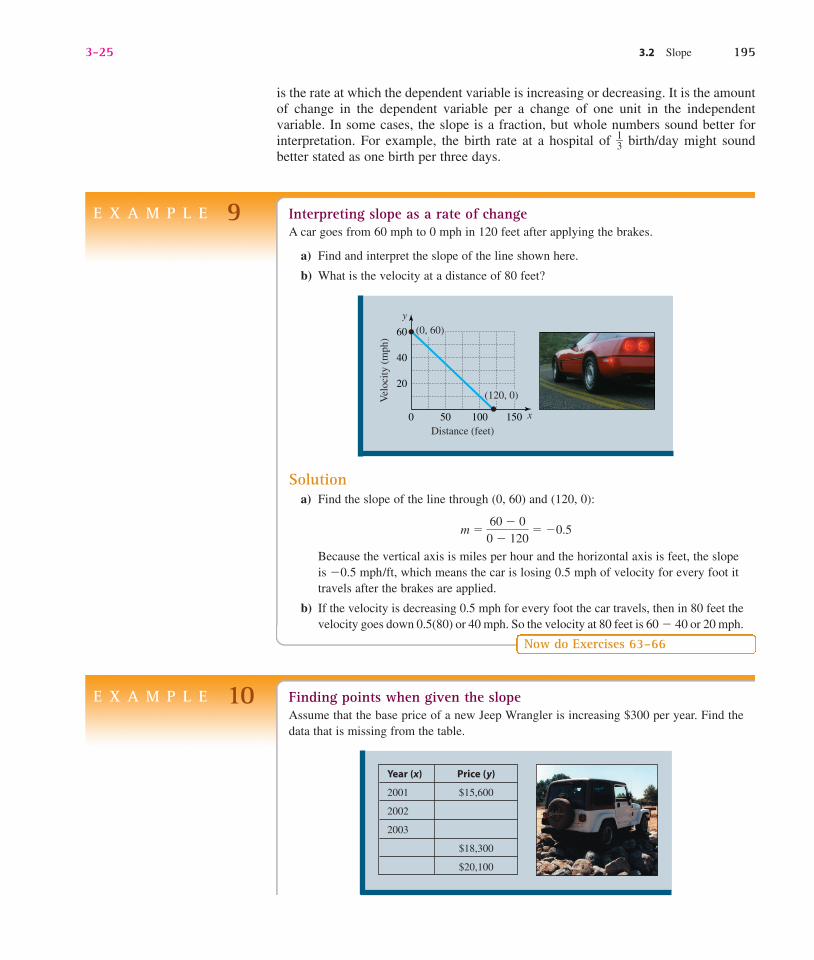
Interpreting slope as a rate of changeA car goes from 60 mph to 0 mph in 120 feet after applying the brakes.
a) Find and interpret the slope of the line shown here.
b) What is the velocity at a distance of 80 feet?
Solutiona) Find the slope of the line through (0, 60) and (120, 0):
m � �060�
�
1200
� � �0.5
Because the vertical axis is miles per hour and the horizontal axis is feet, the slopeis �0.5 mph/ft, which means the car is losing 0.5 mph of velocity for every foot ittravels after the brakes are applied.
b) If the velocity is decreasing 0.5 mph for every foot the car travels, then in 80 feet thevelocity goes down 0.5(80) or 40 mph. So the velocity at 80 feet is 60 � 40 or 20 mph.
Now do Exercises 63–66
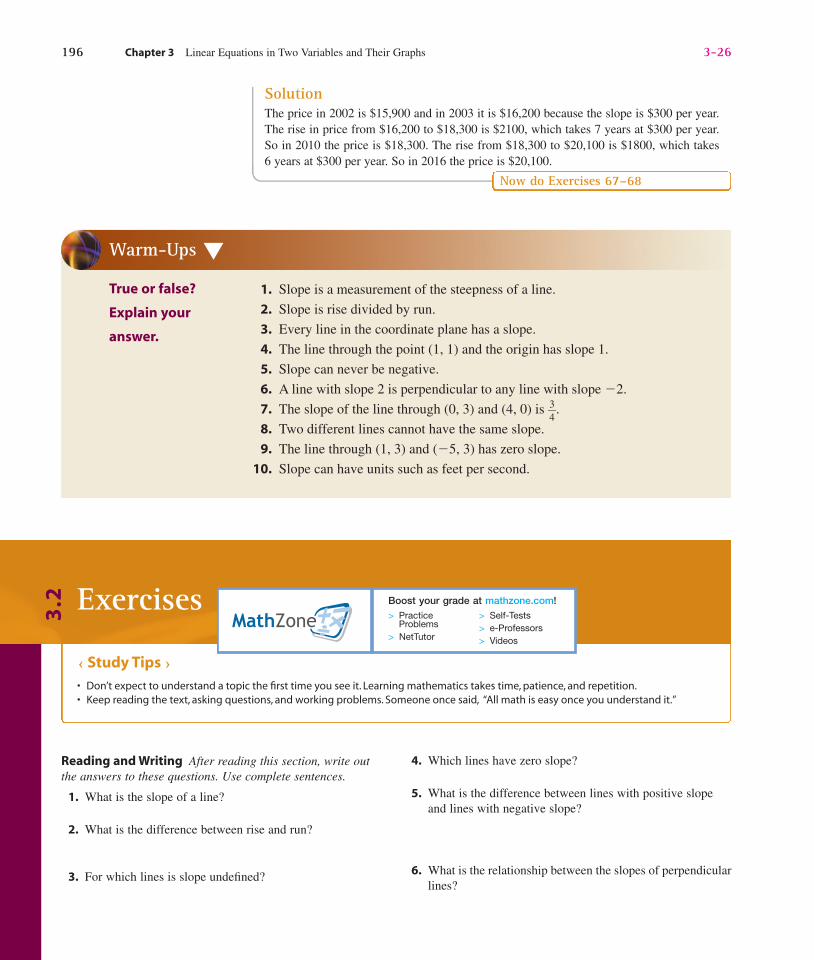
E X A M P L E 10 Finding points when given the slopeAssume that the base price of a new Jeep Wrangler is increasing $300 per year. Find thedata that is missing from the table.
Year (x) Price (y)
2001 $15,600
2002
2003
$18,300
$20,100
dug33491_ch03a.qxd 9/14/07 3:52 PM Page 195
Confirming Pages
196 Chapter 3 Linear Equations in Two Variables and Their Graphs 3-26
Warm-Ups ▼
True or false?
Explain your
answer.
1. Slope is a measurement of the steepness of a line.
2. Slope is rise divided by run.
3. Every line in the coordinate plane has a slope.
4. The line through the point (1, 1) and the origin has slope 1.
5. Slope can never be negative.
6. A line with slope 2 is perpendicular to any line with slope �2.
7. The slope of the line through (0, 3) and (4, 0) is �34
�.
8. Two different lines cannot have the same slope.
9. The line through (1, 3) and (�5, 3) has zero slope.
10. Slope can have units such as feet per second.
Reading and Writing After reading this section, write outthe answers to these questions. Use complete sentences.
1. What is the slope of a line?
2. What is the difference between rise and run?
3. For which lines is slope undefined?
4. Which lines have zero slope?
5. What is the difference between lines with positive slopeand lines with negative slope?
6. What is the relationship between the slopes of perpendicularlines?
Exercises
U Study Tips V• Don’t expect to understand a topic the first time you see it. Learning mathematics takes time, patience, and repetition.• Keep reading the text, asking questions, and working problems. Someone once said, “All math is easy once you understand it.”
Boost your grade at mathzone.com!> Practice
Problems> NetTutor
> Self-Tests> e-Professors> Videos
3.2
SolutionThe price in 2002 is $15,900 and in 2003 it is $16,200 because the slope is $300 per year.The rise in price from $16,200 to $18,300 is $2100, which takes 7 years at $300 per year.So in 2010 the price is $18,300. The rise from $18,300 to $20,100 is $1800, which takes6 years at $300 per year. So in 2016 the price is $20,100.
Now do Exercises 67–68
dug33491_ch03a.qxd 9/14/07 3:52 PM Page 196

Confirming Pages
3-27 3.2 Slope 197
U1V Slope
In Exercises 7–18, find the slope of each line. See Examples 1and 2.
7. 8.
9. 10.
11. 12.
13. 14.
3
3
y
x
1
�3
1
2
�12�1�2�3
3
3
y
x�1�2
1
�3
1�3
�2
�12
y
x�1
3
2
�2
�3
1�1
2
�2
�3 33
y
x�1
3
�2
1
�3
1 2�3
2
�2
3
3
y
x�1�2
1
1�3
2
4
2
�2
y
x�1
3
�2
1
�3
1�1
2
�2
�3 3
3
3
y
x�1�2
1
1�3
2
�2
�13
y
x
3
�2 �1
1
1�1
2
�2
15. 16.
17. 18.
U2V Slope Using Coordinates
Find the slope of the line that goes through each pair of points.See Examples 3 and 4.
19. (1, 2), (3, 6) 20. (2, 7), (3, 10)
21. (2, 5), (6, 10) 22. (5, 1), (8, 9)
23. (2, 4), (5, �1) 24. (3, 1), (6, �2)
25. (�2, 4), (5, 9) 26. (�1, 3), (3, 5)
27. (�2, �3), (�5, 1) 28. (�6, �3), (�1, 1)
29. (�3, 4), (3, �2) 30. (�1, 3), (5, �2)
31. ��12
�, 2�, ��1, �12
�� 32. ��13
�, 2�, ���13
�, 1�33. (2, 3), (2, �9) 34. (�3, 6), (8, 6)
35. (�2, �5), (9, �5) 36. (4, �9), (4, 6)
37. (0.3, 0.9), (�0.1, �0.3) 38. (�0.1, 0.2), (0.5, 0.8)
3
3
y
x
1
1
2
2
�2
�3
�1�1�2
3
3
y
x
1
�3
�2
1
2
�1�3 �2 �1
3
3
y
x
1
�3
1 2
2
�3 �2
�2
�1
3
y
x�1�2
�3
1�3
2
�12
1
dug33491_ch03a.qxd 9/14/07 3:52 PM Page 197
Confirming Pages
198 Chapter 3 Linear Equations in Two Variables and Their Graphs 3-28
U3V Graphing a Line Given a Point and Slope
Graph the line with the given point and slope. See Example 5.
39. The line through (1, 1) with slope �23
�
40. The line through (2, 3) with slope �12
�
41. The line through (�2, 3) with slope �2
42. The line through (�2, 5) with slope �1
43. The line through (0, 0) with slope ��25
�
44. The line through (�1, 4) with slope ��23
�
U4–5V Parallel and Perpendicular Lines
Solve each problem. See Examples 6 and 7.
45. Draw line l1 through (1, �2) with slope �12
� and line l2through (�1, 1) with slope �
12
�.
46. Draw line l1 through (0, 3) with slope 1 and line l2 through(0, 0) with slope 1.
47. Draw l1 through (1, 2) with slope �12
�, and draw l2 through (1, 2) with slope �2.
dug33491_ch03a.qxd 9/14/07 3:53 PM Page 198
Confirming Pages
48. Draw l1 through (�2, 1) with slope �23
�, and draw l2 through
(�2, 1) with slope ��32
�.
49. Draw any line l1 with slope �34
�. What is the slope of any
line perpendicular to l1? Draw any line l2 perpendicular to l1.
50. Draw any line l1 with slope �1. What is the slope of any lineperpendicular to l1? Draw any line l2 perpendicular to l1.
51. Draw l1 through (�2, �3) and (4, 0). What is the slope ofany line parallel to l1? Draw l2 through (1, 2) so that it isparallel to l1.
52. Draw l1 through (�4, 0) and (0, 6). What is the slope of anyline parallel to l1? Draw l2 through the origin and parallel to l1.
53. Draw l1 through (�2, 4) and (3, �1). What is the slope ofany line perpendicular to l1? Draw l2 through (1, 3) so thatit is perpendicular to l1.
54. Draw l1 through (0, �3) and (3, 0). What is the slope ofany line perpendicular to l1? Draw l2 through the origin sothat it is perpendicular to l1.
In each case, determine whether the lines l1 and l2 are parallel,perpendicular, or neither. See Example 8.
55. Line l1 goes through (3, 5) and (4, 7). Line l2 goes through(11, 7) and (12, 9).
56. Line l1 goes through (�2, �2) and (2, 0). Line l2 goesthrough (�2, 5) and (�1, 3).
57. Line l1 goes through (�1, 4) and (2, 6). Line l2 goesthrough (2, �2) and (4, 1).
58. Line l1 goes through (�2, 5) and (4, 7). Line l2 goesthrough (2, 4) and (3, 1).
59. Line l1 goes through (�1, 4) and (4, 6). Line l2 goesthrough (�7, 0) and (3, 4).
3-29 3.2 Slope 199
dug33491_ch03a.qxd 9/14/07 3:53 PM Page 199
Confirming Pages
200 Chapter 3 Linear Equations in Two Variables and Their Graphs 3-30
60. Line l1 goes through (1, 2) and (1, �1). Line l2 goesthrough (4, 4) and (3, 3).
61. Line l1 goes through (3, 5) and (3, 6). Line l2 goes through(�2, 4) and (�3, 4).
62. Line l1 goes through (�3, 7) and (4, 7). Line l2 goesthrough (�5, 1) and (�3, 1).
U6V Applications
Solve each problem. See Examples 9 and 10.
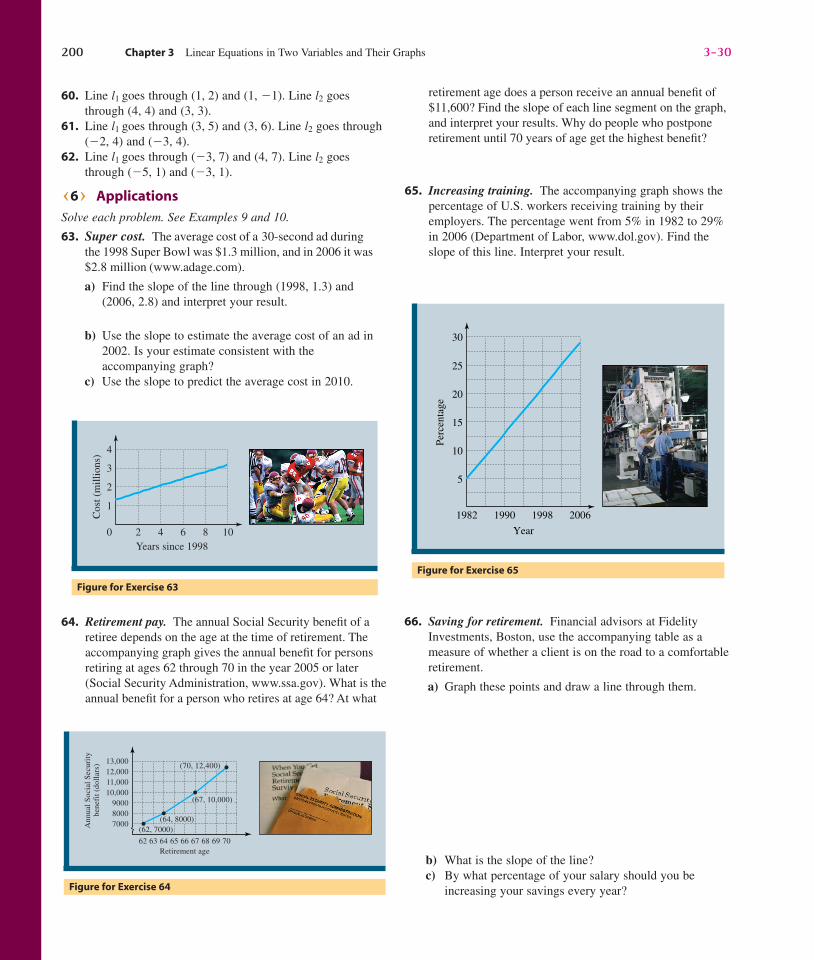
63. Super cost. The average cost of a 30-second ad duringthe 1998 Super Bowl was $1.3 million, and in 2006 it was$2.8 million (www.adage.com).
a) Find the slope of the line through (1998, 1.3) and(2006, 2.8) and interpret your result.
b) Use the slope to estimate the average cost of an ad in2002. Is your estimate consistent with theaccompanying graph?
c) Use the slope to predict the average cost in 2010.
Figure for Exercise 63
Cos
t (m
illio
ns) 4
2
3
2 4 86 10Years since 1998
0
1
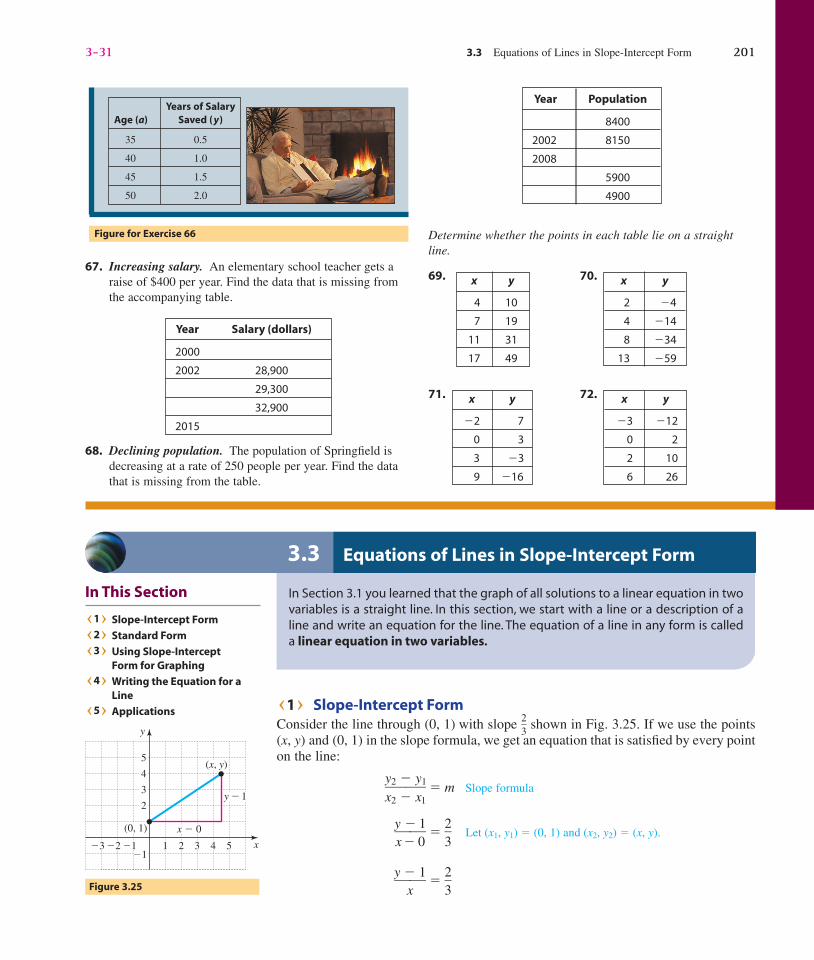
Figure for Exercise 64
Retirement age
Ann
ual S
ocia
l Sec
urit
ybe
nefi
t (do
llar
s)
700080009000
10,00011,00012,00013,000
63 64 65 66 67 68 69 7062
(62, 7000)(64, 8000)
(67, 10,000)
(70, 12,400)
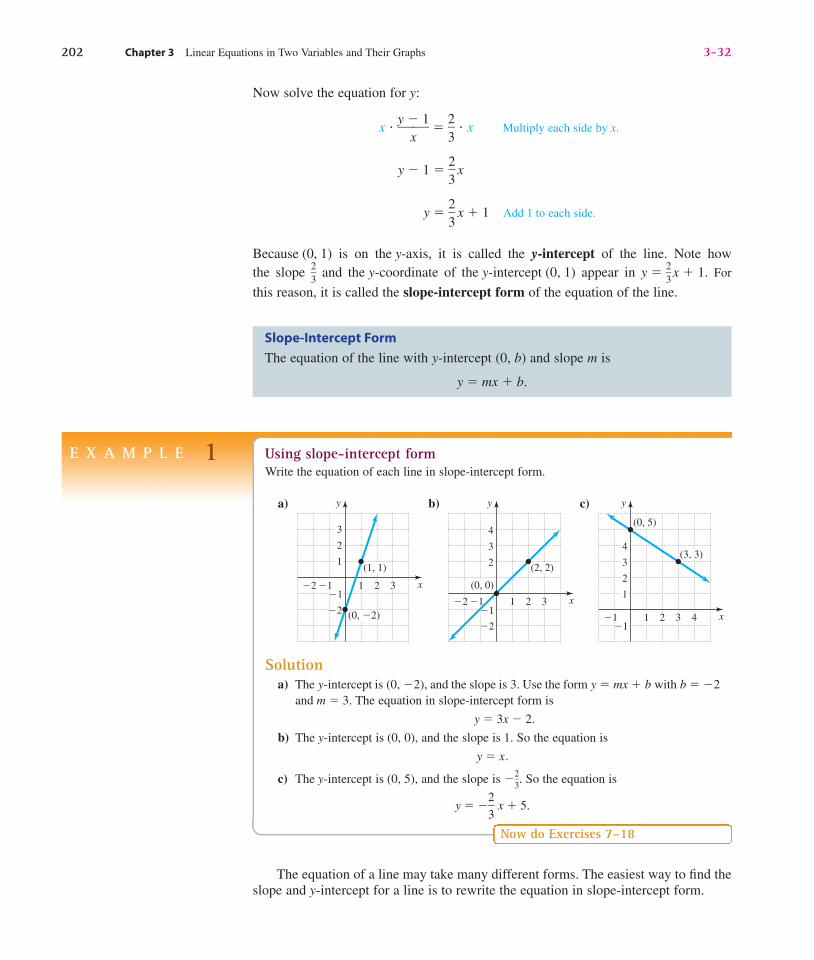
Figure for Exercise 65
Year
1982 1990 1998 2006
Perc
enta
ge
5
10
15
20
25
30
retirement age does a person receive an annual benefit of$11,600? Find the slope of each line segment on the graph,and interpret your results. Why do people who postponeretirement until 70 years of age get the highest benefit?
65. Increasing training. The accompanying graph shows thepercentage of U.S. workers receiving training by theiremployers. The percentage went from 5% in 1982 to 29%in 2006 (Department of Labor, www.dol.gov). Find theslope of this line. Interpret your result.
64. Retirement pay. The annual Social Security benefit of aretiree depends on the age at the time of retirement. Theaccompanying graph gives the annual benefit for personsretiring at ages 62 through 70 in the year 2005 or later(Social Security Administration, www.ssa.gov). What is theannual benefit for a person who retires at age 64? At what
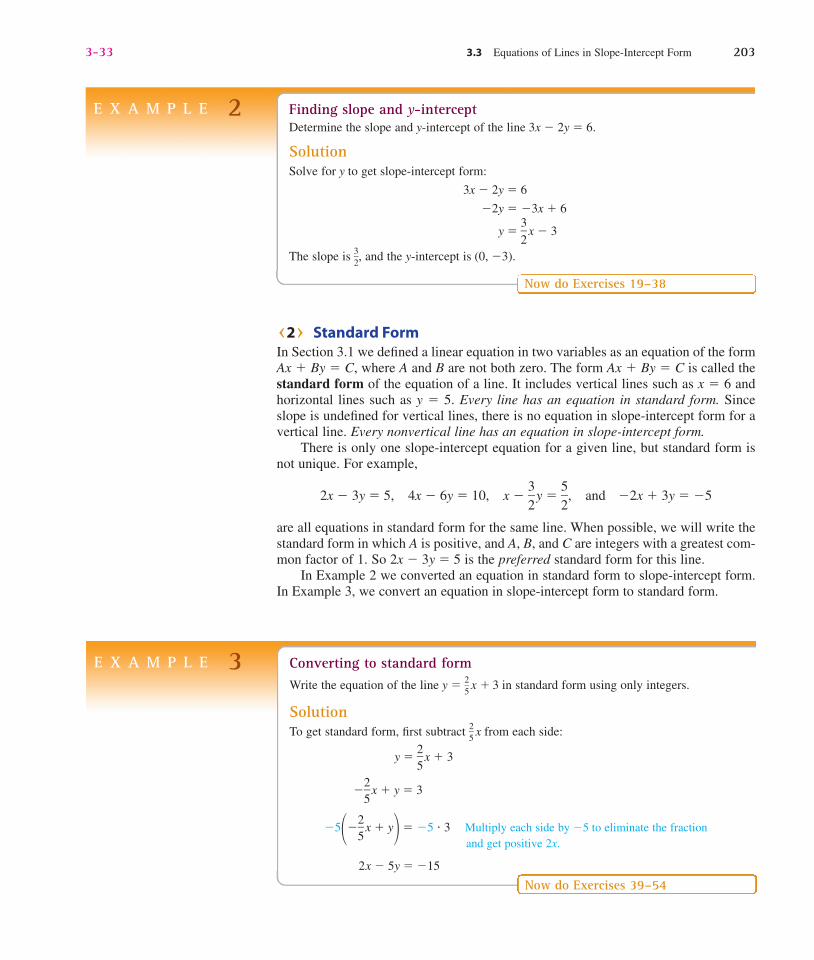
66. Saving for retirement. Financial advisors at FidelityInvestments, Boston, use the accompanying table as ameasure of whether a client is on the road to a comfortableretirement.
a) Graph these points and draw a line through them.
b) What is the slope of the line?c) By what percentage of your salary should you be
increasing your savings every year?
dug33491_ch03a.qxd 9/14/07 3:53 PM Page 200
Confirming Pages
In This Section
U1V Slope-Intercept Form
U2V Standard Form
U3V Using Slope-InterceptForm for Graphing
U4V Writing the Equation for aLine
U5V Applications
3.3 Equations of Lines in Slope-Intercept Form
In Section 3.1 you learned that the graph of all solutions to a linear equation in twovariables is a straight line. In this section, we start with a line or a description of aline and write an equation for the line. The equation of a line in any form is calleda linear equation in two variables.
Determine whether the points in each table lie on a straightline.
69. 70.
71. 72. x y
�3 �12
0 2
2 10
6 26
x y
�2 7
0 3
3 �3
9 �16
x y
2 �4
4 �14
8 �34
13 �59
x y
4 10
7 19
11 31
17 49
Year Population
8400
2002 8150
2008
5900
4900
67. Increasing salary. An elementary school teacher gets araise of $400 per year. Find the data that is missing fromthe accompanying table.
68. Declining population. The population of Springfield isdecreasing at a rate of 250 people per year. Find the datathat is missing from the table.
Year Salary (dollars)
2000
2002 28,900
29,300
32,900
2015
Figure for Exercise 66
Years of SalaryAge (a) Saved ( y)
35 0.5
40 1.0
45 1.5
50 2.0
3-31 3.3 Equations of Lines in Slope-Intercept Form 201
U1V Slope-Intercept FormConsider the line through (0, 1) with slope �
23
� shown in Fig. 3.25. If we use the points(x, y) and (0, 1) in the slope formula, we get an equation that is satisfied by every pointon the line:
�yx
2
2
�
�
yx
1
1� � m Slope formula
�yx �
�
01
� � �23
� Let (x1, y1) � (0, 1) and (x2, y2) � (x, y).
�y �
x1
� � �23
�Figure 3.25
y
x�1
3
�2�3
2
4
5
1�1
2 3 4 5
x � 0
y � 1
(x, y)
(0, 1)
dug33491_ch03a.qxd 9/14/07 3:53 PM Page 201
Confirming Pages
202 Chapter 3 Linear Equations in Two Variables and Their Graphs 3-32
The equation of a line may take many different forms. The easiest way to find theslope and y-intercept for a line is to rewrite the equation in slope-intercept form.
Slope-Intercept Form
The equation of the line with y-intercept (0, b) and slope m is
y � mx � b.
Now solve the equation for y:
x � �y �
x1
� � �23
� � x Multiply each side by x.
y � 1 � �23
� x
y � �23
� x � 1 Add 1 to each side.
Because (0, 1) is on the y-axis, it is called the y-intercept of the line. Note how the slope �
23
� and the y-coordinate of the y-intercept (0, 1) appear in y � �23
� x � 1. For
this reason, it is called the slope-intercept form of the equation of the line.
E X A M P L E 1 Using slope-intercept formWrite the equation of each line in slope-intercept form.
a) b) c)
Solutiona) The y-intercept is (0, �2), and the slope is 3. Use the form y � mx � b with b � �2
and m � 3. The equation in slope-intercept form is
y � 3x � 2.
b) The y-intercept is (0, 0), and the slope is 1. So the equation is
y � x.
c) The y-intercept is (0, 5), and the slope is ��23
�. So the equation is
y � ��23
� x � 5.
Now do Exercises 7–18
y
x�1
3
4
1
2
1�1
2 3 4
(3, 3)
(0, 5)
y
x�1
3
4
�2
2
1�1
2
�2
3
(2, 2)
(0, 0)
y
x�1
3
�2
1
2
1�1
2
�2
3
(1, 1)
(0, �2)
dug33491_ch03a.qxd 9/14/07 3:53 PM Page 202
Confirming Pages
3-33 3.3 Equations of Lines in Slope-Intercept Form 203
E X A M P L E 2 Finding slope and y-interceptDetermine the slope and y-intercept of the line 3x � 2y � 6.
SolutionSolve for y to get slope-intercept form:
3x � 2y � 6
�2y � �3x � 6
y � �32
� x � 3
The slope is �32
�, and the y-intercept is (0, �3).
Now do Exercises 19–38
U2V Standard FormIn Section 3.1 we defined a linear equation in two variables as an equation of the formAx � By � C, where A and B are not both zero. The form Ax � By � C is called thestandard form of the equation of a line. It includes vertical lines such as x � 6 andhorizontal lines such as y � 5. Every line has an equation in standard form. Sinceslope is undefined for vertical lines, there is no equation in slope-intercept form for avertical line. Every nonvertical line has an equation in slope-intercept form.
There is only one slope-intercept equation for a given line, but standard form isnot unique. For example,
2x � 3y � 5, 4x � 6y � 10, x � �32
� y � �52
�, and �2x � 3y � �5
are all equations in standard form for the same line. When possible, we will write thestandard form in which A is positive, and A, B, and C are integers with a greatest com-mon factor of 1. So 2x � 3y � 5 is the preferred standard form for this line.
In Example 2 we converted an equation in standard form to slope-intercept form.In Example 3, we convert an equation in slope-intercept form to standard form.
E X A M P L E 3 Converting to standard formWrite the equation of the line y � �
25
� x � 3 in standard form using only integers.
SolutionTo get standard form, first subtract �
25
� x from each side:
y � �25
� x � 3
��25
� x � y � 3
�5���25
� x � y� � �5 � 3 Multiply each side by �5 to eliminate the fraction and get positive 2x.
2x � 5y � �15
Now do Exercises 39–54
dug33491_ch03a.qxd 9/14/07 3:53 PM Page 203
Confirming Pages
U3V Using Slope-Intercept Form for GraphingOne way to graph a linear equation is to find several points that satisfy the equationand then draw a straight line through them. We can also graph a linear equation byusing the y-intercept and the slope.
When using the slope to find a second point on the line, be sure to startat the y-intercept, not at the origin.
CAUTION
204 Chapter 3 Linear Equations in Two Variables and Their Graphs 3-34
E X A M P L E 4
Strategy for Graphing a Line Using y-Intercept and Slope
1. Write the equation in slope-intercept form if necessary.
2. Plot the y-intercept.
3. Starting from the y-intercept, use the rise and run to locate a second point.
4. Draw a line through the two points.
U Calculator Close-Up V
To check Example 4, graph y �(2�3)x � 1 on a graphing calculatoras follows:
The calculator graph is consistentwith the graph in Fig. 3.26.
3
4
�3
�3
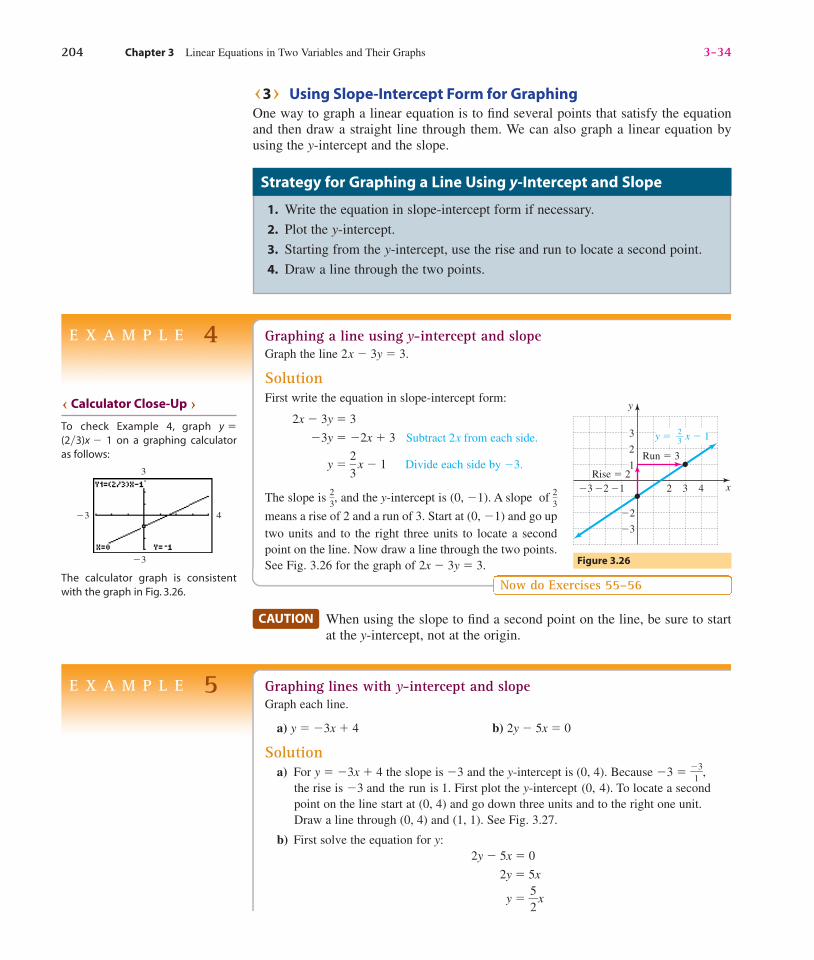
Graphing a line using y-intercept and slopeGraph the line 2x � 3y � 3.
SolutionFirst write the equation in slope-intercept form:
2x � 3y � 3
�3y � �2x � 3 Subtract 2x from each side.
y � �23
� x � 1 Divide each side by �3.
The slope is �23
�, and the y-intercept is (0, �1). A slope of �23
�
means a rise of 2 and a run of 3. Start at (0, �1) and go uptwo units and to the right three units to locate a secondpoint on the line. Now draw a line through the two points.See Fig. 3.26 for the graph of 2x � 3y � 3.
Now do Exercises 55–56
Figure 3.26
y
x�1 4
3
3�2
1
�3
�3
�2
2
2
Rise � 2
Run � 3
y � x � 12—3
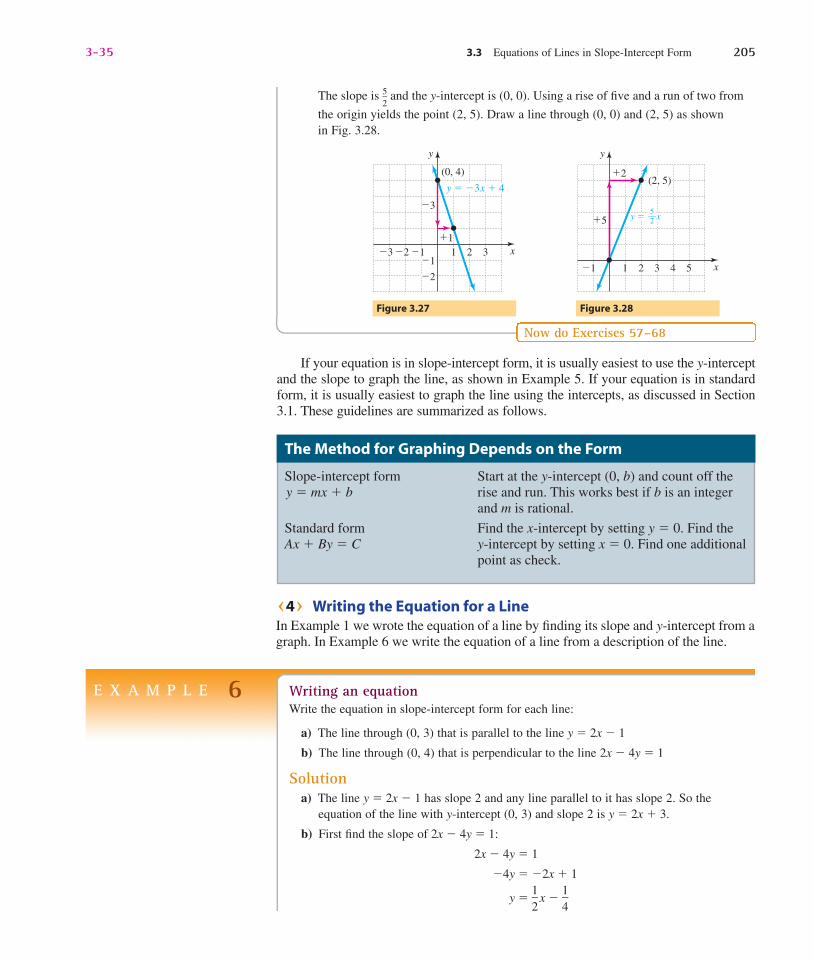
E X A M P L E 5 Graphing lines with y-intercept and slopeGraph each line.
a) y � �3x � 4 b) 2y � 5x � 0
Solutiona) For y � �3x � 4 the slope is �3 and the y-intercept is (0, 4). Because �3 � �
�
13�,
the rise is �3 and the run is 1. First plot the y-intercept (0, 4). To locate a secondpoint on the line start at (0, 4) and go down three units and to the right one unit.Draw a line through (0, 4) and (1, 1). See Fig. 3.27.
b) First solve the equation for y:2y � 5x � 0
2y � 5x
y � �52
�x
dug33491_ch03a.qxd 9/14/07 3:53 PM Page 204
Confirming Pages
3-35 3.3 Equations of Lines in Slope-Intercept Form 205
The slope is �52
� and the y-intercept is (0, 0). Using a rise of five and a run of two from
the origin yields the point (2, 5). Draw a line through (0, 0) and (2, 5) as shown in Fig. 3.28.
Now do Exercises 57–68
Figure 3.28Figure 3.27
1
y
x�1 3 4 52
�5
�2
5—2y � x
(2, 5)
1
y
x�1 3�2�3
�2
2�1
�1
�3
(0, 4)
y � �3x � 4
If your equation is in slope-intercept form, it is usually easiest to use the y-interceptand the slope to graph the line, as shown in Example 5. If your equation is in standardform, it is usually easiest to graph the line using the intercepts, as discussed in Section3.1. These guidelines are summarized as follows.
The Method for Graphing Depends on the Form
Slope-intercept form Start at the y-intercept (0, b) and count off the y � mx � b rise and run. This works best if b is an integer
and m is rational.
Standard form Find the x-intercept by setting y � 0. Find the Ax � By � C y-intercept by setting x � 0. Find one additional
point as check.
U4V Writing the Equation for a LineIn Example 1 we wrote the equation of a line by finding its slope and y-intercept from agraph. In Example 6 we write the equation of a line from a description of the line.
E X A M P L E 6 Writing an equationWrite the equation in slope-intercept form for each line:
a) The line through (0, 3) that is parallel to the line y � 2x � 1
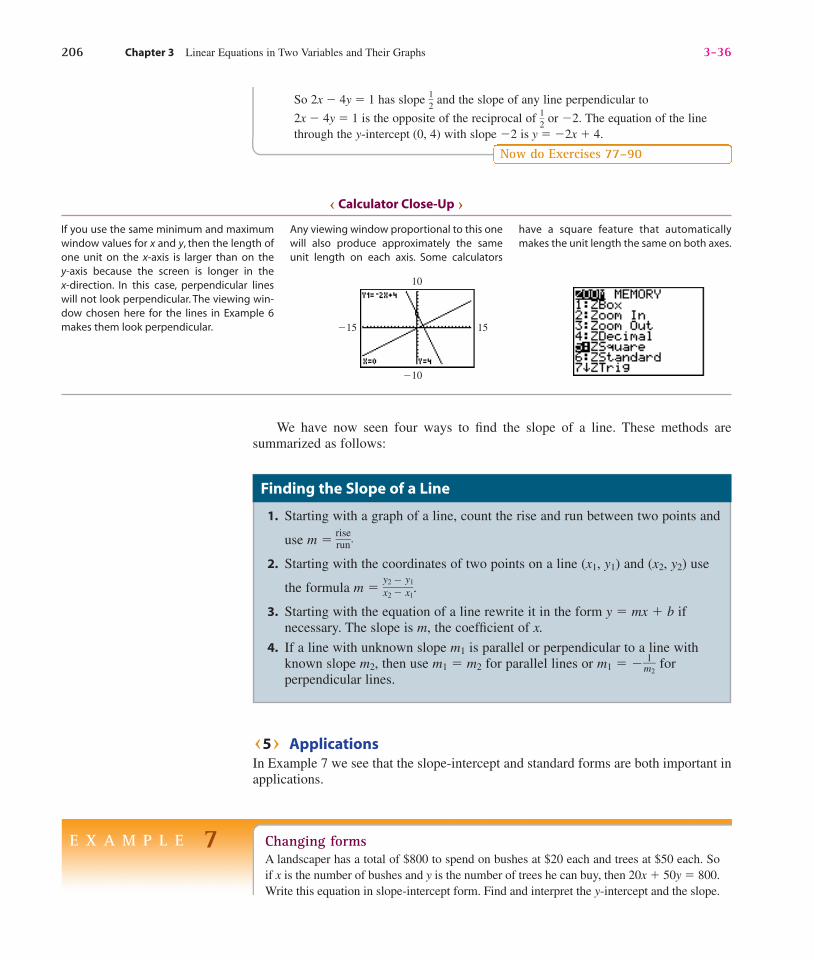
b) The line through (0, 4) that is perpendicular to the line 2x � 4y � 1
Solutiona) The line y � 2x � 1 has slope 2 and any line parallel to it has slope 2. So the
equation of the line with y-intercept (0, 3) and slope 2 is y � 2x � 3.
b) First find the slope of 2x � 4y � 1:
2x � 4y � 1
�4y � �2x � 1
y � �12
� x � �14
�
dug33491_ch03a.qxd 9/14/07 3:53 PM Page 205
Confirming Pages
U5V ApplicationsIn Example 7 we see that the slope-intercept and standard forms are both important inapplications.
206 Chapter 3 Linear Equations in Two Variables and Their Graphs 3-36
We have now seen four ways to find the slope of a line. These methods aresummarized as follows:
Finding the Slope of a Line
1. Starting with a graph of a line, count the rise and run between two points and
use m � �rriusne
�.
2. Starting with the coordinates of two points on a line (x1, y1) and (x2, y2) use
the formula m � �yx
2
2
��
yx
1
1�.
3. Starting with the equation of a line rewrite it in the form y � mx � b ifnecessary. The slope is m, the coefficient of x.
4. If a line with unknown slope m1 is parallel or perpendicular to a line withknown slope m2, then use m1 � m2 for parallel lines or m1 � ��m
12
� forperpendicular lines.
So 2x � 4y � 1 has slope �12
� and the slope of any line perpendicular to
2x � 4y � 1 is the opposite of the reciprocal of �12
� or �2. The equation of the linethrough the y-intercept (0, 4) with slope �2 is y � �2x � 4.
Now do Exercises 77–90
10
�10
�15 15
U Calculator Close-Up V
If you use the same minimum and maximumwindow values for x and y, then the length ofone unit on the x-axis is larger than on they-axis because the screen is longer in thex-direction. In this case, perpendicular lineswill not look perpendicular. The viewing win-dow chosen here for the lines in Example 6makes them look perpendicular.
have a square feature that automaticallymakes the unit length the same on both axes.
Any viewing window proportional to this onewill also produce approximately the sameunit length on each axis. Some calculators
E X A M P L E 7 Changing formsA landscaper has a total of $800 to spend on bushes at $20 each and trees at $50 each. Soif x is the number of bushes and y is the number of trees he can buy, then 20x � 50y � 800.Write this equation in slope-intercept form. Find and interpret the y-intercept and the slope.
dug33491_ch03a.qxd 9/14/07 3:53 PM Page 206
Confirming Pages
3-37 3.3 Equations of Lines in Slope-Intercept Form 207
SolutionWrite in slope-intercept form:
20x � 50y � 80050y � �20x � 800
y � ��25
� x � 16
The slope is ��25
� and the intercept is (0, 16). So he can get 16 trees if he buys no bushes
and he loses �25
� of a tree for each additional bush that he purchases.
Now do Exercises 91–98
Warm-Ups ▼
True or false?
Explain your
answer.
1. There is only one line with y-intercept (0, 3) and slope ��43
�.
2. The equation of the line through (1, 2) with slope 3 is y � 3x � 2.
3. The vertical line x � �2 has no y-intercept.
4. The equation x � 5 has a graph that is a vertical line.
5. The line y � x � 3 is perpendicular to the line y � 5 � x.
6. The line y � 2x � 3 is parallel to the line y � 4x � 3.
7. The line 2y � 3x � 8 has a slope of 3.
8. Every straight line in the coordinate plane has an equation in standard form.
9. The line x � 2 is perpendicular to the line y � 5.
10. The line y � x has no y-intercept.
Reading and Writing After reading this section, write outthe answers to these questions. Use complete sentences.
1. What is the slope-intercept form for the equation of a line?
2. How can you determine the slope and y-intercept from theslope-intercept form.
3. What is the standard form for the equation of a line?
4. How can you graph a line when the equation is in slope-intercept form?
Exercises
U Study Tips V• Finding out what happened in class and attending class are not the same. Attend every class and be attentive.• Don’t just take notes and let your mind wander. Use class time as a learning time.
Boost your grade at mathzone.com!> Practice
Problems> NetTutor
> Self-Tests> e-Professors> Videos
3.3
dug33491_ch03a.qxd 9/14/07 3:53 PM Page 207
Confirming Pages
208 Chapter 3 Linear Equations in Two Variables and Their Graphs 3-38
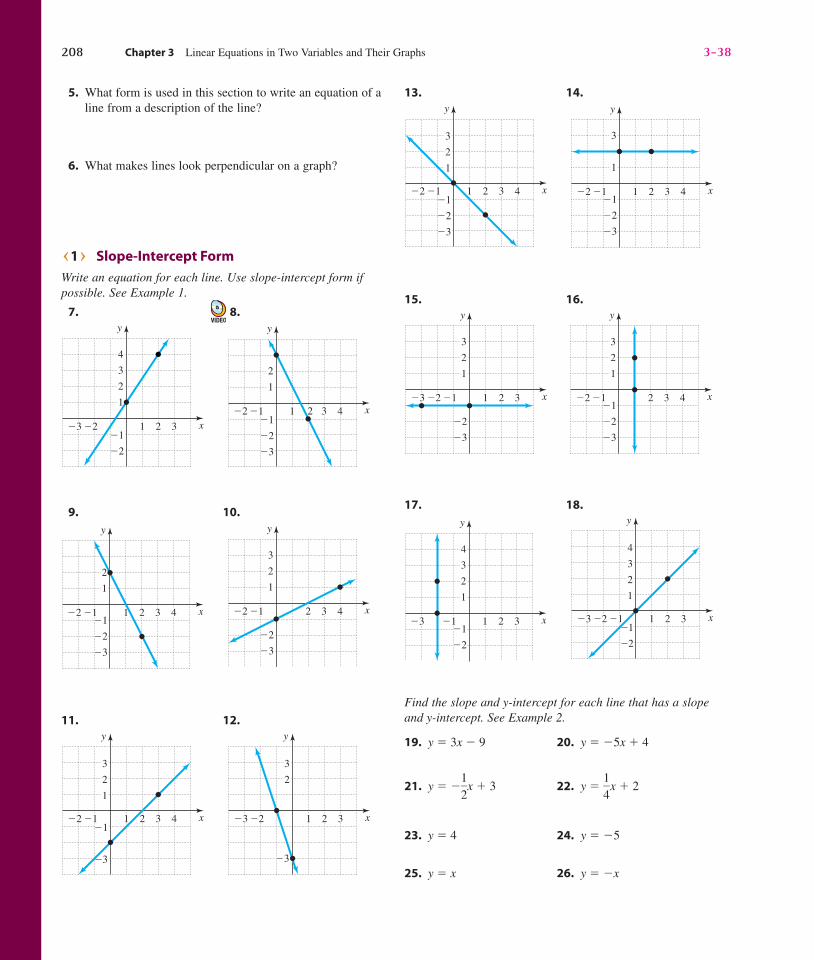
5. What form is used in this section to write an equation of aline from a description of the line?
6. What makes lines look perpendicular on a graph?
U1V Slope-Intercept Form
Write an equation for each line. Use slope-intercept form ifpossible. See Example 1.
7. 8.
9. 10.
11. 12.
�3
3
3
y
x�2 1�3
2
21
3
3
y
x�1�2
1
2
4�1
�3
2
3
3
y
x�1�2
1
�3
2
2
�2
4
y
x�1
2
�2
1
�3
1�1
�2
3 42
y
x�1
2
�2
1
�3
1�1
�2
3 42
3
y
x
3
�2 1�1
2
�2
�3
4
2
1
13. 14.
15. 16.
17. 18.
Find the slope and y-intercept for each line that has a slopeand y-intercept. See Example 2.
19. y � 3x � 9 20. y � �5x � 4
21. y � ��12
�x � 3 22. y � �14
�x � 2
23. y � 4 24. y � �5
25. y � x 26. y � �x
�1
3
3
y
x�2
1
1�3
2
2
�2
4
�1�1
3
3
y
x
1
1�3
2
2
�2
4
�1
3
3
y
x�2
1
�3
�1
�2
2
2
�14
3
y
x�1�2
�3
1�3
2
�2
2
1
3
3
3
y
x�1�2
1
�3
1�1
2 4
�2
3
3
y
x�1�2
1
�3
1
�2
�12 4
2
dug33491_ch03a.qxd 9/14/07 3:53 PM Page 208
Confirming Pages
27. y � �3x 28. y � 2x
29. x � y � 5 30. x � y � 4
31. x � 2y � 4 32. x � 2y � 3
33. 2x � 5y � 10 34. 2x � 3y � 9
35. 2x � y � 3 � 0 36. 3x � 4y � 8 � 0
37. x � �3
38. �23
� x � 4
U2V Standard Form
Write each equation in standard form using only integers. See Example 3.
39. y � �x � 2 40. y � 3x � 5
41. y � �12
� x � 3 42. y � �23
� x � 4
43. y � �32
� x � �13
� 44. y � �45
� x � �2
3�
45. y � ��35
� x � �170� 46. y � ��
23
� x � �56
�
47. �35
� x � 6 � 0 48. �12
� x � 9 � 0
49. �34
� y � �52
� 50. �23
� y � �19
�
51. �2x
� � �35y� 52. �
8x
� � ��45y�
53. y � 0.02x � 0.5 54. 0.2x � 0.03y � 0.1
U3V Using Slope-Intercept Form for Graphing
Graph each line using its y-intercept and slope.
See Examples 4 and 5.
See the Strategy for Graphing a Line Using y-Intercept andSlope on page 204.
55. y � 2x � 1 56. y � 3x � 2
57. y � �3x � 5 58. y � �4x � 1
59. y � �34
� x � 2 60. y � �32
� x � 4
61. 2y � x � 0 62. 2x � y � 0
63. 3x � 2y � 10 64. 4x � 3y � 9
3-39 3.3 Equations of Lines in Slope-Intercept Form 209
dug33491_ch03a.qxd 9/14/07 3:53 PM Page 209
Confirming Pages
210 Chapter 3 Linear Equations in Two Variables and Their Graphs 3-40
65. 4y � x � 8 66. y � 4x � 8
67. y � 2 � 0 68. y � 5 � 0
In each case determine whether the lines are parallel,perpendicular, or neither.
69. y � 3x � 4 70. y � �5x � 7
y � 3x � 9 y � �15
� x � 6
71. y � 2x � 1 72. y � x � 7y � �2x � 1 y � �x � 2
73. y � 3 74. y � 3x � 2
y � ��13
� y � �13
� x � 4
75. y � �4x � 1 76. y � �13
� x � �12
�
y � �14
� x � 5 y � �13
� x � 2
U4V Writing the Equation for a Line
Write an equation in slope-intercept form, if possible, for eachline. See Example 6.
77. The line through (0, �4) with slope �12
�
78. The line through (0, 4) with slope ��12
�
79. The line through (0, 3) that is parallel to the line y � 2x � 1
80. The line through (0, �2) that is parallel to the line
y � ��13
�x � 6
81. The line through (0, 6) that is perpendicular to the line
y � 3x � 5
82. The line through (0, �1) that is perpendicular to the liney � x
83. The line with y-intercept (0, 3) that is parallel to the line2x � y � 5
84. The line through the origin that is parallel to the liney � 3x � �3
85. The line through (2, 3) that runs parallel to the x-axis
86. The line through (�3, 5) that runs parallel to the y-axis
87. The line through (0, 4) that is perpendicular to
2x � 3y � 6
88. The line through (0, �1) that is perpendicular to
2x � 5y � 10
89. The line through (0, 4) and (5, 0)
90. The line through (0, �3) and (4, 0)
U5V Applications
Solve each problem. See Example 7.
91. Labor cost. An appliance repair service uses the formulaC � 50n � 80 to determine the labor cost for a service call,where C is the cost in dollars and n is the number of hours.
a) Find the cost of labor for n � 0, 1, and 2 hours.
b) Find the slope and C-intercept for the line C � 50n � 80.
c) Interpret the slope and C-intercept.
92. Decreasing price. World Auto uses the formula P � �3000n � 17,000 to determine the wholesale pricefor a used Ford Focus, where P is the price in dollars and nis the age of the car in years.
a) Find the price for a Focus that is 1, 2, or 3 years old.
b) Find the slope and P-intercept for the lineP � �3000n � 17,000.
c) Interpret the slope and P-intercept.
93. Marginal cost. A manufacturer plans to spend $150,000on research and development for a new lawn mower andthen $200 to manufacture each mower. The formulaC � 200n � 150,000 gives the cost in dollars of n mowers.What is the cost of 5000 mowers? What is the cost of 5001
dug33491_ch03a.qxd 9/14/07 3:53 PM Page 210

Confirming Pages
mowers? By how much did the one extra lawn mowerincrease the cost? (The increase in cost is called themarginal cost of the 5001st lawn mower.)
94. Marginal revenue. A defense attorney charges her client$4000 plus $120 per hour. The formula R � 120n � 4000gives her revenue in dollars for n hours of work. What isher revenue for 100 hours of work? What is her revenuefor 101 hours of work? By how much did the one extrahour of work increase the revenue? (The increase inrevenue is called the marginal revenue for the 101st hour.)
d) Use your equation to predict the percentage that will bereceiving training in 2010.
96. Single women. The percentage of women in the 20–24 agegroup who have never married went from 55% in 1970 to73% in 2000 (Census Bureau, www.census.gov). Let 1970be year 0 and 2000 be year 30.
a) Find and interpret the slope of the line through thepoints (0, 55) and (30, 73).
b) Find the equation of the line in part (a).c) What is the meaning of the y-intercept?d) Use the equation to predict the percentage in 2010.e) If this trend continues, then in what year will the
percentage of women in the 20–24 age group who havenever married reach 100%?
97. Pansies and snapdragons. A nursery manager plans tospend $100 on 6-packs of pansies at 50 cents per pack andsnapdragons at 25 cents per pack. The equation 0.50x �0.25y � 100 can be used to model this situation.
a) What do x and y represent?
b) Graph the equation.
c) Write the equation in slope-intercept form.
d) What is the slope of the line?e) What does the slope tell you?
98. Pens and pencils. A bookstore manager plans to spend$60 on pens at 30 cents each and pencils at 10 cents each.
3-41 3.3 Equations of Lines in Slope-Intercept Form 211
Figure for Exercise 94
Rev
enue
(th
ousa
nds
of d
olla
rs)
16.5
16
15.597 98 99 100 101 102 103
Time (hours)
Marginalrevenue
95. In-house training. The accompanying graph shows thepercentage of U.S. workers receiving training by theiremployers (Department of Labor, www.dol.gov). Thepercentage went from 5% in 1982 to 29% in 2006.
a) Find and interpret the slope of the line.b) Write the equation of the line in slope-intercept form.c) What is the meaning of the y-intercept?
Figure for Exercise 95
6 12Years since 1982
18 24
10Perc
enta
ge 20
30
dug33491_ch03a.qxd 9/14/07 3:53 PM Page 211
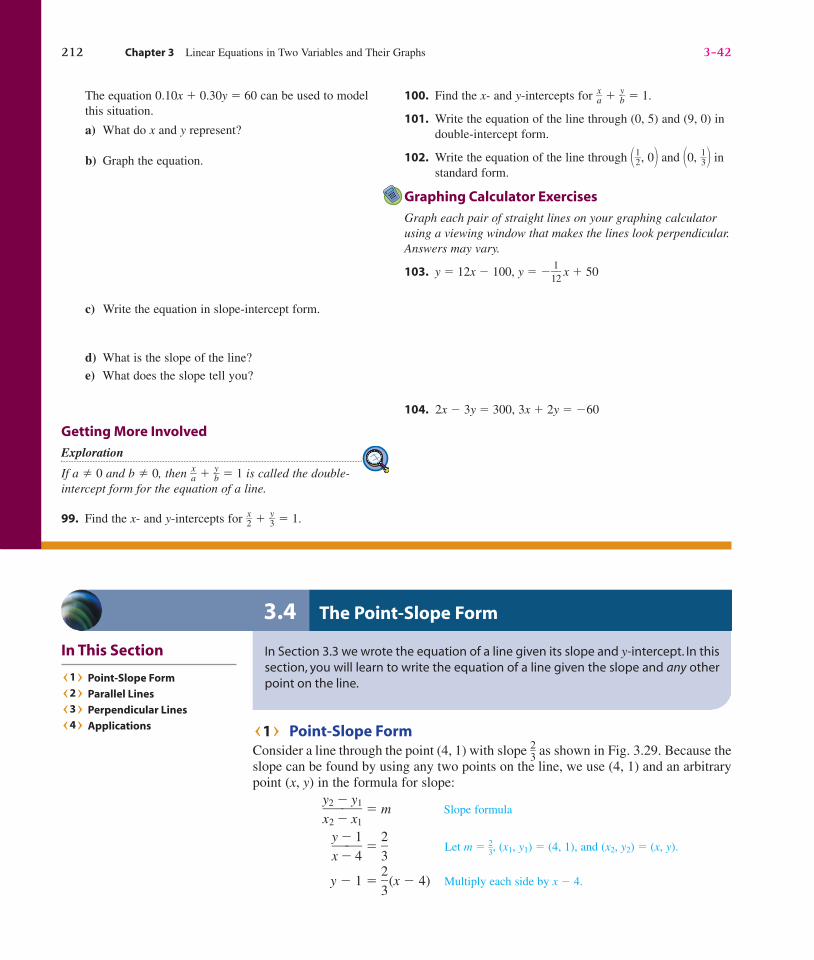
Confirming Pages
212 Chapter 3 Linear Equations in Two Variables and Their Graphs 3-42
100. Find the x- and y-intercepts for �ax
� � �by
� � 1.
101. Write the equation of the line through (0, 5) and (9, 0) indouble-intercept form.
102. Write the equation of the line through ��12�, 0� and �0, �
13�� in
standard form.
Graphing Calculator Exercises
Graph each pair of straight lines on your graphing calculatorusing a viewing window that makes the lines look perpendicular.Answers may vary.
103. y � 12x � 100, y � ��112� x � 50
104. 2x � 3y � 300, 3x � 2y � �60
The equation 0.10x � 0.30y � 60 can be used to modelthis situation.
a) What do x and y represent?
b) Graph the equation.
c) Write the equation in slope-intercept form.
d) What is the slope of the line?
e) What does the slope tell you?
Getting More Involved
Exploration
If a � 0 and b � 0, then �ax
� � �by
� � 1 is called the double-intercept form for the equation of a line.
99. Find the x- and y-intercepts for �2x
� � �3y
� � 1.
3.4 The Point-Slope Form
In Section 3.3 we wrote the equation of a line given its slope and y-intercept. In thissection, you will learn to write the equation of a line given the slope and any otherpoint on the line.
In This Section
U1V Point-Slope Form
U2V Parallel Lines
U3V Perpendicular Lines
U4V ApplicationsU1V Point-Slope FormConsider a line through the point (4, 1) with slope �
23
� as shown in Fig. 3.29. Because theslope can be found by using any two points on the line, we use (4, 1) and an arbitrarypoint (x, y) in the formula for slope:
�y
x2
2
�
�
y
x1
1� � m Slope formula
�y
x
�
�
14
� � �23
� Let m � �23
�, (x1, y1) � (4, 1), and (x2, y2) � (x, y).
y � 1 � �23
�(x � 4) Multiply each side by x � 4.
dug33491_ch03a.qxd 9/14/07 3:53 PM Page 212
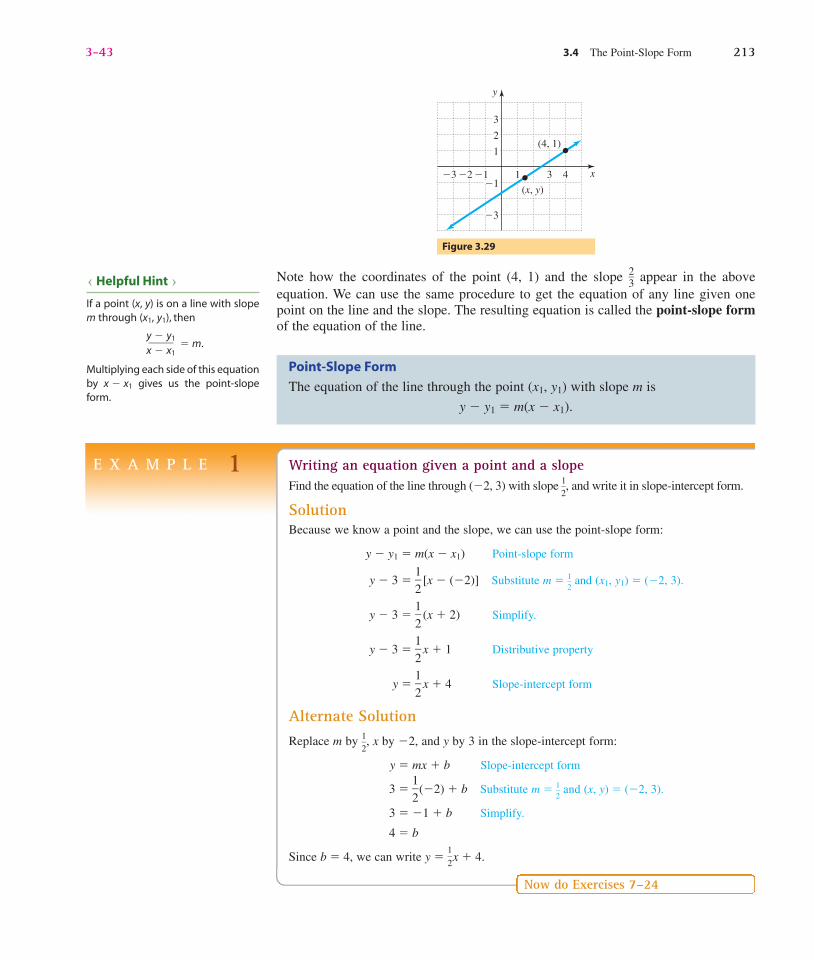
Confirming Pages
3-43 3.4 The Point-Slope Form 213
E X A M P L E 1
U Helpful Hint V
If a point (x, y) is on a line with slopem through (x1, y1), then
� m.
Multiplying each side of this equationby x � x1 gives us the point-slopeform.
y � y1�
x � x1
Writing an equation given a point and a slopeFind the equation of the line through (�2, 3) with slope �
12
�, and write it in slope-intercept form.
SolutionBecause we know a point and the slope, we can use the point-slope form:
y � y1 � m(x � x1) Point-slope form
y � 3 � �12
� [x � (�2)] Substitute m � �12
� and (x1, y1) � (�2, 3).
y � 3 � �12
� (x � 2) Simplify.
y � 3 � �12
� x � 1 Distributive property
y � �12
� x � 4 Slope-intercept form
Alternate SolutionReplace m by �
12
�, x by �2, and y by 3 in the slope-intercept form:
y � mx � b Slope-intercept form
3 � �12
�(�2) � b Substitute m � �12
� and (x, y) � (�2, 3).
3 � �1 � b Simplify.
4 � b
Since b � 4, we can write y � �1
2� x � 4.
Now do Exercises 7–24
Note how the coordinates of the point (4, 1) and the slope �23
� appear in the above equation. We can use the same procedure to get the equation of any line given onepoint on the line and the slope. The resulting equation is called the point-slope formof the equation of the line.
Figure 3.29
y
x4
3
3
1
�3
2
1�1
(4, 1)
(x, y)
�2�3 �1
Point-Slope Form
The equation of the line through the point (x1, y1) with slope m is
y � y1 � m(x � x1).
dug33491_ch03a.qxd 9/14/07 3:53 PM Page 213
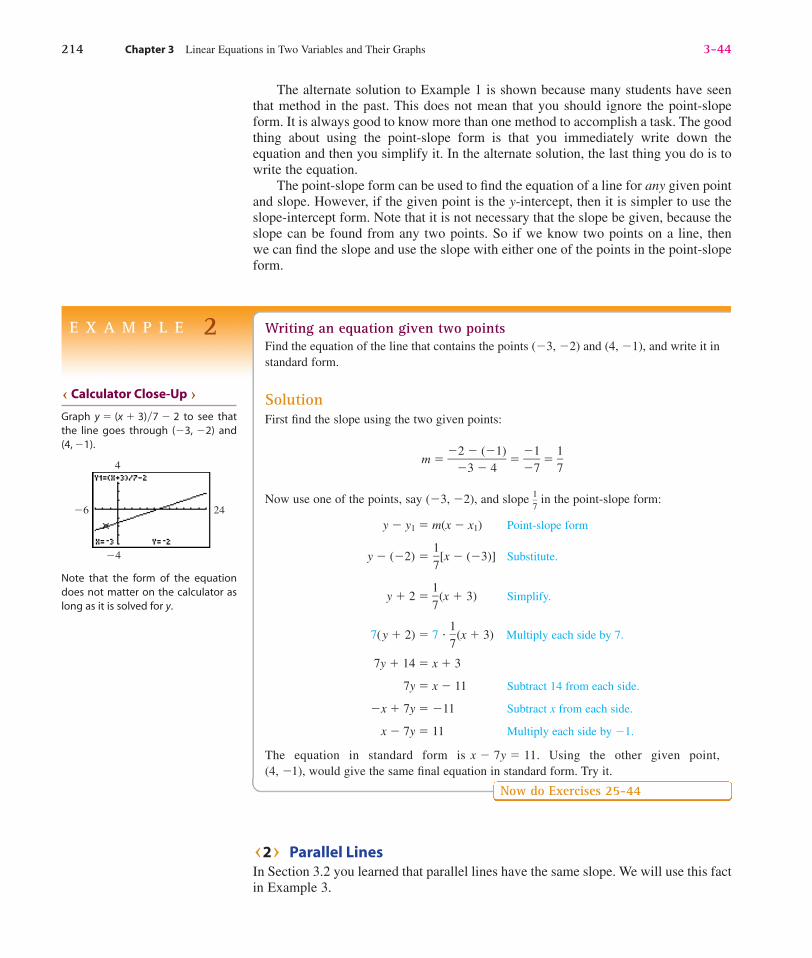
Confirming Pages
The alternate solution to Example 1 is shown because many students have seenthat method in the past. This does not mean that you should ignore the point-slopeform. It is always good to know more than one method to accomplish a task. The goodthing about using the point-slope form is that you immediately write down theequation and then you simplify it. In the alternate solution, the last thing you do is towrite the equation.
The point-slope form can be used to find the equation of a line for any given pointand slope. However, if the given point is the y-intercept, then it is simpler to use theslope-intercept form. Note that it is not necessary that the slope be given, because theslope can be found from any two points. So if we know two points on a line, thenwe can find the slope and use the slope with either one of the points in the point-slopeform.
E X A M P L E 2 Writing an equation given two pointsFind the equation of the line that contains the points (�3, �2) and (4, �1), and write it instandard form.
SolutionFirst find the slope using the two given points:
m � ��
�
23�
�
(�41)
� � ��
�
17
� � �17
�
Now use one of the points, say (�3, �2), and slope �17
� in the point-slope form:
y � y1 � m(x � x1) Point-slope form
y � (�2) � �17
�[x � (�3)] Substitute.
y � 2 � �17
�(x � 3) Simplify.
7(y � 2) � 7 � �17
�(x � 3) Multiply each side by 7.
7y � 14 � x � 3
7y � x � 11 Subtract 14 from each side.
�x � 7y � �11 Subtract x from each side.
x � 7y � 11 Multiply each side by �1.
The equation in standard form is x � 7y � 11. Using the other given point, (4, �1), would give the same final equation in standard form. Try it.
Now do Exercises 25-44
U2V Parallel LinesIn Section 3.2 you learned that parallel lines have the same slope. We will use this factin Example 3.
U Calculator Close-Up V
Graph y � (x � 3)�7 � 2 to see thatthe line goes through (�3, �2) and(4, �1).
Note that the form of the equationdoes not matter on the calculator aslong as it is solved for y.
4
�4
24�6
214 Chapter 3 Linear Equations in Two Variables and Their Graphs 3-44
dug33491_ch03b.qxd 9/14/07 4:04 PM Page 214
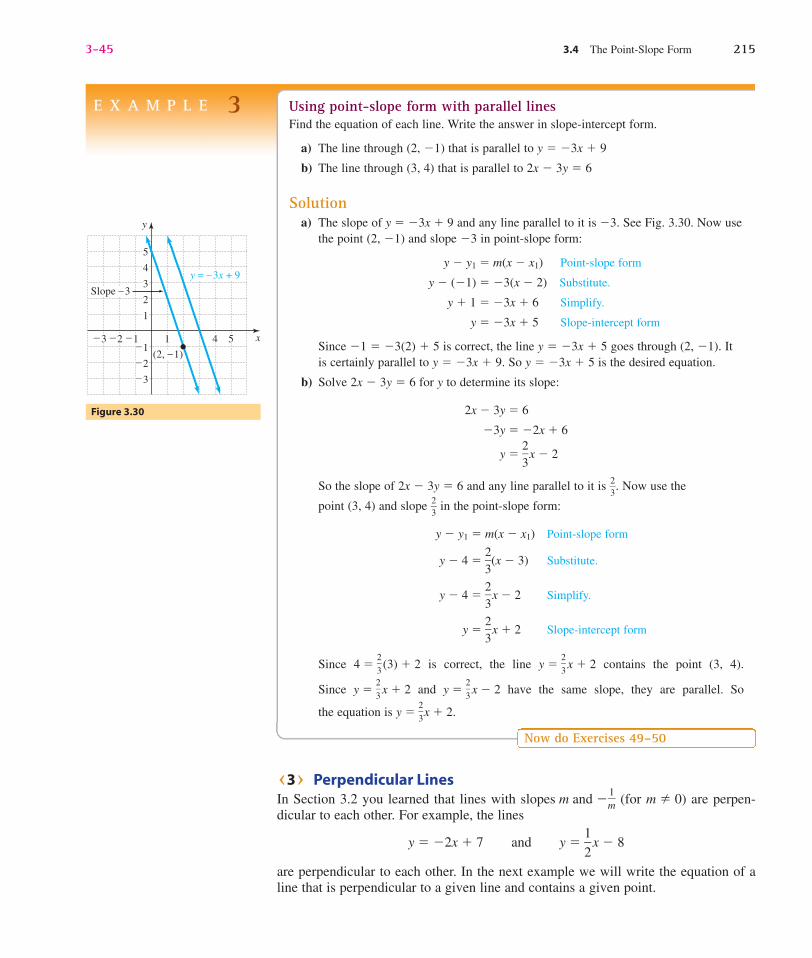
Confirming Pages
3-45 3.4 The Point-Slope Form 215
E X A M P L E 3 Using point-slope form with parallel linesFind the equation of each line. Write the answer in slope-intercept form.
a) The line through (2, �1) that is parallel to y � �3x � 9
b) The line through (3, 4) that is parallel to 2x � 3y � 6
Solutiona) The slope of y � �3x � 9 and any line parallel to it is �3. See Fig. 3.30. Now use
the point (2, �1) and slope �3 in point-slope form:
y � y1 � m(x � x1) Point-slope form
y � (�1) � �3(x � 2) Substitute.
y � 1 � �3x � 6 Simplify.
y � �3x � 5 Slope-intercept form
Since �1 � �3(2) � 5 is correct, the line y � �3x � 5 goes through (2, �1). Itis certainly parallel to y � �3x � 9. So y � �3x � 5 is the desired equation.
b) Solve 2x � 3y � 6 for y to determine its slope:
2x � 3y � 6
�3y � �2x � 6
y � �23
� x � 2
So the slope of 2x � 3y � 6 and any line parallel to it is �23
�. Now use the
point (3, 4) and slope �23
� in the point-slope form:
y � y1 � m(x � x1) Point-slope form
y � 4 � �23
�(x � 3) Substitute.
y � 4 � �23
� x � 2 Simplify.
y � �23
� x � 2 Slope-intercept form
Since 4 � �2
3� (3) � 2 is correct, the line y � �
2
3� x � 2 contains the point (3, 4).
Since y � �2
3� x � 2 and y � �
2
3� x � 2 have the same slope, they are parallel. So
the equation is y � �2
3�x � 2.
Now do Exercises 49–50
Figure 3.30
�1�3 4 5�1
�2
�3
1
3
�2
2
1
4
5
y
x
Slope –3
y = –3x + 9
(2, –1)
U3V Perpendicular LinesIn Section 3.2 you learned that lines with slopes m and ��
m1
� (for m � 0) are perpen-dicular to each other. For example, the lines
y � �2x � 7 and y � �12
� x � 8
are perpendicular to each other. In the next example we will write the equation of aline that is perpendicular to a given line and contains a given point.
dug33491_ch03b.qxd 9/14/07 4:04 PM Page 215

Confirming Pages
216 Chapter 3 Linear Equations in Two Variables and Their Graphs 3-46
U4V ApplicationsWe use the point-slope form to find the equation of a line given two points on the line.In Example 5, we use that same procedure to find a linear equation that relates twovariables in an applied situation.
E X A M P L E 4 Writing an equation given a point and a perpendicular lineWrite the equation of the line that is perpendicular to 3x � 2y � 8 and contains the point(1, �3). Write the answer in slope-intercept form.
SolutionFirst graph 3x � 2y � 8 and a line through (1, �3) that is perpendicular to 3x � 2y � 8as shown in Fig. 3.31. The right angle symbol is used in the figure to indicate that the linesare perpendicular. Now write 3x � 2y � 8 in slope-intercept form to determine its slope:
3x � 2y � 8
2y � �3x � 8
y � ��32
�x � 4 Slope-intercept form
The slope of the given line is ��32
�. The slope of any line perpendicular to it is �23
�. Now we
use the point-slope form with the point (1, �3) and the slope �23
�:
y � y1 � m(x � x1) Point-slope form
y � (�3) � �23
� (x � 1)
y � 3 � �23
�x � �23
�
y � �23
�x � �23
� � 3 Subtract 3 from each side.
y � �23
�x � �131� Slope-intercept form
So y � �2
3� x � �
1
3
1� is the equation of the line that contains (1, �3) and is perpendicular
to 3x � 2y � 8. Check that (1, �3) satisfies y � �2
3�x � �
1
3
1�.
Now do Exercises 51–60
Figure 3.31
4�1
�2
�5
�3
1 2
3
2
1
y
x
3x � 2y � 8
(1, �3)Slope 2—
3 Slope 3� — 2
�2�3 �1
U Calculator Close-Up V
Graph y1 � (2�3)x � 11�3 and y2 �(�3�2)x � 4 as shown:
Because the lines look perpendicularand y1 goes through (1, �3), thegraph supports the answer toExample 4.
10
�10
15�15
dug33491_ch03b.qxd 9/14/07 4:04 PM Page 216

Confirming Pages
3-47 3.4 The Point-Slope Form 217
E X A M P L E 5 Writing a formula given two pointsA contractor charges $30 for installing 100 feet of pipe and $120 for installing 500 feet ofpipe. To determine the charge he uses a linear equation that gives the charge C in terms ofthe length L. Find the equation and find the charge for installing 240 feet of pipe.
SolutionBecause C is determined from L, we let C take the place of the dependent variable y andlet L take the place of the independent variable x. So the ordered pairs are in the form(L, C). We can use the slope formula to find the slope of the line through the two points(100, 30) and (500, 120) shown in Fig. 3.32.
m � � �9�40
90�400
120 � 30��500 � 100
0
30
60
90
120
100 200 300 400 500
C
L
(100, 30)
(500, 120)
Figure 3.32
Now we use the point-slope form with the point (100, 30) and slope �490�:
y � y1 � m(x � x1)
C � 30 � �490�(L � 100)
C � 30 � �490�L � �
425�
C � �490�L � �
425� � 30
C � �490�L � �
125�
Note that C � �4
9
0�L � �
1
2
5� means that the charge is �
490� dollars/foot plus a fixed charge
of �1
2
5� dollars (or $7.50). We can now find C when L � 240:
C � � 240 � �125�
C � 54 � 7.5
C � 61.5
The charge for installing 240 feet of pipe is $61.50.
Now do Exercises 79–94
9�40
dug33491_ch03b.qxd 9/14/07 4:04 PM Page 217
Confirming Pages
218 Chapter 3 Linear Equations in Two Variables and Their Graphs 3-48
Warm-Ups ▼
True or false?
Explain your
answer.
1. The formula y � m(x � x1) is the point-slope form for a line.
2. It is impossible to find the equation of a line through (2, 5) and (�3, 1).
3. The point-slope form will not work for the line through (3, 4) and (3, 6).
4. The equation of the line through the origin with slope 1 is y � x.
5. The slope of the line 5x � y � 4 is 5.
6. The slope of any line perpendicular to the line y � 4x � 3 is ��14
�.
7. The slope of any line parallel to the line x � y � 1 is �1.
8. The line 2x � y � �1 goes through the point (�2, �3).
9. The lines 2x � y � 4 and y � �2x � 7 are parallel.
10. The equation of the line through (0, 0) perpendicular to y � x is y � �x.
Reading and Writing After reading this section, write outthe answers to these questions. Use complete sentences.
1. What is the point-slope form for the equation of a line?
2. For what is the point-slope form used?
3. What is the procedure for finding the equation of a linewhen given two points on the line?
4. How can you find the slope of a line when given theequation of the line?
5. What is the relationship between the slopes of parallellines?
6. What is the relationship between the slopes of perpendicularlines?
U1V Point-Slope Form
Write each equation in slope-intercept form. See Example 1.
7. x � y � 1
8. x � y � 1
9. y � 1 � 5(x � 2)
10. y � 3 � �3(x � 6)
Exercises
U Study Tips V• When taking a test, put a check mark beside every problem that you have answered and checked. Spend any extra time working on
unchecked problems.• Make sure that you don’t forget to answer any of the questions on a test.
Boost your grade at mathzone.com!> Practice
Problems> NetTutor
> Self-Tests> e-Professors> Videos
3.4
dug33491_ch03b.qxd 9/14/07 4:04 PM Page 218

Confirming Pages
3-49 3.4 The Point-Slope Form 219
11. 3x � 4y � 80
12. 2x � 3y � 90
13. y � �12
� � �23
��x � �14
��14. y � �
23
� � ��12
��x � �25
��Find the equation of the line that goes through the given pointand has the given slope. Write the answer in slope-interceptform. See Example 1.
15. (1, 2), 3 16. (2, 5), 4
17. (2, 4), �12
� 18. (4, 6), �12
�
19. (2, 3), �13
� 20. (1, 4), �14
�
21. (�2, 5), ��12
� 22. (�3, 1), ��13
�
23. (�1, �7), �6 24. (�1, �5), �8
Write each equation in standard form using only integers. See Example 2.
25. y � 3 � 2(x � 5) 26. y � 2 � �3(x � 1)
27. y � �1
2� x � 3 28. y � �
1
3� x � 5
29. y � 2 � �2
3� (x � 4) 30. y � 1 � �
32
�(x � 4)
Find the equation of the line through each given pair of points.Write the answer in standard form using only integers. See Example 2.
31. (1, 3), (2, 5) 32. (2, 5), (3, 9)
33. (1, 1), (2, 2) 34. (�1, 1), (1, �1)
35. (1, 2), (5, 8) 36. (3, 5), (8, 15)
37. (�2, �1), (3, �4) 38. (�1, �3), (2, �1)
39. (�2, 0), (0, 2) 40. (0, 3), (5, 0)
41. (2, 4), (2, 6) 42. (�3, 5), (�3, �1)
43. (�3, 9), (3, 9) 44. (2, 5), (4, 5)
U2–3V Parallel and Perpendicular Lines
The lines in each figure are perpendicular. Find the equation(in slope-intercept form) for the solid line.
45.
46.
47. y
x
(0, 2)
(3, 4)
(�5, 5)
y
x
(0, �2)
(3, 1)(�5, 1)
y
x
(0, 0)
(3, 3)
(5, �1)
dug33491_ch03b.qxd 9/14/07 4:04 PM Page 219
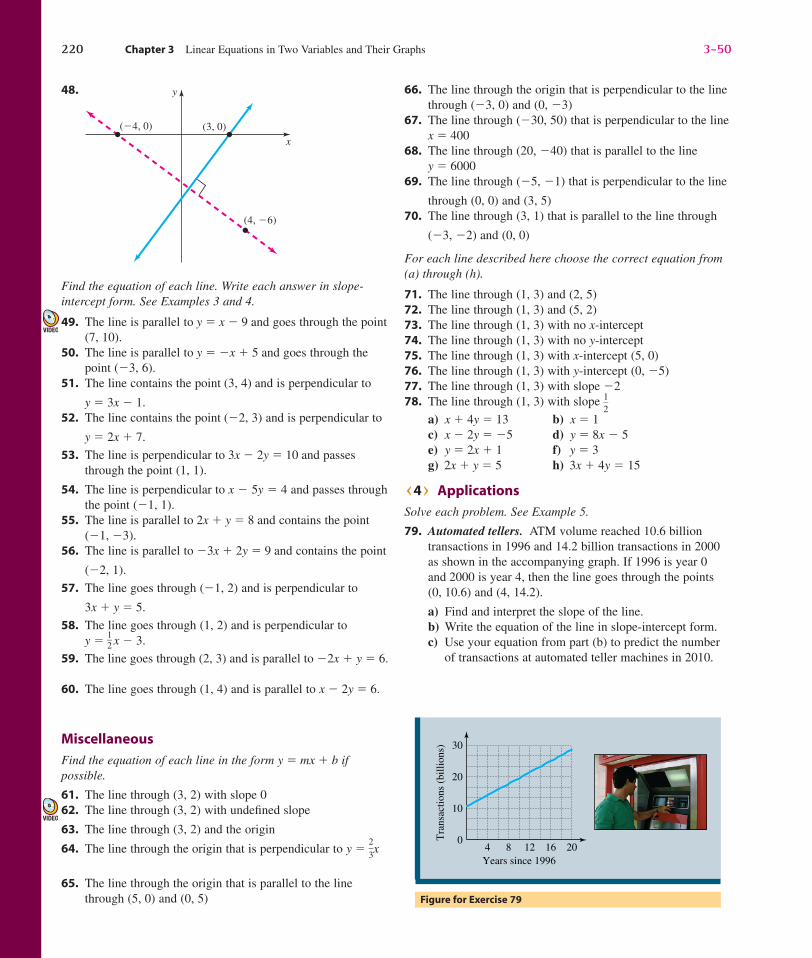
Confirming Pages
220 Chapter 3 Linear Equations in Two Variables and Their Graphs 3-50
48.
Find the equation of each line. Write each answer in slope-intercept form. See Examples 3 and 4.
49. The line is parallel to y � x � 9 and goes through the point(7, 10).
50. The line is parallel to y � �x � 5 and goes through thepoint (�3, 6).
51. The line contains the point (3, 4) and is perpendicular to
y � 3x � 1.52. The line contains the point (�2, 3) and is perpendicular to
y � 2x � 7.
53. The line is perpendicular to 3x � 2y � 10 and passes through the point (1, 1).
54. The line is perpendicular to x � 5y � 4 and passes throughthe point (�1, 1).
55. The line is parallel to 2x � y � 8 and contains the point(�1, �3).
56. The line is parallel to �3x � 2y � 9 and contains the point
(�2, 1).
57. The line goes through (�1, 2) and is perpendicular to
3x � y � 5.
58. The line goes through (1, 2) and is perpendicular toy � �
12
� x � 3.
59. The line goes through (2, 3) and is parallel to �2x � y � 6.
60. The line goes through (1, 4) and is parallel to x � 2y � 6.
Miscellaneous
Find the equation of each line in the form y � mx � b ifpossible.
61. The line through (3, 2) with slope 062. The line through (3, 2) with undefined slope
63. The line through (3, 2) and the origin
64. The line through the origin that is perpendicular to y � �2
3�x
65. The line through the origin that is parallel to the linethrough (5, 0) and (0, 5)
y
x
(4, �6)
(3, 0)(�4, 0)
66. The line through the origin that is perpendicular to the linethrough (�3, 0) and (0, �3)
67. The line through (�30, 50) that is perpendicular to the linex � 400
68. The line through (20, �40) that is parallel to the liney � 6000
69. The line through (�5, �1) that is perpendicular to the line
through (0, 0) and (3, 5)70. The line through (3, 1) that is parallel to the line through
(�3, �2) and (0, 0)
For each line described here choose the correct equation from(a) through (h).
71. The line through (1, 3) and (2, 5)72. The line through (1, 3) and (5, 2)73. The line through (1, 3) with no x-intercept74. The line through (1, 3) with no y-intercept75. The line through (1, 3) with x-intercept (5, 0)76. The line through (1, 3) with y-intercept (0, �5)77. The line through (1, 3) with slope �278. The line through (1, 3) with slope �
12
�
a) x � 4y � 13 b) x � 1c) x � 2y � �5 d) y � 8x � 5e) y � 2x � 1 f) y � 3g) 2x � y � 5 h) 3x � 4y � 15
U4V Applications
Solve each problem. See Example 5.
79. Automated tellers. ATM volume reached 10.6 billiontransactions in 1996 and 14.2 billion transactions in 2000as shown in the accompanying graph. If 1996 is year 0and 2000 is year 4, then the line goes through the points(0, 10.6) and (4, 14.2).
a) Find and interpret the slope of the line.b) Write the equation of the line in slope-intercept form.c) Use your equation from part (b) to predict the number
of transactions at automated teller machines in 2010.
Figure for Exercise 79
4 8Years since 1996
12 16 200
10
20
Tra
nsac
tions
(bi
llion
s) 30
dug33491_ch03b.qxd 9/14/07 4:04 PM Page 220
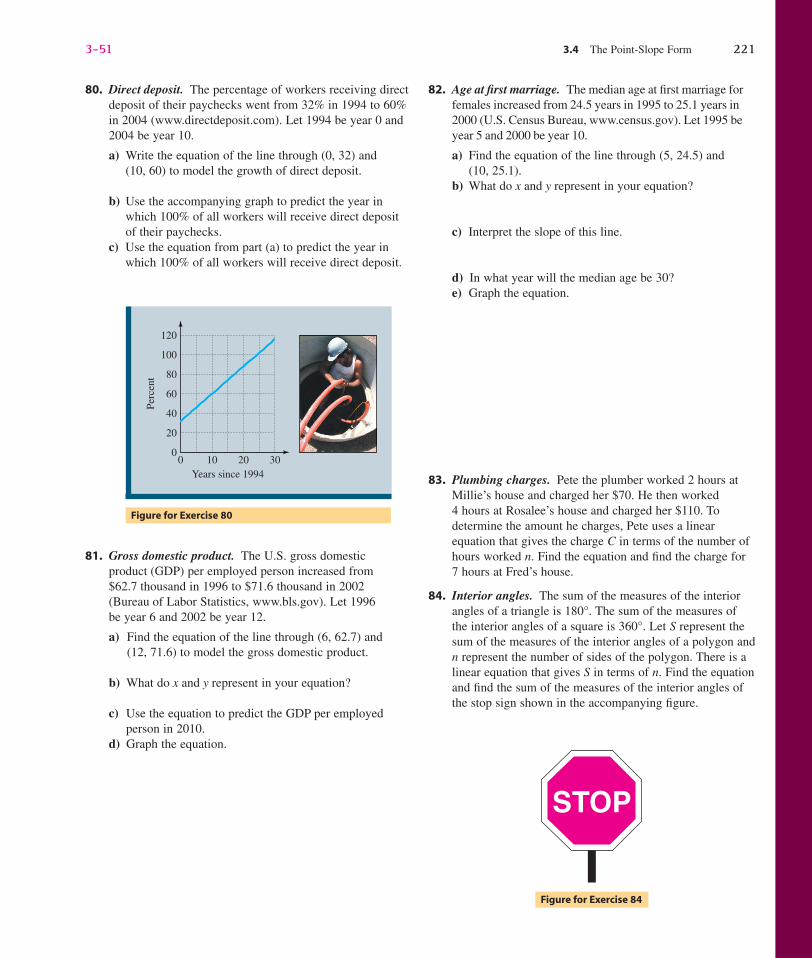
Confirming Pages
3-51 3.4 The Point-Slope Form 221
80. Direct deposit. The percentage of workers receiving directdeposit of their paychecks went from 32% in 1994 to 60%in 2004 (www.directdeposit.com). Let 1994 be year 0 and2004 be year 10.
a) Write the equation of the line through (0, 32) and (10, 60) to model the growth of direct deposit.
b) Use the accompanying graph to predict the year inwhich 100% of all workers will receive direct depositof their paychecks.
c) Use the equation from part (a) to predict the year inwhich 100% of all workers will receive direct deposit.
82. Age at first marriage. The median age at first marriage forfemales increased from 24.5 years in 1995 to 25.1 years in2000 (U.S. Census Bureau, www.census.gov). Let 1995 beyear 5 and 2000 be year 10.
a) Find the equation of the line through (5, 24.5) and (10, 25.1).
b) What do x and y represent in your equation?
c) Interpret the slope of this line.
d) In what year will the median age be 30?e) Graph the equation.
83. Plumbing charges. Pete the plumber worked 2 hours atMillie’s house and charged her $70. He then worked4 hours at Rosalee’s house and charged her $110. Todetermine the amount he charges, Pete uses a linearequation that gives the charge C in terms of the number ofhours worked n. Find the equation and find the charge for7 hours at Fred’s house.
84. Interior angles. The sum of the measures of the interiorangles of a triangle is 180°. The sum of the measures ofthe interior angles of a square is 360°. Let S represent thesum of the measures of the interior angles of a polygon andn represent the number of sides of the polygon. There is alinear equation that gives S in terms of n. Find the equationand find the sum of the measures of the interior angles ofthe stop sign shown in the accompanying figure.
Figure for Exercise 80
Perc
ent
120
100
40
20
0
80
60
0 10 20 30Years since 1994
81. Gross domestic product. The U.S. gross domesticproduct (GDP) per employed person increased from$62.7 thousand in 1996 to $71.6 thousand in 2002(Bureau of Labor Statistics, www.bls.gov). Let 1996be year 6 and 2002 be year 12.
a) Find the equation of the line through (6, 62.7) and(12, 71.6) to model the gross domestic product.
b) What do x and y represent in your equation?
c) Use the equation to predict the GDP per employedperson in 2010.
d) Graph the equation.
Figure for Exercise 84
STOP
dug33491_ch03b.qxd 9/14/07 4:04 PM Page 221
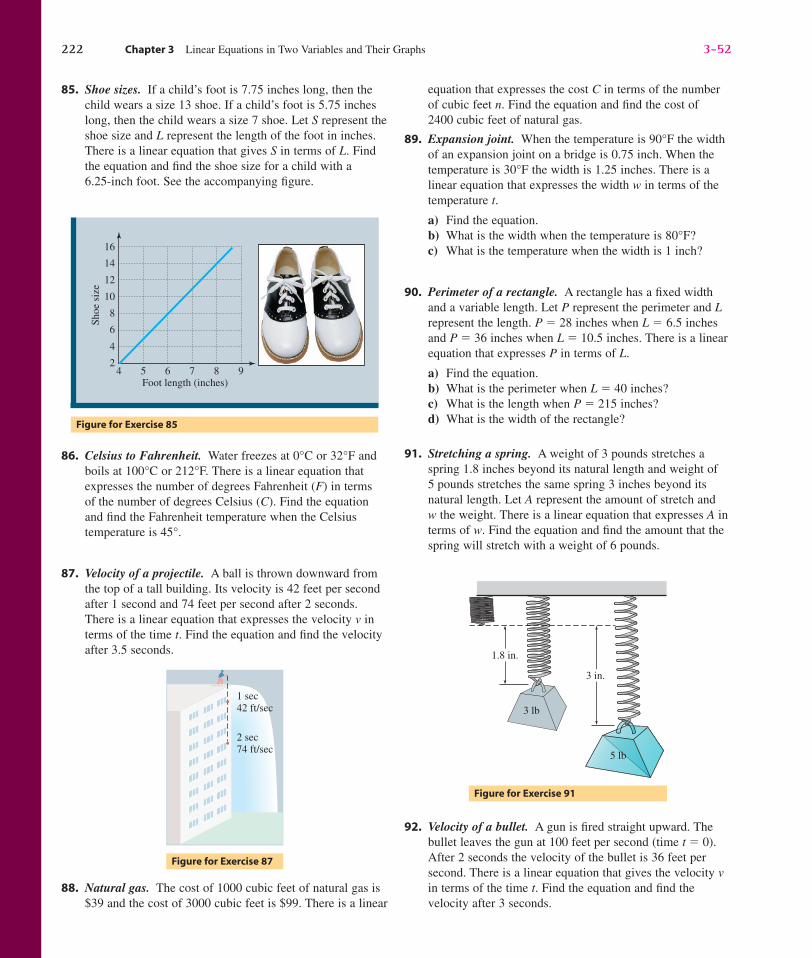
Confirming Pages
222 Chapter 3 Linear Equations in Two Variables and Their Graphs 3-52
85. Shoe sizes. If a child’s foot is 7.75 inches long, then thechild wears a size 13 shoe. If a child’s foot is 5.75 incheslong, then the child wears a size 7 shoe. Let S represent theshoe size and L represent the length of the foot in inches.There is a linear equation that gives S in terms of L. Findthe equation and find the shoe size for a child with a6.25-inch foot. See the accompanying figure.
equation that expresses the cost C in terms of the numberof cubic feet n. Find the equation and find the cost of2400 cubic feet of natural gas.
89. Expansion joint. When the temperature is 90°F the widthof an expansion joint on a bridge is 0.75 inch. When thetemperature is 30°F the width is 1.25 inches. There is alinear equation that expresses the width w in terms of thetemperature t.
a) Find the equation.b) What is the width when the temperature is 80°F?c) What is the temperature when the width is 1 inch?
90. Perimeter of a rectangle. A rectangle has a fixed widthand a variable length. Let P represent the perimeter and Lrepresent the length. P � 28 inches when L � 6.5 inchesand P � 36 inches when L � 10.5 inches. There is a linearequation that expresses P in terms of L.
a) Find the equation.b) What is the perimeter when L � 40 inches?c) What is the length when P � 215 inches?d) What is the width of the rectangle?
91. Stretching a spring. A weight of 3 pounds stretches aspring 1.8 inches beyond its natural length and weight of5 pounds stretches the same spring 3 inches beyond itsnatural length. Let A represent the amount of stretch andw the weight. There is a linear equation that expresses A interms of w. Find the equation and find the amount that thespring will stretch with a weight of 6 pounds.
86. Celsius to Fahrenheit. Water freezes at 0°C or 32°F andboils at 100°C or 212°F. There is a linear equation thatexpresses the number of degrees Fahrenheit (F) in termsof the number of degrees Celsius (C). Find the equationand find the Fahrenheit temperature when the Celsiustemperature is 45°.
87. Velocity of a projectile. A ball is thrown downward fromthe top of a tall building. Its velocity is 42 feet per secondafter 1 second and 74 feet per second after 2 seconds.There is a linear equation that expresses the velocity v interms of the time t. Find the equation and find the velocityafter 3.5 seconds.
Figure for Exercise 85
Shoe
siz
e
16
10
12
14
2
4
6
8
4 5 6 7 8 9Foot length (inches)
Figure for Exercise 87
1 sec42 ft/sec
2 sec74 ft/sec
Figure for Exercise 91
3 in.
5 lb
3 lb
1.8 in.
88. Natural gas. The cost of 1000 cubic feet of natural gas is$39 and the cost of 3000 cubic feet is $99. There is a linear
92. Velocity of a bullet. A gun is fired straight upward. Thebullet leaves the gun at 100 feet per second (time t � 0).After 2 seconds the velocity of the bullet is 36 feet persecond. There is a linear equation that gives the velocity vin terms of the time t. Find the equation and find thevelocity after 3 seconds.
dug33491_ch03b.qxd 9/14/07 4:04 PM Page 222
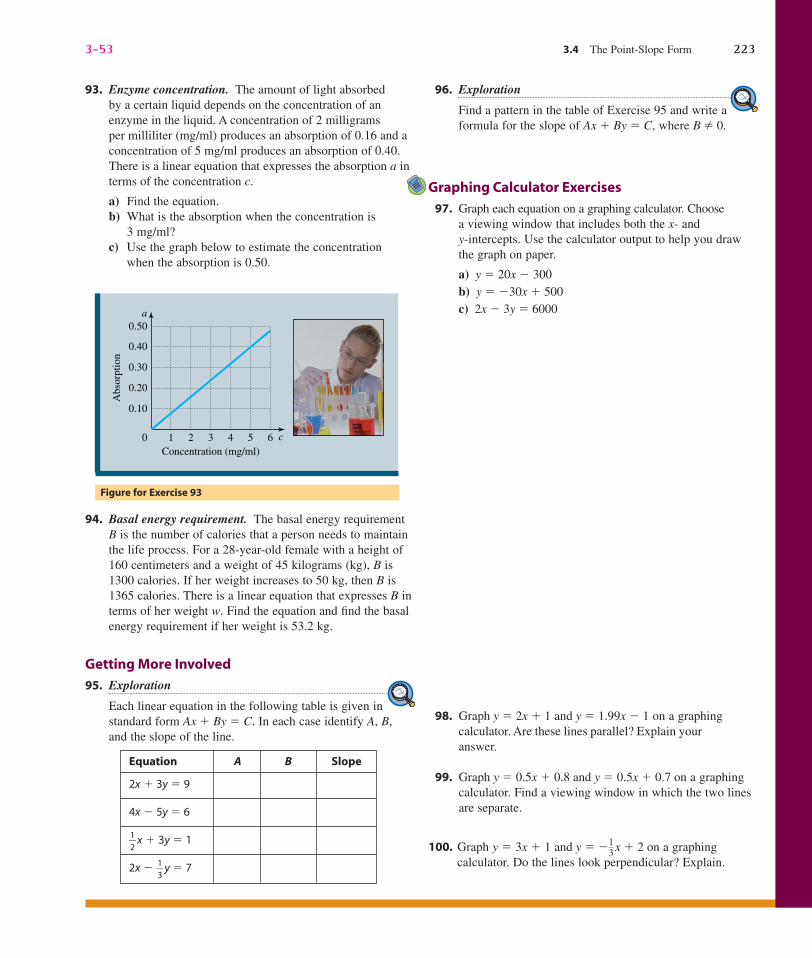
Confirming Pages
3-53 3.4 The Point-Slope Form 223
93. Enzyme concentration. The amount of light absorbedby a certain liquid depends on the concentration of anenzyme in the liquid. A concentration of 2 milligramsper milliliter (mg/ml) produces an absorption of 0.16 and aconcentration of 5 mg/ml produces an absorption of 0.40.There is a linear equation that expresses the absorption a interms of the concentration c.
a) Find the equation.b) What is the absorption when the concentration is
3 mg/ml?c) Use the graph below to estimate the concentration
when the absorption is 0.50.
96. Exploration
Find a pattern in the table of Exercise 95 and write aformula for the slope of Ax � By � C, where B � 0.
Graphing Calculator Exercises
97. Graph each equation on a graphing calculator. Choosea viewing window that includes both the x- and y-intercepts. Use the calculator output to help you drawthe graph on paper.
a) y � 20x � 300b) y � �30x � 500c) 2x � 3y � 6000
98. Graph y � 2x � 1 and y � 1.99x � 1 on a graphingcalculator. Are these lines parallel? Explain youranswer.
99. Graph y � 0.5x � 0.8 and y � 0.5x � 0.7 on a graphingcalculator. Find a viewing window in which the two linesare separate.
100. Graph y � 3x � 1 and y � ��13
� x � 2 on a graphingcalculator. Do the lines look perpendicular? Explain.
94. Basal energy requirement. The basal energy requirementB is the number of calories that a person needs to maintainthe life process. For a 28-year-old female with a height of160 centimeters and a weight of 45 kilograms (kg), B is1300 calories. If her weight increases to 50 kg, then B is1365 calories. There is a linear equation that expresses B interms of her weight w. Find the equation and find the basalenergy requirement if her weight is 53.2 kg.
Getting More Involved
95. Exploration
Each linear equation in the following table is given instandard form Ax � By � C. In each case identify A, B,and the slope of the line.
Equation A B Slope
2x � 3y � 9
4x � 5y � 6
�12
� x � 3y � 1
2x � �13
� y � 7
Figure for Exercise 93
c
a
0 1 2 3 4 5 6Concentration (mg/ml)
0.10
0.20
0.30
0.40
0.50
Abs
orpt
ion
dug33491_ch03b.qxd 9/14/07 4:04 PM Page 223
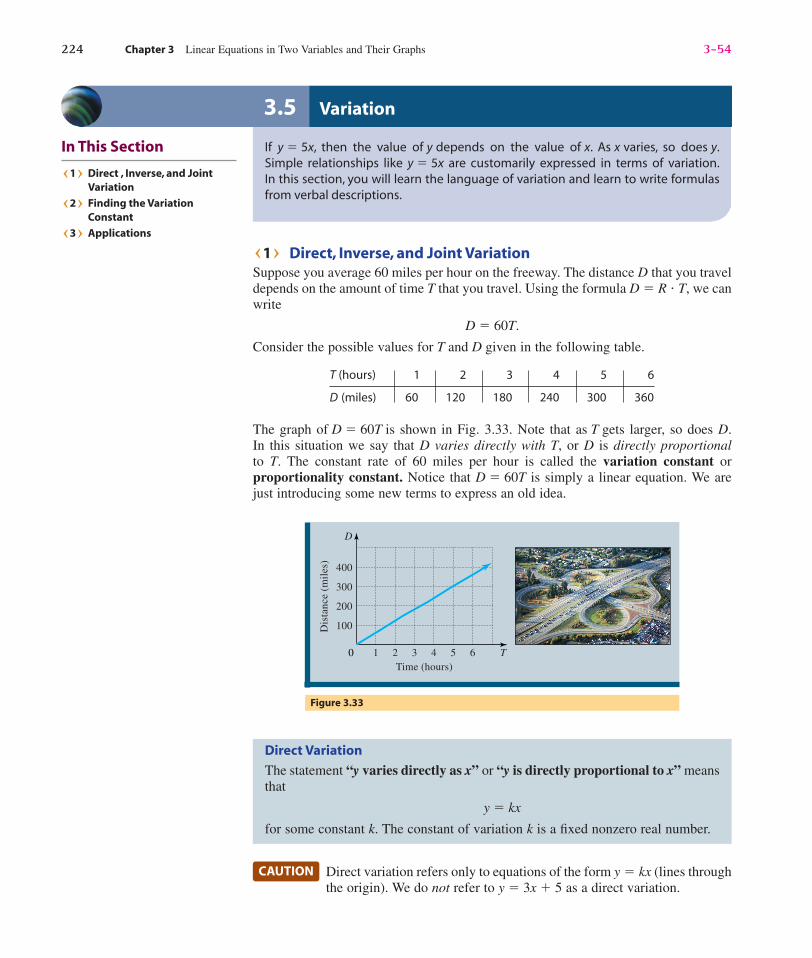
Confirming Pages
224 Chapter 3 Linear Equations in Two Variables and Their Graphs 3-54
U1V Direct, Inverse, and Joint VariationSuppose you average 60 miles per hour on the freeway. The distance D that you traveldepends on the amount of time T that you travel. Using the formula D � R � T, we canwrite
D � 60T.
Consider the possible values for T and D given in the following table.
The graph of D � 60T is shown in Fig. 3.33. Note that as T gets larger, so does D.In this situation we say that D varies directly with T, or D is directly proportionalto T. The constant rate of 60 miles per hour is called the variation constant orproportionality constant. Notice that D � 60T is simply a linear equation. We arejust introducing some new terms to express an old idea.
T (hours) 1 2 3 4 5 6
D (miles) 60 120 180 240 300 360
In This Section
U1V Direct , Inverse, and JointVariation
U2V Finding the VariationConstant
U3V Applications
3.5 Variation
If y � 5x, then the value of y depends on the value of x. As x varies, so does y.Simple relationships like y � 5x are customarily expressed in terms of variation.In this section, you will learn the language of variation and learn to write formulasfrom verbal descriptions.
0Time (hours)
Dis
tanc
e (m
iles
)
100
200
300
400
2 3 4 5 61
D
T
Figure 3.33
Direct variation refers only to equations of the form y � kx (lines throughthe origin). We do not refer to y � 3x � 5 as a direct variation.
CAUTION
Direct Variation
The statement “y varies directly as x” or “y is directly proportional to x” meansthat
y � kx
for some constant k. The constant of variation k is a fixed nonzero real number.
dug33491_ch03b.qxd 9/14/07 4:04 PM Page 224
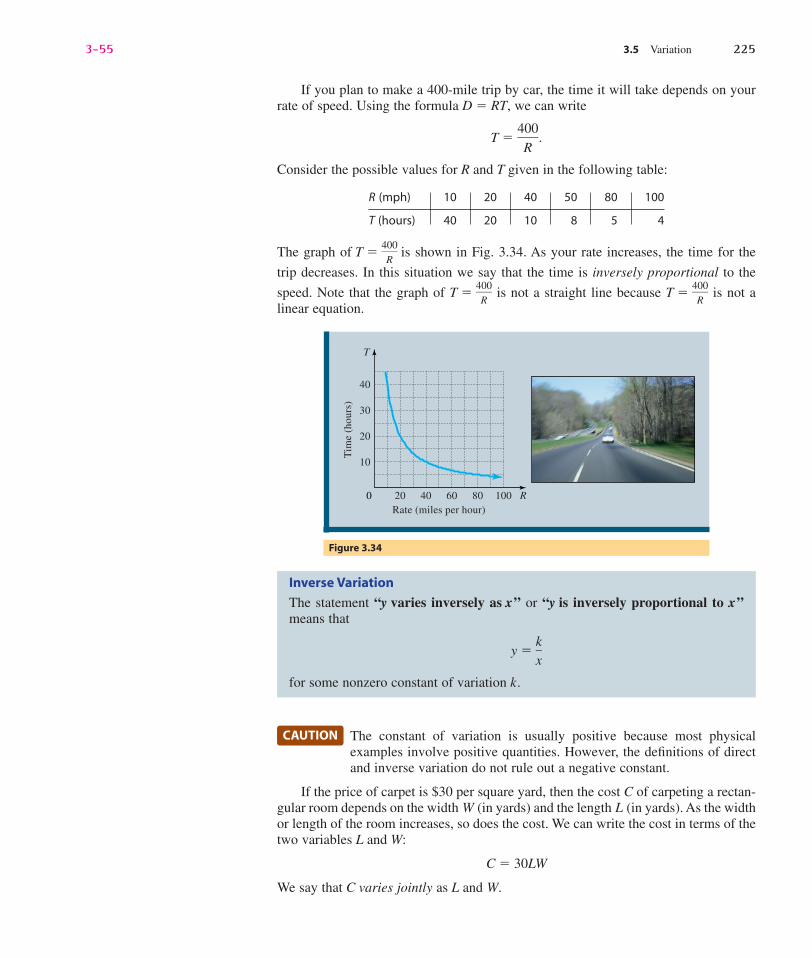
Confirming Pages
3-55 3.5 Variation 225
If you plan to make a 400-mile trip by car, the time it will take depends on yourrate of speed. Using the formula D � RT, we can write
T � .
Consider the possible values for R and T given in the following table:
R (mph) 10 20 40 50 80 100
T (hours) 40 20 10 8 5 4
The graph of T � �4R00� is shown in Fig. 3.34. As your rate increases, the time for the
trip decreases. In this situation we say that the time is inversely proportional to the
speed. Note that the graph of T � �4R00� is not a straight line because T � �
4R00� is not a
linear equation.
400�R
The constant of variation is usually positive because most physicalexamples involve positive quantities. However, the definitions of directand inverse variation do not rule out a negative constant.
If the price of carpet is $30 per square yard, then the cost C of carpeting a rectan-gular room depends on the width W (in yards) and the length L (in yards). As the widthor length of the room increases, so does the cost. We can write the cost in terms of thetwo variables L and W:
C � 30LW
We say that C varies jointly as L and W.
CAUTION
Inverse Variation
The statement “y varies inversely as x” or “y is inversely proportional to x”means that
y � �kx
�
for some nonzero constant of variation k.
0Rate (miles per hour)
Tim
e (h
ours
)
10
20
30
40
20 40 60 80 100
T
R
Figure 3.34
dug33491_ch03b.qxd 9/14/07 4:04 PM Page 225
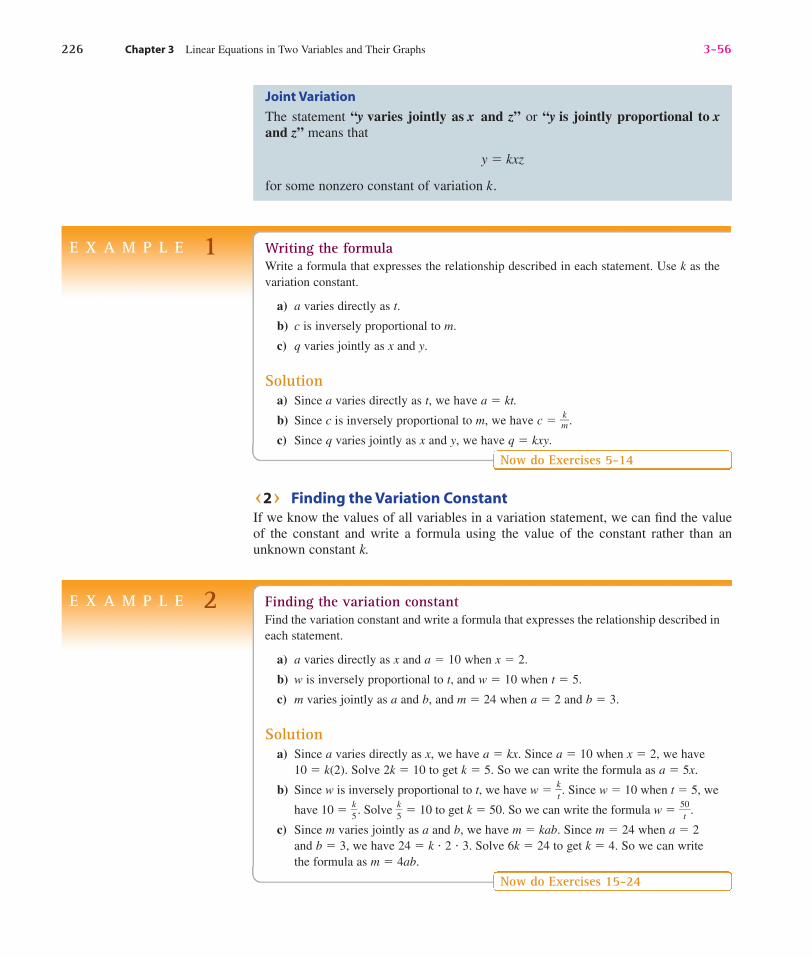
Confirming Pages
Joint Variation
The statement “y varies jointly as x and z” or “y is jointly proportional to xand z” means that
y � kxz
for some nonzero constant of variation k.
226 Chapter 3 Linear Equations in Two Variables and Their Graphs 3-56
E X A M P L E 1 Writing the formulaWrite a formula that expresses the relationship described in each statement. Use k as thevariation constant.
a) a varies directly as t.
b) c is inversely proportional to m.
c) q varies jointly as x and y.
Solutiona) Since a varies directly as t, we have a � kt.
b) Since c is inversely proportional to m, we have c � �mk�.
c) Since q varies jointly as x and y, we have q � kxy.
Now do Exercises 5-14
U2V Finding the Variation ConstantIf we know the values of all variables in a variation statement, we can find the valueof the constant and write a formula using the value of the constant rather than anunknown constant k.
E X A M P L E 2 Finding the variation constantFind the variation constant and write a formula that expresses the relationship described ineach statement.
a) a varies directly as x and a � 10 when x � 2.
b) w is inversely proportional to t, and w � 10 when t � 5.
c) m varies jointly as a and b, and m � 24 when a � 2 and b � 3.
Solutiona) Since a varies directly as x, we have a � kx. Since a � 10 when x � 2, we have
10 � k(2). Solve 2k � 10 to get k � 5. So we can write the formula as a � 5x.
b) Since w is inversely proportional to t, we have w � �kt�. Since w � 10 when t � 5, we
have 10 � �5k
�. Solve �5k
� � 10 to get k � 50. So we can write the formula w � �5t0�.
c) Since m varies jointly as a and b, we have m � kab. Since m � 24 when a � 2and b � 3, we have 24 � k � 2 � 3. Solve 6k � 24 to get k � 4. So we can writethe formula as m � 4ab.
Now do Exercises 15-24
dug33491_ch03b.qxd 9/14/07 4:04 PM Page 226

Confirming Pages
E X A M P L E 4 An inverse variation problemThe volume of a gas in a cylinder is inversely proportional to the pressure on the gas. If thevolume is 12 cubic centimeters when the pressure on the gas is 200 kilograms per squarecentimeter, then what is the volume when the pressure is 150 kilograms per square cen-timeter? See Fig. 3.35.
SolutionBecause the volume V is inversely proportional to the pressure P, we have
V � �Pk
�
for some constant k. Because V � 12 when P � 200, we can find k:
12 � �20
k0
�
200 � 12 � 200 � �20
k0
� Multiply each side by 200.
2400 � k
Now to find V when P � 150, we can use the formula V � �24
P00�:
V � �2145000
� � 16
So the volume is 16 cubic centimeters when the pressure is 150 kilograms per squarecentimeter.
Now do Exercises 27–28
E X A M P L E 3 A direct variation problemYour electric bill at Middle States Electric Co-op varies directly with the amount of elec-tricity that you use. If the bill for 2800 kilowatts of electricity is $196, then what is the billfor 4000 kilowatts of electricity?
SolutionBecause the amount A of the electric bill varies directly as the amount E of electricity used,we have
A � kE
for some constant k. Because 2800 kilowatts cost $196, we have
196 � k � 2800
or
0.07 � k.
So A � 0.07E. Now if E � 4000, we get
A � 0.07(4000) � 280.
The bill for 4000 kilowatts would be $280.
Now do Exercises 25–26
3-57 3.5 Variation 227
U3V ApplicationsExamples 3, 4, and 5 illustrate applications of the language of variation.
Figure 3.35
P � 150 kg/cm2
V � ?
P � 200 kg/cm2
V � 12 cm3
U Helpful Hint V
In any variation problem you mustfirst determine the general form ofthe relationship. Because this prob-lem involves direct variation, the gen-eral form is y � kx.
dug33491_ch03b.qxd 9/14/07 4:04 PM Page 227

Confirming Pages
The variation words (directly, inversely, or jointly) are never used to indi-cate addition or subtraction. We use multiplication in the formula unlesswe see the word “inversely.” We use division for inverse variation.
CAUTION
228 Chapter 3 Linear Equations in Two Variables and Their Graphs 3-58
E X A M P L E 5 A joint variation problemThe cost of shipping a piece of machinery by truck varies jointly with the weight of themachinery and the distance that it is shipped. It costs $3000 to ship a 2500-lb millingmachine a distance of 600 miles. Find the cost for shipping a 1500-lb lathe a distance of800 miles.
SolutionBecause the cost C varies jointly with the weight w and the distance d, we have
C � kwd
where k is the constant of variation. To find k, we use C � 3000, w � 2500, and d � 600:
3000 � k � 2500 � 600
� k Divide each side by 2500 � 600.
0.002 � k
Now use w � 1500 and d � 800 in the formula C � 0.002wd:
C � 0.002 � 1500 � 800
� 2400
So the cost of shipping the lathe is $2400.
Now do Exercises 29–30
3000��2500 � 600
Warm-Ups ▼
True or false?
Explain your
answer.
1. If y varies directly as z, then y � kz for some constant k.
2. If a varies inversely as b, then a � �bk
� for some constant k.
3. If y varies directly as x and y � 8 when x � 2, then the variation constant is 4.
4. If y varies inversely as x and y � 8 when x � 2, then the variation constant
is �14
�.
5. If C varies jointly as h and t, then C � ht.
6. The amount of sales tax on a new car varies directly with the purchase priceof the car.
7. If z varies inversely as w and z � 10 when w � 2, then z � �2w0�.
8. The time that it takes to travel a fixed distance varies inversely with the rate.
9. If m varies directly as w, then m � w � k for some constant k.
10. If y varies jointly as x and z, then y � k (x � z) for some constant k.
U Helpful Hint V
Because the variation in this problemis joint, we know the general form isy � kxz, where k is the constant ofvariation.
dug33491_ch03b.qxd 9/14/07 4:04 PM Page 228
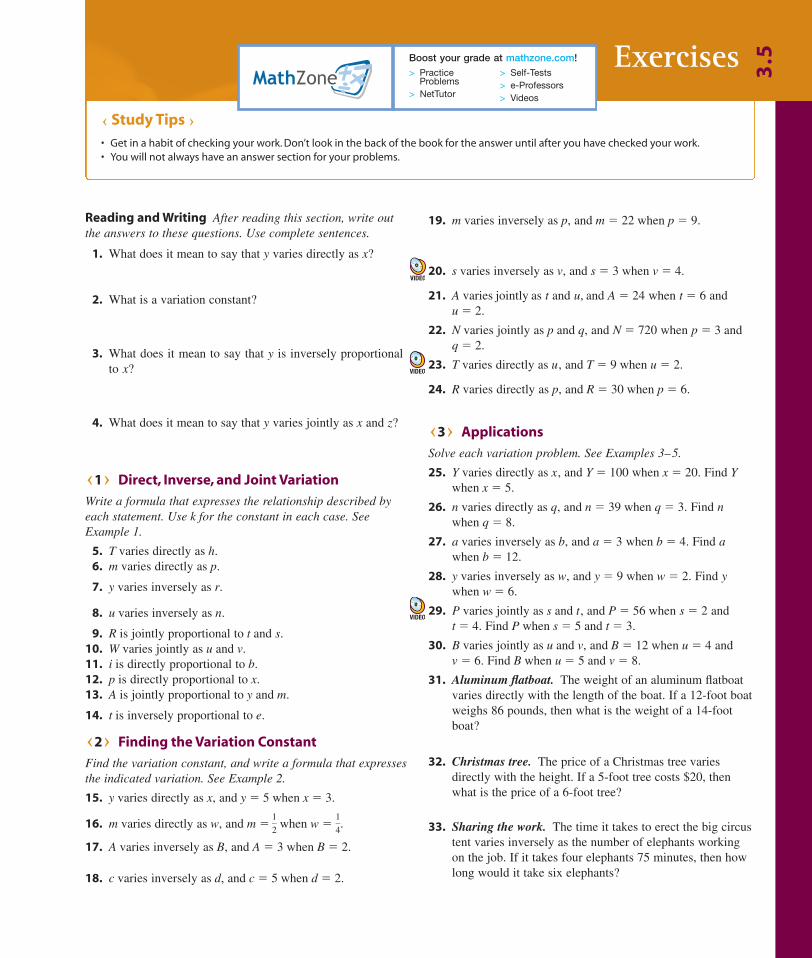
Confirming Pages
Reading and Writing After reading this section, write outthe answers to these questions. Use complete sentences.
1. What does it mean to say that y varies directly as x?
2. What is a variation constant?
3. What does it mean to say that y is inversely proportionalto x?
4. What does it mean to say that y varies jointly as x and z?
U1V Direct, Inverse, and Joint Variation
Write a formula that expresses the relationship described byeach statement. Use k for the constant in each case. SeeExample 1.
5. T varies directly as h.6. m varies directly as p.
7. y varies inversely as r.
8. u varies inversely as n.
9. R is jointly proportional to t and s.10. W varies jointly as u and v.11. i is directly proportional to b.12. p is directly proportional to x.13. A is jointly proportional to y and m.
14. t is inversely proportional to e.
U2V Finding the Variation Constant
Find the variation constant, and write a formula that expressesthe indicated variation. See Example 2.
15. y varies directly as x, and y � 5 when x � 3.
16. m varies directly as w, and m � �1
2� when w � �
1
4�.
17. A varies inversely as B, and A � 3 when B � 2.
18. c varies inversely as d, and c � 5 when d � 2.
19. m varies inversely as p, and m � 22 when p � 9.
20. s varies inversely as v, and s � 3 when v � 4.
21. A varies jointly as t and u, and A � 24 when t � 6 andu � 2.
22. N varies jointly as p and q, and N � 720 when p � 3 andq � 2.
23. T varies directly as u, and T � 9 when u � 2.
24. R varies directly as p, and R � 30 when p � 6.
U3V Applications
Solve each variation problem. See Examples 3–5.
25. Y varies directly as x, and Y � 100 when x � 20. Find Ywhen x � 5.
26. n varies directly as q, and n � 39 when q � 3. Find nwhen q � 8.
27. a varies inversely as b, and a � 3 when b � 4. Find awhen b � 12.
28. y varies inversely as w, and y � 9 when w � 2. Find ywhen w � 6.
29. P varies jointly as s and t, and P � 56 when s � 2 andt � 4. Find P when s � 5 and t � 3.
30. B varies jointly as u and v, and B � 12 when u � 4 andv � 6. Find B when u � 5 and v � 8.
31. Aluminum flatboat. The weight of an aluminum flatboatvaries directly with the length of the boat. If a 12-foot boatweighs 86 pounds, then what is the weight of a 14-footboat?
32. Christmas tree. The price of a Christmas tree variesdirectly with the height. If a 5-foot tree costs $20, thenwhat is the price of a 6-foot tree?
33. Sharing the work. The time it takes to erect the big circustent varies inversely as the number of elephants workingon the job. If it takes four elephants 75 minutes, then howlong would it take six elephants?
Exercises
U Study Tips V• Get in a habit of checking your work. Don’t look in the back of the book for the answer until after you have checked your work.• You will not always have an answer section for your problems.
Boost your grade at mathzone.com!> Practice
Problems> NetTutor
> Self-Tests> e-Professors> Videos
3.5
dug33491_ch03b.qxd 9/14/07 4:04 PM Page 229
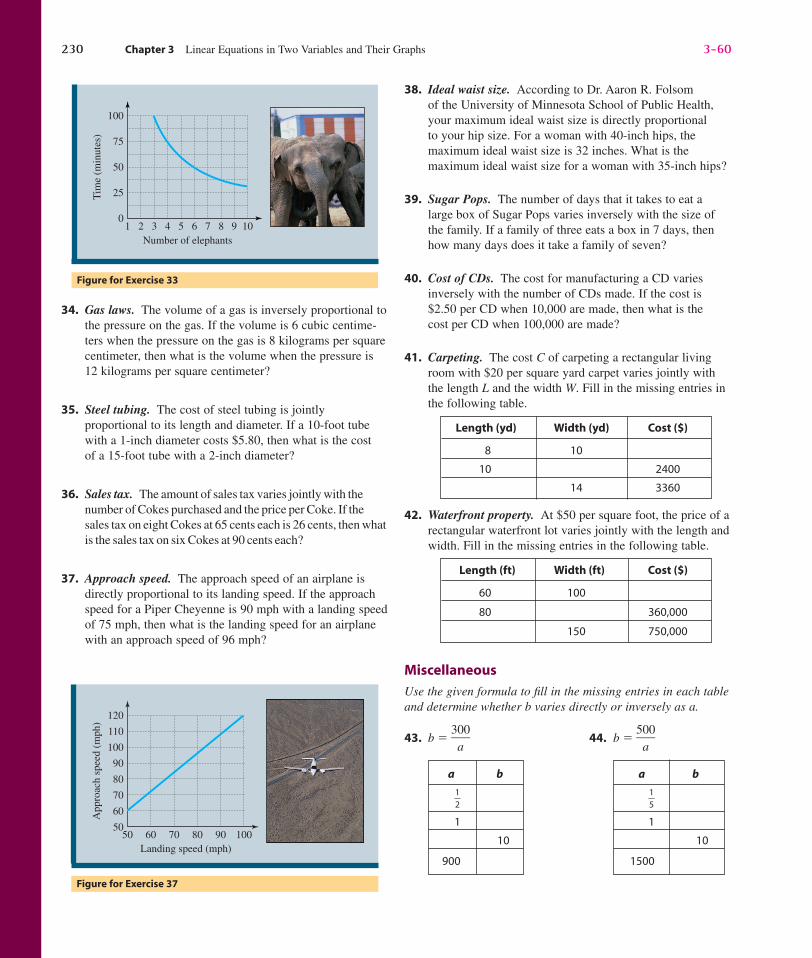
Confirming Pages
230 Chapter 3 Linear Equations in Two Variables and Their Graphs 3-60
34. Gas laws. The volume of a gas is inversely proportional tothe pressure on the gas. If the volume is 6 cubic centime-ters when the pressure on the gas is 8 kilograms per squarecentimeter, then what is the volume when the pressure is12 kilograms per square centimeter?
35. Steel tubing. The cost of steel tubing is jointlyproportional to its length and diameter. If a 10-foot tubewith a 1-inch diameter costs $5.80, then what is the cost of a 15-foot tube with a 2-inch diameter?
36. Sales tax. The amount of sales tax varies jointly with thenumber of Cokes purchased and the price per Coke. If thesales tax on eight Cokes at 65 cents each is 26 cents, then whatis the sales tax on six Cokes at 90 cents each?
37. Approach speed. The approach speed of an airplane isdirectly proportional to its landing speed. If the approachspeed for a Piper Cheyenne is 90 mph with a landing speedof 75 mph, then what is the landing speed for an airplanewith an approach speed of 96 mph?
38. Ideal waist size. According to Dr. Aaron R. Folsom of the University of Minnesota School of Public Health,your maximum ideal waist size is directly proportional to your hip size. For a woman with 40-inch hips, the maximum ideal waist size is 32 inches. What is the maximum ideal waist size for a woman with 35-inch hips?
39. Sugar Pops. The number of days that it takes to eat alarge box of Sugar Pops varies inversely with the size ofthe family. If a family of three eats a box in 7 days, thenhow many days does it take a family of seven?
40. Cost of CDs. The cost for manufacturing a CD variesinversely with the number of CDs made. If the cost is$2.50 per CD when 10,000 are made, then what is thecost per CD when 100,000 are made?
41. Carpeting. The cost C of carpeting a rectangular livingroom with $20 per square yard carpet varies jointly withthe length L and the width W. Fill in the missing entries inthe following table.
42. Waterfront property. At $50 per square foot, the price of arectangular waterfront lot varies jointly with the length andwidth. Fill in the missing entries in the following table.
Miscellaneous
Use the given formula to fill in the missing entries in each tableand determine whether b varies directly or inversely as a.
43. b � �30a0
� 44. b � �50a0
�
a b
�15
�
1
10
1500
a b
�12
�
1
10
900
Length (ft) Width (ft) Cost ($)
60 100
80 360,000
150 750,000
Length (yd) Width (yd) Cost ($)
8 10
10 2400
14 3360
Figure for Exercise 33
Tim
e (m
inut
es)
100
75
25
50
01 32 4 5 6 7 8 9 10
Number of elephants
Figure for Exercise 37
App
roac
h sp
eed
(mph
)
120
100
90
110
60
80
70
5050 60 70 80 90 100
Landing speed (mph)
dug33491_ch03b.qxd 9/14/07 4:05 PM Page 230
Confirming Pages
3-61 3.5 Variation 231
45. b � �34
�a 46. b � �23
� a
For each table, determine whether y varies directly or inverselyas x and find a formula for y in terms of x.
47. 48.
49. 50.
Solve each problem.
51. Distance. With the cruise control set at 65 mph, the distance traveled varies directly with the time spent traveling. Fill in the missing entries in the following table.
Time (hours) 1 2 3 4
Distance (miles)
x y
5 100
10 50
50 10
250 2
x y
2 10
4 5
10 2
20 1
x y
10 5
15 7.5
20 10
25 12.5
x y
2 7
3 10.5
4 14
5 17.5
a b
�12
�
3
6
21
a b
�13
�
8
9
20
52. Cost. With gas selling for $1.60 per gallon, the cost of filling your tank varies directly with the amount of gas that you pump. Fill in the missing entries in the following table.
Amount (gallons) 5 10 15 20
Cost (dollars)
53. Time. The time that it takes to complete a 400-mile tripvaries inversely with your average speed. Fill in themissing entries in the following table.
Speed (mph) 20 40 50
Time (hours) 2
54. Amount. The amount of gasoline that you can buy for $20 varies inversely with the price per gallon. Fill in themissing entries in the following table.
Price per gallon(dollars) 1 2 4
Amount (gallons) 2
Getting More Involved
55. Discussion
If y varies directly as x, then the graph of the equa-tion is a straight line. What is its slope? What is they-intercept? If y � 3x � 2, then does y vary directlyas x? Which straight lines correspond to directvariations?
56. Writing
Write a summary of the three types of variation.Include an example of each type that is not found inthis text.
dug33491_ch03b.qxd 9/14/07 4:05 PM Page 231
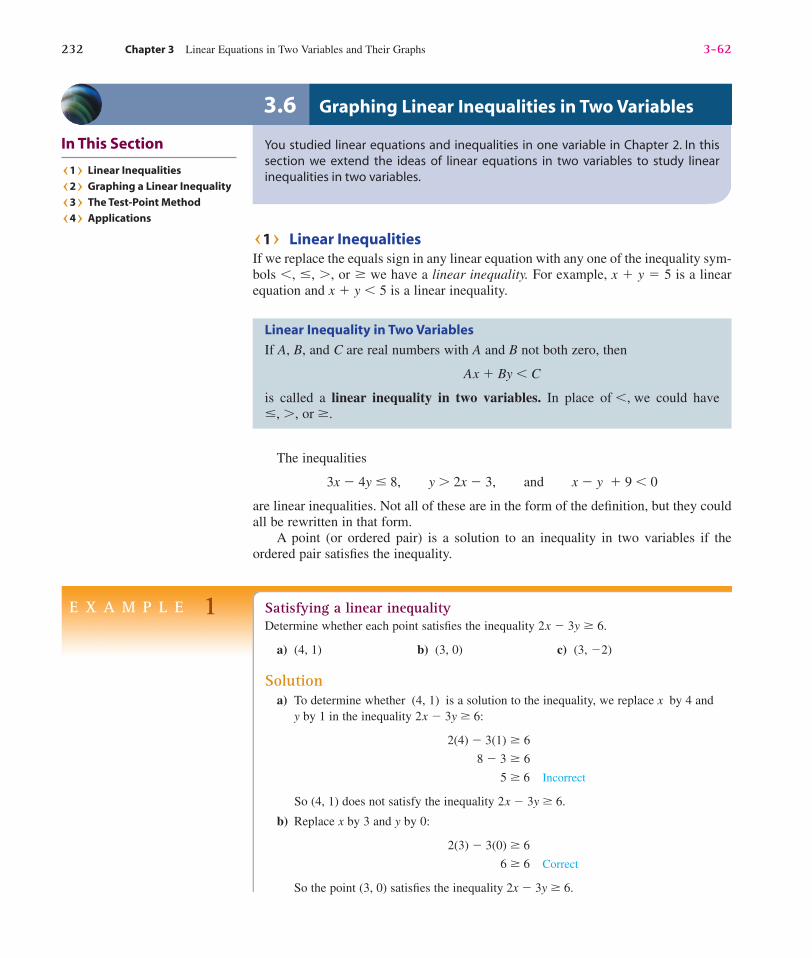
Confirming Pages
232 Chapter 3 Linear Equations in Two Variables and Their Graphs 3-62
In This Section
U1V Linear Inequalities
U2V Graphing a Linear Inequality
U3V The Test-Point Method
U4V Applications
3.6 Graphing Linear Inequalities in Two Variables
You studied linear equations and inequalities in one variable in Chapter 2. In thissection we extend the ideas of linear equations in two variables to study linearinequalities in two variables.
U1V Linear InequalitiesIf we replace the equals sign in any linear equation with any one of the inequality sym-bols �, �, , or we have a linear inequality. For example, x � y � 5 is a linearequation and x � y � 5 is a linear inequality.
Linear Inequality in Two Variables
If A, B, and C are real numbers with A and B not both zero, then
Ax � By � C
is called a linear inequality in two variables. In place of �, we could have�, , or .
The inequalities
3x � 4y � 8, y 2x � 3, and x � y � 9 � 0
are linear inequalities. Not all of these are in the form of the definition, but they couldall be rewritten in that form.
A point (or ordered pair) is a solution to an inequality in two variables if theordered pair satisfies the inequality.
E X A M P L E 1 Satisfying a linear inequalityDetermine whether each point satisfies the inequality 2x � 3y 6.
a) (4, 1) b) (3, 0) c) (3, �2)
Solutiona) To determine whether (4, 1) is a solution to the inequality, we replace x by 4 and
y by 1 in the inequality 2x � 3y 6:
2(4) � 3(1) 6
8 � 3 6
5 6 Incorrect
So (4, 1) does not satisfy the inequality 2x � 3y 6.
b) Replace x by 3 and y by 0:
2(3) � 3(0) 6
6 6 Correct
So the point (3, 0) satisfies the inequality 2x � 3y 6.
dug33491_ch03b.qxd 9/14/07 4:05 PM Page 232

Confirming Pages
3-63 3.6 Graphing Linear Inequalities in Two Variables 233
U2V Graphing a Linear InequalityThe solution set to an equation in one variable such as x � 3 is {3}. This single num-ber divides the number line into two regions as shown in Fig. 3.35. Every number tothe right of 3 satisfies x 3, and every number to the left satisfies x � 3.
A similar situation occurs for linear equations in two variables. For example, thesolution set to y � x � 2 consists of all ordered pairs on the line shown in Fig. 3.36.This line divides the coordinate plane into two regions. Every ordered pair above theline satisfies y x � 2, and every ordered pair below the line satisfies y � x � 2. Tosee that this statement is correct, check a point such as (3, 5), which is on the line. Apoint with a larger y-coordinate such as (3, 6) is certainly above the line and satisfiesy x � 2. A point with a smaller y-coordinate such as (3, 4) is certainly below the lineand satisfies y � x � 2.
So the graph of a linear inequality consists of all ordered pairs that satisfy theinequality and they all lie on one side of the boundary line. If the inequality symbolis � or the line is not included and it is drawn dashed. If the inequality symbol is� or the line is included and it is drawn solid.
Figure 3.36
3
3
y
x2 4
1
�1�1
�2
1�3�4�5 5
4
5
6
7
8
y � x � 2 Above the line
(3, 6)
y � x � 2
(3, 5)
y � x � 2 Below the line
(3, 4)
Figure 3.35
4 5 6 7 83210�1
x � 3 x � 3x � 3
c) Replace x by 3 and y by �2:
2(3) � 3(�2) 6
6 � 6 6
12 6 Correct
So the point (3, �2) satisfies the inequality 2x � 3y 6.
Now do Exercises 7–14
U Helpful Hint V
Why do we keep drawing graphs?When we solve 2x � 1 � 7, we don’tbother to draw a graph showing 3,because the solution set is so simple.However, the solution set to a linearinequality is an infinite set of orderedpairs. Graphing gives us a way tovisualize the solution set.
dug33491_ch03b.qxd 9/14/07 4:05 PM Page 233
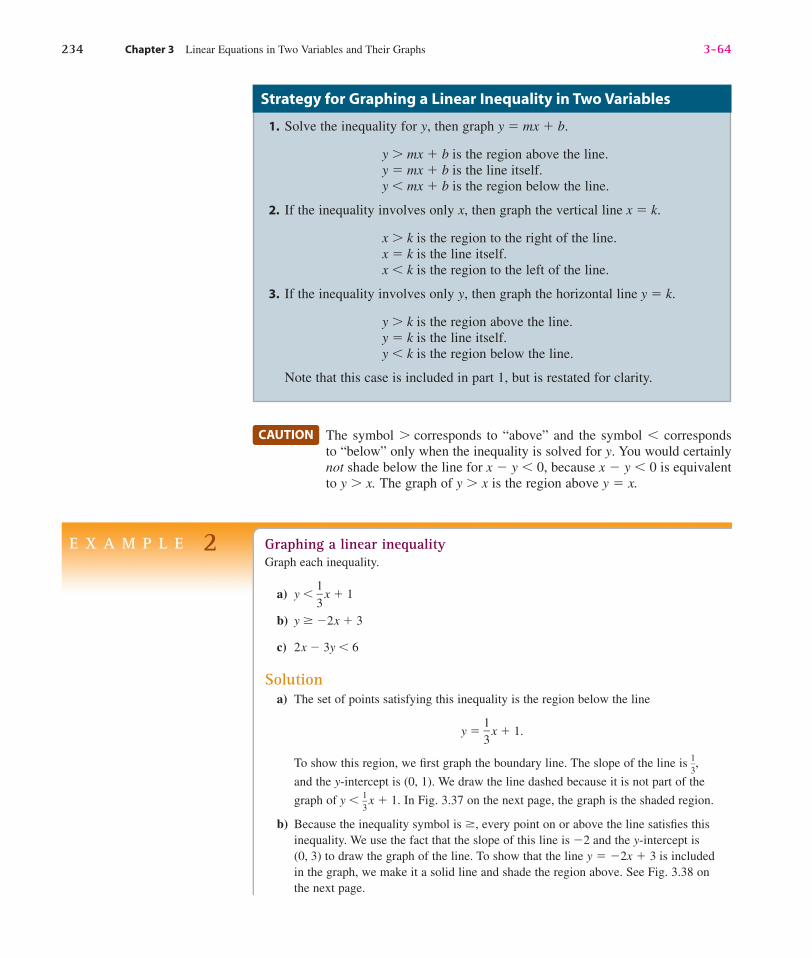
Confirming Pages
Strategy for Graphing a Linear Inequality in Two Variables
1. Solve the inequality for y, then graph y � mx � b.
y mx � b is the region above the line.y � mx � b is the line itself.y � mx � b is the region below the line.
2. If the inequality involves only x, then graph the vertical line x � k.
x k is the region to the right of the line.x � k is the line itself.x � k is the region to the left of the line.
3. If the inequality involves only y, then graph the horizontal line y � k.
y k is the region above the line.y � k is the line itself.y � k is the region below the line.
Note that this case is included in part 1, but is restated for clarity.
The symbol corresponds to “above” and the symbol � correspondsto “below” only when the inequality is solved for y. You would certainlynot shade below the line for x � y � 0, because x � y � 0 is equivalentto y x. The graph of y x is the region above y � x.
CAUTION
E X A M P L E 2 Graphing a linear inequalityGraph each inequality.
a) y � �13
� x � 1
b) y �2x � 3
c) 2x � 3y � 6
Solutiona) The set of points satisfying this inequality is the region below the line
y � �13
� x � 1.
To show this region, we first graph the boundary line. The slope of the line is �13
�,
and the y-intercept is (0, 1). We draw the line dashed because it is not part of the
graph of y � �13
� x � 1. In Fig. 3.37 on the next page, the graph is the shaded region.
b) Because the inequality symbol is , every point on or above the line satisfies thisinequality. We use the fact that the slope of this line is �2 and the y-intercept is(0, 3) to draw the graph of the line. To show that the line y � �2x � 3 is includedin the graph, we make it a solid line and shade the region above. See Fig. 3.38 onthe next page.
234 Chapter 3 Linear Equations in Two Variables and Their Graphs 3-64
dug33491_ch03b.qxd 9/14/07 4:05 PM Page 234
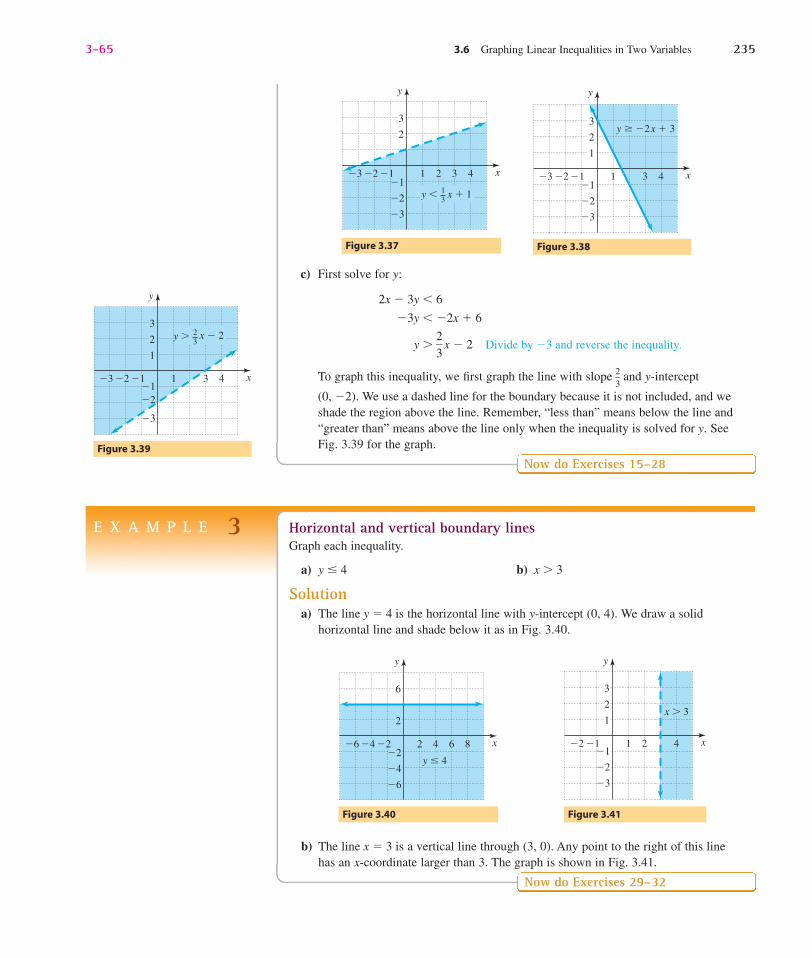
Confirming Pages
3-65 3.6 Graphing Linear Inequalities in Two Variables 235
c) First solve for y:
2x � 3y � 6
�3y � �2x � 6
y �23
� x � 2 Divide by �3 and reverse the inequality.
To graph this inequality, we first graph the line with slope �23
� and y-intercept
(0, �2). We use a dashed line for the boundary because it is not included, and weshade the region above the line. Remember, “less than” means below the line and“greater than” means above the line only when the inequality is solved for y. SeeFig. 3.39 for the graph.
Now do Exercises 15–28Figure 3.39
3
y
x4�1�1
1�2
2
�3
1
3
�3
�2
y � x � 223
E X A M P L E 3 Horizontal and vertical boundary linesGraph each inequality.
a) y � 4 b) x 3
Solutiona) The line y � 4 is the horizontal line with y-intercept (0, 4). We draw a solid
horizontal line and shade below it as in Fig. 3.40.
b) The line x � 3 is a vertical line through (3, 0). Any point to the right of this linehas an x-coordinate larger than 3. The graph is shown in Fig. 3.41.
Now do Exercises 29–32
Figure 3.41Figure 3.40
2
y
x4�1�1
1�2
2
�3
1
3
�2
x � 3
y
x8�2
�4
�2
�6
2
6
2 64�4�6
y � 4
3
y
x4�1�1
�2
1�2
2
�3
1
3
�3
y � �2x � 3
Figure 3.38
3
3
y
x2 4�1�1
�2
1�3 �2
2
�3
y � x � 113
Figure 3.37
dug33491_ch03b.qxd 9/14/07 4:05 PM Page 235
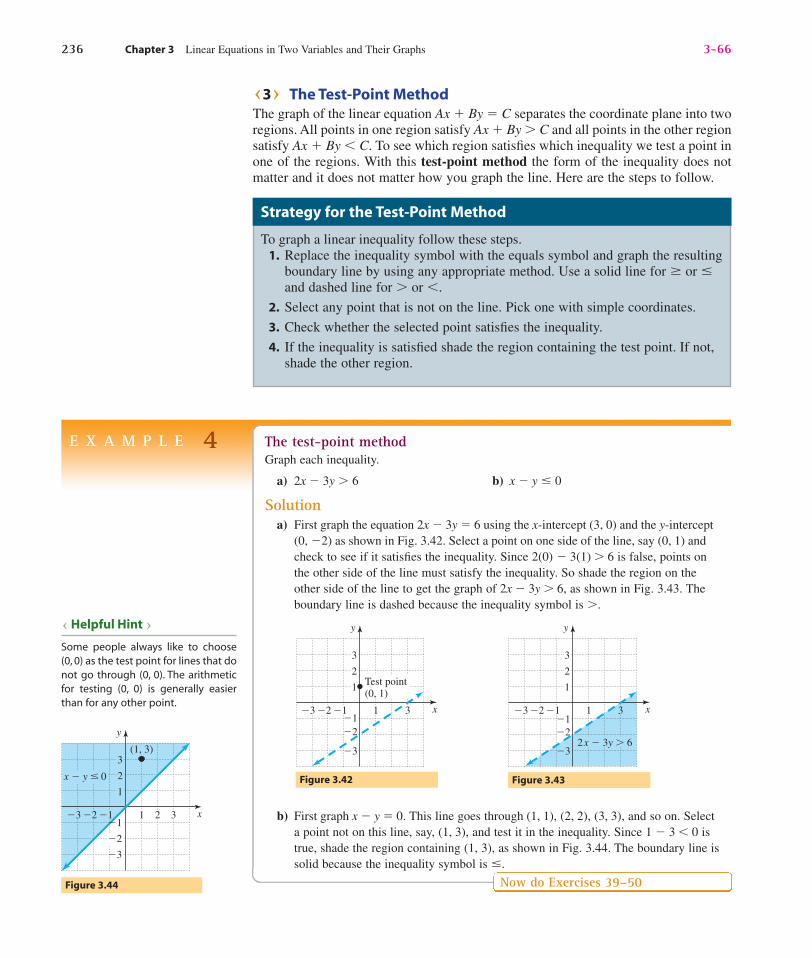
Confirming Pages
U3V The Test-Point MethodThe graph of the linear equation Ax � By � C separates the coordinate plane into tworegions. All points in one region satisfy Ax � By C and all points in the other regionsatisfy Ax � By � C. To see which region satisfies which inequality we test a point inone of the regions. With this test-point method the form of the inequality does notmatter and it does not matter how you graph the line. Here are the steps to follow.
Strategy for the Test-Point Method
To graph a linear inequality follow these steps.1. Replace the inequality symbol with the equals symbol and graph the resulting
boundary line by using any appropriate method. Use a solid line for or �and dashed line for or �.
2. Select any point that is not on the line. Pick one with simple coordinates.
3. Check whether the selected point satisfies the inequality.
4. If the inequality is satisfied shade the region containing the test point. If not,shade the other region.
E X A M P L E 4 The test-point methodGraph each inequality.
a) 2x � 3y 6 b) x � y � 0
Solutiona) First graph the equation 2x � 3y � 6 using the x-intercept (3, 0) and the y-intercept
(0, �2) as shown in Fig. 3.42. Select a point on one side of the line, say (0, 1) andcheck to see if it satisfies the inequality. Since 2(0) � 3(1) 6 is false, points onthe other side of the line must satisfy the inequality. So shade the region on theother side of the line to get the graph of 2x � 3y 6, as shown in Fig. 3.43. Theboundary line is dashed because the inequality symbol is .
y
x�1�1
1�2
2
�3
1
3
�3
�2
3
Test point(0, 1)
Figure 3.42
y
x�1�1
1�2
2
�3
1
3
�3 3
�22x � 3y � 6
Figure 3.43
U Helpful Hint V
Some people always like to choose(0, 0) as the test point for lines that donot go through (0, 0). The arithmeticfor testing (0, 0) is generally easierthan for any other point.
2
y
x3�1 1�2
2
�3
1
3
�3
�2
x � y � 0
(1, 3)
�1
Figure 3.44
b) First graph x � y � 0. This line goes through (1, 1), (2, 2), (3, 3), and so on. Selecta point not on this line, say, (1, 3), and test it in the inequality. Since 1 � 3 � 0 istrue, shade the region containing (1, 3), as shown in Fig. 3.44. The boundary line issolid because the inequality symbol is �.
Now do Exercises 39–50
236 Chapter 3 Linear Equations in Two Variables and Their Graphs 3-66
dug33491_ch03b.qxd 9/14/07 4:05 PM Page 236
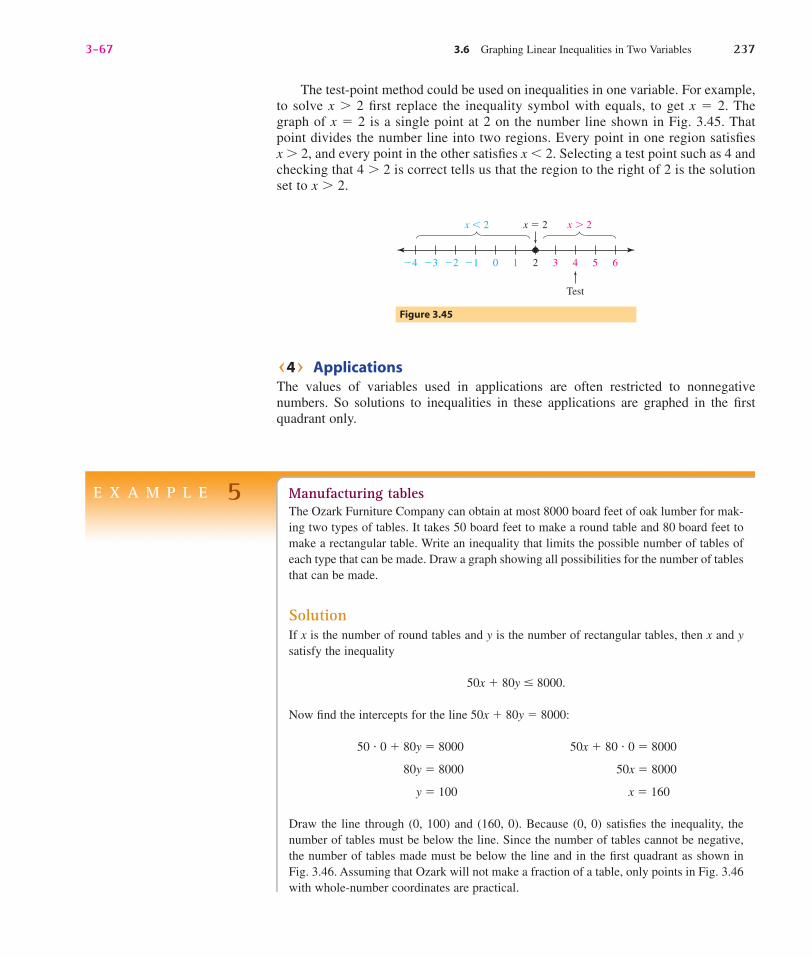
Confirming Pages
3-67 3.6 Graphing Linear Inequalities in Two Variables 237
The test-point method could be used on inequalities in one variable. For example,to solve x 2 first replace the inequality symbol with equals, to get x � 2. Thegraph of x � 2 is a single point at 2 on the number line shown in Fig. 3.45. Thatpoint divides the number line into two regions. Every point in one region satisfiesx 2, and every point in the other satisfies x � 2. Selecting a test point such as 4 andchecking that 4 2 is correct tells us that the region to the right of 2 is the solutionset to x 2.
U4V ApplicationsThe values of variables used in applications are often restricted to nonnegativenumbers. So solutions to inequalities in these applications are graphed in the firstquadrant only.
Figure 3.45
2 3 4 5 610�1�2�3�4
x � 2 x � 2x � 2
Test
E X A M P L E 5 Manufacturing tablesThe Ozark Furniture Company can obtain at most 8000 board feet of oak lumber for mak-ing two types of tables. It takes 50 board feet to make a round table and 80 board feet tomake a rectangular table. Write an inequality that limits the possible number of tables ofeach type that can be made. Draw a graph showing all possibilities for the number of tablesthat can be made.
SolutionIf x is the number of round tables and y is the number of rectangular tables, then x and ysatisfy the inequality
50x � 80y � 8000.
Now find the intercepts for the line 50x � 80y � 8000:
50 � 0 � 80y � 8000 50x � 80 � 0 � 8000
80y � 8000 50x � 8000
y � 100 x � 160
Draw the line through (0, 100) and (160, 0). Because (0, 0) satisfies the inequality, thenumber of tables must be below the line. Since the number of tables cannot be negative,the number of tables made must be below the line and in the first quadrant as shown inFig. 3.46. Assuming that Ozark will not make a fraction of a table, only points in Fig. 3.46with whole-number coordinates are practical.
dug33491_ch03b.qxd 9/14/07 4:05 PM Page 237
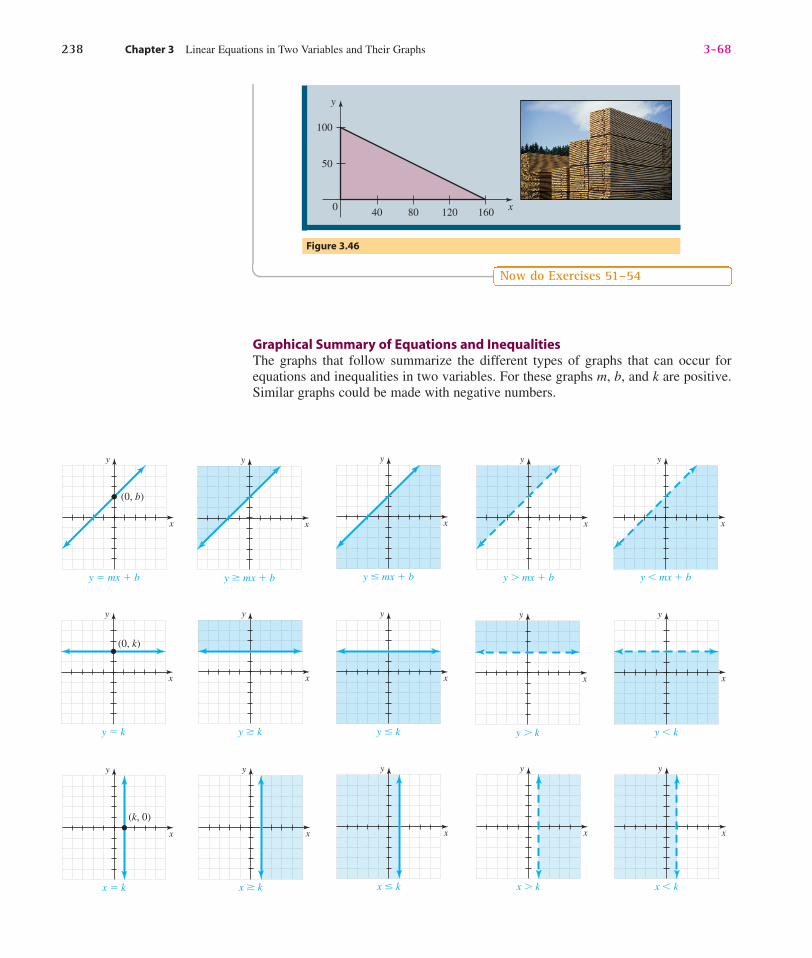
Confirming Pages
y
x0
50
100
40 80 120 160
Figure 3.46
Now do Exercises 51–54
Graphical Summary of Equations and InequalitiesThe graphs that follow summarize the different types of graphs that can occur forequations and inequalities in two variables. For these graphs m, b, and k are positive.Similar graphs could be made with negative numbers.
x � k
x
y
x � k
x
y
x � k
x
y
x � k
x
y
x � k
x
y
(k, 0)
y � k
x
y
y � k
x
y
y � k
x
y
y � k
x
y
y � k
x
y
(0, k)
y � mx � b
x
y
y � mx � b
x
y
y � mx � b
x
y
y � mx � b
x
y
y � mx � b
x
y
(0, b)
238 Chapter 3 Linear Equations in Two Variables and Their Graphs 3-68
dug33491_ch03b.qxd 9/14/07 4:05 PM Page 238
Confirming Pages
3-69 3.6 Graphing Linear Inequalities in Two Variables 239
Warm-Ups ▼
True or false?
Explain your
answer.
1. The point (�1, 4) satisfies the inequality y 3x � 1.2. The point (2, �3) satisfies the inequality 3x � 2y 12.3. The graph of the inequality y x � 9 is the region above the line
y � x � 9.4. The graph of the inequality x � y � 2 is the region below the line
x � y � 2.5. The graph of x � 3 is a single point on the x-axis.6. The graph of y � 5 is the region below the horizontal line y � 5.7. The graph of x � 3 is the region to the left of the vertical line x � 3.8. In graphing the inequality y x we use a dashed boundary line.9. The point (0, 0) is on the graph of the inequality y x.
10. The point (0, 0) lies above the line y � 2x � 1.
Reading and Writing After reading this section, write outthe answers to these questions. Use complete sentences.
1. What is a linear inequality in two variables?
2. How can you tell if an ordered pair satisfies a linearinequality in two variables?
3. How do you determine whether to draw the boundary lineof the graph of a linear inequality dashed or solid?
4. How do you decide which side of the boundary line to shade?
5. What is the test-point method?
6. What is the advantage of the test-point method?
U1V Linear Inequalities
Determine which of the points following each inequality satisfythat inequality. See Example 1.
7. x � y 0 (0, 0), (3, �1), (�5, 4)
8. x � y � 0 (0, 0), (2, �1), (�6, 3)
Exercises
U Study Tips V• Everyone knows that you must practice to be successful with musical instruments, foreign languages, and sports. Success in algebra
also requires regular practice.• As soon as possible after class find a quiet place to work on your homework.The longer you wait, the harder it is to remember what
happened in class.
Boost your grade at mathzone.com!> Practice
Problems> NetTutor
> Self-Tests> e-Professors> Videos
3.6
dug33491_ch03b.qxd 9/14/07 4:05 PM Page 239
Confirming Pages
240 Chapter 3 Linear Equations in Two Variables and Their Graphs 3-70
9. x � y 5 (2, 3), (�3, �9), (8, 3)
10. 2x � y � 3 (�2, 6), (0, 3), (3, 0)
11. y �2x � 5 (3, 0), (1, 3), (�2, 5)
12. y � �x � 6 (2, 0), (�3, 9), (�4, 12)
13. x �3y � 4 (2, 3), (7, �1), (0, 5)
14. x � �y � 3 (1, 2), (�3, �4), (0, �3)
U2V Graphing a Linear Inequality
Graph each inequality.
See Examples 2 and 3.
See the Strategy for Graphing a Linear Inequality in TwoVariables box on page 234.
15. y � x � 4 16. y � 2x � 2
17. y �x � 3 18. y � �2x � 1
19. y �23
� x � 3 20. y � �12
� x � 1
21. y � ��25
� x � 2 22. y ��12
� x � 3
23. y � x 0 24. x � 2y � 0
25. x y � 5 26. 2x � 3y � 6
27. x � 2y � 4 � 0 28. 2x � y � 3 0
dug33491_ch03b.qxd 9/14/07 4:05 PM Page 240
Confirming Pages
3-71 3.6 Graphing Linear Inequalities in Two Variables 241
29. y 2 30. y � 7
31. x 9 32. x � 1
33. x � y � 60 34. x � y � 90
35. x � 100y 36. y 600x
37. 3x � 4y � 8 38. 2x � 5y 10
U3V The Test-Point Method
Graph each inequality using a test point.
See Example 4.
See the Strategy for the Test-Point Method box on page 236.
39. 2x � 3y � 6 40. x � 4y 4
41. x � 4y � 8 42. 3y � 5x 15
43. y � �72
�x � 7 44. �23
�x � 3y � 12
dug33491_ch03b.qxd 9/14/07 4:05 PM Page 241
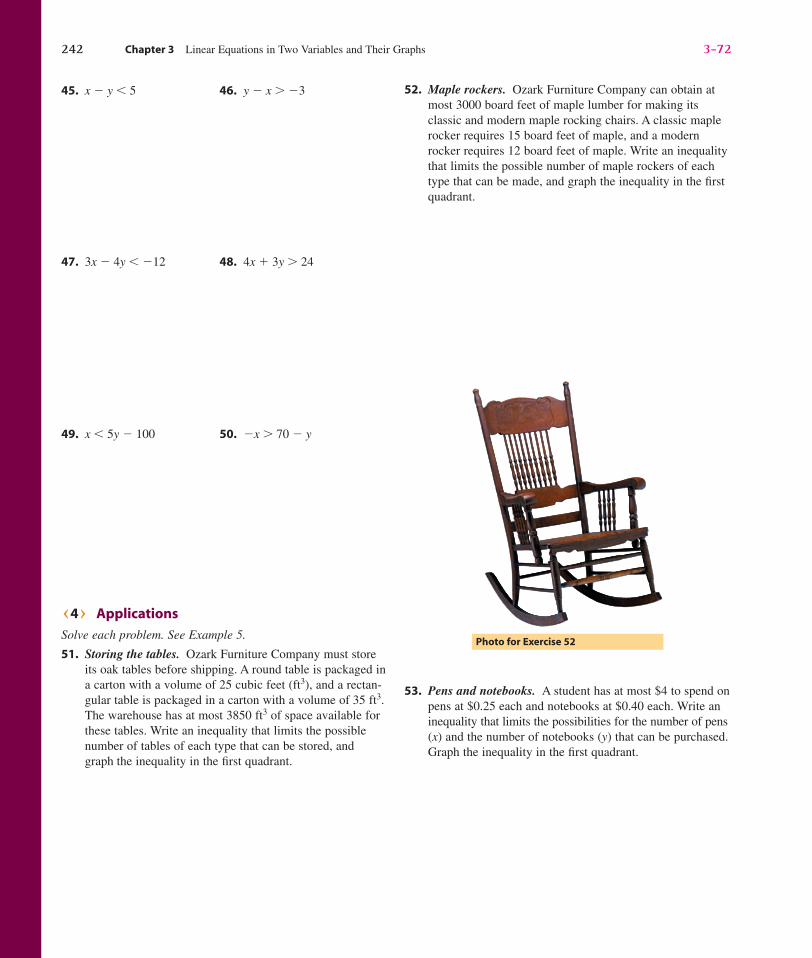
Confirming Pages
45. x � y � 5 46. y � x �3
47. 3x � 4y � �12 48. 4x � 3y 24
49. x � 5y � 100 50. �x 70 � y
U4V Applications
Solve each problem. See Example 5.
51. Storing the tables. Ozark Furniture Company must storeits oak tables before shipping. A round table is packaged ina carton with a volume of 25 cubic feet (ft3), and a rectan-gular table is packaged in a carton with a volume of 35 ft3.The warehouse has at most 3850 ft3 of space available forthese tables. Write an inequality that limits the possiblenumber of tables of each type that can be stored, andgraph the inequality in the first quadrant.
52. Maple rockers. Ozark Furniture Company can obtain atmost 3000 board feet of maple lumber for making itsclassic and modern maple rocking chairs. A classic maplerocker requires 15 board feet of maple, and a modernrocker requires 12 board feet of maple. Write an inequalitythat limits the possible number of maple rockers of eachtype that can be made, and graph the inequality in the firstquadrant.
53. Pens and notebooks. A student has at most $4 to spend onpens at $0.25 each and notebooks at $0.40 each. Write aninequality that limits the possibilities for the number of pens(x) and the number of notebooks (y) that can be purchased.Graph the inequality in the first quadrant.
Photo for Exercise 52
242 Chapter 3 Linear Equations in Two Variables and Their Graphs 3-72
dug33491_ch03b.qxd 9/14/07 4:05 PM Page 242
Confirming Pages
3-73 3.6 Graphing Linear Inequalities in Two Variables 243
54. Enzyme concentration. A food chemist tests enzymesfor their ability to break down pectin in fruit juices(Dennis Callas, Snapshots of Applications in Mathematics).Excess pectin makes juice cloudy. In one test, the chemistmeasures the concentration of the enzyme, c, in milligramsper milliliter and the fraction of light absorbed by theliquid, a. If a 0.07c � 0.02, then the enzyme is workingas it should. Graph the inequality in the first quadrant.
Getting More Involved
55. Discussion
When asked to graph the inequality x � 2y � 12, astudent found that (0, 5) and (8, 0) both satisfiedx � 2y � 12. The student then drew a dashed line throughthese two points and shaded the region below the line. Whatis wrong with this method? Do all of the points graphed bythis student satisfy the inequality?
56. Writing
Compare and contrast the two methods presented inthis section for graphing linear inequalities. What are theadvantages and disadvantages of each method? How doyou choose which method to use?
dug33491_ch03b.qxd 9/14/07 4:05 PM Page 243
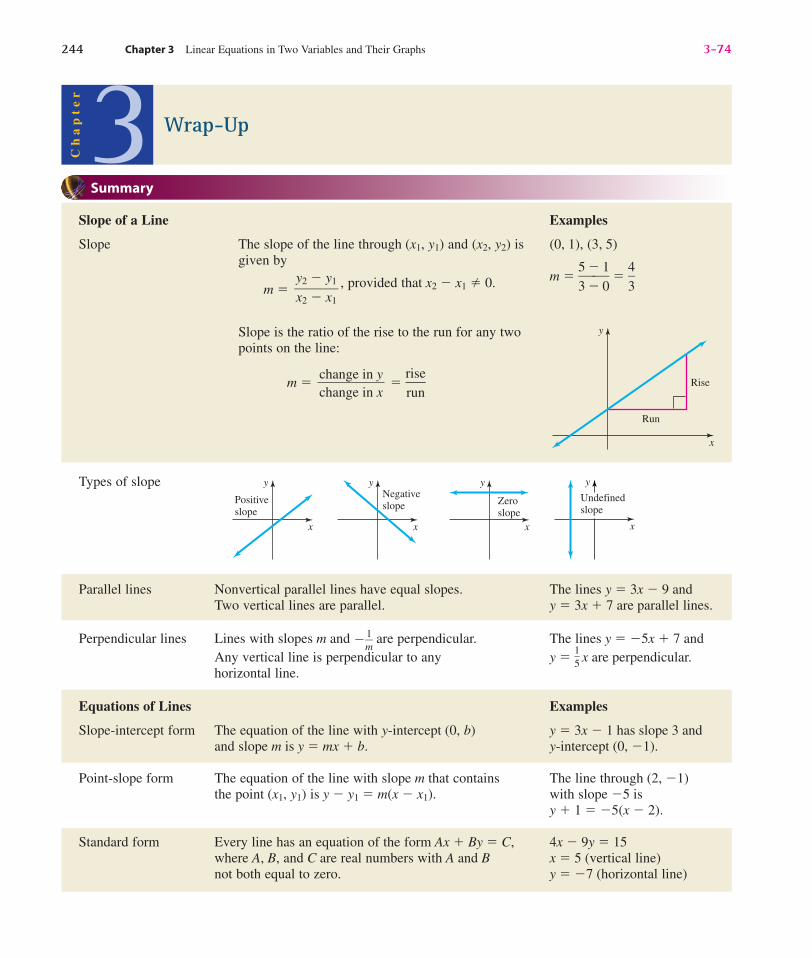
Confirming Pages
244 Chapter 3 Linear Equations in Two Variables and Their Graphs 3-74
Wrap-Up
Summary
Slope of a Line Examples
Slope The slope of the line through (x1, y1) and (x2, y2) is (0, 1), (3, 5)given by
m � �53
�
�
10
� � �43
�m � , provided that x2 � x1 � 0.
Slope is the ratio of the rise to the run for any twopoints on the line:
m � �
Types of slope
Parallel lines Nonvertical parallel lines have equal slopes. The lines y � 3x � 9 andTwo vertical lines are parallel. y � 3x � 7 are parallel lines.
Perpendicular lines Lines with slopes m and ��m1
� are perpendicular. The lines y � �5x � 7 andAny vertical line is perpendicular to any y � �
15
� x are perpendicular.horizontal line.
Equations of Lines Examples
Slope-intercept form The equation of the line with y-intercept (0, b) y � 3x � 1 has slope 3 andand slope m is y � mx � b. y-intercept (0, �1).
Point-slope form The equation of the line with slope m that contains The line through (2, �1)the point (x1, y1) is y � y1 � m(x � x1). with slope �5 is
y � 1 � �5(x � 2).
Standard form Every line has an equation of the form Ax � By � C, 4x � 9y � 15where A, B, and C are real numbers with A and B x � 5 (vertical line)not both equal to zero. y � �7 (horizontal line)
rise�run
change in y��change in x
y2 � y1�x2 � x1
3Chapter
y
x
Positive slope
y
x
Negative slope
y
x
Zero slope
y
x
Undefined slope
y
x
Run
Rise
dug33491_ch03b.qxd 9/14/07 4:05 PM Page 244
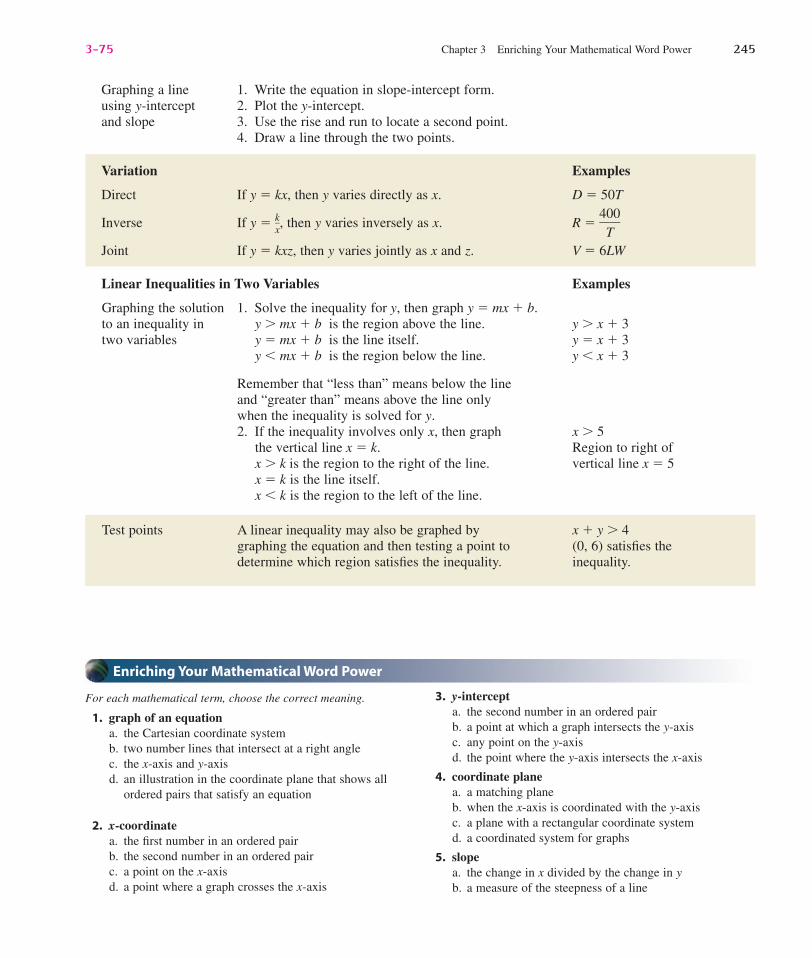
Confirming Pages
3-75 Chapter 3 Enriching Your Mathematical Word Power 245
Graphing a line 1. Write the equation in slope-intercept form.using y-intercept 2. Plot the y-intercept.and slope 3. Use the rise and run to locate a second point.
4. Draw a line through the two points.
Variation Examples
Direct If y � kx, then y varies directly as x. D � 50T
Inverse If y � �kx
�, then y varies inversely as x. R � �4T00�
Joint If y � kxz, then y varies jointly as x and z. V � 6LW
Linear Inequalities in Two Variables Examples
Graphing the solution 1. Solve the inequality for y, then graph y � mx � b.to an inequality in y mx � b is the region above the line. y x � 3two variables y � mx � b is the line itself. y � x � 3
y � mx � b is the region below the line. y � x � 3
Remember that “less than” means below the lineand “greater than” means above the line onlywhen the inequality is solved for y.2. If the inequality involves only x, then graph x 5
the vertical line x � k. Region to right ofx k is the region to the right of the line. vertical line x � 5x � k is the line itself.x � k is the region to the left of the line.
Test points A linear inequality may also be graphed by x � y 4graphing the equation and then testing a point to (0, 6) satisfies thedetermine which region satisfies the inequality. inequality.
3. y-intercepta. the second number in an ordered pairb. a point at which a graph intersects the y-axisc. any point on the y-axisd. the point where the y-axis intersects the x-axis
4. coordinate planea. a matching planeb. when the x-axis is coordinated with the y-axisc. a plane with a rectangular coordinate systemd. a coordinated system for graphs
5. slopea. the change in x divided by the change in yb. a measure of the steepness of a line
Enriching Your Mathematical Word Power
For each mathematical term, choose the correct meaning.
1. graph of an equationa. the Cartesian coordinate systemb. two number lines that intersect at a right anglec. the x-axis and y-axisd. an illustration in the coordinate plane that shows all
ordered pairs that satisfy an equation
2. x-coordinatea. the first number in an ordered pairb. the second number in an ordered pairc. a point on the x-axisd. a point where a graph crosses the x-axis
dug33491_ch03b.qxd 9/14/07 4:05 PM Page 245
Confirming Pages
246 Chapter 3 Linear Equations in Two Variables and Their Graphs 3-76
c. the run divided by the rised. the slope of a line
6. slope-intercept forma. y � mx � bb. rise over runc. the point at which a line crosses the y-axisd. y � y1 � m(x � x1)
7. point-slope forma. Ax � By � Cb. rise over runc. y � y1 � m(x � x1)d. the slope of a line at a single point
8. independent variablea. a rational constantb. an irrational constantc. the first variable of an ordered paird. the second variable of an ordered pair
9. dependent variablea. an irrational variableb. a rational variable
c. the first variable of an ordered paird. the second variable of an ordered pair
10. direct variationa. y � � b. y � kxc. y � k�x d. y � kxz
11. inverse variationa. y � � b. y � kxc. y � k�x d. y � kxz
12. joint variationa. y � � b. y � kxc. y � k�x d. y � kxz
13. linear inequality in two variablesa. when two lines are not equalb. line segments that are unequal in lengthc. an inequality of the form Ax � By C or with another
symbol of inequalityd. an inequality of the form Ax2 � By2 � C2
Review Exercises
3.1 Graphing Lines in the Coordinate PlaneFor each point, name the quadrant in which it lies or the axison which it lies.
1. (�2, 5) 2. (�3, �5)
3. (3, 0) 4. (9, 10)
5. (0, �6) 6. (0, �)
7. (1.414, �3) 8. (�4, 1.732)
Complete the given ordered pairs so that each ordered pairsatisfies the given equation.
9. y � 3x � 5: (0, ), (�3, ), (4, )
10. y � �2x � 1: (9, ), (3, ), (�1, )
11. 2x � 3y � 8: (0, ), (3, ), (�6, )
12. x � 2y � 1: (0, ), (�2, ), (2, )
Sketch the graph of each equation by finding three orderedpairs that satisfy each equation.
13. y � �3x � 4 14. y � 2x � 6
15. x � y � 7 16. x � y � 4
dug33491_ch03b.qxd 9/14/07 4:05 PM Page 246

Confirming Pages
3-77 Chapter 3 Review Exercises 247
3.2 SlopeDetermine the slope of the line that goes through each pair ofpoints.
17. (0, 0) and (1, 1) 18. (�1, 1) and (2, �2)
19. (�2, �3) and (0, 0) 20. (�1, �2) and (4, �1)
21. (�4, �2) and (3, 1) 22. (0, 4) and (5, 0)
3.3 Equations of Lines in Slope-Intercept FormFind the slope and y-intercept for each line.
23. y � 3x � 18 24. y � �x � 5
25. 2x � y � 3 26. x � 2y � 1
27. 4x � 2y � 8 � 0 28. 3x � 5y � 10 � 0
Sketch the graph of each equation.
29. y � x � 5 30. y � x � 1
31. 2x � y � �6 32. �3x � y � 2
33. y � �4 34. x � 9
3�2
2�3
Determine the equation of each line. Write the answer instandard form using only integers as the coefficients.
35. The line through (0, 4) with slope �13
�
36. The line through (�2, 0) with slope ��34
�
37. The line through the origin that is perpendicular to the liney � 2x � 1
38. The line through (0, 9) that is parallel to the line 3x � 5y � 15
39. The line through (3, 5) that is parallel to the x-axis
40. The line through (�2, 4) that is perpendicular to the x-axis
3.4 The Point-Slope FormWrite each equation in slope-intercept form.
41. y � 3 � �2
3� (x � 6) 42. y � 2 � �6(x � 1)
43. 3x � 7y � 14 � 0 44. 1 � x � y � 0
45. y � 5 � ��3
4� (x � 1) 46. y � 8 � ��
2
5� (x � 2)
Determine the equation of each line. Write the answer in slope-intercept form.
47. The line through (�4, 7) with slope �2
48. The line through (9, 0) with slope �1
2�
49. The line through the two points (�2, 1) and (3, 7)
50. The line through the two points (4, 0) and (�3, �5)
51. The line through (3, �5) that is parallel to the liney � 3x � 1
52. The line through (4, 0) that is perpendicular to the linex � y � 3
Solve each problem.
53. Rental charge. The charge for renting an air hammer fortwo days is $113 and the charge for five days is $209. Thecharge C is determined by the number of days n using alinear equation. Find the equation and find the charge for afour-day rental.
54. Time on a treadmill. After 2 minutes on a treadmill, Jennyhas a heart rate of 82. After 3 minutes she has a heart rateof 86. Assume that there is a linear equation that gives her
dug33491_ch03b.qxd 9/14/07 4:05 PM Page 247

Confirming Pages
248 Chapter 3 Linear Equations in Two Variables and Their Graphs 3-78
56. Social Security benefits. If you earned an average of$25,000 over your working life and you retire after 2005 atage 62, 63, or 64, then your annual Social Security benefitwill be $7000, $7500, or $8000, respectively (SocialSecurity Administration, www.ssa.gov). There is a linearequation that gives the annual benefit b in terms of age a forthese three years. Find the equation.
57. Predicting freshmen GPA. A researcher who is studyingthe relationship between ACT score and grade pointaverage for freshman gathered the data shown in theaccompanying table. Find the equation of the line inslope-intercept form that goes through these points.
58. Interest rates. A credit manager rates each applicant for acar loan on a scale of 1 through 5 and then determines the
3.5 VariationSolve each variation problem.
59. Suppose y varies directly as w. If y � 48 when w � 4, thenwhat is y when w � 11?
60. Suppose m varies directly as t. If m � 13 when t � 2, thenwhat is m when t � 6?
61. If y varies inversely as v and y � 8 when v � 6, then whatis y when v � 24?
62. If y varies inversely as r and y � 9 when r � 3, then whatis y when r � 9?
63. Suppose y varies jointly as u and v, and y � 72 when u � 3 and v � 4. Find y when u � 5 and v � 2.
64. Suppose q varies jointly as s and t, and q � 10 when s � 4and t � 3. Find q when s � 25 and t � 6.
65. Taxi fare. The cost of a taxi ride varies directly with thelength of the ride in minutes. A 12-minute ride costs $9.00.
a) Write the cost C in terms of the length T of the ride.b) What is the cost of a 20-minute ride?c) Is the cost increasing or decreasing as the length of the
ride increases?
Figure for Exercise 65
Cos
t (do
llars
)
40
20
10
30
00 10 20 30 40 50Length of ride (minutes)
interest rate from the accompanying table. Find the equa-tion of the line in slope-intercept form that goes throughthese points.
Figure for Exercise 55
Prob
abili
ty o
f no
rai
n 1
0.5
00 0.5 1
Probability of rain
Table for Exercise 57
ACTScore (x) GPA (y)
4 1.0
14 2.0
24 3.0
34 4.0
heart rate h in terms of time on the treadmill t. Findthe equation and use it to predict her heart rate after10 minutes on the treadmill.
55. Probability of rain. If the probability p of rain is 90%, theprobability q that it does not rain is 10%. If the probabilityof rain is 80%, then the probability that it does not rain is20%. There is a linear equation that gives q in terms of p.
a) Find the equation.b) Use the accompanying graph to determine the probabi-
lity of rain if the probability that it does not rain is 0.
Table for Exercise 58
Credit Interest Rating Rate (%)
1 24
2 20
3 16
4 12
5 8
dug33491_ch03b.qxd 9/14/07 4:05 PM Page 248
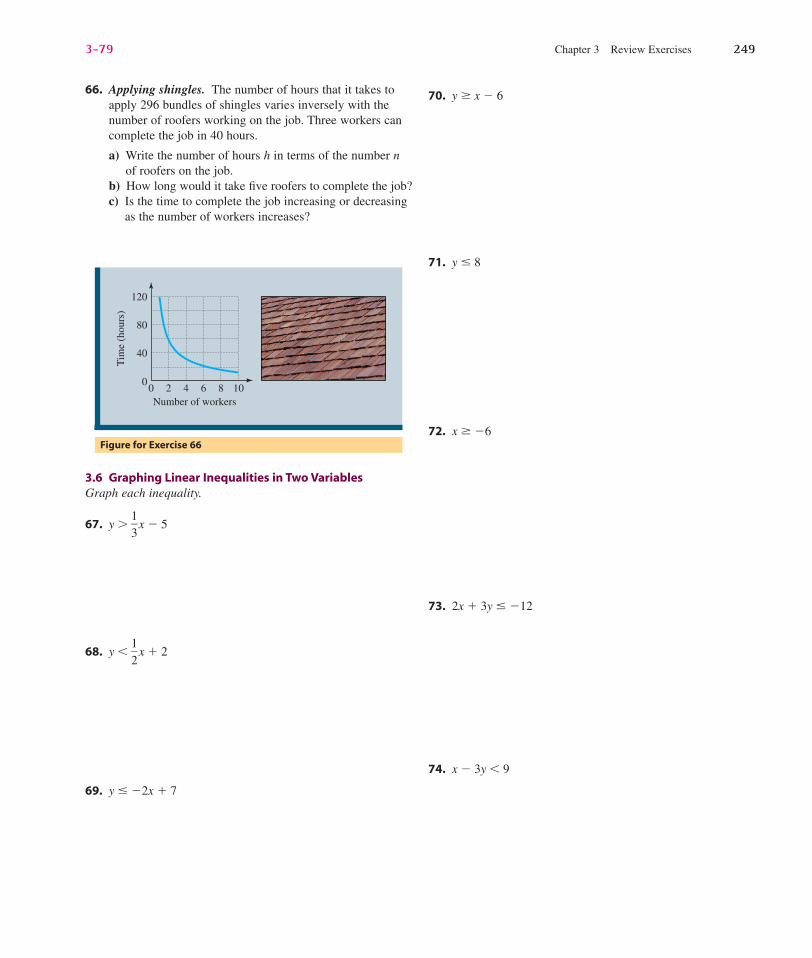
Confirming Pages
3-79 Chapter 3 Review Exercises 249
66. Applying shingles. The number of hours that it takes toapply 296 bundles of shingles varies inversely with thenumber of roofers working on the job. Three workers cancomplete the job in 40 hours.
a) Write the number of hours h in terms of the number nof roofers on the job.
b) How long would it take five roofers to complete the job?c) Is the time to complete the job increasing or decreasing
as the number of workers increases?
3.6 Graphing Linear Inequalities in Two VariablesGraph each inequality.
67. y �13
� x � 5
68. y � �12
� x � 2
69. y � �2x � 7
70. y x � 6
71. y � 8
72. x �6
73. 2x � 3y � �12
74. x � 3y � 9
Figure for Exercise 66
Tim
e (h
ours
)
120
80
40
00 2 4 6 8 10Number of workers
dug33491_ch03b.qxd 9/14/07 4:05 PM Page 249
Confirming Pages
250 Chapter 3 Linear Equations in Two Variables and Their Graphs 3-80
MiscellaneousWrite each equation in slope-intercept form.
75. x � y � 176. x � 5 � y
77. 2x � 4y � 16
78. 3x � 5y � 10
79. y � 3 � 4(x � 2)
80. y � 6 � �3(x � 1)
81. �21
�x � �31
�y � 12
82. �32
�x � �43
�y � 18
Find the x- and y-intercepts for each line.
83. x � y � 1
84. x � y � 6
85. 3x � 4y � 12
86. 5x � 6y � 30
87. y � 4x � 2
88. y � �3x � 1
89. �23
�x � �31
�y � 6
90. ��32
�x � �41
�y � 2
Find the equation of each line in slope-intercept form.
91. The line through (6, 0) with slope �12
�
92. The line through (�3, 0) with slope �23
�
93. The line through (2, 3) that is parallel to y � 994. The line through (4, �5) that is perpendicular to x � 1
95. The line through (�3, 0) and (0, 9)
96. The line through (4, 0) and (0, �6)
97. The line through (1, 1) and (�2, 2)
98. The line through (�5, �3) and (1, 1)
99. The line through (0, 2) that is perpendicular to y � �41
�x
100. The line through (0, 5) that is perpendicular to y � �2x
101. The line through (1, 2) that is parallel to 3x � y � 0
102. The line through (2, �11) that is parallel to y � 3x � 1
Chapter 3 Test
For each point, name the quadrant in which it lies or the axison which it lies.
1. (�2, 7) 2. (��, 0)
3. (3, �6) 4. (0, 1785)
Find the slope of the line through each pair of points.
5. (3, 3) and (4, 4) 6. (�2, �3) and (4, �8)
Find the slope of each line.
7. The line y � 3x � 5 8. The line y � 3
9. The line x � 5 10. The line 2x � 3y � 4
Write the equation of each line. Give the answer in slope-intercept form.
11. The line through (0, 3) with slope ��1
2�
12. The line through (�1, �2) with slope �37
�
Write the equation of each line. Give the answer in standardform using only integers as the coefficients.
13. The line through (2, �3) that is perpendicular to the liney � �3x � 12
14. The line through (3, 4) that is parallel to the line 5x � 3y � 9
Sketch the graph of each equation.
15. y � �12
� x � 3 16. 2x � 3y � 6
dug33491_ch03b.qxd 9/14/07 4:05 PM Page 250

Confirming Pages
3-81 Chapter 3 Test 251
17. y � 4 18. x � �2
Graph each inequality.
19. y 3x � 5 20. x � y � 3
21. x � 2y 4
Solve each problem.
22. Julie’s mail-order CD club charges a shipping and handlingfee of $2.50 plus $0.75 per CD for each order shipped.Write the shipping and handling fee S in terms of thenumber n of CDs in the order.
23. A 10-ounce soft drink sells for 50 cents, and a 16-ouncesoft drink sells for 68 cents. The price P is determinedfrom the volume v of the cup by a linear equation.a) Find the equation.b) Find the price of a 20-ounce soft drink.
24. The demand for tickets to a play can be modeled by theequation d � 1000 � 20p, where d is the number of ticketssold and p is the price per ticket in dollars.
a) How many tickets will be sold at $10 per ticket?b) Find the intercepts and interpret them.
c) Find and interpret the slope, including units.
25. The price P for a watermelon varies directly with itsweight w.a) Write a formula for this variation.b) If the price of a 30-pound watermelon is $4.20, then
what is the price of a 20-pound watermelon?
26. The number n of days that Jerry spends on the road isinversely proportional to the amount A of his sales for theprevious month.a) Write a formula for this variation.b) Jerry spent 15 days on the road in
February because his January sales amount was$75,000. If his August sales amount is $60,000, thenhow many days would he spend on the road inSeptember?
c) Does his road time increase or decrease as his salesincrease?
27. The cost C for installing ceramic floor tile in a rectangularroom varies jointly with the length L and width W of the room.a) Write a formula for this variation.b) The cost is $400 for a room that is 8 feet by 10 feet.
What is the cost for a room that is 11 feet by 14 feet?
dug33491_ch03b.qxd 9/14/07 4:05 PM Page 251
Confirming Pages
252 Chapter 3 Linear Equations in Two Variables and Their Graphs 3-82
x
y
x
y
x
y
x
y
x
y
x
y
x
y
x
y
x
y
x
y
x
y
x
y
Graph PaperUse these grids for graphing. Make as many copies of this page as you need. If you have access to a computer, you candownload this page from www.mhhe.com/dugopolski and print it.
dug33491_ch03b.qxd 9/14/07 4:05 PM Page 252
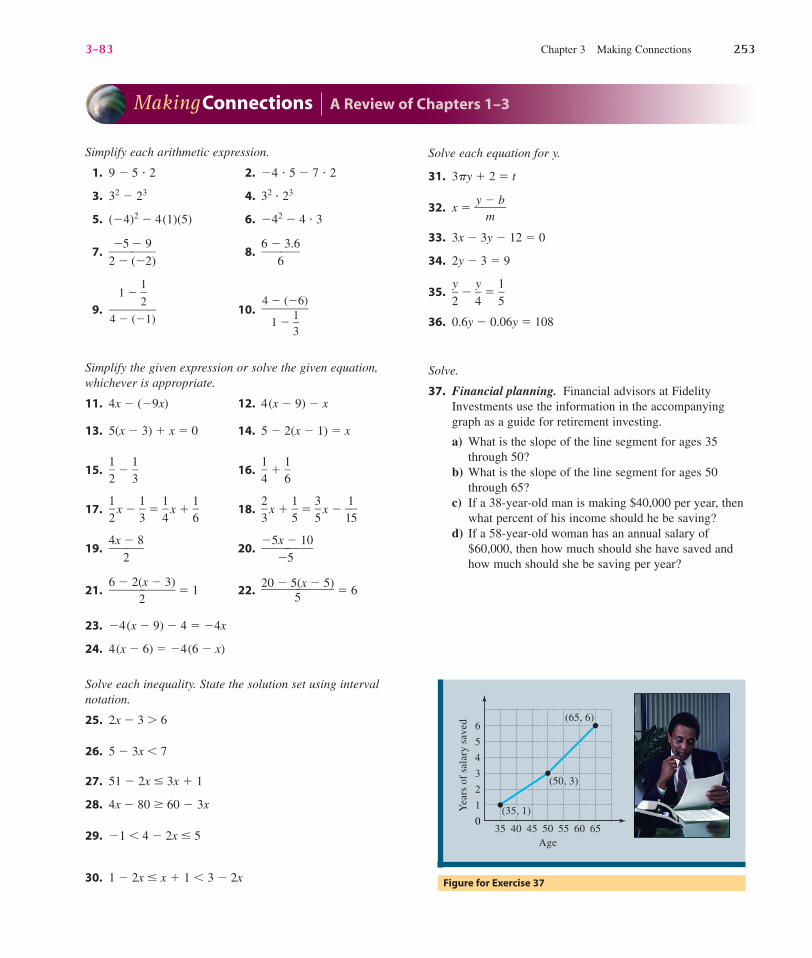
Confirming Pages
3-83 Chapter 3 Making Connections 253
Simplify each arithmetic expression.
1. 9 � 5 � 2 2. �4 � 5 � 7 � 2
3. 32 � 23 4. 32 � 23
5. (�4)2 � 4(1)(5) 6. �42 � 4 � 3
7. �2�
�
5(�
�
92)
� 8. �6 �
63.6�
9. 10.
Simplify the given expression or solve the given equation,whichever is appropriate.
11. 4x � (�9x) 12. 4(x � 9) � x
13. 5(x � 3) � x � 0 14. 5 � 2(x � 1) � x
15. �12
� � �13
� 16. �14
� � �16
�
17. �12
� x � �13
� � �14
� x � �16
� 18. �23
� x � �15
� � �35
� x � �115�
19. �4x
2� 8� 20. �
�5�
x �
510
�
21. �6 � 2(
2x � 3)� � 1 22. �
20 � 55(x � 5)� � 6
23. �4(x � 9) � 4 � �4x
24. 4(x � 6) � �4(6 � x)
Solve each inequality. State the solution set using intervalnotation.
25. 2x � 3 6
26. 5 � 3x � 7
27. 51 � 2x � 3x � 1
28. 4x � 80 60 � 3x
29. �1 � 4 � 2x � 5
30. 1 � 2x � x � 1 � 3 � 2x
4 � (�6)�
1 � �13
�
1 � �1
2�
�4 � (�1)
Solve each equation for y.
31. 3�y � 2 � t
32. x � �y �
mb
�
33. 3x � 3y � 12 � 0
34. 2y � 3 � 9
35. �2y
� � �4y
� � �15
�
36. 0.6y � 0.06y � 108
Solve.
37. Financial planning. Financial advisors at FidelityInvestments use the information in the accompanyinggraph as a guide for retirement investing.
a) What is the slope of the line segment for ages 35through 50?
b) What is the slope of the line segment for ages 50through 65?
c) If a 38-year-old man is making $40,000 per year, thenwhat percent of his income should he be saving?
d) If a 58-year-old woman has an annual salary of$60,000, then how much should she have saved andhow much should she be saving per year?
MakingConnections A Review of Chapters 1–3
Figure for Exercise 37
0
Age
1
2
3
Yea
rs o
f sa
lary
sav
ed
4
5
6
40 45 50 55 60 6535
(65, 6)
(50, 3)
(35, 1)
dug33491_ch03b.qxd 9/14/07 4:05 PM Page 253
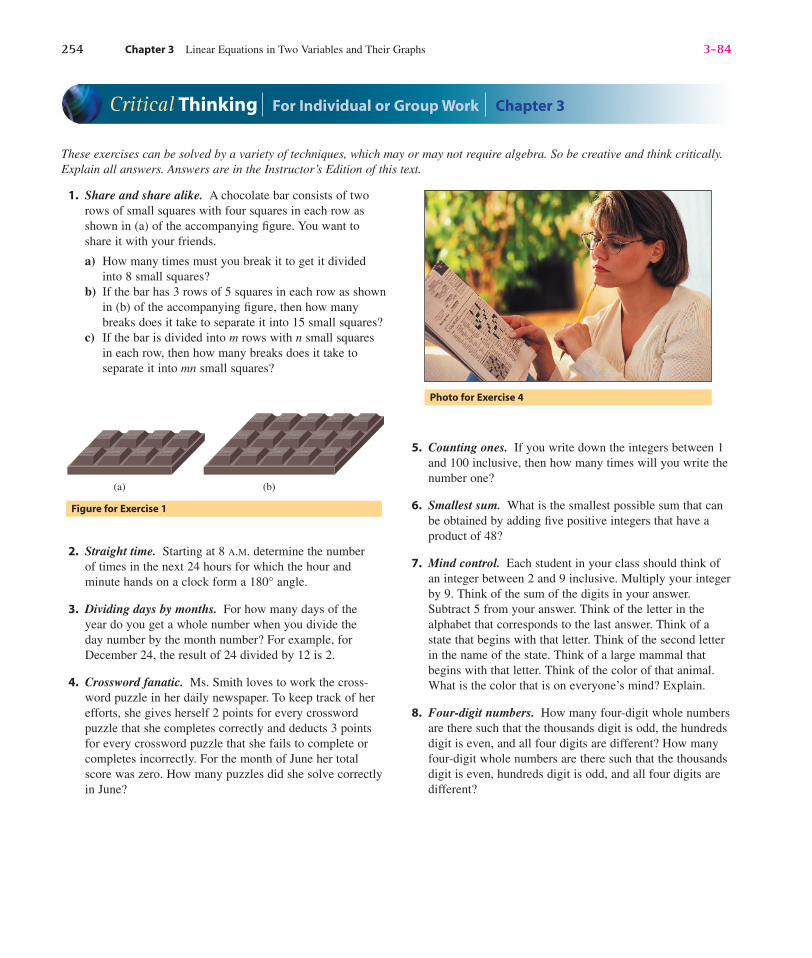
Confirming Pages
254 Chapter 3 Linear Equations in Two Variables and Their Graphs 3-84
These exercises can be solved by a variety of techniques, which may or may not require algebra. So be creative and think critically.Explain all answers. Answers are in the Instructor’s Edition of this text.
Critical Thinking For Individual or Group Work Chapter 3
1. Share and share alike. A chocolate bar consists of tworows of small squares with four squares in each row asshown in (a) of the accompanying figure. You want toshare it with your friends.
a) How many times must you break it to get it dividedinto 8 small squares?
b) If the bar has 3 rows of 5 squares in each row as shownin (b) of the accompanying figure, then how manybreaks does it take to separate it into 15 small squares?
c) If the bar is divided into m rows with n small squaresin each row, then how many breaks does it take toseparate it into mn small squares?
Figure for Exercise 1
(a) (b)
Photo for Exercise 4
2. Straight time. Starting at 8 A.M. determine the numberof times in the next 24 hours for which the hour andminute hands on a clock form a 180° angle.
3. Dividing days by months. For how many days of theyear do you get a whole number when you divide theday number by the month number? For example, forDecember 24, the result of 24 divided by 12 is 2.
4. Crossword fanatic. Ms. Smith loves to work the cross-word puzzle in her daily newspaper. To keep track of herefforts, she gives herself 2 points for every crosswordpuzzle that she completes correctly and deducts 3 pointsfor every crossword puzzle that she fails to complete orcompletes incorrectly. For the month of June her totalscore was zero. How many puzzles did she solve correctlyin June?
5. Counting ones. If you write down the integers between 1and 100 inclusive, then how many times will you write thenumber one?
6. Smallest sum. What is the smallest possible sum that canbe obtained by adding five positive integers that have aproduct of 48?
7. Mind control. Each student in your class should think ofan integer between 2 and 9 inclusive. Multiply your integerby 9. Think of the sum of the digits in your answer.Subtract 5 from your answer. Think of the letter in thealphabet that corresponds to the last answer. Think of astate that begins with that letter. Think of the second letterin the name of the state. Think of a large mammal thatbegins with that letter. Think of the color of that animal.What is the color that is on everyone’s mind? Explain.
8. Four-digit numbers. How many four-digit whole numbersare there such that the thousands digit is odd, the hundredsdigit is even, and all four digits are different? How manyfour-digit whole numbers are there such that the thousandsdigit is even, hundreds digit is odd, and all four digits aredifferent?
dug33491_ch03b.qxd 9/14/07 4:05 PM Page 254