lightning overvoltages and compliance with the iti …m2ec.manunza.com/docs/lightning overvoltages...
TRANSCRIPT

Lightning overvoltages and compliance with the ITI (CBEMA) curve Alessandro Manunza M2EC M2EC, Italy Via Coppelli 15 20037, Paderno Dugnano, Italy [email protected] Abstract The analysis of Insulation Coordination at a new data centre requires assessment in relation to the ITI (CBEMA) curve in addition to the usual analysis. This curve describes an AC input voltage envelope which typically can be tolerated by most Information Technology Equipment. Considering an actual case, a large number of lightning events has been studied. Even though the insulation coordination of the HV and MV systems has been validated, a voltage wave remains entrapped in the system and can cause voltage limits as defined by the ITI (CBEMA) Curve to be exceeded. Keywords: lightning surge, flashover, overvoltages, data centre, ITI (CBEMA) curve.
1 Introduction
Information technology equipment is extremely sensitive to overvoltages. During the design of a new data centre, the usual insulation coordination study is completed by the verification of compliance with the ITI (CBEMA) curve. This curve describes an AC input voltage envelope which typically can be tolerated (no interruption in function) by most Information Technology Equipment. The aim of the study is to both verify that overvoltages do not exceed the impulse protective level of HV and MV equipment, and to verify that overvoltages in the LV system of the data centre are within limits of the ITI (CBEMA) curve. The simulated system was composed by four different voltage levels, from 400 V up to 400 kV, and made complex by a large number of variables, including: plant configurations, position of surge arresters, lightning parameters, impact points of lightning strokes. The study included a comprehensive number of cases of feasible lightning strikes and results highlight that overvoltages in the LV systems run through two different paths: the ground and the phase conductors.
2 System Modelling
The system under examination is extensive, comprising a double circuit Over Head Line (OHL), a HV substation (HV-SS), four HV connections to a power plant, two connections to a very large industrial plant and finally, two connections to the future data centre. Moreover, these two last connections include the transformation from HV level to MV level by means of two autotransformers and two transformer (double ended system). The MV system of the data centre is composed by three rings, feeding several MV/LV transformers and the corresponding radial grids.
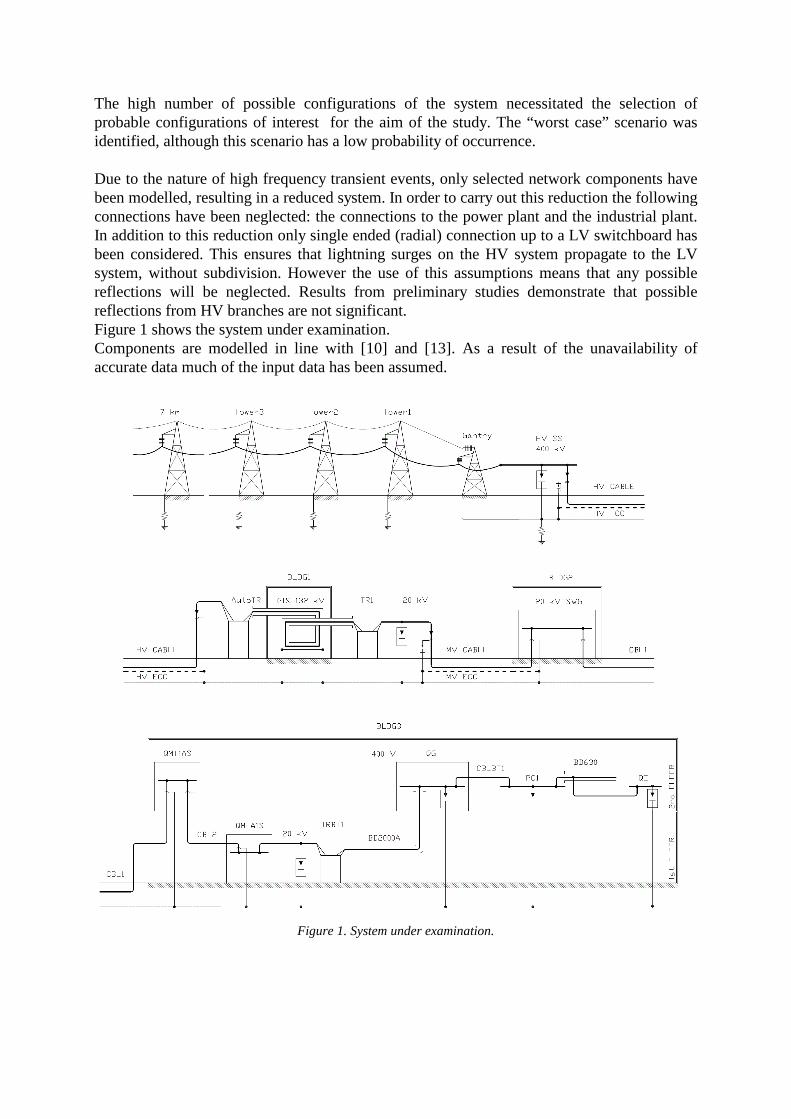
The high number of possible configurations of the system necessitated the selection of probable configurations of interest for the aim of the study. The “worst case” scenario was identified, although this scenario has a low probability of occurrence. Due to the nature of high frequency transient events, only selected network components have been modelled, resulting in a reduced system. In order to carry out this reduction the following connections have been neglected: the connections to the power plant and the industrial plant. In addition to this reduction only single ended (radial) connection up to a LV switchboard has been considered. This ensures that lightning surges on the HV system propagate to the LV system, without subdivision. However the use of this assumptions means that any possible reflections will be neglected. Results from preliminary studies demonstrate that possible reflections from HV branches are not significant. Figure 1 shows the system under examination. Components are modelled in line with [10] and [13]. As a result of the unavailability of accurate data much of the input data has been assumed.
Figure 1. System under examination.

2.1 400 kV Over Head Line
The HV substation plant is connected to the national HV grid by a 8 km double circuit OHL, whose typical tower is shown in Figure 2. In ATP the connection was modelled including phase conductors and a ground wire. By means of the ‟Jmarti” subroutine of the ‟Line Constant” program, the line was modelled by
frequency-dependent travelling wave model in the frequency range of 5 decades and the transformation matrix was calculated at 105 Hz, with a soil resistivity of 300 Ωm. Towers were modelled in compliance with point 7.6.3 of ref. [10] as a lossless propagation line with constant parameters. The isolator chains were represented as variable resistors modulated by a MODELS subroutine. Flashover phenomena were modelled by a voltage-time curve as a function of the chain length, the quote and the time. Isolators were represented only in the three phase system hit by lightning. The earthing electrodes of towers were modelled in compliance with point 7.6.11.1 of ref. [10] as shown in Figure 3. Where R = 10 Ω is a actual value, the L = 0.1 mH and C = 10 nF are assumed.
2.2 HV substation
The impulse withstand voltage of the HV substation equipment is 1425 kV, with a safety margin of 1.05. The resistance of the earthing grid is 0.06 Ω. L = 0.1 mH and C = 10 nF are assumed. The earthing grid was modelled as shown in Figure 3, in compliance with point 7.6.12 of ref. [10].
2.3 GIS, cables and busducts
GIS, cables and busduct were modelled by means of the subroutine “Cable Parameters” with the option “Bergeron” (Constant parameter KCLee or Clark models) and a reference frequency of 105 Hz.
2.4 Transformers
Due to the large range of frequencies involved in the study, transformers and auto-transformer were modelled by means of the “Hybrid Transformer”, which can also provide typical values of the winding capacitances. Table 1 reports the data of transformers.
Figure 3 - Earthing electrode of towers. Figure 2. 400kV Tower.

Rated Power
Ratio Group RT XT Capac. Prim-Gnd
Capac. Sec-Gnd
Capac. Prim-Sec
MVA kV/kV % % nF nF nF
ATR3 150 400/135 Auto YN
0.25 13 3.05 3.585 1.536
TR1 50 132/20 YNd11 0.31 14 2.91 3.74 1.61 TRBT1 2 20/0.4 Dyn11 0.69 6 2.91 3.77 1.61
Table 1. Data of Transformers.
2.5 HV and MV surge arresters
HV and MV surge arresters were modelled as per [18] and [19], which propose a model evolved from that presented in [20]. The main innovation presented in [19] is the possibility to define an approximated model, even if the component data sheet is not complete. This frequency-dependent model is composed by a resistor for numerical stabilization, two inductors and two non-linear resistors, as shown in Figure 4.
2.6 LV system
The LV system is composed by two horizontal busducts, one vertical busduct, two cables and three Surge Protective Devices (SPDs), i.e. LV surge arresters. Due to the lack of models specific for LV components, approximations have been made. Since total length of LV connections is negligible compared to the whole system, approximations are considered as acceptable.
2.7 Lightning
The model and the characteristics of lightning are as per [10] and [13]. The main elements are reported here below. A lightning strike is usually represented by an ideal current generator of infinite source impedance. The wave is modelled by a double exponential function (typically the Heider model), whose parameters (peak, front steepness, time to crest, duration) are described by log-normal statistical distributions. In this study, only negative strokes were considered because they are 90% of downward flashes. The peak value was considered within -2 kA and -200 kA, as per [13]. The front duration was fixed at tf = 3 µs and the time to half value was fixed at th = 75 µs. These are the median values of the respective log-normal distributions. The shielding-failure domain comprises peak current amplitudes less than 20 kA, as per [13]. For this reason, strokes direct to phase conductors and whose peak is greater than 20 kA (absolute value) were not considered in this study. Lightning can cause flashes on the isolator chains, exceeding their insulation level. Cases with and without backflashovers on isolators were studied.
3 Calculation hypothesis
The first aim of the study was to verify that overvoltages do not exceed the impulse protective level of HV and MV equipment, taking into account also the safety factors Ks, as indicated at Section 4.3.4 of [9].
Figure 4. Surge Arrester model.

The second aim was to verify that overvoltages in the LV system of the data centre are within limits of the ITI (CBEMA) curve, shown in Figure 5. This curve was applied to a 400 V 3ph system and the respective peak values have been added. The critical point is per t = 3 ms, where the maximum phase-to-ground voltage is 390 Vpeak. Simulations were performed with a time step of 10-8 s and a time limit of 3.5 ms. This duration of simulation was required in order to assess if overvoltages exceed the limits defined by the ITI (CBEMA) curve. The study was made complex by the high number of variables. Some of them were removed due to preliminary studies or assumptions. The following Table 2 reports the list of variables and respective considerations. Variable Notes Phase of the power system voltage at the stroke instant.
For each lightning case, the voltage phase varied in the range 0° to 360° with a step of 20°.
Peak value of lightning. See the following case subdivision into five groups. Impact points of strokes. Preliminary studies demonstrated that lightning strokes beyond
the third tower do not produce overvoltages exceeding the impulse withstand voltages of the HV and MV devices. Thus farther strokes were not considered. Moreover lightning hit only towers because they are the highest points of the line.
Load impedance of the second HV line.
The effect of the load of the second line is negligible.
Load impedance of the LV system
The effect of the LV load is negligible.
Position of Sheath Voltage Limiters (SVL) of HV and MV cables.
The SVL have greater effect if they are installed at the cable end direct to the energy source, as shown in Figure 1.
Plant configuration. In order to calculate the maximum overvoltages, it was assumed that HV connections toward the power plant and the industrial plant were switched off. Moreover it was also supposed that MV and LV systems were reduced to a radial scheme as shown in Figure 1. In this way the overvoltage wave could not subdivide among the possible branches but it was focused on a specific LV switchgear. On the other hand, this simplification neglected the possibility of voltage increase due to reflections from the ignored branches but preliminary studies demonstrated that these reflections did not significantly affect the results.
Table 2. Study variables.
Study cases were subdivided into five groups: A. Stroke on phase conductor. Peak is less than 20 kA but not so high to cause flashes on
isolators of the first three towers. Maximum peak values: 20 kA for 1st tower, 12 kA for 2nd tower, 11 kA for 3rd tower.
B. Stroke on phase conductor. Peak is less than 20 kA but high enough to cause flashes on isolators of the first three towers.
C. Stroke on ground wire. Peak is not so high to cause flashes on isolators of the first three towers.

D. Stroke on ground wire. Peak is high enough to cause flashes on isolators of the first three towers but not so high that overvoltages exceed the impulse protective level of the HV substation (1425 / 1.05 = 1357 kV).
E. Stroke on ground wire. Peak is high enough to cause flashes on isolators of the first three towers and so high that overvoltages exceed the impulse protective level of the HV substation (1425 / 1.05 = 1357 kV).
For each group, the incidence of strikes was calculated in compliance with equation (3) of point Section 4.3 of [13]. The regional ground flash density was obtained from [12]. The calculated values of incidence should also be multiplied by the probability of occurrence of the considered plant configuration, but it is not known at the moment.
Figure 5. ITI (CBEMA) Curve.
√2*230=325V 390V 455V
650V
1626V
100µs 10µs

4 Results
The following Table 3 summarises the study results. Case
Impact point
Conductor Peak (kA)
OHL isolator flashover
HV SS Poss. flash
HV cbl sheath Possible flash
ITI (CBEMA) exceeded
Lightning / year
A1 1st tower Phase A 2-20 NO NO YES YES (≈700 V @ 3ms)
0.0472
A2 2nd tower Phase A 2-12 NO NO YES YES (≈700 V @ 3ms)
0.0403
A3 3rd tower Phase A 2-11 NO NO YES YES (≈700 V @ 3ms)
0.0455
B1 1st tower Phase A See case A1 where peak value is already at maximum for lightning on conductor phase.
B2 2nd tower Phase A 13-20 YES: Tower 1, 2, 3
YES YES YES (≈500V@ 3.5ms)
0.0294
B3 3rd tower Phase A 12-20 YES: Tower 2, 3
YES YES YES (≈600V@ 3.5ms)
0.0432
C1 1st tower GND Wire 2-84 NO NO NO YES (≈600 V @ 3ms)
0.2261
C2 2nd tower GND Wire 2-50 NO NO NO NO 0.2837 C3 3rd tower GND Wire 2-54 NO NO NO NO 0.3799
D1 1st tower GND Wire 84-85 YES: Tower 1
NO YES YES (≈700 V @ 3ms)
0.0006
D2 2nd tower GND Wire 51-105 YES: Tower 1, 2, 3
NO YES YES (≈700 V @ 3ms)
0.0807
D3 3rd tower GND Wire 55-105 YES: Tower 1, 2, 3
NO YES YES (≈700 V @ 3ms)
0.0847
E1 1st tower GND Wire 86-200 YES YES YES YES (≈700 V @ 3ms)
0.0138
E2 2nd tower GND Wire 106-200 YES YES YES YES (≈700 V @ 3ms)
0.0100
E3 3rd tower GND Wire 106-200 YES YES YES YES (≈700 V @ 3ms)
0.0128
Table 3. Study Results.
Varying the voltage phase in each case, the peak value was varied in order to satisfy the conditions of belonging to a specific group. Thus the previous results were determined considering also the following criteria. Group A: since the peak value was limited to avoid flashes on isolators of the first three towers, the reported results corresponds to the maximum overvoltage in the HV substation. Group B: since the peak value was limited to 20 kA, the reported results corresponds to the voltage phase which produced the maximum overvoltage in the HV substation. Group C: the reported result corresponds to the minimum peak value that did not produce flashes on isolators varying the voltage phase. Hence for different phase values, the current peak can be increased without producing flashes. Group D: given the voltage phase, the peak current was increased starting from the values of group C up to the reaching of the maximum admissible voltage in the HV substation. The following phenomenon was found: having the phase fixed and increasing the current peak, the voltage at the HV substation should increase but also the number of flashing isolators could increase reducing the substation voltage. The reported results corresponds to the minimum current peak that produced the limit voltage, but with different phases of the grid voltage, greater peak values can be found. Group E: no specific criteria for this group, which simply contains strokes so powerful that the limit voltage at the HV substation can be exceeded. Possible overvoltages in the LV system could be less significant than damages of the HV system.

The following figures 6, 7, 8 and 9 show the simulation results of case A1 just as an example.
5 Discussion
The HV substation and the MV components are properly protected by surge arresters, except in case of lightning strikes of very high magnitudes. The lightning cases can be subdivided into two main families:
1. Considering strikes to the shieldwire only, which do not result in a backflashover. This results in a rise of earth potential at the substation (Group C);
2. Considering overvoltages that propagate along phase conductors as a result of direct strike (Groups A and B) or a backflashover (Groups D and E).
In the first family, overvoltages in phase conductors are time-limited and are mainly due to the ground potential rise (GPR). In cases C2 and C3 the ITI (CBEMA) curve is not exceeded. In the second family, overvoltages are due not only to the ground potential rise but also to a voltage wave “entrapped” within the system. This wave, which is lower than the insulation level of HV and MV components, does not produce any action in HV and MV surge arresters, but oscillates for a long time since it is smoothly damped by the system resistances. Consequences of this long-lasting wave are evident in the LV system where limits of ITI (CBEMA) curve are exceeded for t > 3 ms. Further results, not included in this paper, demonstrate that this entrapped wave is produced also by strokes beyond the third tower.
(f ile CED-rev 2-CasoA1.pl4; x-v ar t) v :SSATA -GND v :SSATB -GND v :SSATC -GND 0.0 0.5 1.0 1.5 2.0 2.5 3.0 3.5[ms]
-1.40
-0.96
-0.52
-0.08
0.36
0.80
[MV]
(f ile CED-rev 2-CasoA1.pl4; x-v ar t) v :QMTA -GND v :QMTB -GND v :QMTC -GND 0.0 0.5 1.0 1.5 2.0 2.5 3.0 3.5[ms]
-50.0
-37.5
-25.0
-12.5
0.0
12.5
25.0
37.5
50.0
[kV]
(f ile CED-rev 2-CasoA1.pl4; x-v ar t) v :QEA -GND v :QEB -GND v :QEC -GND 0.0 0.5 1.0 1.5 2.0 2.5 3.0 3.5[ms]
-700
-525
-350
-175
0
175
350
525
700
[V]
(f ile ced-rev 2-casoa1lungo.pl4; x-v ar t) v :QEA -GND 0 4 8 12 16 20[ms]
-700
-525
-350
-175
0
175
350
525
700
[V]
Figure 6. Case A1 - Ph to GND VLTG at HV SS.
Figure 7. Case A1 - Ph to GND VLTG at MV SWG.
Figure 8. Case A1 - Ph to GND VLTG at LV SWG. Figure 9. Case A1 - Ph A at LV SWG for 20ms.

5.1 LV system
The voltage trend in the LV system was studied in detail. Except for cases C2 and C3, the voltage trend was very similar in all the other cases. Results of Case A1 were considered as typical and are examined in more detail. As already stated, line to ground overvoltages in the LV system have two origins namely: rise in voltage of the phase conductors, and rise in voltage of the ground. Confirmation of this double origin was found separating the two phenomena. Moreover the importance of the Surge Protective Devices (SPDs) was examined. Effect of SPDs: The effect of SPDs on the LV system can be seen by comparing Figure 10 with Figure 8. Figure 10 shows the time trend of the voltage in the LV system on the left, with an enlargement for 2.5 < t < 3.5 ms on the right. Results clearly show that the overvoltage seen in increased as a result of removal of the SPDs. Figure 10 shows that the voltage trend starts with two high peaks, the first positive and the second negative, due to lightning. Subsequently the voltage continues oscillating between values much higher than the limit of 390 V.
Effect of Supply: The LV system is separated from the MV/LV transformer and fed by means of an independent source. The phase to ground voltages are shown in Figure 12, while the ground potential rise is shown in Figure 11 with changed sign. It is clear that the initial voltage trend is due to the GPR. But its effect is negligible in about 1 ms.
Effect of Earthing: Separating the LV system from the grounding grid and removing the effects of GPR from the initial lightning strike shows a significant reduction in overvoltages
(f ile A1-assenzaSPD.pl4; x-v ar t) v :PC1A -GND v :PC1B -GND v :PC1C -GND 2.5 2.7 2.9 3.1 3.3 3.5[ms]
-3000
-2250
-1500
-750
0
750
1500
[V]
(f ile A1-assenzaSPD.pl4; x-v ar t) v :PC1A -GND v :PC1B -GND v :PC1C -GND 0.0 0.5 1.0 1.5 2.0 2.5 3.0 3.5[ms]
-40
-30
-20
-10
0
10
20
30
40
[kV]
(f ile ced-rev 2-casoa1.pl4; x-v ar t) factors:offsets:
10
v :GND -10
0.0 0.5 1.0 1.5 2.0 2.5 3.0 3.5[ms]-40
-25
-10
5
20
35
50
[kV]
(f ile A1-assenzaSPD-potenzialeterra.pl4; x-v ar t) v :PC1A -GND v :PC1B -GND v :PC1C -GND 0.0 0.5 1.0 1.5 2.0 2.5 3.0 3.5[ms]
-40
-25
-10
5
20
35
50
[kV]
Figure 10. Voltage trend in LV system without SPDs.
Figure 11. Ground Potential Rise. Figure 12. Ph-to-GND voltages when LV system is fed by independent source.

as shown in Figure 12. Comparing Figure 13 with Figure 14, which shows the voltage trend in a 20 kV switchgear, it is clear that voltages in the LV system depend on the MV system for t > 1 ms. This shows that overvoltage caused by GPR only could exceed the limits of the ITI (CBEMA) curve for approximately 1ms, but that the limits of the ITI (CBEMA) curve are exceeded in a large number of cases as a result of the transfer of the entrapped voltage wave through the transformers from the HV system to the LV system for t > 3 ms.
6 Conclusions
A large number of lightning strokes has been studied in order to determine possible overvoltages in the electrical system of a Data Centre. Due to the probabilistic nature of lightning and isolating materials during fast transient overvoltages, and due to the hypothesis on the electrical parameters of the components, results are qualitative. The study demonstrated that the HV and MV systems can be properly protected by surge arresters. Regarding the LV system, the study demonstrated that the voltage limits of the ITI (CBEMA) curve will always be exceeded in the long term, except for very few cases.
7 Acknowledgements
The author wishes to express his gratitude to Mr. Neil Mc Donagh for reviewing the work.
8 Appendix: Future Developments
Some possible improvements of this study are listed in the following paragraphs.
8.1 HV OHL
OHL towers were modelled as cones. Further studies will consider better representations. The values of L and C of the model of earthing electrodes shall be determined with greater precision.
8.2 HV substation
The grounding grid of substations was modelled in compliance with point 7.6.12 of ref. [10], but this is the same model used for the earthing electrodes of OHL towers. Further studies
(f ile A1-assenzaSPD-neutroisolato.pl4; x-v ar t) v :PC1A - v :PC1B - v :PC1C - 0.0 0.5 1.0 1.5 2.0 2.5 3.0 3.5[ms]
-10.0
-6.6
-3.2
0.2
3.6
7.0
[kV]
(f ile A1-assenzaSPD-neutroisolato.pl4; x-v ar t) v :QA1SA -GND v :QA1SB -GND v :QA1SC -GND
0.0 0.5 1.0 1.5 2.0 2.5 3.0 3.5[ms]-50.0
-37.5
-25.0
-12.5
0.0
12.5
25.0
37.5
50.0
[kV]
Figure 13. Voltage trend in MV SWG. Figure 14. LV system separated from the grounding grid.

shall investigate the modelling of grounding grids which are some square kilometres large and possible phenomenon of wave propagation.
8.3 Cable SVL
The external insulating covers of cables are tested, as imposed by IEC standards, applying DC voltages between sheaths and ground: 20 kV for HV cables and 15 kV for MV cables. These limits were used for the SVL sizing. Future studies shall investigate the impulse withstand voltage of the external insulating covers of cables.
8.4 LV System
It is important to note that: 1. It is extremely rare finding technical papers concerning fast transients in LV systems; 2. LV busducts mathematical models suitable for fast transient studies are unknown by
authors; 3. Mathematical models for vertical cables are unknown by authors; 4. Mathematical models for Surge Protective Devices (SPDs), i.e. LV surge arresters, are
unknown by authors and the model proposed for HV and MV surge arresters has been used.
In order to overcome these limitations, the LV system was modelled with some approximations. For example, the following Figure 15 shows how LV busducts were modelled.
8.5 HV Equivalent Grid
Connected to the remote end of the OHL, the national HV grid was represented by its Thevenin equivalent, calculate on the base of its short circuit power. Considering the so long lasting simulations and the frequencies of oscillations of the entrapped wave, the grid equivalent shall be improved considering that the impedance is frequency-dependent as indicated in IEC standard 61000-3-6.
N L1 L2 L3
PE
Figure 15. LV busduct modelling.

9 Reference Documents
9.1 Electrical Equipment
[1] Nexans, Single core XLPE-cable – 1x1600 Al/Pb 87/150 kV. [2] Prysmian, Catalogo generale. [3] Unificazione ENEL, Linee a 380 kV. [4] ITI (CBEMA), CURVE APPLICATION NOTE. [5] Contrade, catalogo generale. [6] ABB, High Voltage Surge Arresters Buyer’s guide. [7] ABB, Application Guidelines Overvoltage Protection.
9.2 Standards
[8] IEC EN 60071-1: 1995-06, Insulation Co-ordination Part 1: Definitions, principles and rules.
[9] IEC EN 60071-2: 1997-01, Insulation Co-ordination Part 2: Application guide. [10] IEC TR 60071-4: 2004-06, Insulation Co-ordination Part 4: Computational guide
to insulation co-ordination and modelling off electrical networks. [11] IEEE Std 1313.1, IEEE Standard for insulation coordination – definitions,
principles and rules. [12] CEI 81-3, Valori medi del numero dei fulmini a terra per anno e per chilometro
quadrato dei Comuni d’Italia, in ordine alfabetico, data 1999-05
9.3 Technical Papers
[13] Cigré: “Guide to procedures for estimating the lightning performance of transmission lines”, ref. 63, working Group 33-01, 1991-10.
[14] IEEE Trans. On P.D., Vol. 11, No. 1, January 1996, Modeling guidelines for fast front transients, Report prepared by the Fast Front Transient Task Force of the IEEE Modeling and Analysis of System Transient Working Group.
[15] Alternative Transients Program (ATP) Rule Book – July 1987. [16] László Prikler, Hans Kristian Høidalen, ATPDraw version 3.5 for Windows
9x/NT/2000/XP – User’s Manual. [17] Hans Kristian Høidalen, ATPDraw version 5 – User manual supplements, Nov.
18th 2007, Trondheim-Norway. [18] Pinceti, P.; Giannettoni, M., A Simplified Model for Zinc Oxide Surge Arresters,
IEEE Transactions on PWD, Vol. 14 (1999) No. 2, pp. 393–397. [19] Magro, Giannettoni, Pinceti, Validation of ZnO surge arresters model for
overvoltage studies, IEEE Transactions on PWD, Vol. 19 (2004), pp. 1692-1695. [20] IEEE W.G. 3.4.11 of Surge Protective Devices Committee: “Modeling of metal
oxide surge arresters”, Transactions on Power Delivery, IEEE, January 1992, vol.7, No. 1, pp. 301-309.