lifecycle management of commercially approved qc …€¦ · genentech, a member of the roche group...
TRANSCRIPT

Heather Runes, Ph.D., MMTech Genentech, A Member of the Roche Group Wei-Meng Zhao and Dieter Schmalzing
Genentech, A Member of the Roche Group
January 27, 2014
CMC Strategy Forum
Washington, D.C.
Lifecycle Management of Commercially Approved QC Potency Assay for a Biotech
Product. – A Case Study
Presentation outline
• Method lifecycle management
• Considerations for post approval potency method change
• Three Case Studies:
1. Assay Replacement
2. Assay Enhancement
3. Assay Replacement
• Conclusions
Page 2
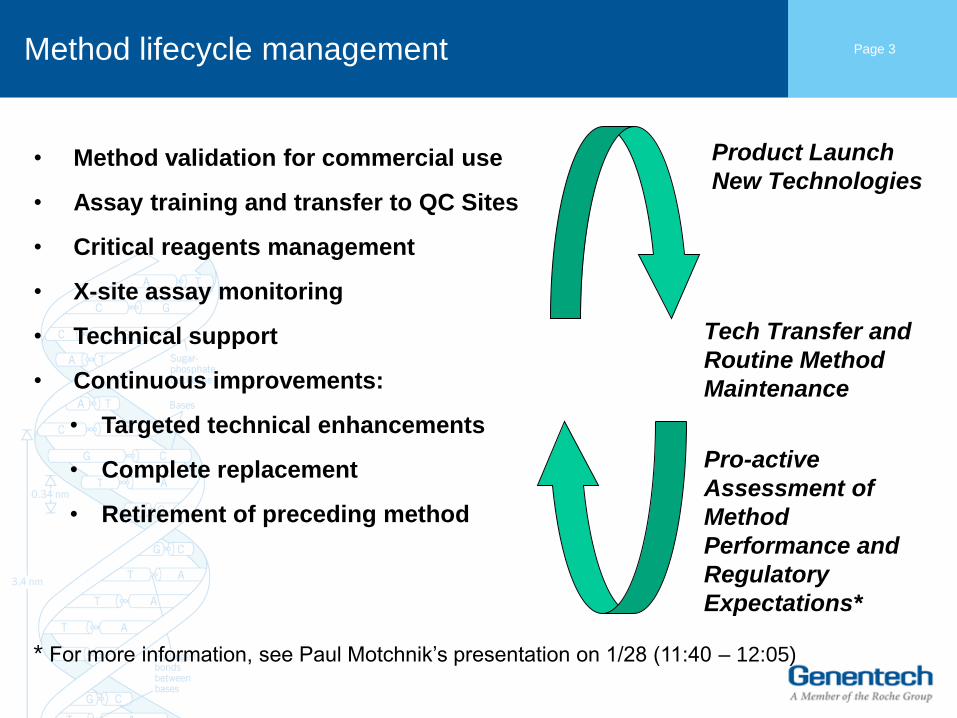
Page 3 Method lifecycle management
• Method validation for commercial use
• Assay training and transfer to QC Sites
• Critical reagents management
• X-site assay monitoring
• Technical support
• Continuous improvements:
• Targeted technical enhancements
• Complete replacement
• Retirement of preceding method
* For more information, see Paul Motchnik’s presentation on 1/28 (11:40 – 12:05)
Product Launch
New Technologies
Tech Transfer and
Routine Method
Maintenance
Pro-active
Assessment of
Method
Performance and
Regulatory
Expectations*

Drivers and Activities – Post-approval Potency
Method Change
• Drivers:
• New regulatory requirements
• Better understanding of MOAs
• Change in vendor support: reagents, hardware, software
• Superior technology (i.e automation)
• Increased efficiency (i.e. higher throughput)
• Work safety (i.e. ergonomic risk reduction)
• Activities:
• Assessment of criticality of change (i.e. regulatory impact)
• Development
• Robustness
• Validation
• Comparability study (new vs old method)
• Submission
Page 4
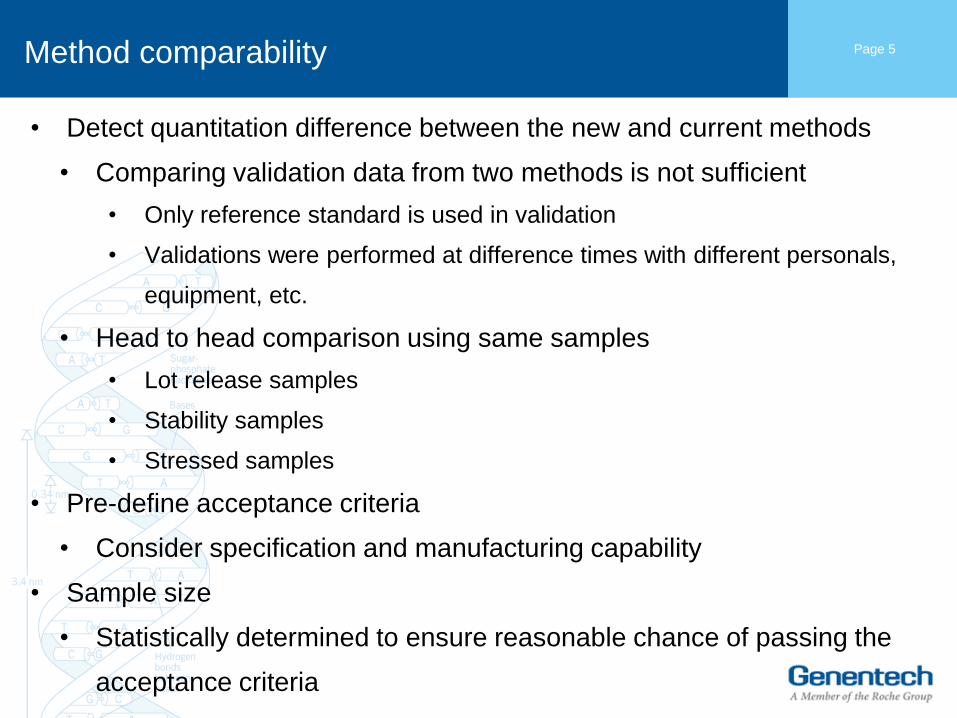
Method comparability
• Detect quantitation difference between the new and current methods
• Comparing validation data from two methods is not sufficient
• Only reference standard is used in validation
• Validations were performed at difference times with different personals,
equipment, etc.
• Head to head comparison using same samples
• Lot release samples
• Stability samples
• Stressed samples
• Pre-define acceptance criteria
• Consider specification and manufacturing capability
• Sample size
• Statistically determined to ensure reasonable chance of passing the
acceptance criteria
Page 5

Example 1 Page 6
Specification Range ≈ Manufacturing Capability
Tolerance for uncertainty: Lower
Acceptance Criteria: Tighter
Sample size for comparability: Higher
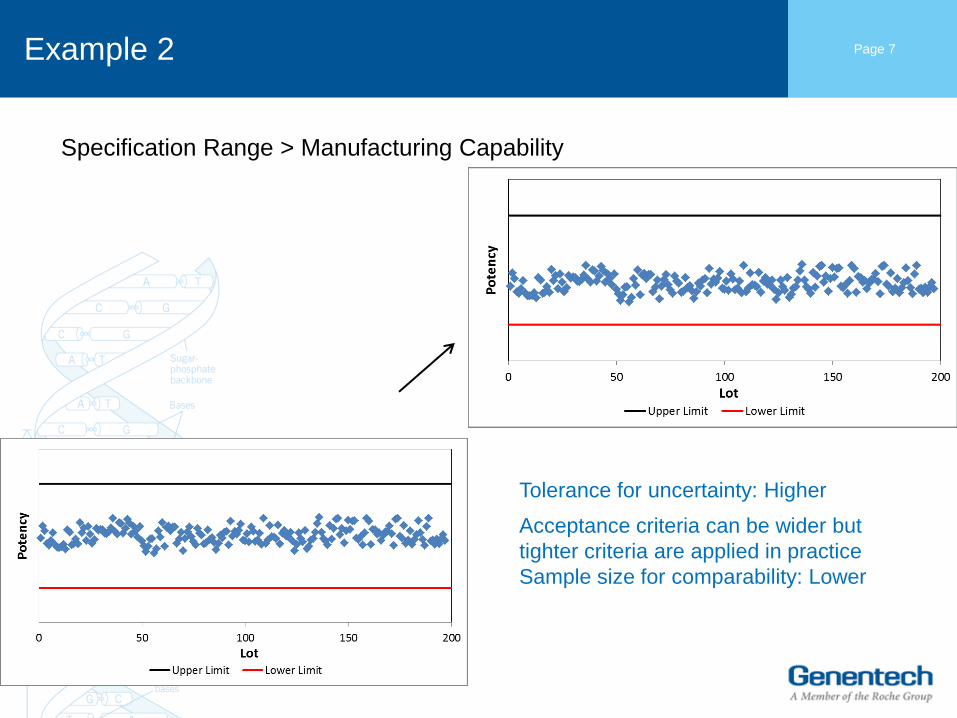
Example 2
Page 7
Specification Range > Manufacturing Capability
Tolerance for uncertainty: Higher
Acceptance criteria can be wider but
tighter criteria are applied in practice
Sample size for comparability: Lower
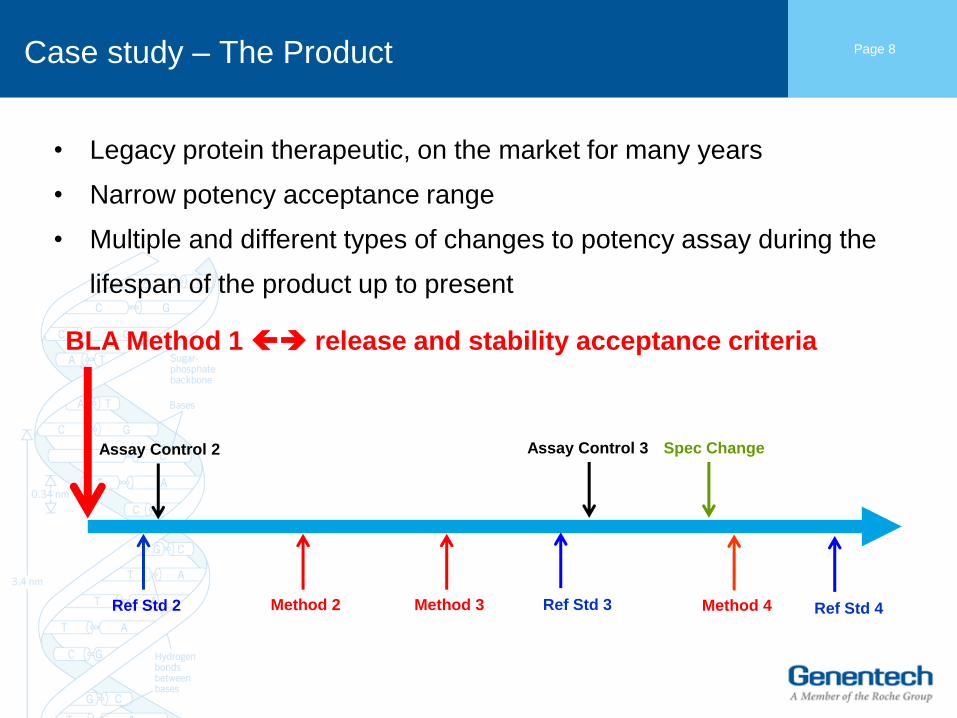
Case study – The Product
• Legacy protein therapeutic, on the market for many years
• Narrow potency acceptance range
• Multiple and different types of changes to potency assay during the
lifespan of the product up to present
Page 8
Method 2 Ref Std 2
Assay Control 2
Method 3 Ref Std 3
Assay Control 3 Spec Change
Method 4 Ref Std 4
BLA Method 1 release and stability acceptance criteria
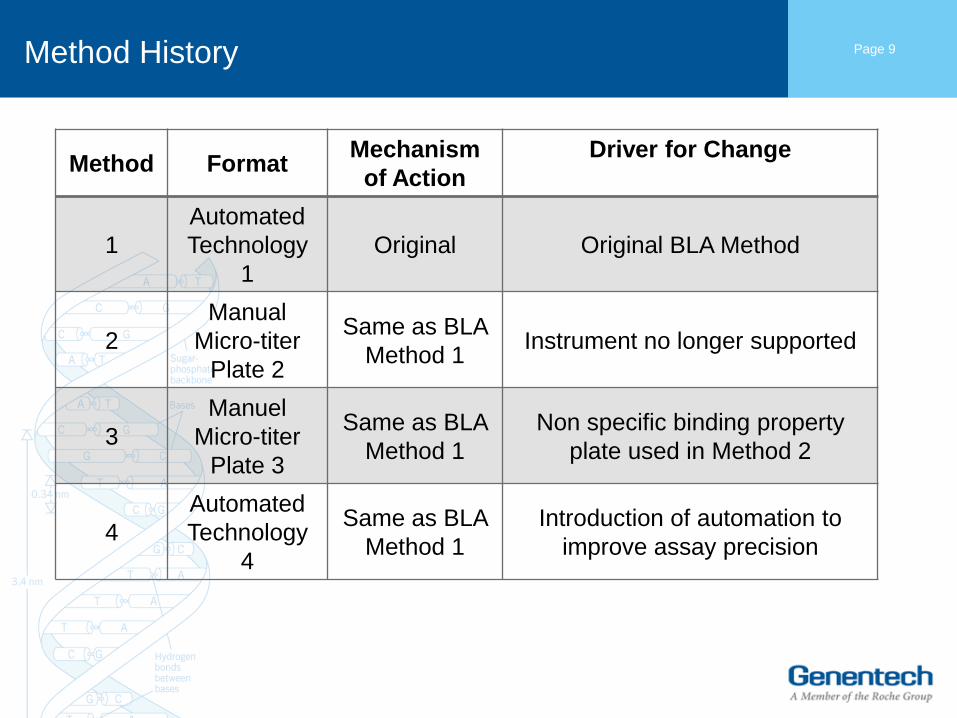
Method History
Page 9
Method Format Mechanism
of Action
Driver for Change
1
Automated
Technology
1
Original Original BLA Method
2
Manual
Micro-titer
Plate 2
Same as BLA
Method 1 Instrument no longer supported
3
Manuel
Micro-titer
Plate 3
Same as BLA
Method 1
Non specific binding property
plate used in Method 2
4
Automated
Technology
4
Same as BLA
Method 1
Introduction of automation to
improve assay precision
Case
Study 1
Page 10
Case Study: Method 1 (BLA) 2 – Replacement
• Method 2 was developed and validated and comparability between the
two methods was shown
• 21 release samples were performed in comparability exercise
• No predefined acceptance criteria
• No extensive statistical analysis
• Comparison of same control: 0.5% difference
• RSD increased from 3% to 6%
• Increase of potency on release results after implementation
• iOOS events exceeding upper limit
• Root cause: nonspecific binding property of the plate
• Higher potency in sample positions
• This was not identified during development and validation
Page 11
Case
Study 2
Page 12

Case Study: Method 2 3 – Enhancement
• Plate change to remove nonspecific binding of the plate used in Method 2
• Plates use the same type of material but are treated differently on the
surface
• Positional effects were removed and validation was performed
• No head-to-head comparison was performed
• Removal of the positional effect was deemed sufficient
• iOOS events at lower end of the acceptance criteria during routine testing
• Due to the shift introduced by method change, proposal for specification
change was sought
Page 13
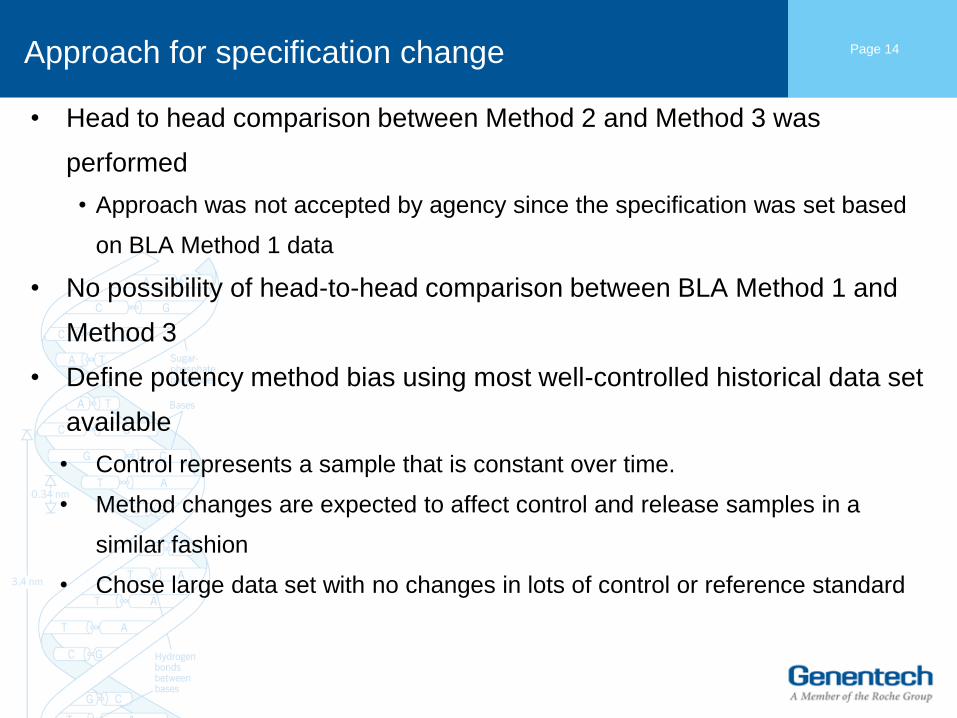
Approach for specification change
• Head to head comparison between Method 2 and Method 3 was
performed
• Approach was not accepted by agency since the specification was set based
on BLA Method 1 data
• No possibility of head-to-head comparison between BLA Method 1 and
Method 3
• Define potency method bias using most well-controlled historical data set
available
• Control represents a sample that is constant over time.
• Method changes are expected to affect control and release samples in a
similar fashion
• Chose large data set with no changes in lots of control or reference standard
Page 14
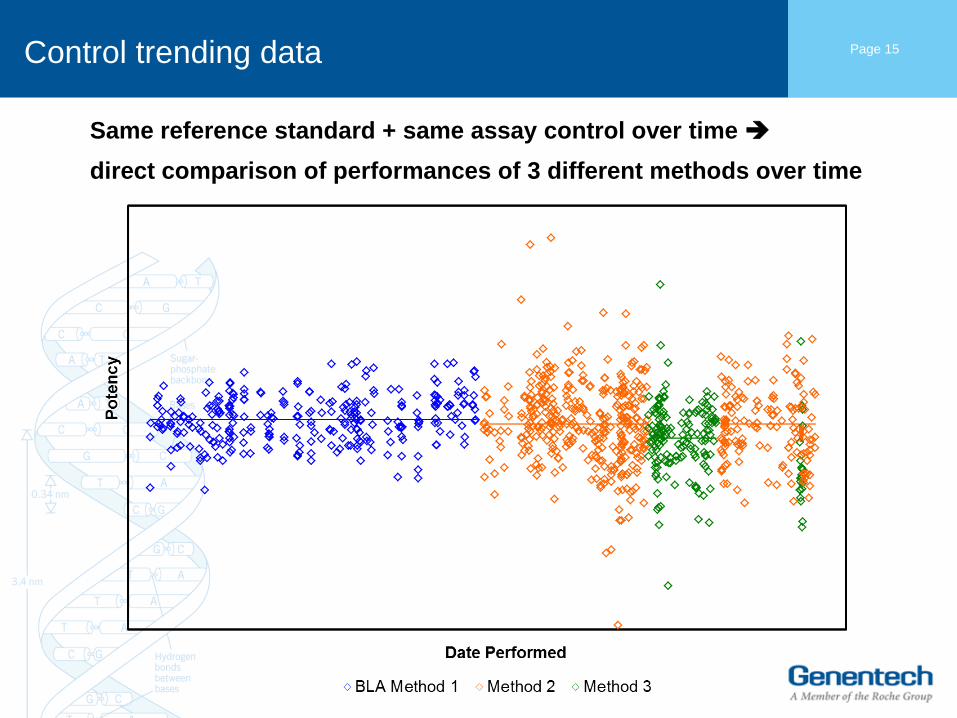
Control trending data Page 15
Same reference standard + same assay control over time
direct comparison of performances of 3 different methods over time
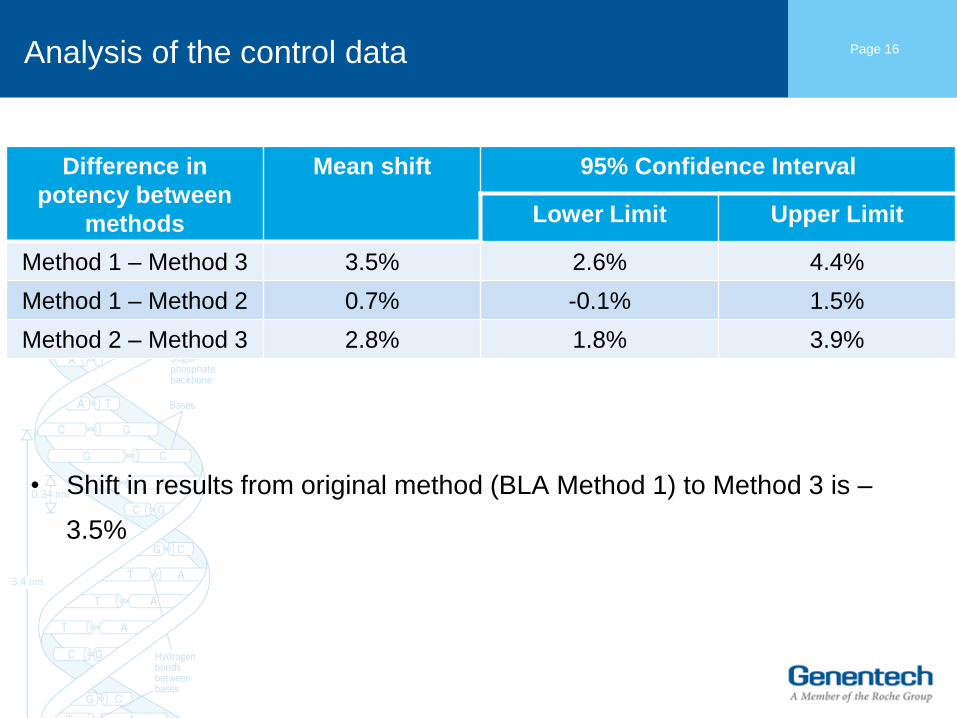
Analysis of the control data
• Shift in results from original method (BLA Method 1) to Method 3 is –
3.5%
Page 16
Difference in
potency between
methods
Mean shift 95% Confidence Interval
Lower Limit Upper Limit
Method 1 – Method 3 3.5% 2.6% 4.4%
Method 1 – Method 2 0.7% -0.1% 1.5%
Method 2 – Method 3 2.8% 1.8% 3.9%
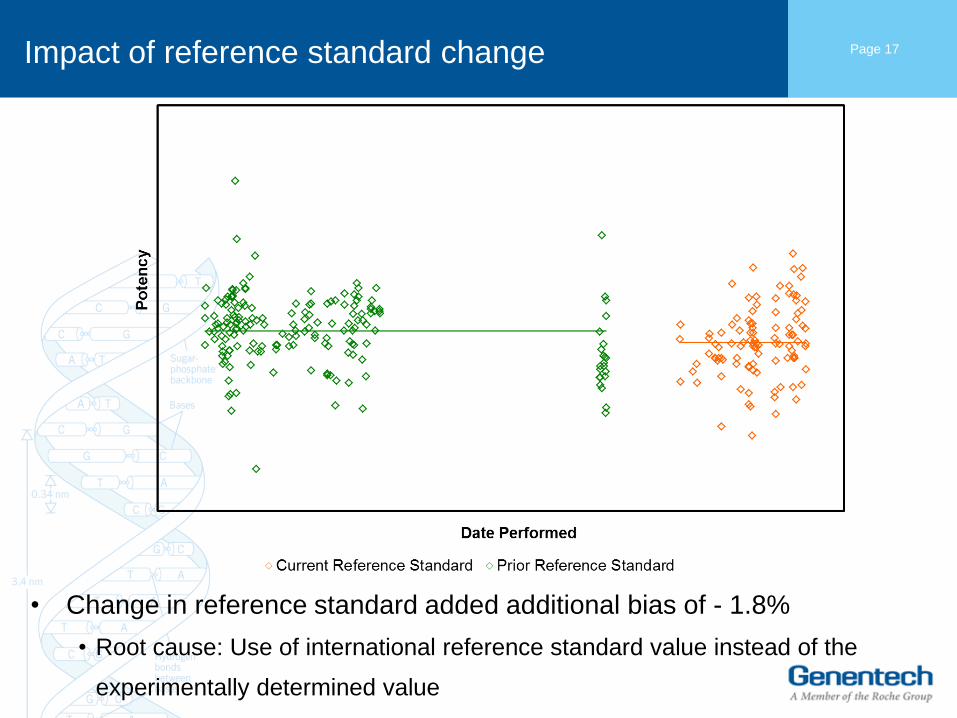
Impact of reference standard change
• Change in reference standard added additional bias of - 1.8%
• Root cause: Use of international reference standard value instead of the
experimentally determined value
Page 17
Summary
• Shift in results from original method (Method 1) to Method 3 is – 3.5%
• Change in reference standard added additional bias of – 1.8%
• Overall change in results is - 5.3%, which is highly relevant in relation to
the narrow specification
• Propose to revise the acceptance criteria by lowering both the upper
and lower acceptance limits by 5.3% based on extensive data mining
and experimental data
• Proposal was accepted by agency
Page 18

Case
Study 3
Page 19
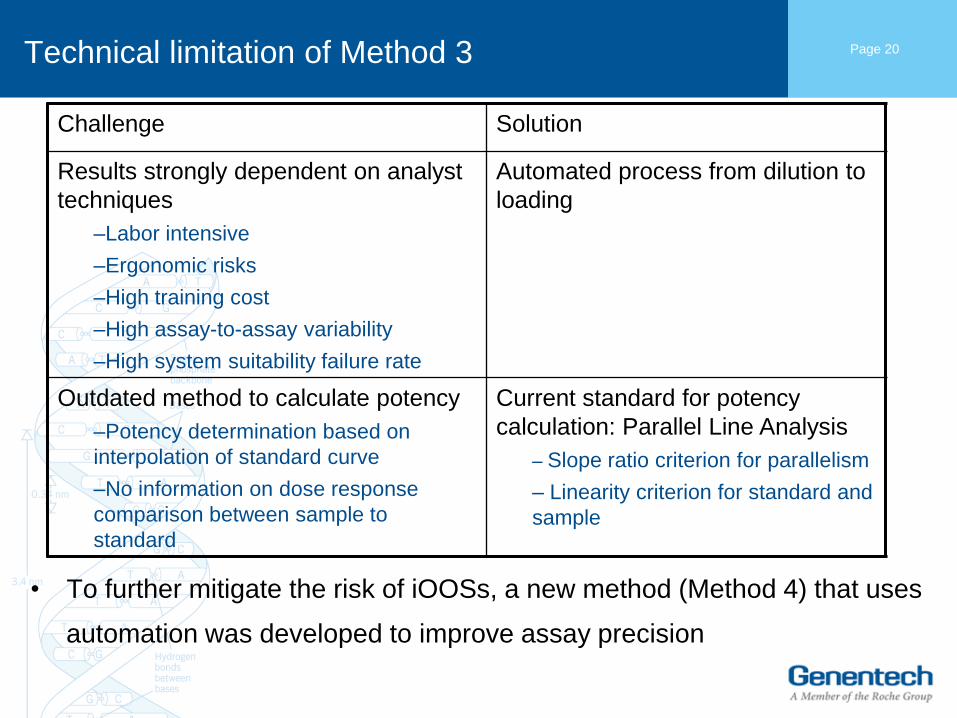
Technical limitation of Method 3
• To further mitigate the risk of iOOSs, a new method (Method 4) that uses
automation was developed to improve assay precision
Page 20
Challenge Solution
Results strongly dependent on analyst
techniques
–Labor intensive
–Ergonomic risks
–High training cost
–High assay-to-assay variability
–High system suitability failure rate
Automated process from dilution to
loading
Outdated method to calculate potency
–Potency determination based on
interpolation of standard curve
–No information on dose response
comparison between sample to
standard
Current standard for potency
calculation: Parallel Line Analysis
– Slope ratio criterion for parallelism
– Linearity criterion for standard and
sample
Method 4 assay development
• Lessons learned from previous cases of method changes
• Extensive development work was performed to understand Method 4
assay accuracy and precision and assay bias between Method 3 and
Method 4 if any
• Multiple DOE studies were performed
• Loading order effect investigated and resolved
• Validation and method comparability studies were only initiated after
extensive development work and both served as confirmatory exercises
to confirm what were shown during assay development
Page 21

Slide 22 Comparison of assay design
© 2009, Genentech / Proprietary information – Please do not copy, distribute or use without prior written consent.
Method 3 Method 4
Mechanism of action Same as BLA Method 1
Critical reagents Same as BLA Method 1
Specifications Same as Method 3
Dilution/loading Manual Automated
Format Micro-titer Plate Single Cuvette
Calculation Method Interpolation Parallel Line Analysis
System Suitability
Correlation coefficient for Standard
N/A Correlation coefficient for
Sample
N/A Slope ratio
Control range: mean ± 15% Control range: mean ± 9%
CV criterion for
reportable result
CV ≤ 15% CV ≤ 5% (tighter criterion due
to improved assay precision)
Throughput/ analyst 6 samples/ week 18 samples/ week
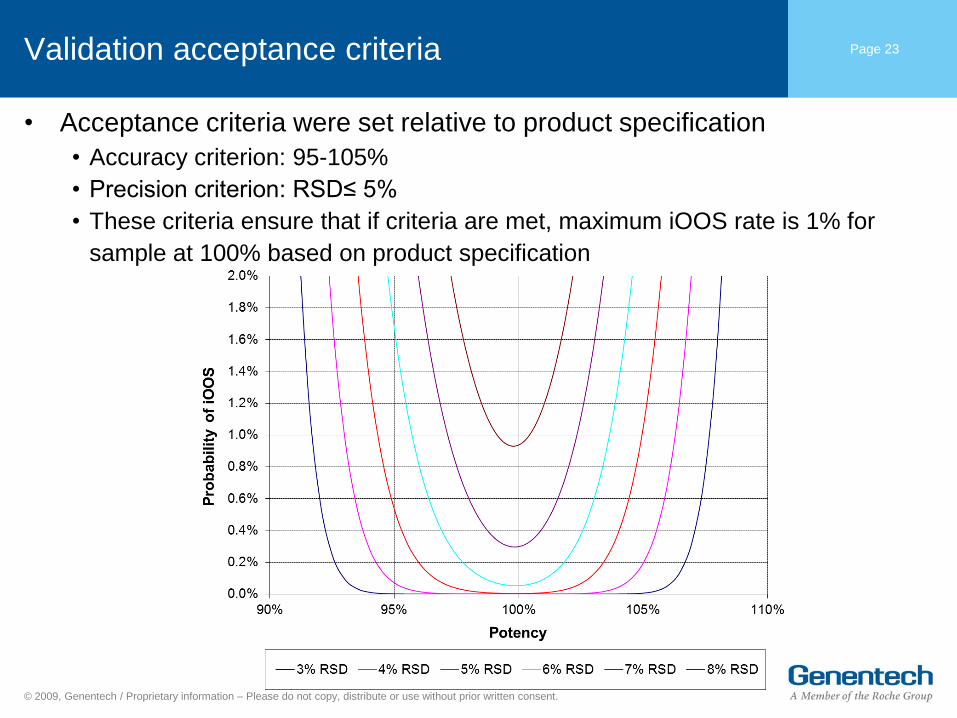
Validation acceptance criteria
• Acceptance criteria were set relative to product specification
• Accuracy criterion: 95-105%
• Precision criterion: RSD≤ 5%
• These criteria ensure that if criteria are met, maximum iOOS rate is 1% for
sample at 100% based on product specification
Page 23
© 2009, Genentech / Proprietary information – Please do not copy, distribute or use without prior written consent.
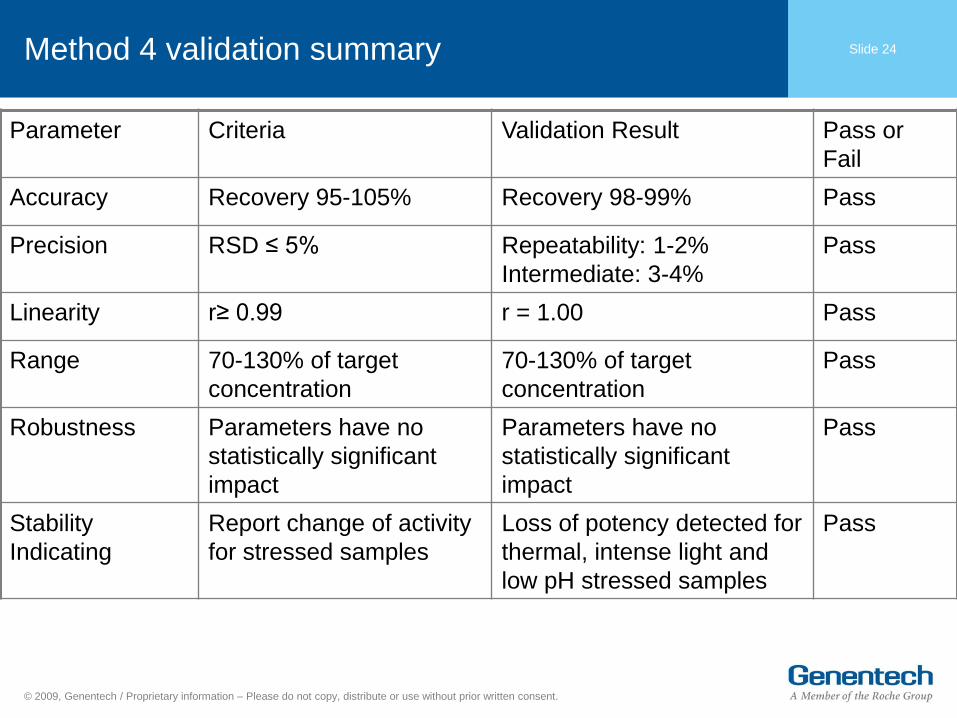
Slide 24 Method 4 validation summary
Parameter Criteria Validation Result Pass or
Fail
Accuracy Recovery 95-105% Recovery 98-99% Pass
Precision RSD ≤ 5% Repeatability: 1-2%
Intermediate: 3-4%
Pass
Linearity r≥ 0.99 r = 1.00 Pass
Range 70-130% of target
concentration
70-130% of target
concentration
Pass
Robustness Parameters have no
statistically significant
impact
Parameters have no
statistically significant
impact
Pass
Stability
Indicating
Report change of activity
for stressed samples
Loss of potency detected for
thermal, intense light and
low pH stressed samples
Pass
© 2009, Genentech / Proprietary information – Please do not copy, distribute or use without prior written consent.
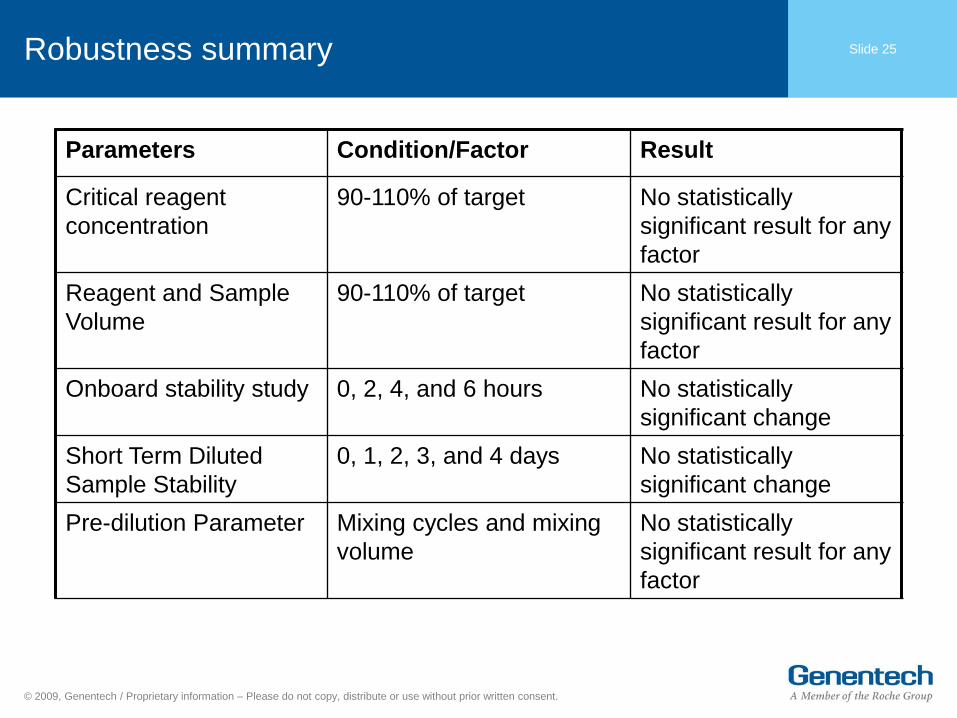
Slide 25 Robustness summary
© 2009, Genentech / Proprietary information – Please do not copy, distribute or use without prior written consent.
Parameters Condition/Factor Result
Critical reagent
concentration
90-110% of target No statistically
significant result for any
factor
Reagent and Sample
Volume
90-110% of target No statistically
significant result for any
factor
Onboard stability study 0, 2, 4, and 6 hours No statistically
significant change
Short Term Diluted
Sample Stability
0, 1, 2, 3, and 4 days No statistically
significant change
Pre-dilution Parameter Mixing cycles and mixing
volume
No statistically
significant result for any
factor
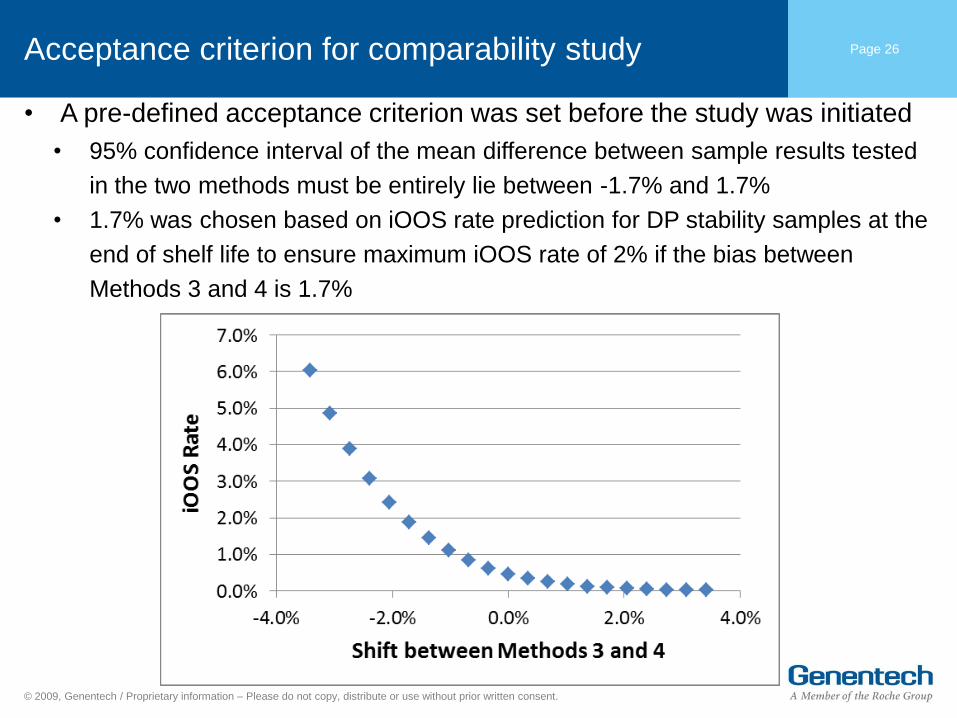
Acceptance criterion for comparability study Page 26
© 2009, Genentech / Proprietary information – Please do not copy, distribute or use without prior written consent.
• A pre-defined acceptance criterion was set before the study was initiated
• 95% confidence interval of the mean difference between sample results tested
in the two methods must be entirely lie between -1.7% and 1.7%
• 1.7% was chosen based on iOOS rate prediction for DP stability samples at the
end of shelf life to ensure maximum iOOS rate of 2% if the bias between
Methods 3 and 4 is 1.7%
Design of comparability study Page 27
© 2009, Genentech / Proprietary information – Please do not copy, distribute or use without prior written consent.
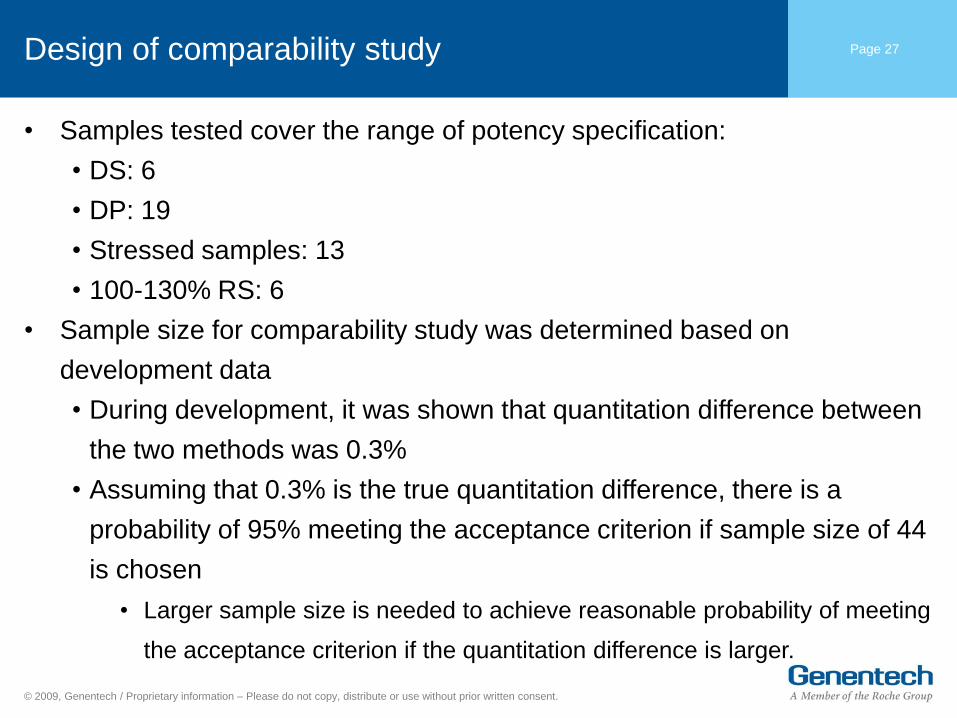
• Samples tested cover the range of potency specification:
• DS: 6
• DP: 19
• Stressed samples: 13
• 100-130% RS: 6
• Sample size for comparability study was determined based on
development data
• During development, it was shown that quantitation difference between
the two methods was 0.3%
• Assuming that 0.3% is the true quantitation difference, there is a
probability of 95% meeting the acceptance criterion if sample size of 44
is chosen
• Larger sample size is needed to achieve reasonable probability of meeting
the acceptance criterion if the quantitation difference is larger.
Method comparability results
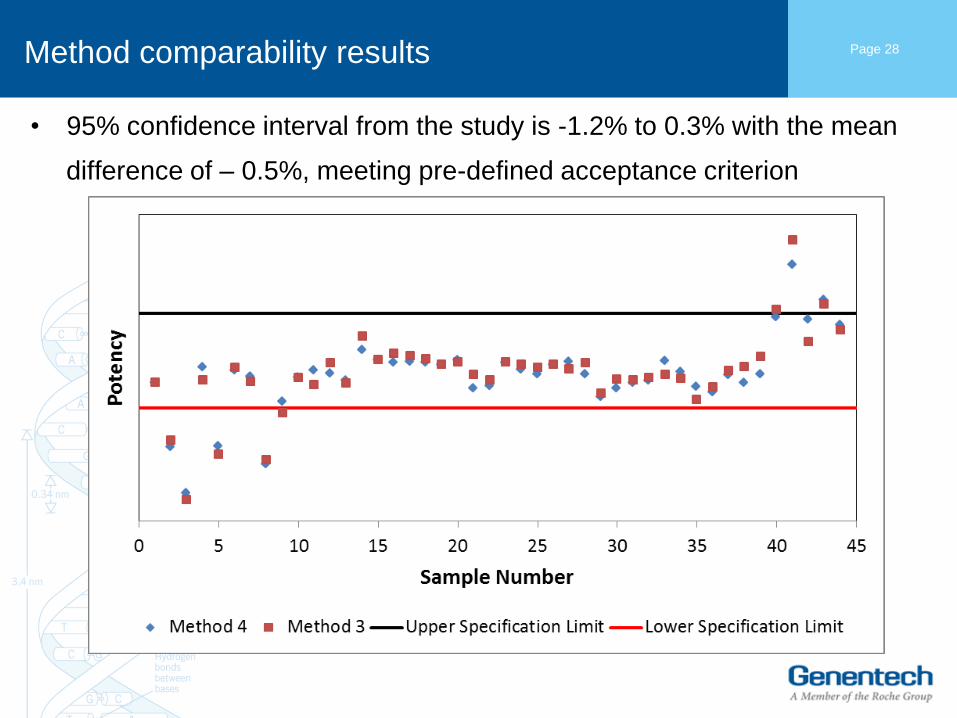
• 95% confidence interval from the study is -1.2% to 0.3% with the mean
difference of – 0.5%, meeting pre-defined acceptance criterion
Page 28
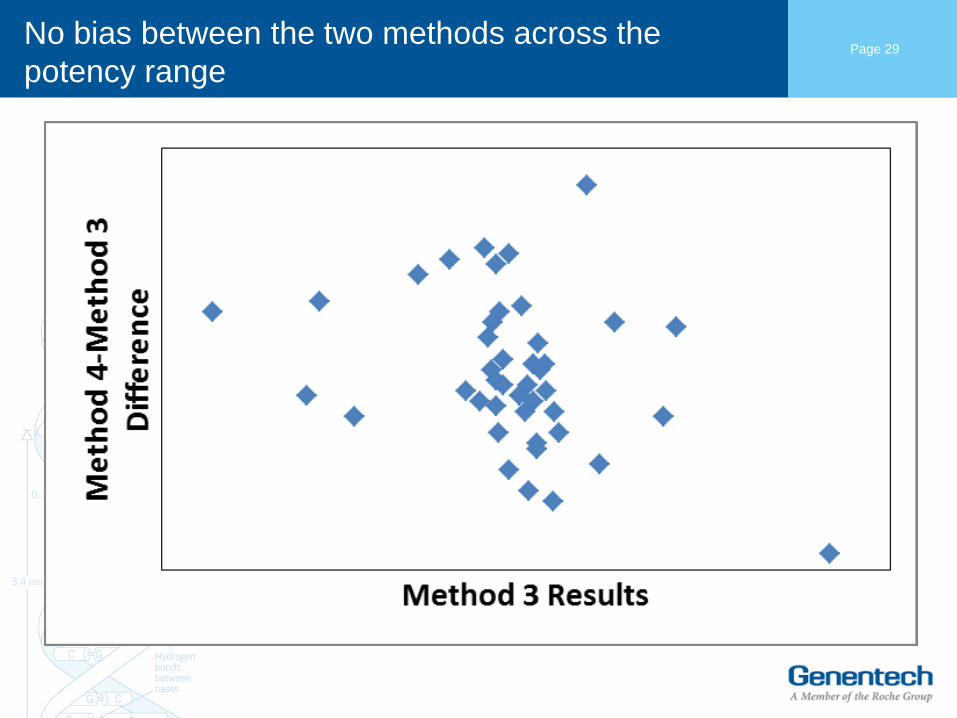
No bias between the two methods across the
potency range
Page 29
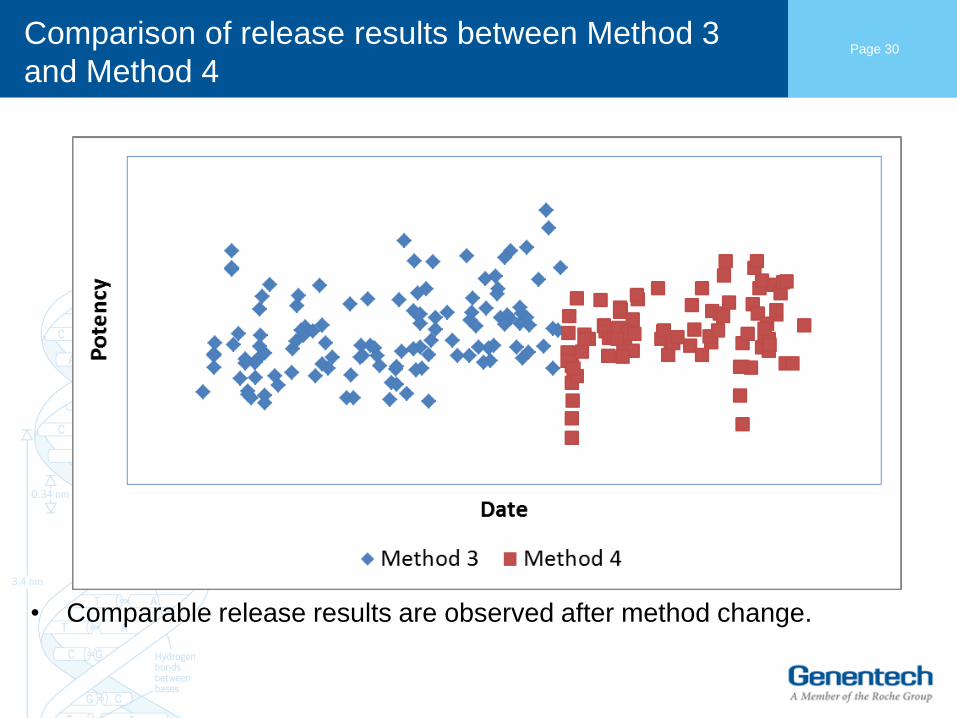
Comparison of release results between Method 3
and Method 4
Page 30
• Comparable release results are observed after method change.

Lessons Learned – Post-approval Changes to Potency Assays
• BLA approval defines both method + acceptance criterion = specification
– Method change needs to fit into the acceptance criterion
• Criticality of post-approval changes to method must be thoroughly assessed:
• Technical:
• scope of work
• prevention of assay drift over time
• Regulatory:
• filing category
• Method validation:
• frequently insufficient to demonstrate alone suitability of use:
• confirmatory: method parameters are met (e.g. precision, accuracy)
• Precision and accuracy criteria set relative to specification
• must often be complemented by method comparability study:
• confirmatory: new method no drift no higher risk to OOS
Page 31

Lessons Learned – Post-approval Changes to Potency Assays
• Method comparability new method versus current method:
• Quantitative: must be well-designed to be adequately statistically powered :
• method precision + accuracy width of release/ stability criterion
• comparability criterion
• sample size
• sample set
• Qualitative: stability indicating properties – stressed sample panel
• The product lifecycle can span decades
• Multiple different changes will occur to the method during the life of the product:
• several small changes risk of big change
• each individual change has to be assessed in overall context
• Maintain the same lot of control for a long period is beneficial for monitoring the
impacts of changes to the assay
• Disconnect assay and ref standard changes from control lot replacement
Page 32
Page 33
© 2009, Genentech / Proprietary information – Please do not copy, distribute or use without prior written consent.
Acknowledgments
Ai Shih
Ariel Margulis
Lichun Huang
Marcel Zocher
Emma Ramnarine
Joseph Marhoul

Doing now what patients need next