life cycle of hake and likely management implications · research paper life cycle of hake and...
TRANSCRIPT

RESEARCH PAPER
Life cycle of hake and likely management implications
Tore Strømme . Marek R. Lipinski .
Paulus Kainge
Received: 13 February 2015 / Accepted: 1 December 2015 / Published online: 12 December 2015
� The Author(s) 2015. This article is published with open access at Springerlink.com
Abstract Despite its economic and social impor-
tance for Namibia and South Africa, limited docu-
mented information exists regarding key aspects of the
biology of deep-water hake, including its life cycle.
This study utilizes data collected through the demersal
surveys of the R/V Dr Fridtjof Nansen in South Africa
and F/V Blue Sea 1 in Namibia to describe the
migratory patterns of deep-water hake in space and
time. Furthermore the study investigates aspects of the
life cycle of this important species in the Benguela
region. Results show that deep-water hake spawns
between the western Agulhas Bank and Elands Bay in
South Africa with the main nursery ground between
Hondeklip Bay and the northern tip of Orange Banks.
Deep-water hake in Namibia (up to the Kunene River)
and along the south coast of South Africa (eastwards to
Port Alfred) originate from these grounds, and under-
take long-range migrations across latitudes and longi-
tudes, respectively. This hypothesis is supported by
the finding that spawning has not been observed in
Namibia and there are no small juveniles along the
South African south coast from the eastern border of
the Agulhas Bank. The proposed pattern implies an
interconnection between the Namibian and the South
African components of the stock and the consequent
need for a revision of the present management regime
based on the assumption of stocks confined within the
respective national jurisdictions. This study has used
length frequency distributions in space and time in
order to investigate the life cycle, in terms of origin,
movement and population structure in particular, an
approach that may also be useful for other widely
distributed species.
Keywords Hake � Life cycle � Migrations � Sharedstock � Transboundary management
Introduction
The Cape hake (Merluccius capensis Castelnau, 1861)
and the deep water hake (DWH,M. paradoxus Franca,
1960) have been among the most valuable fishery
resources in the Benguela region of Africa since the
1950s, with annual catches that have reached peaks of
800,000 tonnes in the early 1970s. At present, hake
T. Strømme
Institute of Marine Research, P.O.Box 1870, 5817 Bergen,
Norway
e-mail: [email protected]
M. R. Lipinski (&)
Department of Ichthyology and Fisheries Science, Rhodes
University, P.O. Box 94, 6140 Grahamstown, South
Africa
e-mail: [email protected];
P. Kainge
National Marine Information and Research Centre,
Ministry of Fisheries and Marine Resources,
P O Box 912, Swakopmund, Namibia
e-mail: [email protected]
123
Rev Fish Biol Fisheries (2016) 26:235–248
DOI 10.1007/s11160-015-9415-9

sustains fisheries in Namibia and South Africa worth
$570 million (Kobus de Swart 2012; Department of
Agriculture, Forestry and Fisheries, South Africa
internal report; C.J. Augustyn from the same Depart-
ment, pers. comm.). Management of these species has
been regulated by the International Commission for
the South-East Atlantic Fisheries (ICSEAF; Payne and
Punt 1995) prior to Namibia’s independence in 1990
and the declaration of its Exclusive Economic Zone
(EEZ) in the same year. Following independence,
Namibia has taken full responsibility for managing the
resources within its EEZ and management of the
fisheries in both countries is under the assumption of
national and discrete stocks for both species. However,
while present knowledge indicates that Cape hake
includes stocks largely confined within the respective
national jurisdictions (Gordoa et al. 1995; Payne and
Punt 1995), the situation appears to be less clear for the
deep water hake. The traditional view, as reflected in
present management practices, is that DWH is not a
shared stock. Regular transboundary research surveys
could provide an answer to this question, and the
Benguela Current Commission (BCC) has directed a
lot of its research efforts to clarify this issue. The
present study is part of this work.
Sustainable management of shared stocks requires
negotiated and cooperative agreements between the
countries concerned, as enshrined in the United
Nations Convention on the Law of the Sea
(UNCLOS). It is therefore essential to clarify the
status of DWH off Namibia and South Africa as the
basis for developing appropriate management
schemes.
Hilborn and Walters (1992, p. 170) strongly
advocate that research surveys for assessment pur-
poses should be conducted over the whole geographic
range of the stock. However, based on the assumption
of discreet DWH stocks in Namibia and South Africa,
national surveys have covered only a fraction of the
distributional range of the species. A study carried out
by the United Nations Development Programme
(UNDP) in support of the BCMLE programme
(UNDP, undated, internal report) concluded that a
major issue in the management of hake in the
Benguela region was the lack of transboundary
surveys. Considering the results of this study, it was
one of the main objectives of the Benguela Environ-
ment Fisheries Interaction and Training Programme
(BENEFIT) and the Benguela Current Large Marine
Ecosystem (BCLME) programme to bring a regional
perspective into DWH research (e.g. Armstrong and
Sumaila 2004). Under the auspices of these pro-
grammes, synoptic surveys covering most of the
distribution range of DWH were carried out in the
period 2000–2012 with the RVDr Fridtjof Nansen and
intercalibrated vessels with identical survey design,
rigging and sampling procedures.
Here, qualitative characteristics of some life stages
are combined with their quantitative distributions of
abundance by length classes as a proxy for age. The
consistency in distribution patterns is analyzed by
comparing annual surveys over a 9-year period. These
surveys, and the resulting time series, are designed for
a possible future shared stock assessment. Tradition-
ally, hake research in southern African waters
(1920–1999) has been intense but selective, leaving
several research topics poorly addressed, such as those
related to the early life cycle (eggs and larvae and their
species identity), spawning location and time, distri-
bution and abundance of various life stages, possible
migrations and stock structure, and response to
biological and environmental forcing. Research linked
to the R/V Dr Fridtjof Nansen and the Nansen
Programme,1 as part of BENEFIT and in cooperation
with the BCLME programme has over years addressed
several of these topics (von der Heyden et al. 2007a, b,
2010; Stenevik et al. 2008; Field et al. 2008; Grote
et al. 2007, 2012a, b). The collected results indicate
that the traditional view on M. paradoxus general life
cycle scheme needs revision. Established views sug-
gest a largely stationary metapopulation with some
local inshore-offshore movement, year-round spawn-
ing with minor seasonal peaks and weak patterns of
geographical hot-spots (Payne and Punt 1995). How-
ever, it was suggested (Le Clus et al. 2005a) that this
picture may be inadequate, largely due to sampling
limitations.
In describing the results, the ‘‘life cycle’’ concept
sensu lato is used. The life cycle concept, in contrast to
life history (Hutchings 2002), deals simply with
common characteristics of subsequent generations
passing through life stages, following a geographical
and ecological track. In contrast, life history studies
deal more with the genetic track of subsequent
generations and therefore often use molecular biology
1 Development and cooperation programme in fisheries, funded
by Norway.
236 Rev Fish Biol Fisheries (2016) 26:235–248
123

techniques to explore life history strategies. ‘‘Life
cycle’’ concept is applied in the scientific literature as
the sequence of descriptions of developmental/growth
stages, or a general outline of critical turns in the fish
life, from egg via nursery and feeding grounds to
spawning. The latter is used in modelling studies, and
it is also used here.
The first aim of the present paper is to investigate
the migratory patterns of DWH as derived from the
geographic distribution of size classes for a 9 year
period, monitored at the beginning of each year
(January–February). The second aim is to link the new
insights with existing knowledge in order to assess to
what extent DWH is a shared stock between Namibia
and South Africa and if there are any interannual
dynamics in the pattern.
Materials and methods
Survey design and protocols
The surveys used in this study were planned to provide
a representative and synoptic sampling of the hake
stocks in Namibia and South Africa. Survey design,
gears, timing of the surveys and their geographic
coverage were adjusted accordingly. However, cov-
erage of the species’ full distribution range, from Port
Alfred on the South Africa south coast, to Kunene
river mouth in northern Namibia proved particularly
difficult. Only in 1 year (2010) full coverage was
possible (Fig. 1). In all other years (2003 and
2005–2012) coverage was limited to the area between
Cape Agulhas and the Kunene river mouth. The
surveys involved two research vessels: one trawler (F/
V Blue Sea 1) in Namibian waters from the Orange
River mouth to Kunene, and the R/V Dr Fridtjof
Nansen that conducted surveys in South African
waters. The surveys in Namibian waters are part of
the national annual monitoring of the demersal stocks
with January–February identified as the appropriate
time of the year for monitoring (Sætersdal et al. 1999),
mainly for logistical reasons, i.e. most effective
sampling in the prevailing weather conditions. Hence
transboundary studies are limited to this season. This
choice does not affect results of this study because the
array of length frequencies will obey a set of rules
spelled out in tested hypotheses (see below) in any
period of the year.
Hake research in South Africa conducted by the R/V
Dr Fridtjof Nansen from 2000 onwards addressed a wide
array of topics. The data analyzed in this study includes
those collected during surveys in 2003, and 2005–2012.
Year 2004 was not used in the reported analysis because
the geographical coverage was incomplete.
In all these surveys, the methodology applied by the
two research vessels was standardized and constant
over time. A Gisund Super shrimp cum-fish trawl, was
used in the surveys by both ships. A description of the
trawl and gear is given in Sætersdal et al. 1999. Both
vessels used a 20 m strapping on the warps 50 m in
front of the doors to keep the door and wingspread
constant at 50 and 21 m respectively, independent of
trawl depth.
A standard haul was 30 min at three knots,
sometimes reduced to 20 min in areas of expected
high densities. The exact time for start and stop of the
trawl operation was determined by SCANMAR sen-
sors. The output from the SCANMAR systemwas also
recorded to facilitate later analysis of bottom contact
and door-spread if necessary.
For conversion of catch rates (kg/h) to fish densities
(t/NM2), the effective fishing area was considered as
the product of the linear mouth opening (18.5 m) and
the haul length, at a distance over the bottom, based on
GPS readings. The area swept for each haul was thus
18.5 m times the distance trawled, converted to NM2.
The catchability coefficient (q), i.e. the fraction of the
fish encountered by the trawl that was actually caught,
was conservatively assumed equal to 1, to allow
comparison with previous results.
The survey design is based on transect sampling
transversal to the coast with 20 NM distance between
transects. Stations are semi-randomly allocated along
transect with a distance of 10–15 NM and at least at
each 100 m depth interval, with random position
inside the interval.
For all valid trawl hauls, either the whole trawl
catch was sorted and all species were recorded with
their weight and numbers, or a subsample was taken if
very small animals were caught or catch was very
large. Generally, subsampling was avoided as far as
possible. Length measurements (total length) were
taken for target species. The length of each fish was
recorded to the nearest 1 cm below. All samples of
small hake were checked for species identity by a
vertebrae count (usually 3–5 fish were examined in
each sample). This method was independently verified
Rev Fish Biol Fisheries (2016) 26:235–248 237
123

by genetic screening (Matthee and Gopal 2004
unpublished report of the University of Stellenbosch
South Africa; Matthee, pers. comm.). An electronic
measuring board was used for length measurements,
main sample weights were recorded by Scanvaegt
electronic balances and a Marel weight was used for
single fish and small species measurements.
Compatibility of the South African and Namibian
surveys
The bottom trawl survey time series started in Namibia
with the R/V Dr Fridtjof Nansen in 1990 was taken
over by commercial trawlers in 2000. An intercali-
bration study between the R/V Dr Fridtjof Nansen and
these trawlers has shown nearly identical results with
respect to total catch rates of the hakes (Strømme and
Iilende 2001). Recently, Axelsen and Johnsen (2015),
have further analysed the length frequency distribu-
tions from these intercalibrations and found a slight
positive bias in regard to the catchability of larger fish
in the commercial vessels. This bias is not expected to
affect the results of this study.
Biological sampling
Both hake species were sampled for sex, maturity
stage, gonad weight and stomach content. The matu-
rity scale used (e.g. Botha 1986) was the one adopted
by former Sea Fisheries Research Institute, Cape
Fig. 1 Position of the trawl
stations during the
transboundary surveys off
Namibia and South Africa in
2010. Border between
Namibia and South Africa is
indicated by the straight line
238 Rev Fish Biol Fisheries (2016) 26:235–248
123
Town (immature, active, ripe, ripe and running, spent,
inactive). The maturation process and maturity of hake
is the subject of a separate study (Jansen et al. 2015),
and stomach content data is also not presented here.
Total hake biomass in Namibia and South Africa
was calculated by post-stratifying fish densities, i.e.
contouring areas with similar density ranges, calcu-
lating mean densities and biomass by multiplying
these with the corresponding size of the distribution
area. The point estimate at each trawl station was
combined with length frequency samples taken at the
same station to provide biomass (weight) and abun-
dance (number) by length classes (1 cm resolution).
From the same data, maps of 5 cm classes were
produced for the whole survey area to show the overall
distribution by length class. To calculate spatial
biomass centroids and percentiles, a second biomass
calculation method was applied. Here each sample
point was converted to a local biomass sample as a
product of the sample point density and the represen-
tative area for the station. Representative areas are
calculated using triangulation and Thiessen polygons
where the weight of each station is halfway to the
neighbouring stations. This method also automatically
compensates for variation in sampling density. The
second biomass method is also used to assess biomass
distribution by variables such as latitude and depth and
can be applied to the full species sample or to each
length class separately. Triangulation allows for easy
calculations by computer and is free of subjectivity
associated with post stratification and contouring.
Method of addressing aims of the study
The working hypotheses for this study are that (1) if
spawning of DWH takes place both along the Namib-
ian and the South African coasts, both adults and
juveniles would be found in the respective areas. In
this case, sub-stocks spawning locally and with limited
active long range migration would have size distribu-
tions with all size classes in the distribution area of the
stock with a local depth-based size gradient (Payne
and Punt 1995). The length composition would mainly
reflect natural and fishing mortality. Alternatively, (2)
if spawning is located in one or a few well-defined
sites with subsequent dispersal and/or long range
migration, differentiated size profiles should be found
along the distribution range. Consequently, if adults
were present, but juveniles missing locally, this would
be taken as a sign that the former must have migrated
in from an external nursery ground.
Miscellaneous points
The analysis of geographic distribution by length
groups may be affected by possible differences in
natural and fishing mortalities of these groups along
the coast. However, it is considered unlikely that
natural or fishing mortality can completely deplete a
whole length class locally. When maps show conti-
nuity in distributions along the coast and with clear
limits, these are assumed to be the distribution limits.
Fish growth and mortality are analyzed by using
compounded length distributions at country and stock
level. Direct use of length frequencies was preferred to
conversion into age-groups, given the technical chal-
lenge associated with it in the case of the hake
(Wilhelm 2012; de Pontual et al. 2006).
All available data represent snapshots of the
January–February distribution of the different size
classes and are used to infer their migratory history.
While there could be seasonal patterns in the migration
of one or more size groups, the approach used should
be able to detect changes in distribution and thus
reflect the interclass movement of length classes,
obviously mainly related to age in the life cycle.
The combination of a systematic sampling design
(transects with fixed inter-transect distance) and a
semi-random position of the sampling stations is
optimal for mapping distributions. Furthermore, it
allows a construction of sequence snapshots in space
related to distribution and likewise in time-scale
related to patterns of dispersion/migration (Gunderson
1993, pp. 15–16).
The present paper has used and quoted a high
number of unpublished reports and data, in part to also
acknowledge previous work and discussion about the
migratory cycle. They are available upon request from
the authors.
Results
Species signature over space and time
Figure 2 shows the distribution limits of 5-cm length
classes of DWH overlaid with 5–35 cm length classes
(referred to as the expanding phase), while Fig. 3
Rev Fish Biol Fisheries (2016) 26:235–248 239
123

shows intermediate lengths (40–55 cm), referred to as
the settling phase, where the fish is distributed
throughout its geographical range and overlaid with
the contraction phase (65–75 cm). These figures are
based on the results from the survey in 2010, when the
full distribution range of the DWH stock was covered.
The similarity between the South Africa south coast
and Central/Northern Namibia is notable. Absence of
small fish (less than 15 cm) in both regions is striking.
These regions are both characterized by concentra-
tions of hake in the size range 40–55 cm. From these
areas, hake probably returns to its spawning grounds.
A notable exception is in the east, between Port
Elizabeth and Port Alfred in the depth of 300–500 m,
where large fish remain in a small enclave, perhaps
indicating a small sub-stock that also spawns there.
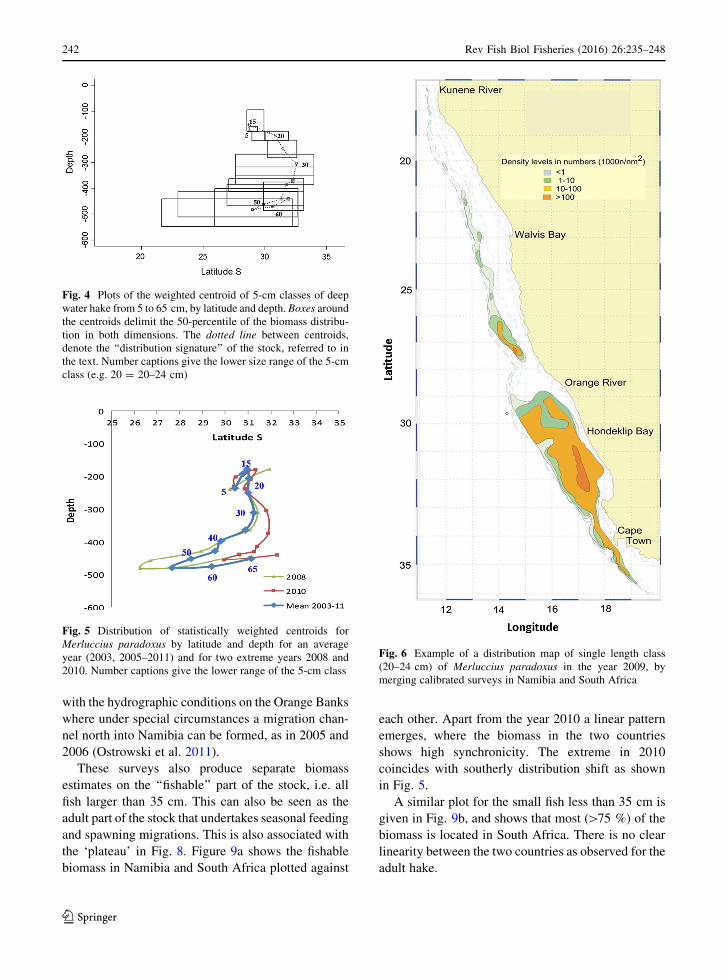
Figure 4 shows the distribution pattern as derived
from the survey in 2005, depicting the centroid for the
5 cm size classes, from 5 to 65 cm. Following the
centroid through the size classes, a pattern emerges
which could be interpreted as the ‘‘distribution signa-
ture’’ of the stock if consistent through the years, at
least for the investigated period (January–February).
Figure 5 shows the mean situation for the surveys in
2003 and 2005–2011, and the two extreme situations
in 2008 and 2010, the most northern and southern
distribution, respectively. By following the movement
of the centroid, a consistent picture emerges. The
smallest fish tends to move inshore up to the size of
15 cm, then more south and deeper, until 30 cm, from
where they start to move north while continuing going
deeper. From 55 cm the fish tends to have a more
Fig. 2 Transboundary
distribution of Merluccius
paradoxus in January–
February 2010 by size
classes. The smaller fish are
overlaid on the bigger fish,
demonstrating expansion
from a central area
(Saldanha–Hondeklip Bay)
240 Rev Fish Biol Fisheries (2016) 26:235–248
123

southern distribution and with a slight tendency to go
shallower. The extreme years show that the general
pattern holds but that there is a latitudinal shift for the
size range beyond 25 cm.
Comparison of stock dynamics between Namibia
and South Africa
The data collected through the hake surveys provide
estimates of biomass in weight and in numbers by
length classes (cm) for South Africa and Namibia
separately and combined. An example of the distribu-
tion pattern of biomass for length group 20–24 cm is
shown in Fig. 6. The biomass results are also compiled
into diagrams showing the share of each length class
by country. An example from 2012 is shown in Fig. 7,
showing an increasing share of biomass in Namibia
with increasing length in the range 15–35 cm, from
where it gradually recedes until 60 cm from where
practically all fish is found in South Africa only.
Figure 8 shows the inter-annual variability in biomass
between the countries for eight annual surveys
2005–2012. The overall split between countries is
seen to vary between years, but the general pattern of
increased share in Namibia in the length range 15–35
is consistent as also is the sharp decline from the
55 cm group onwards. The arithmetic mean for all the
surveys shows a plateau from 35 to 55 cm where the
Namibian share varies but is close to 0.4. The presence
of young fish smaller than 15 cm shows a high
variability between years with 2 years (2005 and
2006) showing a high presence of juveniles in
Namibia, while in most years their presence is very
low or they are absent. This dynamics are associated
Fig. 3 Transboundary
distribution of adult
Merluccius paradoxus
(40–55, 65 and 75 cm) in
January–February 2010.
The bigger fish are overlaid
on the smaller,
demonstrating retraction
from peripheral feeding
grounds to the central core
area
Rev Fish Biol Fisheries (2016) 26:235–248 241
123
with the hydrographic conditions on the Orange Banks
where under special circumstances a migration chan-
nel north into Namibia can be formed, as in 2005 and
2006 (Ostrowski et al. 2011).
These surveys also produce separate biomass
estimates on the ‘‘fishable’’ part of the stock, i.e. all
fish larger than 35 cm. This can also be seen as the
adult part of the stock that undertakes seasonal feeding
and spawning migrations. This is also associated with
the ‘plateau’ in Fig. 8. Figure 9a shows the fishable
biomass in Namibia and South Africa plotted against
each other. Apart from the year 2010 a linear pattern
emerges, where the biomass in the two countries
shows high synchronicity. The extreme in 2010
coincides with southerly distribution shift as shown
in Fig. 5.
A similar plot for the small fish less than 35 cm is
given in Fig. 9b, and shows that most ([75 %) of the
biomass is located in South Africa. There is no clear
linearity between the two countries as observed for the
adult hake.
Fig. 4 Plots of the weighted centroid of 5-cm classes of deep
water hake from 5 to 65 cm, by latitude and depth. Boxes around
the centroids delimit the 50-percentile of the biomass distribu-
tion in both dimensions. The dotted line between centroids,
denote the ‘‘distribution signature’’ of the stock, referred to in
the text. Number captions give the lower size range of the 5-cm
class (e.g. 20 = 20–24 cm)
Fig. 5 Distribution of statistically weighted centroids for
Merluccius paradoxus by latitude and depth for an average
year (2003, 2005–2011) and for two extreme years 2008 and
2010. Number captions give the lower range of the 5-cm class
Fig. 6 Example of a distribution map of single length class
(20–24 cm) of Merluccius paradoxus in the year 2009, by
merging calibrated surveys in Namibia and South Africa
242 Rev Fish Biol Fisheries (2016) 26:235–248
123

Discussion
Previous accounts of M. paradoxus biology and life
cycle have stressed a relatively sedentary mode of life
for this species. In particular, reasonably dispersed
spawning and nursery areas throughout their distribu-
tional range as well as no (or limited) alongshore
migrations were assumed. In stark contrast, our
research provides documentation of a single well-
defined spawning ground, a key well-defined nursery
ground and alongshore movements of adult fish
stretching hundreds of miles. These migrations, espe-
cially across national borders, may have profound
implications for resource management of one of the
most important fisheries in southern Africa.
Conceptual outline of pattern in geographic size
distribution as a proxy for age classes
of Merluccius paradoxus
Spawning, larvae and juveniles
Off Namibia, Kainge et al. (2007) found no evidence
of spawning forM. paradoxus, based on a combination
of histological examinations and of the gonadosomatic
index (GSI). Spawning of DWH based on analysis of
maturity stages is not adequately documented in the
existing literature. There is substantial material avail-
able from South Africa and Namibia, based on the
biological analyses completed on data from the
demersal surveys and the commercial trawlers. This
material needs to be critically reviewed and analyzed,
although its significance may be somewhat limited by
0
20
40
60
80
100
0 10 20 30 40 50 60 70 80 90 100
% s
hare
Sou
th A
frica
Length (cm)
NamibiaS. Africa
Fig. 7 Namibian and South African shares of biomass in
numbers of Merluccius paradoxus individuals by 1-cm length
classes in 2012
0
0.1
0.2
0.3
0.4
0.5
0.6
0.7
0.8
0.9
1
0 20 40 60 80
Nam
ibia
n sh
are
size class (5cm,lower limit)
2005
2006
2007
2008
2009
2010
2011
2012
Mean
Fig. 8 Time series of Namibian share ofMerluccius paradoxus
biomass based on the surveys in the years 2005–2012, and
arithmetic mean for all these years. The lowest and highest
estimates are in 2010 and 2012, respectively
0
50
100
150
200
0 50 100 150 200
Sout
h Af
rica
(tho
usan
d to
nnes
)
2003
20122010
2008
0
100
200
300
0 100 200 300
Namibia (thousand tonnes)
Sout
h Af
rica
(tho
usan
d to
nnes
)
20122008
2010
2006
(a)
(b)
Fig. 9 a Trends in biomass relationship between adult compo-
nent ([35 cm length) of Merluccius paradoxus stock in South
Africa and in Namibia based on the surveys in 2003 and
2005–2012. b Trends in biomass relationship between young
fish component of deep water hake in South Africa and in
Namibia based on the surveys in 2003 and 2005–2012
Rev Fish Biol Fisheries (2016) 26:235–248 243
123
methodological debate about validity and meaning of
morphological staging of the maturation process, as
fish in the running stage are scarce (Kainge 2002;
Kainge et al. 2007; Osborne 2004; Osborne and
Mullins 2005). For example all Dr Fridtjof Nansen
cruises since 2000 yielded a total of 20 individuals of
M. paradoxus in the running stage from approximately
6500 adult fish examined (Lipinski and Alvheim,
unpublished data). Previous research has been sum-
marized by Burmeister (2005). Further analysis of all
existing data, including material from Dr Fridtjof
Nansen is also being undertaken (Jansen et al. 2015).
However, taking into consideration methodological
difficulties and a scarcity of running fish, possibly
caused by inadequate sampling methods (Botha 1973;
Payne and Punt 1995), determining exactly where and
whenM. paradoxus is spawning seems doubtful using
morphological maturity indicators from the standard
biomass surveys alone.
Specially designed egg and larvae surveys of M.
paradoxus (subsequently identified genetically, Von
der Heyden et al. 2007a), developed by modeling their
possible transport and retention, are considered more
useful and the first steps in this direction have been
made (Stenevik et al. 2008; Grote et al. 2012b; Lett
et al. 2006; Garavelli et al. 2012). Despite the spatial
limitations of actual sampling (conducted, so far, only
between Cape Agulhas and Doring Bay, Fig. 1),
results of the modeling strongly suggest that the main
spawning grounds for DWH are located between
Agulhas Bank and St. Helena Bay (Garavelli et al.
2012) (Fig. 1). This suggestion is corroborated by
evidence from all Dr Fridtjof Nansen demersal surveys
concerning the distribution and abundance of early
juveniles (see below). The Cape Egg and Larval
Programme (CELP) records (Shelton 1986), indicat-
ing a year-round presence of hake larvae, is inconclu-
sive as larvae were not identified to species nor their
lengths measured and numbers per transect given.
Circumstantial evidence provided by Assorov and
Berenbeim (1983) that running fish were encountered
‘‘south of 22�S00 cannot be considered as evidence
because specific details were not presented. The
authors drew their conclusions from 398 individuals
collected over a period of 14 years.
Lack of evidence of early juveniles of M. para-
doxus (in contrast toM. capensis) on the south coast of
South Africa westward of Port Alfred (Le Clus et al.
2005a, b and pers. comm.; Fig. 2), seem to support Le
Clus et al. (2005a) conclusion that west coast spawn-
ing grounds supply south coast adults. In addition, it is
likely that these originate from main pelagic nursery
area between Hondeklip Bay and Orange Banks (since
other nurseries are erratic and small), necessitating
long-range migration southward and then eastward.
There is anecdotal evidence of M. paradoxus spawn-
ing offshore between Mossel Bay and Port Elizabeth
(Dave Japp, Capfish South Africa pers. comm.). This
could perhaps explain the small enclave of large fish
observed in the most eastern region (Fig. 3), but since
juveniles are completely missing in this area, one
possibility is that they may be located further east,
outside the survey area. However, the oceanographic
conditions there are not expected to be favorable for
young hake. Observations of adult DWH in the waters
of southern Mozambique confirms hake presence
there, however at very low densities (Oddgeir
Alvheim, pers.comm.).
Nursery grounds
Available data suggest that larvae of DWH drift
northwards (Grote et al. 2007; Stenevik et al. 2008;
Grote et al. 2012b; Lett et al. 2006; Garavelli et al.
2012). Their drift routes differ from that of M.
capensis (Stenevik et al. 2008; Garavelli et al. 2012).
Our data show consistent occurrence of small juve-
niles (2–15 cm) in great numbers in the area between
Hondeklip Bay and Orange Banks which strongly
indicates that this is the most important nursery for this
species (Fig. 2 for year 2010, Fig. 5 for interannual
variability). Most of the young fish are pelagic and
settle to the bottom at about 20 cm length, and can be
caught more representatively in the sampling trawl
(Sætersdal et al. 1999). Other small and intermittent
nurseries exist next to the main and only large
spawning area of M. paradoxus, i.e. between Agulhas
Bank and Elands Bay.
Further evidence of the main nursery location
comes from matching the timing of appearance of
juveniles with their back-calculated birth date. For
this, data provided by Grote et al. (2012a) were used
(Gompertz equation, Figs. 5 and 7 of Grote et al.
2012a). These results agree well with the quick growth
hypothesis by de Pontual et al. (2006) and modeling of
Drouineau et al. (2010), albeit for a different hake
species. According to the results of Grote et al.
(2012a), larvae and juveniles of the main length peaks
244 Rev Fish Biol Fisheries (2016) 26:235–248
123
of 100, 170 and 240 mm are all over 150 days old.
Current speed of 10 cm/s. resulted in a possible
movement of over 550 nautical miles which can be
easily covered in such time (M. Ostrowski, IMR
Bergen, pers. comm.). However, only about 400 miles
are necessary to cover the distance between Cape
Point and Panther Head-Orange River. Even the
youngest 60 day old juveniles will cover over
270 miles which would put their potential spawning
place just north of Cape Columbine. Stable near
bottom conditions over the relatively shallow (around
200 m) mid-shelf of the Orange Banks are likely to
provide favorable environment for the young stages of
the DWH (Ostrowski et al. 2011).
Recruits (20–35 cm); Adults ([35 cm)
From the central nursery area, M. paradoxus moves
north (into Namibia) and south and then east to the
south coast of South Africa. Migrations along the coast
start at the size of approximately 20 cm and at the size
of 35 cm up to 55 cm, 40 % of the west coast hake is
found in Namibia.
Transboundary stock relationships between South
Africa and Namibia
Analysis of length frequencies over 9 years point to a
migration of larger hake (over 35 cm) to Namibia and
over the size of 55 cm back to South Africa. The
absence of large-size fish in Namibia could perhaps
partly be explained by extensive fishing in the Luderitz
area by Namibian trawlers. However the complete
absence of DWH further north where fisheries are less
intensive, points to a biological reason for this.
Likewise, since there is no evidence of M. paradoxus
spawning in Namibia (Burmeister 2005; Kainge et al.
2007) and since there are no small juveniles north of
Orange Banks, one must assume that all fish of this
species in Namibia have migrated northwards from the
main nursery area off Hondeklip Bay-Orange Banks.
Namibian M. paradoxus is thus an adult extension of
the South African stock. This is further confirmed by
the magnitude of Namibian catches of this species.
Annual catch closely approaches the standing stock
biomass estimate, and in some years (e.g. 2005) far
exceeds it (Kirchner 2011) while the South African
catch is only 37 % of standing stock adult biomass
(Kirchner 2011). A regular and constant replenish-
ment from south is the most plausible explanation for
the sustained high exploitation rate in Namibian
waters that otherwise would deplete the stock.
The presence of deep water hake adults in Namibia
begs the question of where these fish spawn, i.e. do
they return to the main spawning grounds from as far
as the Skeleton Coast? Is this simply a part of the
spawning biomass with annual spawning migrations
or are they non-returning offshoots from a stock that is
in an expanded state? The absence of very large fish in
the region points to a southern return, at least when
they reach 60 cm, when they also seem to cease annual
long range migration. There is no reason to suspect
that natural or fishing mortality wipes out this group of
old fish completely. A large-scale tagging program of
the Namibian adult fish would certainly be helpful to
better understand the intra-annual migration in the
northern component, which is of high importance for
developing a future management strategy.
Prior to Independence in 1990, the fish stocks off
Namibia were heavily depleted through decades of
international fishing outside the 12 NM territorial
waters, and the hake stocks in the newly declared EEZ
were at their historical low (Sætersdal et al. 1999). The
Dr Fridtjof Nansen surveyed the Namibian shelf with
16 trawl surveys in the period 1990–1999 thus
initiating the Namibian time series of the demersal
stock abundance. At the start in 1990 the presence of
deep water hake in Namibia was remarkably low and
present only in the southern part. The biomass index of
the species was, for the first 2 years, only 25 thousand
tonnes, increasing to 170 thousand tonnes over
3 years. DWH was gradually expanding northward
and reached the coast off Kunene River in 1992
(Sætersdal et al. 1999). This constitutes additional
evidence that the DWH in Namibia is part of the South
African stock and possibly indicates that the stock
during the time of the transboundary surveys was in an
expanding phase.
Spatial and temporal life cycle of M. paradoxus
Data presented here confirm size-related depth distri-
bution of DWH (Le Clus et al. 2005a) and extend the
understanding of their geographic distribution. In
particular, because of fine-scale analysis of size
classes, a new understanding of fish distribution by
Rev Fish Biol Fisheries (2016) 26:235–248 245
123

sizes has been achieved. This study demonstrates that
the smallest and largest M. paradoxus occur only in
South Africa or around the border with Namibia (up to
a northern tip of the Orange Banks, which is in
Namibia): smallest in the main nursery area, and
largest close to and north of the main spawning
grounds, which corroborates the second working
hypothesis (see section ‘‘Materials and methods’’).
Abundance proportions demonstrate that the west
coast of South Africa provides the main habitat for this
species: both spawning and nursery grounds are found
there, and biomass/numbers in Namibia and along the
south coast are of an order of magnitude smaller than
on the west coast of South Africa. Spread of length
classes along the west coast suggests long-range
migration from the nursery area.
Le Clus et al. 2005a (and pers. comm.) have
interpreted their data as supporting onemain spawning
ground and one nursery area for M. paradoxus in
South Africa. They also report that juveniles of DWH
are generally absent along the south coast. Those
findings are consistent with those presented in this
study. New evidence presented here suggests that most
DWH on the south coast originate from the main
nursery area between northern St. Helena Bay and
Orange Banks. This implies a major migration of
DWHwhich leaves this nursery on its way north (up to
the Skeleton Coast in Namibia) and on its way south
and then east (up to Port Alfred). There is however
small local component of large fish offshore between
Mossel Bay and Port Elizabeth.
There is evidence that although the relative distri-
bution of various size classes along the coast may
vary, patterns stay the same. The ratio of adult biomass
between the countries is remarkably stable and
increases and decreases are, with a few exceptions,
synchronic. In contrast, the rather stable ratios of adult
biomass may show sudden anomalies interpreted as a
shift in biomass induced by changes in the normal
migration between the two countries; 2010 was such
an anomalous year. There was a considerable and
sudden increase in theM. paradoxus biomass in South
Africa corresponding to a sudden biomass decrease in
Namibian waters (see also Kirchner 2011). In
2011–2012 the situation returned to normal. It is as
yet unknown what triggered the geographic shift in
biomass, but it was potentially due to environmental
forcing. The anomaly also demonstrates the impor-
tance of continuous collection of transboundary time
series data. A 1 year anomaly in biomass estimates
due to geographical shifts could trigger alarms in
national stock assessment models if information on the
whole population/stock is not taken into account. On
the other hand, a synoptic view of the stock would
provide more accurate information on its actual state.
Anomalies in the distribution could be part of the
natural variability in the ecosystem, but could also be
the result of more permanent changes of variability
due to longer term changes in environmental param-
eters associated with climate change. It is therefore of
high importance to further explore what mechanisms
are triggering the geographical shifts in distribution.
Management considerations
The life cycle analysis presented in this paper clearly
demonstrates that M. paradoxus is a transboundary
species and should therefore be considered a shared
resource between Namibia and South Africa. Spawn-
ing takes place in South Africa which is also the habitat
for larvae and juveniles. Young fish move gradually to
Namibia and to the South African south coast in
extensive feeding migrations. This model supports the
single stock hypothesis (Anon. 2006). This study
results in a simple life cycle model, with a single main
spawning area and a single main nursery area, and
large-scale feeding and spawning migrations across
the distribution range. The hypothesis of large-scale
migrations was put forward early on (e.g. Roux 1949)
and then refuted (Payne and Punt 1995) on the grounds
that early works did not differentiate between the two
species of hake. Hake migrations worldwide are not
well investigated, but are reported in a few cases (e.g.
Grinols and Tillman 1970; Nelson and Larkins 1970).
The present study demonstrates the shared nature of
the DWH population off southwest Africa and
provides some of the information needed for shared
stock management. While it seems clear that Merluc-
cius paradoxus does not spawn in Namibia; the extent
to which large fish found in Namibia migrate back to
South Africa for spawning is not confirmed. There are
two possible scenarios: first, most of these fish return
annually to spawning grounds in South Africa; or
second, most of these fish are biologically lost for hake
reproductive effort (i.e. do not return for spawning).
The size related distribution maps strongly indicate
that the large fish eventually return but the fre-
quency and strength of the migration still needs to be
246 Rev Fish Biol Fisheries (2016) 26:235–248
123

demonstrated. This is one of the fundamental man-
agement-related questions for this species requiring
increased research efforts, involving tagging and
large-scale biological sampling for hake condition
and maturity, especially in southern Namibia. Like-
wise, movement of adults of both hake species should
be studied in detail, even inside national borders.
Recognizing the ecological differences between the
two hake species, the implications of the current
approach of combining the two into a single stock
assessment model should also be further investigated.
This may be a challenging task since fisheries catch
records do not differentiate between the two species
and the present split of the catch based on the depth in
which hakes are caught are not completely satisfac-
tory. This difficulty puts more emphasis on the
importance of independent synoptic surveys.
Finally, it is highly recommended that the present
management regime, based on the assumption of
stocks confined within the respective national juris-
dictions and combined in single assessments, is
thoroughly evaluated.
Acknowledgments The authors wish to thank the technical
staff that participated in the scientific surveys on board the R/V
Dr F. Nansen and the F/V Blue Sea 1 for their hard work in
collecting and organizing the data on which this study is based.
In particular, Oddgeir Alvheim (IMR) is thanked for his
invaluable support throughout all stages of preparation of this
paper, especially with regards to the preparation of data and
figures. The authors would also like to thank colleagues in
Namibia and South Africa for sharing their knowledge and
insights on various aspects of the biology of hake in the region.
Malgosia Lipinska (University of Cape Town), two anonymous
referees critically reviewed the manuscript. Finally the authors
wish to thank the BENEFIT and the BCLME Programmes as
well as the Benguela Current Commission for their support of
this research work.
Open Access This article is distributed under the terms of the
Creative Commons Attribution 4.0 International License (http://
creativecommons.org/licenses/by/4.0/), which permits unre-
stricted use, distribution, and reproduction in any medium,
provided you give appropriate credit to the original
author(s) and the source, provide a link to the Creative Com-
mons license, and indicate if changes were made.
References
Anon (2006) Agreed report of the joint hake research planning
workshop (Namibia and South Africa). BENEFIT/BCLME
Cape Town 9–12 May 2006
Armstrong CW, Sumaila UR (2004) The Namibian—South
African hake fishery: costs of non-cooperative manage-
ment. In: Sumaila UR, Buyer D, Skogen MD, Steinshamn
SI (eds) Namibia’s fisheries: ecological, economic and
social aspects. Eburon, Delft, The Netherlands, pp 231–243
Assorov VV, Berenbeim DY (1983) Spawning grounds and
cycles of Cape hakes in the Southeast Atlantic. Colln scient
Pap int Commn SE Atl Fish 10(1):27–30
Axelsen BE, Johnsen E (2015) An evaluation of the bottom
trawl surveys in the Benguela Current Large Marine
Ecosystem. Fish Oceanogr 24(Suppl. 1):74–87. doi:10.
1111/fog.12079
Botha L (1973) Migrations and spawning behavior of the Cape
hakes. S Afr Shipp News Fishg Ind Rev 28(4): 62–63, 65,
67
Botha L (1986) Reproduction, sex ratio and rate of natural
mortality of Cape hakes Merluccius capensis Cast. and M.
paradoxus Franca in the Cape of Good Hope area. S Afr J
Mar Sci 4:23–35
Burmeister L (2005) Is there a single stock of Merluccius
paradoxus in the Benguela ecosystem? Afr J mar Sci
27(1):23–32
de Pontual H, Groison AL, Pineiro C, Bertignac M (2006)
Evidence of underestimation of European hake growth in
the Bay of Biscay, and its relationship with bias in the
agreed method of age estimation. ICES J Mar Sci
63:1674–1681
Drouineau H, Mahevas S, Bertignac M, Duplisea D (2010) A
length-structured spatially explicit model for estimating
hake growth and migration rates. ICES J Mar Sci
67(8):1697–1709
Field JG, Moloney CL, du Buisson L, Jarre A, Stroemme T,
Lipinski MR, Kainge P (2008) Exploring the BOFFF
hypothesis using a model of southern African deepwater
hake (Merluccius paradoxus). In: Tsukamoto K, Kawa-
mura T, Takeuchi T, Beard TD Jr, Kaiser MJ (eds) Fish-
eries for global welfare and environment, 5th World
Fisheries Congress, Terrapub, pp 17–26
Garavelli L, Gruss A, Grote B, Chang N, Smith M, Verley P,
Stenevik EK, Kaplan DM, Lett C (2012) Modeling the
dispersal of Cape hake ichthyoplankton. J Plankt Res
34(8):655–669
Gordoa A, MacPherson E, Olivar MP (1995) Biology and
fisheries of Namibian hakes (M. paradoxus and M.
capensis). In: Alheit J, Pitcher TJ (eds) Hake biology,
fisheries and markets. Chapman & Hall, London, pp 49–88
Grinols RB, Tillman MF (1970) Importance of the worldwide
hake, Merluccius, resource. US fish and wildlife service.
Circ 332:1–21
Grote B, Ekau W, Hagen W, Huggett JA, Verheye HM (2007)
Early life-history strategy of Cape hake in the Benguela
upwelling region. Fish Res 86:179–187
Grote B, Ekau W, Stenevik EK, Clemmesen K, Verheye
HM, Lipinski MR, Hagen W (2012a) Characteristics of
survivors – growth and condition of early life stages of
the two hake species Merluccius paradoxus and M.
capensis in the southern Benguela system. ICES J Mar
Sci 69:553–562
Grote B, Stenevik EK, Ekau W, Verheye HM, Lipinski MR,
Hagen W (2012b) Spawning strategies and transport of
early stages of the two hake species,Merluccius paradoxus
Rev Fish Biol Fisheries (2016) 26:235–248 247
123

and M. capensis in the southern Benguela upwelling sys-
tem. Afr J Mar Sci 34(2):195–204
Gunderson DR (1993) Surveys of fisheries resources. Wiley,
New York, pp 15–16
Hilborn R, Walters CJ (1992) Quantitative fisheries stock
assessment. Chapman & Hall, London
Hutchings JA (2002) Life histories of fish. In: Hart PJB, Rey-
nolds JD (eds) Handbook of fish biology and fisheries, vol
1. Blackwell Publishing, Oxford UK, pp 149–174
Jansen T, Kainge P, Singh L, WilhelmM, Durholtz D, Strømme
T, Kathena J, Erasmus V (2015) Spawning patterns of
shallow-water hake (Merluccius capensis) and deep-water
hake (M. paradoxus) in the Benguela Current LargeMarine
Ecosystem inferred from gonadosomatic indices. Fish Res
172:168–180. doi:10.1016/j.fishres.2015.07.009
Kainge PI (2002) Spawning time and reproductive investment
of the hakes,Merluccius capensis andM. paradoxus, in the
Namibian waters. Dissertation MPhil University of Ber-
gen, Norway
Kainge P, Kjesbu OS, Thorsen A, Salvanes AG (2007) Mer-
luccius capensis spawn in Namibian waters, but do M.
paradoxus? Afr J Mar Sci 29(3):379–392
Kirchner C (2011) Status of deep-water hake. In: Japp DW,
Purves MG, Wilkinson S, Kirchner C (eds) Benguela cur-
rent large marine ecosystem, 2011 annual state of fish
stocks report, the Secretariat of the Benguela Current
Commission, Windhoek Namibia, pp 9–13
Le Clus F, Henning HF-KO, Osborne RF, Leslie RW (2005a)
Size-dependent spatial dynamics of deep-water Cape hake
Merluccius paradoxus density distribution on two coasts,
1990–2003. Marine and Coastal Management South
Africa, Demersal Working Group document WG/01/05/
DH:4
Le Clus F, Henning HF-KO, Osborne RF, Leslie RW (2005b)
Size-dependent spatial dynamics of shallow-water Cape
hake Merluccius capensis density distribution on two
coasts, 1990–2003. Marine and Coastal Management
South Africa, Demersal Working Group Document WG/
03/05/DH6
Lett C, Roy C, Levasseur A, van der Lingen CD, Mullon C
(2006) Simulation and quantification of enrichment and
retention processes in the southern Benguela upwelling
ecosystem. Fish Oceanogr 15(5):363–372
Nelson MO, Larkins HA (1970) Distribution and biology of
Pacific hake: a synopsis. US fish and wildlife service. Circ
332:23–33
Osborne RF (2004) Spawning biology of Merluccius capensis
and M. paradoxus. Dissertation PhD, University of the
Western Cape
Osborne RF, Mullins PW (2005) Proposal to change Cape hake
Merluccius capensis and M. paradoxus sexual maturity
assessment employed during routine fish sampling onboard
research and commercial vessels. Marine and Coastal
Management South Africa, Demersal Working Group
Document WG/10/05/DH36
Ostrowski M, Shillington F, Lipinski M (2011) The Orange
Banks: topographic setting and mid-shelf hydrographic
conditions at the northern extremity of the southern Ben-
guela upwelling regime. ICES Annual Science Conference
19–23 September 2011 Gdansk Poland, Book of Abstracts:
47
Payne AIL, Punt AE (1995) Biology and fisheries of South
African Cape hakes (M. capensis and M. paradoxus). In:
Alheit J, Pitcher TJ (eds) Hake biology, fisheries and
markets. Chapman & Hall, London, pp 15–47
Roux ER (1949) Migrations of the Cape hake or stockfish
(Merluccius capensis Cast.) on the west coast of South
Africa. Trans R Soc S Afr 32(2):217–231
Sætersdal G, Bianchi G, Strømme T, Venema SC (1999) The Dr
Fridtjof Nansen programme 1975–1993. Investigation of
fishery resources in developing countries. History of the
programme and review of results. FAO fisheries technical
paper 391, Rome
Shelton PA (1986) Fish spawning strategies in the variable
southern Benguela Current region. Dissertation PhD,
University of Cape Town
Stenevik EK, Verheye HM, Lipinski MR, Ostrowski M,
Stromme T (2008) Drift routes of Cape hake eggs and
larvae in the southern Benguela Current system. J Plankt
Res 30:1147–1156
Strømme T, Iilende T (2001) Precision in systematic trawl
surveys as assessed from replicate sampling by parallel
trawling off Namibia. S Afr J Mar Sci 23:385–396
Von der Heyden S, Lipinski MR, Matthee CA (2007a) Mito-
chondrial DNA analyses of the Cape hakes reveal an
expanding, panmictic population for Merluccius capensis
and population structuring for mature fish in Merluccius
paradoxus. Mol Phylogenet Evol 42:517–527
Von der Heyden S, Lipinski MR, Matthee CA (2007b) Species-
specific genetic markers for identification of early life-
history stages of Cape hakes, Merluccius capensis and
Merluccius paradoxus in the southern Benguela current.
J Fish Biol 70 (Suppl. B):262–268
Von der Heyden S, Lipinski MR, Matthee CA (2010)
Remarkably low mtDNA control region diversity in an
abundant demersal fish. Mol Phylogenet Evol
55:1183–1188
Wilhelm M (2012) Growth and otholith zone formation of
Namibian hake Merluccius capensis. Dissertation PhD,
Department of Zoology University of Cape Town
248 Rev Fish Biol Fisheries (2016) 26:235–248
123