life cycle assessment of grocery carrier bags - mst.dk · the danish environmental protection...
TRANSCRIPT

Life Cycle Assessment of
grocery carrier bags
Environmental Project no. 1985 February 2018

2 The Danish Environmental Protection Agency / LCA of grocery carrier bags
Publisher: The Danish Environmental Protection Agency
Editors: Valentina Bisinella, Paola Federica Albizzati,
Thomas Fruergaard Astrup, Anders Damgaard
The Danish Environmental Protection Agency publishes reports and papers about research and development projects
within the environmental sector, financed by the Agency. The contents of this publication do not necessarily represent
the official views of the Danish Environmental Protection Agency. By publishing this report, the Danish Environmental
Protection Agency expresses that the content represents an important contribution to the related discourse on Danish
environmental policy.
Sources must be acknowledged.
The Danish Environmental Protection Agency / LCA of grocery carrier bags 3
Contents
Contents 3
Executive summary – Dansk 5
Executive summary - English 13
Preface 20
List of Abbreviations 21
Key definitions 22
1. Introduction and objectives 23
1.1 Background 23
1.2 Aim of the study 23
2. Carrier bags 25
2.1 Carrier bag types 25
2.2 Carrier bags available in Denmark 28
3. LCA Methodology 31
3.1 LCA goal definition 31
3.2 Functional unit 31
3.2.1 Reference flow 33
3.3 System boundaries 34
3.4 Modelling approach and allocation of multi-functionality 34
3.5 Modelling of primary reuse 35
3.6 Modelling of secondary reuse 35
3.7 Modelling tools 37
3.8 LCIA methodology and types of impacts 38
3.9 Data requirements 38
3.9.1 Production and distribution 38
3.9.2 End-of-life 40
3.10 Assumptions 41
3.10.1 Assumptions on missing data 42
3.11 Data quality assessment 44
3.11.1 Critical assumptions 45
3.12 Cut-offs 45
3.13 Limitations 45
3.14 Life Cycle Interpretation 46
3.15 Critical review 47
3.16 Format of the report 47
4. Scenarios 48
4.1 Carrier bag alternatives 48
4.2 End-of-life scenarios 50
4.2.1 Incineration: EOL1 50
4.2.2 Recycling of material: EOL2 50
4.2.3 Reuse as waste bin bag: EOL3 51

4 The Danish Environmental Protection Agency / LCA of grocery carrier bags
4.3 Carrier bag scenarios 52
4.3.1 LDPE carrier bags: LDPEavg, LDPEs, LDPEh, LDPErec 52
4.3.2 PP carrier bags: PP, PPwov 52
4.3.3 Recycled PET carrier bags: PETrec 52
4.3.4 Polyester carrier bags: PETpol 52
4.3.5 Starch-complexed biopolymer bags: BP 53
4.3.6 Paper bags: PAP, PAPb 53
4.3.7 Cotton bags: COTorg, COT 53
4.3.8 Composite bags: COM 53
4.3.9 LDPE waste bin bag 53
5. Life Cycle Impact Assessment 54
5.1 Results for each carrier bag 54
5.1.1 LDPE bags: LDPEavg, LDPEs, LDPEh, LDPErec, W 58
5.1.2 PP bags: PP, PPwov 61
5.1.3 Recycled PET carrier bags: PETrec 62
5.1.4 Polyester bags: PETpol 65
5.1.5 Comparison of fossil plastic carrier bags 65
5.1.6 Biopolymer bags: BP 66
5.1.7 Paper bags: PAP, PAPb 68
5.1.8 Cotton and composite bags: COTorg, COT, COM 69
5.2 Overview 72
6. Discussion 74
6.1 Identification of the best disposal option for each carrier bag 74
6.2 Which carrier bag provides the lowest environmental impact to fulfil the
function? 76
6.3 How many times should a carrier bag be reused? 79
6.4 Influence on data and assumptions on the results 81
7. Sensitivity analysis: critical assumptions 84
7.1 Choice of reference flow: rounding 84
7.2 Secondary reuse as a waste bin bag allowed only for LDPE carriers 86
7.3 Recycled LDPE 88
7.4 Final remarks on sensitivity analysis 89
7.4.1 Carrier bag design 90
8. Conclusions 92
9. References 94
Life Cycle Inventories (LCIs) 96 Appendix A.
Marginal technologies 108 Appendix B.
Appendix B.1 Marginal energy technologies 109
Appendix B.2 Marginal materials 111
Additional results 114 Appendix C.
Critical review 128 Appendix D.
The Danish Environmental Protection Agency / LCA of grocery carrier bags 5
Executive summary – Dansk
Konceptuel ramme
Dette studie giver en livscyklusvurdering af produktion, brug og bortskaffelse ("vugge til grav")
af indkøbsposer tilgængelige i danske supermarkeder i 2017. Undersøgelsen blev udført af
DTU Miljø i perioden oktober - december 2017.
I øjeblikket tilbyder danske supermarkeder kunderne flere indkøbsposer i forskellige materialer
(såsom genanvendeligt og ikke-genanvendeligt plast, papir og bomuld) designet til at skulle
bruges flere gange inden bortskaffelse. Grundet miljøpåvirkninger fra deres fremstilling, skal
disse flerbrugsposer optimalt genbruges et vist antal gange for at kompensere for miljøpåvirk-
ningerne, hvor antallet afhænger af materialet og design.
Studiet blev bestilt af Miljøstyrelsen med det formål at identificere indkøbsposen med den
bedste miljøpræstation, til brug i danske supermarkeder. Studiet har til formål at identificere et
anbefalet antal genbrug af hver indkøbspose baseret på indkøbsposernes miljøpåvirkninger
under hele livscyklus. Studie tog højde for, at genbrug af indkøbsposerne kan forekomme
både som primær genbrug (hvor indkøbsposen genbruges til samme funktion, som den blev
produceret, dvs. for at transportere dagligvarer fra supermarked til hjem) eller som erstatning
af en skraldepose i affaldsbeholdere (sekundær genbrug).
De følgende indkøbsposer blev undersøgt:
Lavdensitets polyethylen (LDPE), 4 typer; en LDPE indkøbspose med gennemsnitlige vær-
dier, en LDPE indkøbspose med blødt håndtag, an LDPE indkøbspose med fast håndtag og
en LDPE indkøbspose af genanvendt LDPE
Polypropylen (PP), 2 typer: ikke-vævet og vævet;
Genanvendt polyethylenterephthalat (PET);
Polyester (af primære PET-polymerer);
Stivelse-kompleksbundet biopolymer;
Papir, 2 typer: ubleget og bleget;
Bomuld, 2 typer: økologisk og konventionel;
Komposit materiale (jute, PP, bomuld).
En undersøgelse foretaget af DTU Miljø viste, at LDPE-poser er tilgængelige for køb i alle
danske supermarkeder, mens andre typer af indkøbsposer tilbydes som alternativer. Derfor
blev de gennemsnitlige egenskaber ved en LDPE indkøbspose brugt som referencepose i
studiet. Rapporten omhandler kun indkøbsposer til rådighed i danske supermarkeder i 2017,
og omfatter ikke andre typer af poser. Rapporten fokuserer på de miljøpåvirkninger, der er
forbundet med indkøbsposerne, og tager ikke stilling til hvad indførelsen af skatter, kunders
holdninger eller adfærdsmæssige ændringer ville kunne have for studiet. Miljøeffekten af, at
poserne smides som henkastet affald i naturen blev antaget som ubetydelige for danske for-
hold og blev derfor ikke inkluderet i modellen. Undersøgelsen blev kun udført for materialety-
per og poser, der allerede var på markedet. Dette betyder ikke, at andre mere optimale kom-
binationer af materialevalg og posedesign ikke kunne være relevante for fremtidig posepro-
duktion (volumen, genanvendt materiale, bæreevne osv.)
Metodisk ramme
Miljøvurderingen blev udført via livscyklusvurdering (LCA), som er en standardiseret metode,
der tager højde for de potentielle miljøpåvirkninger forbundet med de ressourcer, der er nød-
vendige for at producere, bruge og bortskaffe produktet der evalueres samt mulige emissioner
der kan opstå under produktion og bortskaffelse. Når materiale- og energiressourcer genvin-
des, krediteres systemet med potentielt undgåede emissioner fra primær produktion af de
samme ressourcer. For at sammenligne indkøbsposerne tog vi højde for, hvor mange af de

6 The Danish Environmental Protection Agency / LCA of grocery carrier bags
forskellige poser der var nødvendige for at kunne opfylde den funktion, der bliver leveret af en
LDPE indkøbspose med gennemsnitlige egenskaber, som i studies fastsattes til:
"Transportere indkøb med et gennemsnitligt volumen på 22 liter og en gennemsnitlig
vægt på 12 kg fra et dansk supermarked til hjemmet i 2017 med en (nyindkøbt) ind-
købspose. Indkøbsposen er produceret i Europa og distribueret til Danske supermarke-
der. Efter brug, indsamles og behandles indkøbsposen i det danske affaldshåndte-
ringssystem"
Som vist i Tabel I var to poser nødvendige for at opfylde funktionen i tilfælde af simple LDPE,
recirkulerede LDPE-, biopolymer-, papir- og økologiske bomuldsposer. For disse poser, var
enten den krævede volumen eller vægtkapacitet ikke opfyldt. Poser af økologisk og konventi-
onelt produceret bomuld blev modelleret hver for sig, for at kunne sammenligne forskellene i
resultater for de to materialetyper, da økologisk bomuld har et lavere produktions udbytte end
konventionelt produceret bomuld (Forster et al., 2013). Tabel I viser, at for økologisk bomuld
skal der bruges to indkøbsposer, da volumen af den økologiske bomuldspose ikke var lige så
stort som volumen for reference posen af LDPE.
Tabel I. Forskellige indkøbsposer vurderet i denne LCA og det antal poser der kræves
for at opfylde funktionaliteten leveret af en LDPE indkøbspose med gennemsnitlige
egenskaber.
Indkøbspose materiale Indkøbspose type Reference flow
(antal poser der er nødvendige)
Plast LDPE (gennemsnit) 1 (reference pose)
Plast LDPE simpel 2
Plast LDPE fast håndtag 1
Plast LDPE genanvendt 2
Plast PP ikke-vævet 1
Plast PP vævet 1
Plast PET genanvendt 1
Plast Polyester 1
Bioplast Biopolymer 2
Papir Papir, ubleget 2
Papir Papir, bleget 2
Tekstil Bomuld økologisk 2
Tekstil Bomuld konventionelt 1
Komposit Jute, PP, bomuld 1
Miljøvurderingen blev for hver indkøbspose udført for forskellige bortskaffelsesmuligheder:
forbrænding (EOL1); genanvendelse (EOL2); og genbrug som skraldepose inden forbrænding
(EOL3). For alle indkøbsposer blev der taget højde for miljøpåvirkningen af produktion (anta-
ges at produceres i Europa), emballage ved fremsendelse til butik, transport til Danmark samt
brug og bortskaffelse (som kunne forekomme i Danmark eller i Europa). Den generelle struktur
af de inkluderede scenarier, og processer der tages i betragtning, er vist i Figur I.
Miljøvurderingen blev udført for en række anbefalede miljøpåvirkninger (Europa-
Kommissionen, 2010): klimaforandringer; ozonnedbrydning; human toksicitet (kræft og ikke-
kræftvirkninger); fotokemisk ozondannelse; ioniserende stråling; partikelforurening; terrestrisk
forsuring; terrestrisk eutrofiering; marin eutrofiering; ferskvands eutrofiering; økosystems toksi-
citet; ressourceforbrug fossilt og abiotisk; samt brug af vandressourcer.
The Danish Environmental Protection Agency / LCA of grocery carrier bags 7
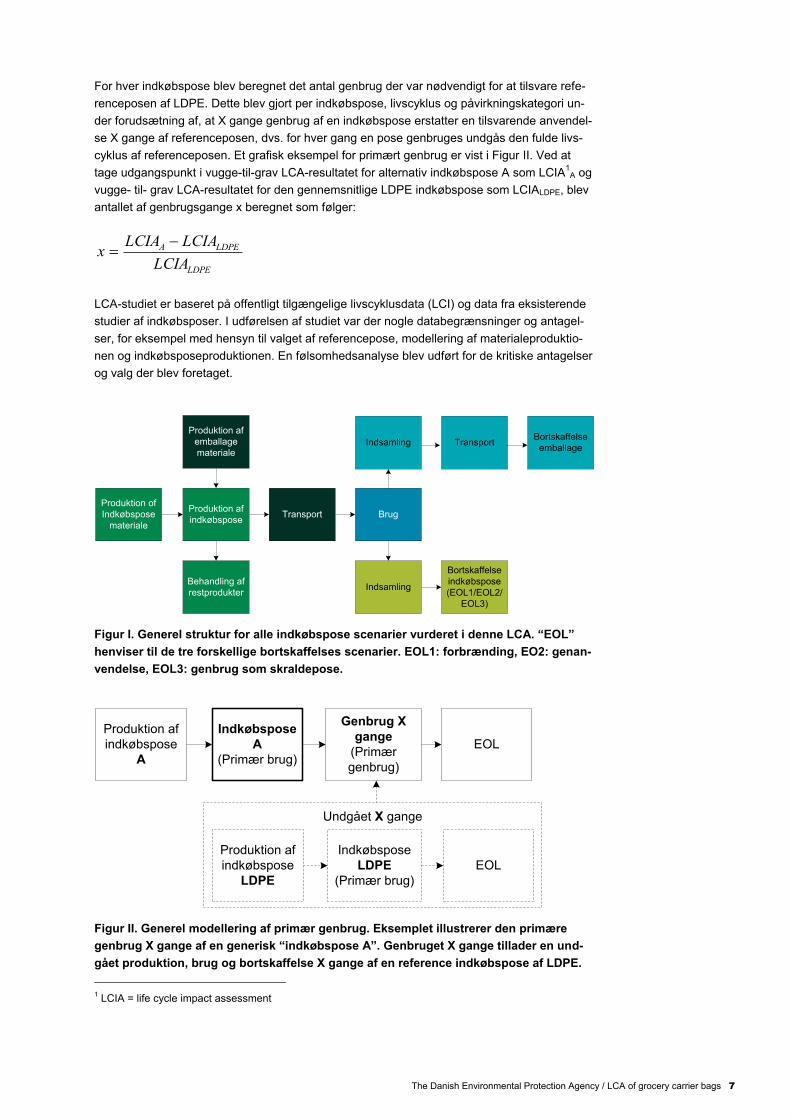
For hver indkøbspose blev beregnet det antal genbrug der var nødvendigt for at tilsvare refe-
renceposen af LDPE. Dette blev gjort per indkøbspose, livscyklus og påvirkningskategori un-
der forudsætning af, at X gange genbrug af en indkøbspose erstatter en tilsvarende anvendel-
se X gange af referenceposen, dvs. for hver gang en pose genbruges undgås den fulde livs-
cyklus af referenceposen. Et grafisk eksempel for primært genbrug er vist i Figur II. Ved at
tage udgangspunkt i vugge-til-grav LCA-resultatet for alternativ indkøbspose A som LCIA1
A og
vugge- til- grav LCA-resultatet for den gennemsnitlige LDPE indkøbspose som LCIALDPE, blev
antallet af genbrugsgange x beregnet som følger:
LDPE
LDPEA
LCIA
LCIALCIAx
LCA-studiet er baseret på offentligt tilgængelige livscyklusdata (LCI) og data fra eksisterende
studier af indkøbsposer. I udførelsen af studiet var der nogle databegrænsninger og antagel-
ser, for eksempel med hensyn til valget af referencepose, modellering af materialeproduktio-
nen og indkøbsposeproduktionen. En følsomhedsanalyse blev udført for de kritiske antagelser
og valg der blev foretaget.
Figur I. Generel struktur for alle indkøbspose scenarier vurderet i denne LCA. “EOL”
henviser til de tre forskellige bortskaffelses scenarier. EOL1: forbrænding, EO2: genan-
vendelse, EOL3: genbrug som skraldepose.
Figur II. Generel modellering af primær genbrug. Eksemplet illustrerer den primære
genbrug X gange af en generisk “indkøbspose A”. Genbruget X gange tillader en und-
gået produktion, brug og bortskaffelse X gange af en reference indkøbspose af LDPE.
1 LCIA = life cycle impact assessment
Produktion of
Indkøbspose
materiale
Produktion af
indkøbspose
Behandling af
restprodukter
Produktion af
emballage
materiale
Transport Brug
TransportBortskaffelse
emballage
Indsamling
Bortskaffelse
indkøbspose
(EOL1/EOL2/
EOL3)
Indsamling
Indkøbspose
A
(Primær brug)
EOL
Genbrug X
gange
(Primær
genbrug)
Produktion af
indkøbspose
A
Indkøbspose
LDPE
(Primær brug)
EOL
Produktion af
indkøbspose
LDPE
Undgået X gange

8 The Danish Environmental Protection Agency / LCA of grocery carrier bags
Resultater og anbefalinger
LCA-undersøgelsen gav en række resultater, som kan være nyttige til optimering af brugen og
bortskaffelsen af indkøbsposer til rådighed for køb i Danmark. Resultaterne refererer til de
reference flows der er præsenteret i Tabel I.
Hvad er den mest fordelagtige bortskaffelsesmulighed for hver type af indkøbspose?
Når indkøbsposen er genbrugt så mange gange som muligt, er det bedre at genbruge
indkøbsposen som en skraldepose, end blot at smide posen i restaffaldet, og dette er bedre
end at aflevere posen til genanvendelse. Genanvendelse kan potentielt give større fordele i
tilfælde af tunge plastposer, såsom poser af PP, PET og polyester. Sekundær genbrug som
skraldepose er mest gavnlig for lette indkøbsposer, såsom poser af LDPE, papir og
biopolymer. Når genbrug som skraldepose ikke er muligt, for eksempel når posen let prikkes
hul i, rives i stykker eller bliver fugtig, som for papir- og biopolymerposer, er forbrænding den
mest foretrukne løsning ud fra et miljømæssigt synspunkt. Tabel II giver et resumé af de
opnåede resultater for hver bærerpose.
Tabel II. Oversigt over den mest foretrukne bortskaffelsesmulighed for hver af de ind-
købsposer, der vurderes.
Indkøbspose materiale Foretrukken bortskaffelsesmetode efter genbrug som indkøbspose
Plast, LDPE Genbrug som skraldepose
Plast, PP Genanvendelse, genbrug som skraldepose hvis muligt, ellers forbrændes
Plast, genanvendt PET Genanvendelse, genbrug som skraldepose hvis muligt, ellers forbrændes
Plast, polyester PET Genbrug som skraldepose hvis muligt, ellers forbrændes
Biopolymer Genbrug som skraldepose hvis muligt, ellers forbrændes
Papir Genbrug som skraldepose hvis muligt, ellers forbrændes
Tekstil Genbrug som skraldepose hvis muligt, ellers forbrændes
Komposit Genbrug som skraldepose hvis muligt, ellers forbrændes
Hvilken indkøbspose giver de laveste miljøpåvirkninger?
Generelt har LDPE-indkøbsposer, som er poser der altid kan købes i danske supermarkeder,
de laveste miljøpåvirkninger for de fleste miljøindikatorer (Tabel III). LDPE-indkøbsposer med
stift håndtag havde den laveste miljøpåvirkning i flertallet af de miljøpåvirknings kategorier der
var inkluderet i dette LCA studie. Indkøbsposer, der kan give en lignende lav miljøpåvirkning
er ublegede papir- og biopolymerposer, men for et lavere antal miljøindikatorer. Såkaldt tunge
indkøbsposer, såsom poser af PP, PET, polyester, bleget papir og tekstilposer, skal
genbruges flere gange for at opveje deres miljøproduktionsomkostninger. For poser af samme
materiale havde vævede PP-indkøbsposer lavere belastning end ikke-vævede PP-poser,
ubleget papir havde lavere påvirkning end bleget papir, og konventionelt bomuld havde lavere
påvirkning end økologisk bomuld.
Hvor mange gange skal indkøbsposer mindst genbruges?
For alle indkøbsposer skal de genbruges så mange gange som muligt før bortskaffelse. Tabel
IV rapporterer antal gange indkøbsposen skal genbruges for at reducere de miljømæssige
konsekvenser, der er forbundet med alle de alternative indkøbsposer i forhold til LDPE-
indkøbsposen. Derfor refererer de tal, der er angivet i Tabel IV, til det mindste antal gange en
pose skal genbruges. Det beregnede antal genbrug varierer, hvis kun én miljøindikator er
observeret eller hvis alle miljøindikatorer tages i betragtning. Det beregnede antal genbrug kan
være i overensstemmelse med den mulige levetid for PP, PET og polyester indkøbsposer,
men kan overstige levetiden for bleget papir-, komposit- og bomuldsposer, især hvis man
tager alle miljøindikatorer i betragtning. For LDPE-indkøbsposer var det nødvendige antal
genbrug forholdsvis ens for de forskellige miljøpåvirkningskategorier.

The Danish Environmental Protection Agency / LCA of grocery carrier bags 9
Tabel III. Indkøbsposer med den laveste miljøpåvirkning for alle de vurderede miljøindi-
katorer. Rækkefølgen, som poserne er anført i, svarer til placering i forhold til deres
LCA-resultater med lavest påvirkning først. Kun de tre laveste effekter er angivet. Re-
sultaterne refererer til det reference flow der er anført i Tabel I.
Miljøpåvirknings indikator Indkøbspose med lavest påvirkning
Klimaforandringer Papir ubleget, biopolymer, LDPE
Ozonnedbrydning LDPE
Human toksicitet, kræft Papir ubleget, LDPE
Human toksicitet, ikke-kræft Komposit, PP, LDPE
Fotokemisk ozondannelse LDPE
Ioniserende stråling LDPE
Partikelforurening LDPE
Terrestrisk forsuring LDPE
Terrestrisk eutrofiering LDPE
Ferskvands eutrofiering LDPE
Marin eutrofiering PP, LDPE
Økosystems toksicitet LDPE
Ressourceforbrug, fossilt Papir ubleget, LDPE
Ressourceforbrug, abiotisk PP, LDPE
Ressourceforbrug, vandressourcer LDPE, biopolymer
For indkøbsposer af PP, PET, biopolymer og papir var det nødvendige antal genbrug højere i
nogle kategorier end andre. Slutteligt fandtes det, at det meget høje antal genbrug for ind-
købsposer af bomuld og kompositmateriale primært skyldtes kategorien ozonnedbrydning der
var væsentligt højere end de andre kategorier, for hvilken datasættet for produktion af
bomuldsposen havde en væsentligt højere påvirkning end LDPE-posen.
Følsomhedsanalysen af data og antagelser fremhævede vigtigheden af valget af reference
flow, hvilket var afgørende for det beregnede antal genbrug for poser af økologisk bomuld.
Valget af reference flow afhænger af opfyldelsen af funktionen udtrykt af den funktionelle en-
hed beskrevet ovenfor. Specielt viste resultaterne betydningen af indkøbsposens design, som
bør fokusere på maksimering af volumen og bærekapacitet, samtidig med at mængden af
materiale der anvendes minimeres og dermed også vægten af indkøbsposen.
Vores endelige anbefalinger er følgende2:
LDPE-pose, simpel: Kan genbruges direkte som skraldepose i forhold til klimaforandringer,
skal genbruges mindst 1 gang til indkøb når der tages højde for alle andre indikatorer.
Genbrug som skraldepose, forbrænding.
2 Antallet af gange poserne skal genbruges for "alle indikatorer" henviser til det højeste antal blandt dem,
der beregnes for hver påvirkningskategori. For lette indkøbsposer (LDPE, PP, PET ...) skyldes det høje
antal en gruppe af påvirkningskategorier med samme høje værdier. Omvendt er det for komposit- og
bomuldsposer ozonnedbrydning der er grunden til det meget høje antal gange poserne skal genbruges.
Hvis der ses bort fra ozonnedbrydning, falder det nødvendige antal gange poserne skal genbruges fra 50
til 1400 for konventionel bomuld, fra 150 til 3800 for økologisk bomuld og fra 0 til 740 for kompositmateri-
aleposen hvilket primært skyldes brugen af vandressourcer, men ferskvands- og terrestrisk-eutrofiering
har lignende høje værdier. Resultater for det nødvendige antal gange poserne skal genbruges for hver
påvirkningskategori, minimum-maksimum intervaller og gennemsnitligt antal genbrug fremgår af bilag C.

10 The Danish Environmental Protection Agency / LCA of grocery carrier bags
Tabel IV. Beregnet antal primære genbrug nødvendigt for hver indkøbspose, med den
optimale bortskaffelse af indkøbsposen, for at give den samme miljømæssige ydeevne
som den gennemsnitlige LDPE indkøbspose med bortskaffelse som skraldepose inden
forbrænding. Resultaterne refererer til det reference flow der er anført i Tabel I.
LDPE gennemsnitspose, genbrug som
skraldepose
Klimaforandring Alle indikatorer
LDPE simpel, genbrug som skraldepose 0 1
LDPE fast håndtag, genbrug som skraldepose 0 0
LDPE genanvendt, genbrug som skraldepose 1 2
PP, ikke-vævet, genanvendelse 6 52
PP, vævet, genanvendelse 5 45
Genanvendt PET, genanvendelse 8 84
Polyester PET, genanvendelse 2 35
Biopolymer, genbrug som skraldepose og forbrænding 0 42
Ubleget papir, genbrug som skraldepose og forbræn-
ding 0 43
Bleget papir, genbrug som skraldepose og forbrænding 1 433
Økologisk bomuld, genbrug som skraldepose og for-
brænding 149 20000
Konventionelt bomuld, genbrug som skraldepose og
forbrænding 52 7100
Komposit, genbrug som skraldepose og forbrænding 23 870
LDPE-pose, fast håndtag: Kan genbruges direkte som skraldepose i forhold til alle
indikatorer. Genbrug som skraldepose, forbrænding.
LDPE-pose, genanvendt: Genbrug til indkøb mindst 1 gang i forhold til klimaforandringer,
mindst 2 gange når der tages højde for alle indikatorer. Genbrug som skraldepose,
forbrænding.
PP-pose, ikke-vævet: Genbrug til indkøb mindst 6 gange i forhold til klimaforandringer,
mindst 52 gange når der tages højde for alle indikatorer. Bortskaffes med genanvendelige
materialer, ellers genbrug som skraldepose hvis det er muligt, forbrænding.
PP-pose, vævet: Genbrug til indkøb mindst 5 gange i forhold til klimaforandringer, mindst
45 gange når der tages højde for alle indikatorer. Bortskaffes med genanvendelige
materialer, ellers genbrug som skraldepose hvis det er muligt, forbrænding.
PET-pose: Genbrug til indkøb mindst 8 gange i forhold til klimaforandringer, mindst 84
gange når der tages højde for alle indikatorer; bortskaffes med genanvendelige materialer,
genbrug som skraldepose hvis muligt, forbrænding.
Polyesterpose: Genbrug til indkøb mindst 2 gange i forhold til klimaforandringer, mindst 35
gange når der tages højde for alle indikatorer; bortskaffes med genanvendelige materialer,
ellers genbrug som skraldepose hvis muligt, forbrænding.
Biopolymerpose: Hvis muligt genbrug direkte som skraldepose i forhold til
klimaforandringer, skal genbruges mindst 42 gange til indkøb når der tages højde for alle
andre indikatorer. Genbrug som skraldepose hvis muligt, forbrænding.
Ubleget papirpose: Hvis muligt genbrug direkte som skraldepose i forhold til
klimaforandringer, skal genbruges mindst 43 gange når der tages højde for alle andre
indikatorer. Genbrug som skraldepose hvis muligt, forbrænding.
3 Den højeste værdi for bleget papir er sat til minimum at være den samme som ubleget papir.

The Danish Environmental Protection Agency / LCA of grocery carrier bags 11
Bleget papirpose: Genbrug til indkøb mindst 1 gang i forhold til klimaforandringer, mindst
43 gange når der tages højde for alle indikatorer. Genbrug som skraldepose hvis det er
muligt, ellers forbrænding.
Økologiske bomuldspose: Genbrug til indkøb mindst 149 gange for klimaændringer,
mindst 20000 gange når der tages højde for alle indikatorer. Genbrug som skraldepose hvis
det er muligt, ellers forbrænding.
Traditionelle bomuldspose: Genbrug til indkøb mindst 52 gange i forhold til
klimaforandringer, mindst 7100 gange når der tages højde for alle indikatorer. Genbrug som
skraldepose, hvis det er muligt, ellers forbrænding.
Kompositpose: Genbrug til indkøb mindst 23 gange i forhold til klimaforandringer, mindst
870 gange når der tages højde for alle indikatorer. Genbrug som skraldepose, hvis det er
muligt, ellers forbrænding.
Det understreges, at hvis reference LDPE-posen genbruges til indkøb, øges det nødvendige
antal gange de andre poser skal genbruges proportionalt. Resultaterne opnået for det
minimale antal genanvendelses gange er beregnet for at bidrage til en videre diskussion
mellem interessenterne om den forventede effektive levetid for hver indkøbspose i forhold til
det beregnede antal gange poserne skal genbruges. Selvom det beregnede antal genbrug kan
være i overensstemmelse med den funktionelle levetid for PP, PET og polyester
indkøbsposer, kan den overgå levetiden for bleget papir-, komposit- og bomuldsindkøbsposer,
især når man tager alle miljøindikatorer i betragtning.
Resumé af det kritiske review
Reviewere
En kritisk gennemgang i henhold til ISO 14040/14044 blev udført af Line Geest Jakobsen og
Trine Lund Neidel fra COWI A/S i Januar 2018
Review processen
Reviewet involverede følgende faser:
COWI udførte det første review i januar 2018
DTU svarede på de spørgsmål der blev stillet af COWI, og rettede rapporten i forhold de
kommentarer der var enighed om i reviewet fra januar 2018
COWI evaluerede de rettelser der var lavet, og sammenfattede den endelige review kom-
mentar.
Det kritiske review er vedhæftet i fulde i Appendix D. Hovedpunkterne fremhævet i det kritiske
review er angivet nedenfor.
LCA-rapporten er blevet gennemgået med hensyn til overholdelse af de internationale stan-
darder ISO 14040 og 14044. Rapporten viste sig i overordnet at overholde standarderne.
Forfatterne anfører, at rapporten ikke er i overensstemmelse med standarden, da et review
med inddragelse af et ekspertpanel ikke blev gennemført i projektfaserne.
Metoden valgt til fastsættelse af den funktionelle enhed og reference flow blev verificeret ved
en følsomhedsanalyse. Resultaterne af følsomhedsanalysen viste, at valget af reference flow
har stor indflydelse på bæreposer med høje miljøpåvirkninger forbundet med produktion og
poser med et lavere volumen end det, der udtrykkes i den funktionelle enhed (hovedsageligt
økologisk bomuld). Forfatterne tilføjede en dedikeret sektion om indkøbspose design, hvor de
giver kommentarer til den indflydelse som indkøbspose design har på resultaterne.
12 The Danish Environmental Protection Agency / LCA of grocery carrier bags
Det kritiske review understregede, at særlig opmærksomhed skal tillægges datakvalitetsvurde-
ring og at kritiske antagelser skal være tydeligt klargjort. Forfatterne tilføjede dedikerede afsnit
om datakvalitetsvurdering, kritiske antagelser samt hvilken indflydelse data og antagelser har
på resultaterne. Miljøpåvirkningen som udvalgte kritiske antagelser havde på resultaterne blev
vurderet med en følsomhedsanalyse.
Efter det første kritisk review, tilføjede forfatterne yderligere specifikationer på indkøbstyperne
(for eksempel polyester polymertypen), justerede sprog og grammatisk fejl og tilføjede yderli-
gere detaljer for at forbedre den overordnede forståelse af rapporten.

The Danish Environmental Protection Agency / LCA of grocery carrier bags 13
Executive summary - English
Conceptual framework
This study provides the life cycle environmental impacts of the production, use and disposal
(“cradle-to-grave”) of grocery carrier bags available for purchase in Danish supermarkets in
2017. The study was carried out by DTU Environment in the period October – December
2017.
Currently, Danish supermarkets provide multiple-use carrier bags of different materials (such
as recyclable and non-recyclable plastic, paper and cotton) designed for a multiple number of
uses. In order to compensate the environmental impacts arising from their manufacturing
phase, these multiple-use carrier bags need to be reused a number of times.
This study was commissioned by the Danish Environmental Protection Agency (Miljøstyrelsen)
with the aim to identify the grocery carrier bag with the best environmental performance to be
provided in Danish supermarkets. Moreover, the Miljøstyrelsen aimed at identifying a recom-
mended number of reuse times for each carrier bag based on their life cycle environmental
impacts. The project took into account that reuse of the carrier bag could occur both as prima-
ry reuse (where the carrier bag is reused for the same function for which it was produced, i.e.
for carrying grocery shopping from the supermarket to the home), or replacing other products
as waste bin liners (secondary reuse).
The following types of carrier bags were studied:
Low-density polyethylene (LDPE), 4 types: an LDPE carrier bag with average characteris-
tics, an LDPE carrier bag with soft handle, an LDPE carrier bag with rigid handle and a recy-
cled LDPE carrier bag;
Polypropylene (PP), 2 types: non-woven and woven;
Recycled polyethylene terephthalate (PET);
Polyester (of virgin PET polymers);
Starch-complexed biopolymer;
Paper, 2 types: unbleached and bleached;
Cotton, 2 types: organic and conventional;
Composite (jute, PP, cotton).
A survey conducted by DTU Environment showed that LDPE bags are always available for
purchase in all Danish supermarkets, while other carrier bag types are provided as alterna-
tives. Therefore, the average characteristics of the LDPE carrier bag were taken as reference.
The report considers only carrier bags available in Danish supermarkets in 2017 and it does
not include personal bags or other carriers. The report focuses on the environmental impacts
connected to the carrier bags, and does not consider the introduction of taxes, customers’
attitude or behavioural changes. The effects of littering were considered negligible for Den-
mark and not considered. The study was only done for material types already on the market,
and the functionality of these bags. This does not mean that other more optimal combinations
could not be relevant for future bag production (volume, recycled material, carrying capacity
etc.).
Methodological framework
The environmental assessment of the carrier bag alternatives was carried out with Life Cycle
Assessment (LCA), which is a standardized methodology that takes into account the potential
environmental impacts associated with resources necessary to produce, use and dispose the

14 The Danish Environmental Protection Agency / LCA of grocery carrier bags
product, and also the potential emissions that may occur during its disposal. When material
and energy resources are recovered, the system is credited with the avoided potential emis-
sions that would have been necessary in order to produce these resources. In order to com-
pare the carrier bags, we took into account how many of the different types were necessary in
order to fulfil the function provided by an LDPE carrier bag with average characteristics, which
was:
“Carrying one time grocery shopping with an average volume of 22 litres and with an
average weight of 12 kilograms from Danish supermarkets to homes in 2017 with a
(newly purchased) carrier bag. The carrier bag is produced in Europe and distributed to
Danish supermarkets. After use, the carrier bag is collected by the Danish waste man-
agement system”.
As shown in Table I, two bags were necessary to fulfil the function in the case of simple LDPE,
recycled LDPE, biopolymer, paper, and organic cotton bags. For these bags, either the volume
or weight holding capacity required was not fulfilled. Organic and conventional cotton bags
were modelled separately in order to differentiate the results for the different types of material,
since organic cotton production has a lower yield than conventional cotton (Forster et al.,
2013). Table I shows that organic cotton required two carrier bags, since the volume of the
organic cotton bag did not fulfil the volume requirements expressed in the functional unit.
Table I. Carrier bag alternatives considered for this LCA study and number of bags
required to fulfil the functionality provided by an LDPE carrier bag with average charac-
teristics.
Material carrier bag Type carrier bag Reference flow
(number of bags needed)
Plastic LDPE (average) 1 (reference bag)
Plastic LDPE simple 2
Plastic LDPE rigid handle 1
Plastic LDPE recycled 2
Plastic PP non-woven 1
Plastic PP woven 1
Plastic PET recycled 1
Plastic Polyester 1
Bioplastic Biopolymer 2
Paper Paper, unbleached 2
Paper Paper, bleached 2
Textile Cotton organic 2
Textile Cotton conventional 1
Composite Jute, PP, cotton 1
The environmental assessment of each carrier bag was carried out taking into consideration
different end-of-life options: incineration (EOL1), recycling (EOL2), and reuse as waste bin bag
(EOL3) before being incinerated. For all carrier bag alternatives, the assessment took into
account impacts arising from production of the carrier and its packaging (assumed to occur in
Europe), transportation to Denmark, use, and disposal (which could occur in Denmark or with-
in Europe). The general structure of the processes taken into account is shown in Figure I.
The environmental assessment was carried out for a range of recommended environmental
impacts (European Commission, 2010): climate change, ozone depletion, human toxicity can-
cer and non-cancer effects, photochemical ozone formation, ionizing radiation, particulate
matter, terrestrial acidification, terrestrial eutrophication, marine eutrophication, freshwater
The Danish Environmental Protection Agency / LCA of grocery carrier bags 15
eutrophication, ecosystem toxicity, resource depletion, fossil and abiotic, and depletion of
water resource.
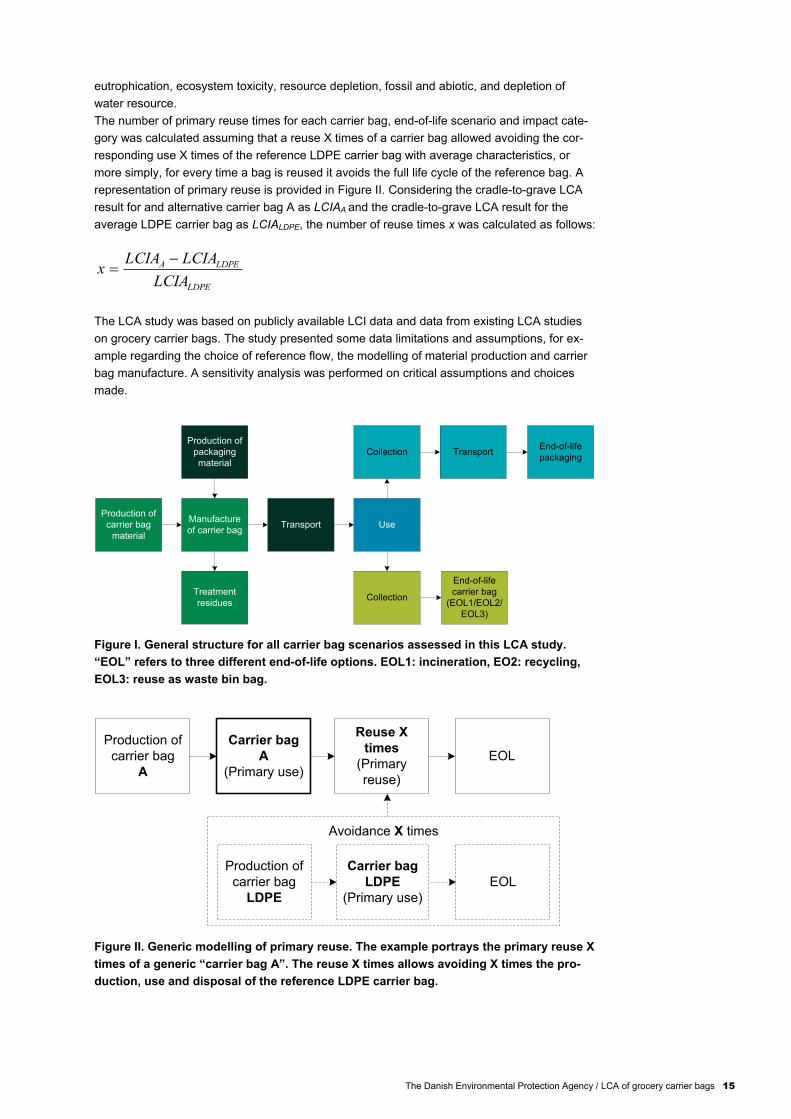
The number of primary reuse times for each carrier bag, end-of-life scenario and impact cate-
gory was calculated assuming that a reuse X times of a carrier bag allowed avoiding the cor-
responding use X times of the reference LDPE carrier bag with average characteristics, or
more simply, for every time a bag is reused it avoids the full life cycle of the reference bag. A
representation of primary reuse is provided in Figure II. Considering the cradle-to-grave LCA
result for and alternative carrier bag A as LCIAA and the cradle-to-grave LCA result for the
average LDPE carrier bag as LCIALDPE, the number of reuse times x was calculated as follows:
LDPE
LDPEA
LCIA
LCIALCIAx
The LCA study was based on publicly available LCI data and data from existing LCA studies
on grocery carrier bags. The study presented some data limitations and assumptions, for ex-
ample regarding the choice of reference flow, the modelling of material production and carrier
bag manufacture. A sensitivity analysis was performed on critical assumptions and choices
made.
Figure I. General structure for all carrier bag scenarios assessed in this LCA study.
“EOL” refers to three different end-of-life options. EOL1: incineration, EO2: recycling,
EOL3: reuse as waste bin bag.
Figure II. Generic modelling of primary reuse. The example portrays the primary reuse X
times of a generic “carrier bag A”. The reuse X times allows avoiding X times the pro-
duction, use and disposal of the reference LDPE carrier bag.
Production of
carrier bag
material
Manufacture
of carrier bag
Treatment
residues
Production of
packaging
material
Transport Use
Collection Transport
Collection
End-of-life
packaging
End-of-life
carrier bag
(EOL1/EOL2/
EOL3)
Carrier bag
A
(Primary use)
EOL
Reuse X
times
(Primary
reuse)
Production of
carrier bag
A
Carrier bag
LDPE
(Primary use)
EOL
Production of
carrier bag
LDPE
Avoidance X times

16 The Danish Environmental Protection Agency / LCA of grocery carrier bags
Findings and recommendations
The LCA study provided a number of findings that can be useful for optimizing the use and
disposal of the carrier bags available for purchase in Denmark. The results are referred to the
reference flows presented in Table I.
Which is the most preferable disposal option for each type of carrier bag?
After reusing the carrier bag as many times as possible, reusing the carrier bag as a waste bin
bag is better than simply throwing away the bag in the residual waste and it is better than
recycling. Recycling can potentially offer benefits in the case of heavy plastic bags, such as
PP, PET and polyester. Reuse as a waste bin bag is most beneficial for light carrier bags,
such as LDPE, paper and biopolymer. When reuse as a waste bin bag is not feasible, for ex-
ample when the bag can easily be punctured, torn, or wetted, as in the case of paper and
biopolymer bags, incineration is the most preferable solution from an environmental point of
view. Table II provides a summary of the results obtained for each carrier bag.
Table II. Overview of the most preferable end-of-life option for each of the carrier bag
types assessed.
Carrier bag material Preferable end-of-life after normal reuse
Plastic, LDPE Reuse as waste bin bag
Plastic, PP Recycle, reuse as waste bin bag if possible, else incinerate
Plastic, recycled PET Recycle, reuse as waste bin bag if possible, else incinerate
Plastic, polyester PET Reuse as waste bin bag if possible, else incinerate
Biopolymer Reuse as waste bin bag if possible, else incinerate
Paper Reuse as waste bin bag if possible, else incinerate
Textile Reuse as waste bin bag if possible, else incinerate
Composite Reuse as waste bin bag if possible, else incinerate
Which is the carrier bag providing the lowest environmental impacts?
In general with regards to production and disposal, LDPE carrier bags, which are the bags that
are always available for purchase in Danish supermarkets, are the carriers providing the over-
all lowest environmental impacts for most environmental indicators (Table III). In particular,
LDPE carrier bags with rigid handle provided in general the lowest environmental impacts in
the majority of the impact categories included in this LCA study. Carrier bags alternatives that
can provide a similar performance are unbleached paper and biopolymer bags, but for a lower
number of environmental indicators. Heavier carrier bags, such as PP, PET, polyester,
bleached paper and textile bags need to be reused multiple times in order to lower their envi-
ronmental production cost. Between the same bag types, woven PP carrier bags provided
lower impacts than non-woven PP bags, unbleached paper resulted more preferable than
bleached paper, and conventional cotton over organic cotton.
How many times should the carrier bags be reused?
For all carrier bags, reuse as many times as possible before disposal is strongly encouraged.
Table IV reports the number of calculated primary reuse times necessary to lower the envi-
ronmental impacts associated with all carrier bag alternatives to the levels of the LDPE carrier
bag. Therefore, the numbers reported in Table IV refer to minimum number of reuse times.
The number of calculated reuse times varies if only one environmental indicator is observed,
or if all environmental indicators are taken into account. The calculated number of reuse times
might be compliant with the lifetime of PP, PET and polyester carrier bags, but might surpass
the lifetime of bleached paper, composite and cotton carriers, especially considering all envi-
ronmental indicators. The number of calculated reuse times was rather uniform across impact
categories for LDPE carrier bags. For PP, PET, biopolymer and paper carrier bags, some

The Danish Environmental Protection Agency / LCA of grocery carrier bags 17
impact categories presented higher reuse times than others. Lastly, the very high number of
reuse times scored by cotton and composite bags is primarily due only to the ozone depletion
impact category, for which the cotton production dataset provides larger impacts than the
reference LDPE carrier bag.
Table III. Carrier bags providing the lowest environmental impacts for all the environ-
mental indicators considered. The order in which the bags are listed corresponds to the
raking of their LCA results starting from the lowest impact. Only the three lowest scor-
ing bags are listed. The results refer to the reference flow provided in Table I.
Environmental indicator Carrier bags providing lowest impacts
Climate change Paper unbleached, biopolymer, LDPE
Ozone depletion LDPE
Human toxicity, cancer effects Paper unbleached, LDPE
Human toxicity, non-cancer effects Composite, PP, LDPE
Photochemical ozone formation LDPE
Ionizing radiation LDPE
Particulate matter LDPE
Terrestrial acidification LDPE
Terrestrial eutrophication LDPE
Freshwater eutrophication LDPE
Marine eutrophication PP, LDPE
Ecosystem toxicity LDPE
Resource depletion, fossil Paper unbleached, LDPE
Resource depletion, abiotic PP, LDPE
Water resource depletion LDPE, biopolymer
Table IV. Calculated number of primary reuse times for the carrier bags in the rows, for
their most preferable disposal option, necessary to provide the same environmental
performance of the average LDPE carrier bag, reused as a waste bin bag before incin-
eration. The results refer to the reference flow provided in Table I.
LDPE average, reused as waste bin bag
Climate Change All indicators
LDPE simple, reused as waste bag 0 1
LDPE rigid handle, reused as waste bag 0 0
Recycled LDPE, reused as waste bag 1 2
PP, non-woven, recycled 6 52
PP, woven, recycled 5 45
Recycled PET, recycled 8 84
Polyester PET, recycled 2 35
Biopolymer, reused as waste bag or incinerated 0 42
Unbleached paper, reused as waste bag or incinerated 0 43
Bleached paper, reused as waste bag or incinerated 1 434
Organic cotton, reused as waste bag or incinerated 149 20000
4 The highest value for bleached paper is set to as minimum be equal to the value for unbleached paper.
18 The Danish Environmental Protection Agency / LCA of grocery carrier bags
Conventional cotton, reused as waste bag or incinerated 52 7100
Composite, reused as waste bag or incinerated 23 870
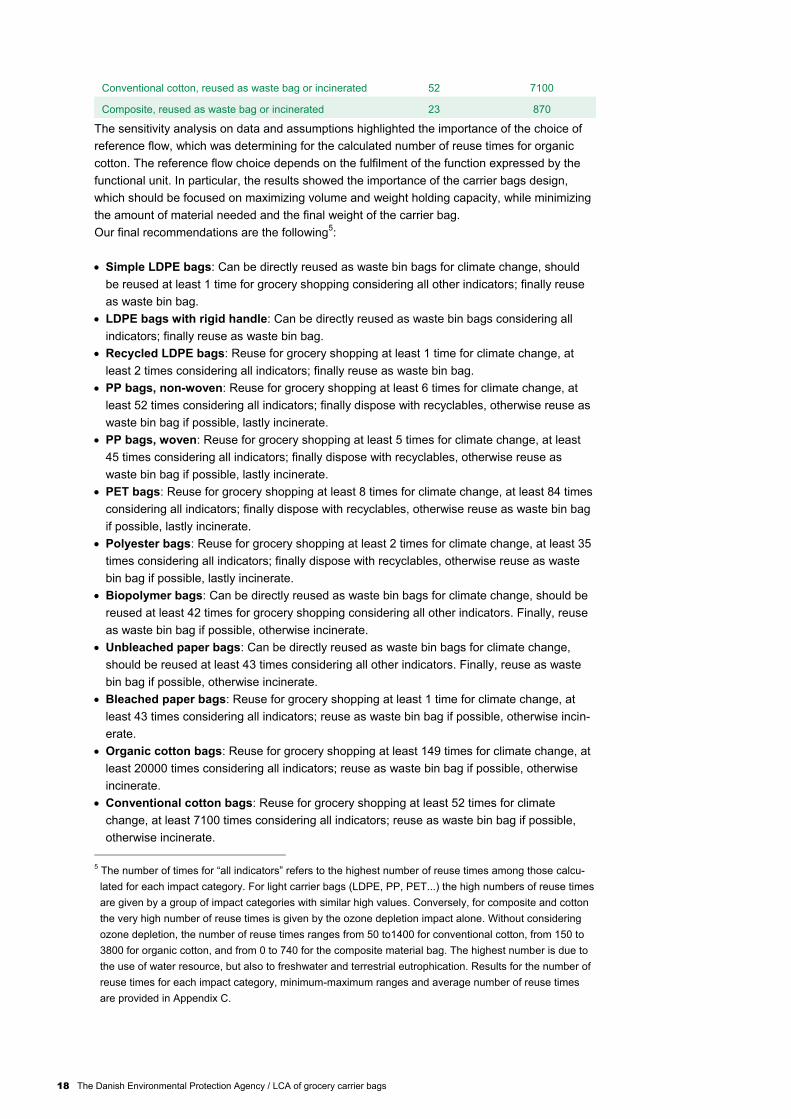
The sensitivity analysis on data and assumptions highlighted the importance of the choice of
reference flow, which was determining for the calculated number of reuse times for organic
cotton. The reference flow choice depends on the fulfilment of the function expressed by the
functional unit. In particular, the results showed the importance of the carrier bags design,
which should be focused on maximizing volume and weight holding capacity, while minimizing
the amount of material needed and the final weight of the carrier bag.
Our final recommendations are the following5:
Simple LDPE bags: Can be directly reused as waste bin bags for climate change, should
be reused at least 1 time for grocery shopping considering all other indicators; finally reuse
as waste bin bag.
LDPE bags with rigid handle: Can be directly reused as waste bin bags considering all
indicators; finally reuse as waste bin bag.
Recycled LDPE bags: Reuse for grocery shopping at least 1 time for climate change, at
least 2 times considering all indicators; finally reuse as waste bin bag.
PP bags, non-woven: Reuse for grocery shopping at least 6 times for climate change, at
least 52 times considering all indicators; finally dispose with recyclables, otherwise reuse as
waste bin bag if possible, lastly incinerate.
PP bags, woven: Reuse for grocery shopping at least 5 times for climate change, at least
45 times considering all indicators; finally dispose with recyclables, otherwise reuse as
waste bin bag if possible, lastly incinerate.
PET bags: Reuse for grocery shopping at least 8 times for climate change, at least 84 times
considering all indicators; finally dispose with recyclables, otherwise reuse as waste bin bag
if possible, lastly incinerate.
Polyester bags: Reuse for grocery shopping at least 2 times for climate change, at least 35
times considering all indicators; finally dispose with recyclables, otherwise reuse as waste
bin bag if possible, lastly incinerate.
Biopolymer bags: Can be directly reused as waste bin bags for climate change, should be
reused at least 42 times for grocery shopping considering all other indicators. Finally, reuse
as waste bin bag if possible, otherwise incinerate.
Unbleached paper bags: Can be directly reused as waste bin bags for climate change,
should be reused at least 43 times considering all other indicators. Finally, reuse as waste
bin bag if possible, otherwise incinerate.
Bleached paper bags: Reuse for grocery shopping at least 1 time for climate change, at
least 43 times considering all indicators; reuse as waste bin bag if possible, otherwise incin-
erate.
Organic cotton bags: Reuse for grocery shopping at least 149 times for climate change, at
least 20000 times considering all indicators; reuse as waste bin bag if possible, otherwise
incinerate.
Conventional cotton bags: Reuse for grocery shopping at least 52 times for climate
change, at least 7100 times considering all indicators; reuse as waste bin bag if possible,
otherwise incinerate.
5 The number of times for “all indicators” refers to the highest number of reuse times among those calcu-
lated for each impact category. For light carrier bags (LDPE, PP, PET...) the high numbers of reuse times
are given by a group of impact categories with similar high values. Conversely, for composite and cotton
the very high number of reuse times is given by the ozone depletion impact alone. Without considering
ozone depletion, the number of reuse times ranges from 50 to1400 for conventional cotton, from 150 to
3800 for organic cotton, and from 0 to 740 for the composite material bag. The highest number is due to
the use of water resource, but also to freshwater and terrestrial eutrophication. Results for the number of
reuse times for each impact category, minimum-maximum ranges and average number of reuse times
are provided in Appendix C.

The Danish Environmental Protection Agency / LCA of grocery carrier bags 19
Composite bags: Reuse for grocery shopping at least 23 times for climate change, at least
870 times considering all indicators; reuse as waste bin bag if possible, otherwise incinerate.
It should be considered that if the reference LDPE bag is reused for shopping, this will in-
crease the needed number of reuse times for the other bags proportionally. The results ob-
tained on the minimum number of reuse times are intended to raise the discussion among the
stakeholders on the effective expected lifetime of each carrier bag. While the calculated num-
ber of reuse times might be compliant with the functional lifetime of PP, PET and polyester
carrier bags, it might surpass the lifetime of bleached paper, composite and cotton carriers,
especially considering all environmental indicators.
Summary of the critical review
Reviewers
A critical review according to ISO 14040/14044 was performed by Line Geest Jakobsen and
Trine Lund Neidel from COWI A/S in January 2018.
Review process
The review process involved the following phases:
COWI conducted the first review in January 2018.
DTU answered to the questions raised by COWI and corrected the report according to the
outcomes of the review in January 2018.
COWI evaluated the corrections and compiled a final review statement.
The critical review from COWI can be found in full in Appendix D. The main points highlighted
in the critical review are provided below.
The LCA report has been reviewed with respect to compliance with the ISO 14040 and 14044
International Standards. The report was found to comply with the standards to a large extent.
The authors state that the report does not comply with the standard because an exchange with
a panel of experts was not made during the project phases.
The method chosen for selecting the functional unit and reference flow was verified with a
sensitivity analysis. The results of the sensitivity analysis showed that the choice of reference
flow influenced heavily the carrier bags with high impacts connected to production and with a
lower volume than the one expressed in the functional unit (mainly organic cotton). The au-
thors added a dedicated section on carrier bag design where they provide comments on the
influence of the carrier bag design on the results.
The critical review highlighted that specific attention should have been dedicated to data quali-
ty assessment and to the clear statement of critical assumptions. The authors added dedicat-
ed sections on data quality assessment, critical assumption and on the influence on data and
assumptions on the results. The influence of selected critical assumptions on the results was
assessed with a sensitivity analysis.
After the review, the authors added further specifications on the carrier bag types (e.g. polyes-
ter polymer type), adjusted language and typos, and added further details for improving the
overall understanding of the report.

20 The Danish Environmental Protection Agency / LCA of grocery carrier bags
Preface
This study provides the life cycle environmental impacts associated with the production, use
and disposal of selected grocery carrier bags available in Danish supermarkets in 2017.
The commissioner of the LCA is the Danish Environmental Protection Agency (Miljøstyrelsen).
The LCA was conducted by DTU Environment in the period October – December 2017, using
the EASETECH LCA model developed by DTU Environment for the environmental assess-
ment of waste management systems and environmental technologies. The LCA was conduct-
ed for assessing and comparing the environmental impacts associated with the grocery carrier
bags currently available in Danish supermarkets.
The LCA has been conducted according to the requirements outlined in DS/EN ISO Interna-
tional Standards 14040 and 14044; however, the report is not intended to strictly comply with
the standard. The report is intended for internal decision support at the Danish Environmental
Protection Agency as part of a wider range of assessments aiming at investigating possible
options for grocery carrier bags available in Danish supermarkets. The report has undergone a
peer review process outside the project group in January 2018 by Line Geest Jakobsen and
Trine Lund Neidel from COWI A/S.
The report was prepared by Valentina Bisinella, Paola Federica Albizzati, Thomas Fruergaard
Astrup, and Anders Damgaard from DTU Environment.
DTU, February 2018

The Danish Environmental Protection Agency / LCA of grocery carrier bags 21
List of Abbreviations
General
EOL End-of-life (as: “treatment”, “waste management” or “disposal”)
EOL1 Incineration
EOL2 Source segregation of recyclables and recycling
EOL3 Reuse as a waste bin bag before incineration
HDPE High-density polyethylene
LCA Life cycle assessment
LCI Life cycle inventory
LCIA Life cycle impact assessment
LDPE Low-density polyethylene
PE Persons equivalents (normalized LCA results)
PET Polyethylene terephthalate
PP Polypropylene
W Waste bin bag
Carrier bag scenarios
LDPEavg LDPE carrier bag, average characteristics (between LDPEs and LDPEh)
LDPEs LDPE carrier bag, simple
LDPEh LDPE carrier bag, rigid handle
LDPErec Recycled LDPE carrier bag
PP Non-woven PP carrier bag
PPwov Woven PP carrier bag
PETrec Recycled PET carrier bag
PETpol Polyester carrier bag
BP Starch-complexed biopolymer carrier bag
PAP Unbleached craft paper carrier bag
PAPb Bleached craft paper carrier bag
COTorg Organic cotton carrier bag
COT Conventional cotton carrier bag
COM Composite carrier bag (jute, PP, cotton)
Acronyms for the impact categories assessed by the LCA
CC Climate change
OD Ozone depletion
HTc Human toxicity, cancer effects
HTnc Human toxicity, non-cancer effects
POF Photochemical ozone formation
IR Ionizing radiation
PM Particulate matter
TA Terrestrial acidification
TE Terrestrial eutrophication
ME Marine eutrophication
FE Freshwater eutrophication
ET Ecosystem toxicity
RDfos Resource depletion, fossil
RD Resource depletion, abiotic
Water Water resource depletion

22 The Danish Environmental Protection Agency / LCA of grocery carrier bags
Key definitions
Primary reuse Reuse for the same function for which the product was produced.
For example, the function of grocery carrier bags is to contain and transport
groceries and goods from the supermarkets to the homes. Primary reuse of a
carrier bag would be reusing it for carrying goods and groceries from the
supermarkets to the homes.
Secondary reuse Reuse fulfilling a different function than the one for which the product was
produced.
For example, grocery carrier bags are produced to contain and transport
groceries and goods from the supermarkets to the homes. Secondary reuse
of a carrier bag could be used as a waste bin bag, bag for laundry, etc. Any
reuse that does not entail carrying goods and groceries from the supermar-
kets to the homes.
Single-use carrier bag Lightweight carrier bags intended to be used for one shopping trip from the
supermarkets to the homes.
Multiple-use carrier bag Durable carrier bags intended to be used for multiple shopping trips from the
supermarkets to the homes.
Grocery carrier bag Bag product, usually light, resistant and capacious, with the primary function
of containing and transporting goods and groceries from the supermarkets to
the homes.
Lightweight plastic
carrier bags
Single-use plastic carriers, commonly made of low-density or high-density
polyethylene plastic (LDPE or HDPE) with thickness below 50 microns (Euro-
pean Commission, 1994).
Very lightweight plastic
carrier bags
Small plastic carrier bags with thickness below 15 microns (European Com-
mission, 1994), which are available supermarkets free of charge as primary
packaging for loose food.

The Danish Environmental Protection Agency / LCA of grocery carrier bags 23
1. Introduction and objectives
This study was commissioned by the Danish Environmental Protection Agency (Miljøstyrelsen)
in order to assess the life cycle environmental impacts of the production, use and disposal of
different grocery carrier bags available for purchase in supermarkets in Denmark in 2017. This
Section provides the background on grocery carrier bags in Denmark and the aim of the study.
1.1 Background Carrier bags are used in supermarkets in order to carry grocery shopping and other items sold
at supermarkets from the shops to the homes. Grocery carrier bags are considered a form of
packaging and have been addressed in the European Parliament and Council Directive
94/62/EC on packaging and packaging waste (European Commission, 1994). The Directive,
which is currently in force, aims at limiting the production of packaging waste and promoting
recycling, reuse and other forms of waste recovery. Lightweight plastic carrier bags are single-
use plastic carriers6, commonly made of low-density or high-density polyethylene plastic
(LDPE or HDPE). These carriers are single-use in the sense that they are usually only used
for one shopping trip (European Commission, 2011). The environmental concerns associated
with plastic carrier bags include the use of non-renewable resources for production (such as
crude oil), the environmental impacts of their disposal and the effects of littering. In particular,
the Directive aimed at reducing the large consumption of single-use carrier bags in order to
ultimately reduce the amounts to be disposed.
Since 1993, Denmark has taken action against single-use plastic carrier bags by introducing a
tax on retailers. Currently, Danish supermarkets provide multiple-use carrier bags of different
materials (such as recyclable and non-recyclable plastic, paper and cotton) which can be
bought by customers at the cash register. These types of multiple-use carrier bags are de-
signed for a multiple number of uses and are intended to last longer, therefore requiring more
resources in their production and potentially more environmental impacts than a single-use
carrier bag. In order to compensate the impacts arising from their manufacturing phase, multi-
ple-use carrier bags need to be reused a number of times. However, due to the functionality
issue or customer attitude, if the reusable bags are thrown away before their desired number
of use, the environmental impacts may surpass those of single-use bags. Moreover, reuse of
the carrier bag can occur both as primary reuse (where the carrier bag is reused for the same
function for which it was produced, i.e. for carrying grocery shopping from the supermarket to
the home), or replacing other products as waste bin liners (secondary reuse).
1.2 Aim of the study The aim of this study is to identify the multiple-use carrier bag alternative with the best envi-
ronmental performance to be provided in Danish supermarkets. In order to do so, the study
aims to assess the environmental impacts associated with production, distribution, use and
disposal of the multiple-use carrier bags available for purchase in Danish supermarkets in
2017, for a range of environmental impacts. Three end-of-life options were taken into account
for the disposal. In particular, the study wishes to:
Identify the best disposal option for each carrier bag type within the identified end-of-life
options;
6 “Lightweight plastic carrier bags” shall mean plastic carrier bags with thickness below 50 microns
(European Commission, 1994).

24 The Danish Environmental Protection Agency / LCA of grocery carrier bags
Identify the multiple-use carrier bag alternative with the best environmental performance for
each of the investigated impact categories;
Define the number of times a multiple-use carrier bag would need to be reused in order to
provide a better environmental performance than another carrier bag alternative, for a range
of environmental indicators.
The study aims to obtain the number of reuse times taking into consideration primary and
secondary reuse, as well as separate collection and recycling of the material, between the
disposal options.
The environmental assessment of the carrier bag alternatives is carried out with Life Cycle
Assessment (LCA), a standardized methodology for quantifying environmental impacts of
providing, using and disposing of a product or providing a service throughout its life cycle (ISO,
2006). LCA takes into account the potential environmental impacts associated with resources
necessary to produce, use and dispose the product, and also the potential emissions that may
occur during its disposal. When material and energy resources are recovered, the system is
credited with the avoided potential emissions that would have been necessary in order to pro-
duce these resources. The LCA will be carried out with the EASETECH model developed at
DTU Environment (Clavreul et al., 2014). The goal definition of the LCA and the LCA method-
ology are provided in a dedicated Section.
The LCA modelling includes the actual multiple-use carrier bag options currently available for
purchase in Danish supermarkets, which were identified by a dedicated survey. In particular,
the modelling takes into account the material of the carrier bag, for example including whether
the material is virgin or recycled, recyclable or non-recyclable. The study will assess whether a
large variation exists within carrier-bag types, in terms of weight, volume, thickness, and carry-
ing capacity.
The present study only considers carrier bags available for purchase in Danish supermarkets
in 2017. Small very lightweight plastic carrier bags7, which are available in Danish supermar-
kets free of charge as primary packaging for loose food, were excluded from the scope of this
study, since they were not included in the 94/62/EC measures. This study does not include the
assessment of other types of carriers, such as personal bags or bags provided by other retail-
ers. The report does not consider behavioural changes or consequences of introducing further
economic measures. The study does not take into account economic consequences for retail-
ers and carrier bag producers. The environmental assessment does not take into account the
effects of littering.
7 “Very lightweight plastic carrier bags” shall mean plastic carrier bags with thickness below 15 microns
(European Commission, 1994).

The Danish Environmental Protection Agency / LCA of grocery carrier bags 25
2. Carrier bags
2.1 Carrier bag types Carrier bags are provided in supermarkets with the function to carry goods and groceries from
the supermarkets to the homes. Carrier bags must therefore be robust and large enough to
hold a certain amount of items, while at the same time being economically convenient. Carrier
bags can be made of plastic materials of fossil origin, such as low- or high-density polyeth-
ylene (LDPE/HDPE), polypropylene (PP), polyethylene terephthalate (PET) and polyester.
Alternative plastic materials composed of carbon of biogenic origin can also be used, such as
polyester-complexed starch biopolymer. Other materials used for carrier bags are paper and
textiles. A few types of carrier bags are described below. All the bags analysed in this report
are intended to be used multiple times.
Low-density polyethylene (LDPE) bags
Plastic bags formed from an LDPE plastic melt, which is blown and sealed to form a bag.
Figure 1 provides two examples of LDPE carrier bag: one with simple handle, one with a rig-
id handle.
a) b)
Figure 1. Examples of LDPE carrier bags with (a) simple handle (Paxonplastic, 2018)
and (b) rigid handle (C-bags, 2018).
Non-woven polypropylene (PP) bags
Plastic bags formed from molten filament of PP, which is spun bonded. Non-woven PP bags
are stronger, more durable and generally larger in volume than LDPE carrier bags and are
intended to be reused many times (Edwards and Fry, 2011). Figure 2 provides an example
of non-woven PP bags and of the fabric type.
a)
b)
Figure 2. Examples of non-woven PP bags (a) (Indiamart, 2018) and (b) detail of the non-
woven PP fabric (Bharatcottons, 2018).

26 The Danish Environmental Protection Agency / LCA of grocery carrier bags
Woven polypropylene (PP) bags
Plastic bags obtained from weaving PP fibres. Just like non-woven PP bags, these bags are
usually stronger and more durable than LDPE carrier bags. Figure 3 provides an example of
woven PP bags and fabric.
a) b)
Figure 3. Example of a woven PP bag (a) (Indiamart, 2018b) and (b) detail of the woven
PP fabric (Bagsupplies, 2018).
Recycled polyethylene terephthalate (PET) bags
Plastic bags obtained from weaving molten fibres from recycled PET pellets. Strong and du-
rable, intended for multiple-use. An example is provided in Figure 4.
Figure 4. Example of recycled PET bag (Customgrocerybags, 2018).
Polyester bags
Plastic bags obtained from weaving polyester fibres. These polyester fibres are obtained
from processing other polymer types, such as PP or PET, and are usually thinner and lighter
than the original polymers, resulting in a very light and foldable multiple-reuse bag. An ex-
ample is provided in Figure 5.
Figure 5. Example of a polyester carrier bag (Aliexpress, 2018).

The Danish Environmental Protection Agency / LCA of grocery carrier bags 27
Biopolymer bags
Biopolymer bags are usually composed by either polylactic acid (PLA) or starch polyester
blends, which are compostable materials able to decompose in in aerobic environments that
are maintained under specific controlled temperature and humidity conditions (ASTM, 2018).
An example is provided in Figure 6. These carrier bags are usually less resistant than LDPE
bags. The biodegradability of these polymers is debated in the scientific community. Most of
the materials are only biodegradable in full scale facilities (compost or anaerobic) run at high
enough temperatures, and there can still be partial plastic parts left at the end of treatment,
In most natural environments only a small part of the plastic will degrade (Emadian et al.,
2017)
Figure 6. Example of biopolymer bags (Ecostoviglie, 2018).
Paper bags
Carrier bags obtained from craft paper, which is glued to form the bag. This type of carrier
bag has become less used since the 1970s, replaced by plastic bags that do not tear when
wet (Edwards and Fry, 2011). An example is provided in Figure 7.
Figure 7. Example of a paper bag (Natuerlich-verpacken, 2018).
Textile bags
Bags made of woven cotton or jute, intended to be reused many times. Textile bags can be
made of organic or conventional textiles. Figure 8 provides an example of a cotton bag.
Figure 8. Example of cotton carrier bag (Amazon, 2018).

28 The Danish Environmental Protection Agency / LCA of grocery carrier bags
Composite bags
Bags made of multiple material types, such as textile and plastic. An example is provided in
Figure 9 below, where plastic handles are attached to a jute bag.
Figure 9. Example of composite bag (Topcottonbags, 2018).
2.2 Carrier bags available in Denmark Since this study focuses on the multiple-use carrier bag alternatives available for purchase in
Danish supermarkets in 2017, we have conducted a survey in order to identify the carrier bag
alternatives on which to carry out the environmental assessment. The survey was conducted
in September – October 2017 as part of a Master thesis project work at DTU Environment
(Alonso Altonaga, 2017).
The survey involved collecting all types of carrier bags available in Danish supermarkets. The
survey involved a total of 19 retailers: Fakta, Fakta Q, Superbrugsen, Dagli' Brugsen, Irma,
Kvickly, Netto, Føtex food, Føtex, Bilka, 7-eleven, Rema 1000, Lidl, Aldi, Meny, Spar, Min
købmand, Let-Køb, and Løvbjerg. The material of each carrier bag was identified based on the
labelling on the carrier bag and it was verified with material analysis via infrared spectroscopy.
The number of number of carrier bags surveyed per material type was reported. Then, we
analysed the weight, volume, thickness and weight holding capacity (measured as tensile
strength at the point where the material started to stretch or broke) for each of the carrier bags.
Table 1 shows the material and the material type of the carrier bags available for purchase in
Danish supermarkets in 2017, with detail on the retailers providing each type of bag. For each
type of carrier bag, Table 2 provides the number of items identified by the survey, the average
weight of the bag, the average volume, the average thickness and average weight holding
capacity.
The total number of carrier bag types available in Danish supermarkets which was identified in
the project was 40. The virgin LDPE plastic bag was identified as the most commonly available
bag in Danish supermarkets with 23 items. In particular, the survey indicated that an LDPE
carrier bag can always be found for purchase in all supermarkets, regardless of the retail chain
they belong to. Two retailers provided also LDPE bags made of recycled LDPE, on top of
virgin LDPE plastic bags. Both virgin and recycled LDPE grocery carrier bags were found in
two versions: one with a rigid handle (of the same material; “LDPE rigid handle” in Table 2)
and a simple type, with a handle of the same thickness of the bag (“LDPE simple” in Table 2).
The same retailer often provided both types of LDPE carrier bags. All remaining types of carri-
er bags were considerably less abundant, scoring a total of 1 to 3 items. This reflects the fact
that some retailers provided other types of carrier bags as an alternative to the most common
LDPE carrier bag. The material types of such carrier bag types were woven and non-woven
PP, recycled PET, polyester of virgin PET fibres, biodegradable plastic, craft paper, cotton
(organic and conventional). One bag type presented composite characteristics, with jute, PP
and cotton materials combined. Often the alternatives to LDPE were heavier, multiple-use-
oriented carrier bags, as in the case on woven and non-woven PP, recycled PET and cotton

The Danish Environmental Protection Agency / LCA of grocery carrier bags 29
bags. Nine supermarkets provided at least one alternative to the LDPE carrier bag. Irma was
the supermarket with the largest number of alternative options for the choice of carrier bag.
Table 1. Material and material type of the multiple-use carrier bags available for pur-
chase in Danish supermarkets in 2017, subdivided by retailer. (*) indicates that the
LDPE carrier bags are available both as virgin plastic and recycled plastic.
Material Type
Fakta
Fakta
Q
Su
perb
rug
se
n
Dag
li B
rug
se
n
Irm
a
Kvic
kly
Nett
o
Fø
tex f
oo
d
Fø
tex
Bilka
7-e
leve
n
Rem
a 1
000
Lid
l
Ald
i
Men
y
Sp
ar
Min
kø
bm
an
d
Let-
Kø
b
Lø
vb
jerg
Plastic LDPE simple
X X X X
X X X X X* X*
X X
Plastic LDPE rigid handle X X X
X X X X X
X X*
X X X
X
Plastic PP non-woven X
X
X
Plastic PP woven
X
X
X
Plastic PET recycled
X
Plastic Polyester, PET
X
Bioplastic Biopolymer
X
Paper Paper
X
Textile Cotton organic
X
Textile Cotton conventional
X X
Composite Jute, PP, cotton
X
The carrier bags identified in the survey varied in terms of weight, volume, thickness and
weight holding capacity, as presented in Table 2. We could identify a direct correlation be-
tween thickness and weight of the bag. The larger the thickness, the more material was em-
ployed and the heavier the carrier bag. Table 2 indicates that LDPE and biopolymer plastic
bags presented the lowest average thickness and weight. When the LDPE carrier bag was
equipped with a rigid handle, the overall average weight of the carrier bag was larger (high-
lighted in grey and italics in Table 2). Paper carrier bags presented the second-lowest average
thickness and weight. On the other hand, woven and non-woven PP, recycled PET, PET poly-
ester, cotton and composite carrier bags presented considerably larger weight. The average
weight holding capacity generally follows the same trend of weight of the bag and thickness,
with thicker bags generally providing a larger holding capacity, with exception of paper bags.
On the other hand, the volume of the bag was not related to weight or thickness. Simple LDPE
bags presented the lowest volume, followed by biopolymer, organic cotton and LDPE bags
with rigid handle. The largest volumes were recorded for woven PP and recycled PET bags
After the first draft of the report was provided to Miljøstyrelsen and stakeholders, the stake-
holders in the project group highlighted that another conventional cotton bag was available for
purchase from one of the retailers. This cotton bag presents a larger volume (31 litres) and
lower weight (120 grams), which would change the average weight of the cotton bag present-
ed in Table 2 to 195 grams and a volume of 28 litres. The latter average characteristics were
not included in the modelling, but were used in the discussion of the results.
Overall, the survey allowed identifying important aspects that need to be taken into account
when carrying out the LCA of carrier bag alternatives:
LDPE carrier bags are the most common type of carrier bag and the carrier bag type that
can always be found in Danish supermarkets. Therefore, the LCA study should take this car-

30 The Danish Environmental Protection Agency / LCA of grocery carrier bags
rier bag as baseline and compare how many times the other carrier bags should be reused
in order to reach a similar environmental performance.
The carrier bags have considerable differences in weight, and bags with larger weight are
likely to have larger environmental impacts due to the larger amount of material required to
manufacture the grocery carrier bag.
The bags have different characteristics and cannot all cover the same functionality. The
functional unit has to be tailored in a way that a fair comparison is provided.
Table 2. Survey results of the grocery carrier bags.
Material Type Number
of items
Average
weight
(g)
Average
volume
(L)
Average
thickness
(mm)
Average weight
holding capacity
(kg)
Plastic LDPE 23 24.2 22.4 0.04 12.0
Plastic LDPE simple 10 17.9 19.2 0.04 10.5
Plastic LDPE rigid handle 13 29.0 24.8 0.05 13.2
Plastic LDPE recycled 3 24.9 21.7 0.05 10.7
Plastic LDPE recycled, simple 1 14.7 15.0 0.04 8.0
Plastic LDPE recycled, rigid handle 2 30.0 25.0 0.05 12.0
Plastic PP non-woven 2 137.0 29.0 0.50 36.0
Plastic PP woven 3 118.7 36.7 0.35 41.0
Plastic PET recycled 2 159.0 42.0 0.60 45.0
Plastic PET polyester 1 48.0 32.0 0.10 45.0
Bioplastic Biopolymer 1 18.2 22.0 0.04 12.0*
Paper Paper 1 44.7 23.0 0.12 12.0*
Textile Cotton organic 1 252.0 20.0 1.40 50.0
Textile Cotton conventional 2 232.0 27.0 0.93 50.0
Composite Jute, PP, cotton 1 282.0 32.0 0.70 50.0
* The average weight holding capacity was 12 kg, but the samples of these types of carrier bags present-
ed the highest variation of weight holding capacity. For example, the bags were easily torn if containing
items with sharp edges.

The Danish Environmental Protection Agency / LCA of grocery carrier bags 31
3. LCA Methodology
The LCA carried out for this study was conducted according to the requirements outlined in the
International Standards 14040 and 14044 (ISO, 2006a, 2006b). The present Section provides
a detailed description of the LCA methodology utilized for the study: the goal of the LCA, func-
tional unit and reference flow, the system boundaries, the choices for the modelling approach
for addressing multi-functionality, the modelling tools, data requirements, impact assessment
method, assumptions and limitations.
The final receiver of the study is the Danish Environmental Protection Agency and the study
might ultimately be used for internal decision support at the Danish Environmental Protection
Agency as part of a wider range of assessments aiming at investigating possible options for
grocery carrier bags. This means that even if the report could be disclosed to third parties, the
report does not strictly comply with the standard. The reason for this lack of compliance is that
the report has undergone external peer review by COWI A/S, but not by a panel of experts
throughout the development of the project as required by the standard.
The contract for the project did not budget for extensive data collection, which means that
there were pre-specified limitations on the amount of data that could be gathered for the study.
Therefore, most of the data used are based on publicly available LCI data and data from exist-
ing LCA studies on grocery carrier bags.
3.1 LCA goal definition The goal of this study was to provide the Danish Environmental Protection Agency with the
potential life cycle environmental impacts associated with a range of alternative types of multi-
ple-use carrier bags. The aim of the study was to:
identify the best disposal option for each carrier bag type within the identified end-of-life
options;
identify the multiple-use carrier bag alternative with the best environmental performance for
each of the investigated impact categories;
identify the number of times each multiple-use bag would need to be reused to lower the
environmental impacts connected to its production and in comparison to other carrier bag
alternatives, based on different reuse and disposal options.
The carrier bag alternatives investigated were those available for purchase in Danish super-
markets in 2017. The comparative analysis was carried out with respect to a range of envi-
ronmental impacts and taking into account three different end-of-life options: incineration,
recycling, and secondary reuse as a waste bin bag before being incinerated. The number of
reuse times was calculated as primary reuse, i.e. complying with the function for which the
carrier bag was produced. The scenarios are described in detail in Section 4.
The target audience of the LCA is the Danish Environmental Protection Agency. The study
might ultimately be used for internal decision support at the Danish Environmental Protection
Agency as part of a wider range of assessments aiming at investigating possible options for
managing waste grocery carrier bags.
3.2 Functional unit The role of the functional unit definition in LCA is to ensure that the environmental assessment
of the products is based on a fair basis for comparison, in this case the fulfilment of the same

32 The Danish Environmental Protection Agency / LCA of grocery carrier bags
functionality. This is particularly important in the case of carrier bags, where different types and
materials can provide different functionalities in terms of number of uses, resistance to punc-
turing and tearing, resistance to water, weight holding capacity, and so on. As explained in
Section 2, different carrier bag types have different weight, and carrier bags intended to last
longer, with larger thickness and weight, commonly require more resources for their production
and therefore are likely to provide larger environmental impacts than lighter bags on a bag-to-
bag comparison.
Previous LCA studies on carrier bags have compared different carrier bag types based func-
tional unit such as “carrying grocery shopping to the home for a defined amount of time (and
amount of items) in a defined year” (i.e. Environment Agency, 2011; Environment Australia,
2002). These studies calculated the number of each type of bag required to fulfil the defined
function, where the impacts associated with multiple-use carrier bags were “discounted”,
meaning that the environmental impacts associated with these bags were divided by the num-
ber of reuse times expected for that type of bag (Edwards and Fry, 2011).
For this study, we defined a functional unit that allowed a fair basis for comparison for the
grocery carrier bags, but that also allowed to identify the number of required reuse times on
the basis of the environmental impacts associated with each bag, instead of using initial as-
sumptions on the potential carrier bag reuse time and overall lifetime. Then, the calculated
number of reuse times based on environmental performance is intended to raise the discus-
sion among the stakeholders on the effective expected lifetime of each carrier bag. The func-
tional unit chosen for this study was:
Carrying one time grocery shopping with an average volume of 22 litres and with an
average weight of 12 kilograms from Danish supermarkets to homes in 2017 with a
(newly purchased) carrier bag. The carrier bag is produced in Europe and distributed to
Danish supermarkets. After use, the carrier bag is collected by the Danish waste man-
agement system.
The functional unit chosen corresponds to carrying grocery shopping home for one shopping
with a virgin LDPE carrier bag with average characteristics. The volume and the weight for the
grocery shopping specified in the functional unit correspond to the average volume and weight
holding capacity of the carrier bag always available in all Danish supermarkets, which is virgin
LDPE. Ideally, the customer at the Danish supermarket could buy this type of bag for every
shopping. This type of functional unit allows comparing different types of carrier bags as if they
were all bought at the same time for one shopping. The volume and weight chosen allow com-
paring the other bag types to the most common carrier bag options: some carrier bags will not
fulfil the volume or weight holding requirement, therefore needing a purchase of two instead of
one.
The carrier bags considered for this study are assumed to be produced in Europe and distrib-
uted to Danish supermarkets. After being used, the bags are collected within the Danish waste
management system, which handles also the packaging required for the distribution of the
bags.
The number of reuse times for the carrier bag alternatives will be calculated as: how many
times would this alternative carrier bag type need to be reused in order to provide a better
environmental performance than an average virgin LDPE carrier bag, while fulfilling the same
function? The functional unit defined for this study did not cover prevention strategies, nor
consumer behaviour or behavioural changes. The functional unit does not target a specific
group or age of customers and does not cover typical or average shopping preferences or
behaviour.
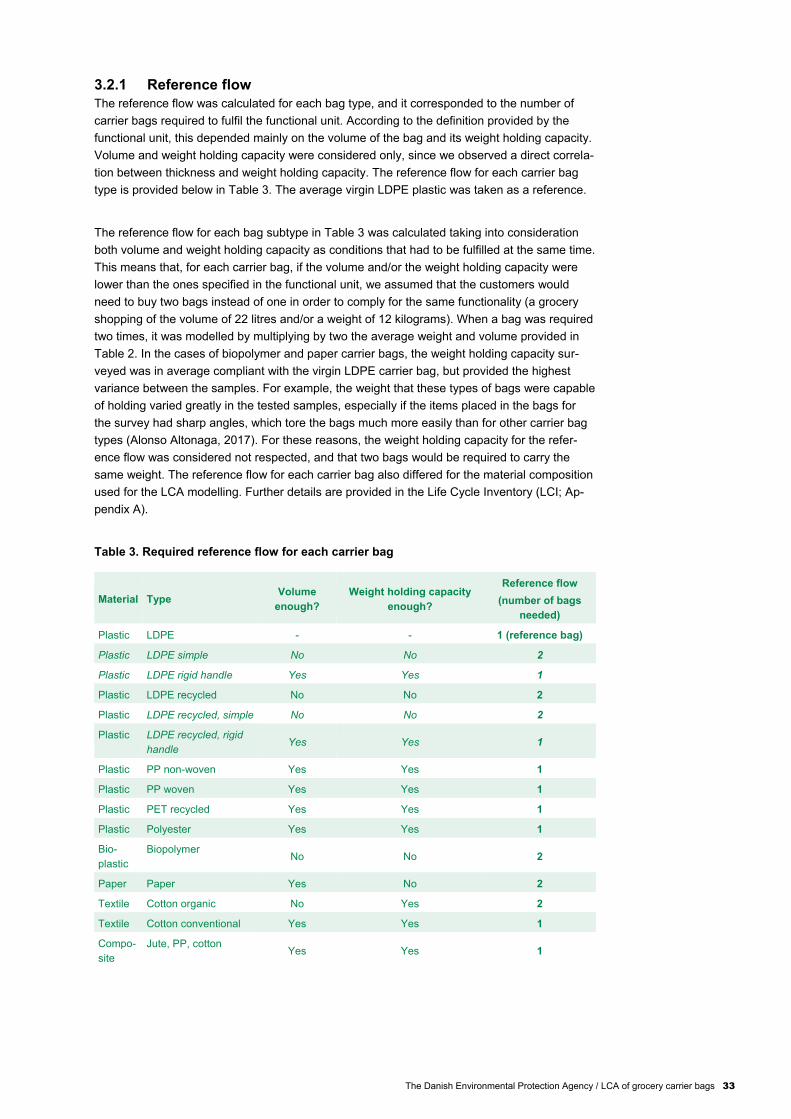
The Danish Environmental Protection Agency / LCA of grocery carrier bags 33
3.2.1 Reference flow
The reference flow was calculated for each bag type, and it corresponded to the number of
carrier bags required to fulfil the functional unit. According to the definition provided by the
functional unit, this depended mainly on the volume of the bag and its weight holding capacity.
Volume and weight holding capacity were considered only, since we observed a direct correla-
tion between thickness and weight holding capacity. The reference flow for each carrier bag
type is provided below in Table 3. The average virgin LDPE plastic was taken as a reference.
The reference flow for each bag subtype in Table 3 was calculated taking into consideration
both volume and weight holding capacity as conditions that had to be fulfilled at the same time.
This means that, for each carrier bag, if the volume and/or the weight holding capacity were
lower than the ones specified in the functional unit, we assumed that the customers would
need to buy two bags instead of one in order to comply for the same functionality (a grocery
shopping of the volume of 22 litres and/or a weight of 12 kilograms). When a bag was required
two times, it was modelled by multiplying by two the average weight and volume provided in
Table 2. In the cases of biopolymer and paper carrier bags, the weight holding capacity sur-
veyed was in average compliant with the virgin LDPE carrier bag, but provided the highest
variance between the samples. For example, the weight that these types of bags were capable
of holding varied greatly in the tested samples, especially if the items placed in the bags for
the survey had sharp angles, which tore the bags much more easily than for other carrier bag
types (Alonso Altonaga, 2017). For these reasons, the weight holding capacity for the refer-
ence flow was considered not respected, and that two bags would be required to carry the
same weight. The reference flow for each carrier bag also differed for the material composition
used for the LCA modelling. Further details are provided in the Life Cycle Inventory (LCI; Ap-
pendix A).
Table 3. Required reference flow for each carrier bag
Material Type Volume
enough?
Weight holding capacity
enough?
Reference flow
(number of bags
needed)
Plastic LDPE - - 1 (reference bag)
Plastic LDPE simple No No 2
Plastic LDPE rigid handle Yes Yes 1
Plastic LDPE recycled No No 2
Plastic LDPE recycled, simple No No 2
Plastic LDPE recycled, rigid
handle Yes Yes 1
Plastic PP non-woven Yes Yes 1
Plastic PP woven Yes Yes 1
Plastic PET recycled Yes Yes 1
Plastic Polyester Yes Yes 1
Bio-
plastic
Biopolymer No No 2
Paper Paper Yes No 2
Textile Cotton organic No Yes 2
Textile Cotton conventional Yes Yes 1
Compo-
site
Jute, PP, cotton Yes Yes 1

34 The Danish Environmental Protection Agency / LCA of grocery carrier bags
3.3 System boundaries The time horizon of the impacts in this LCA was 100 years. The geographical scope was Eu-
rope. The temporal scope was 2017. The LCA was a “cradle-to-grave” LCA, meaning that for
each carrier bag were taken into account the environmental impacts of all its life-cycle stages,
from production of the carrier bag material, manufacturing of the carrier bag and distribution, to
use and end-of-life.
The system boundaries included production of energy and material resources required for the
production of the carrier bags, as well as production of the packaging used for the distribution
of the bags. These required resources were production of electricity and heat, production of
the main carrier bag material (such as LDPE) and ancillary materials (such as ink, glue). In
accordance with the project partners, the production of the carrier bags and the packaging for
distribution was set to occur in Europe. Production of the carrier bag material and other ancil-
lary materials could occur anywhere in the world, as the materials were assumed to be re-
trieved from the market. The carrier bags were assumed to be distributed to Danish supermar-
kets by road transportation and using cardboard packaging. Production of transportation fuel
was included in the assessment.
The assessment assumed zero emissions arising from the use phase. The LCA included the
production of energy and material resources required to collect, treat and manage the carrier
bag once it was collected by the Danish waste management system. In particular, the as-
sessment took into account direct emissions occurring to air, water and soil during the waste
management phase, as well as avoided processes (i.e. avoided production of primary materi-
als and energy substituted by the residues). The waste management processes were set to
occur partly in Denmark (collection, transport and incineration) and partly in other European
countries (transport, recycling and final disposal of rejects).
Capital goods, as the construction of facilities and production of machineries and transporta-
tion were not included. In accordance with the project partners, the system boundaries do not
include small very lightweight plastic carrier bags and other types of carriers, such as personal
bags or bags provided by other retailers. The report does not consider behavioural changes or
consequences of introducing further economic measures. The study does not take into ac-
count economic consequences for retailers and carrier bag producers. The environmental
assessment does not take into account the effects of littering.
3.4 Modelling approach and allocation of multi-functionality The LCA involved consequences that resulted in additionally installed (or additionally decom-
missioned) equipment/capacity outside the boundary of the foreground systems. The model-
ling approach used was consequential LCA. Multi-functionality in the model was addressed by
system expansion. This means that co-products generated along with the main service provid-
ed by the scenarios, i.e. treatment of the residues, were assumed to displace those products
in the market that were likely to react to changes in demand/supply induced by the investigat-
ed scenarios. These technologies were referred to as “marginal technologies” and are dis-
cussed in detail in Appendix B. Examples are the energy produced from the incineration of the
waste, and recovered material from the recycling processes.
The marginal energy technologies were chosen with the project partners and are described in
detail in Appendix B. The energy marginal technologies have a future outlook and were de-
fined for the period 2020 – 2030. Since the study is going to support decisions that will occur in
a 10 year period, using a future marginal energy was assumed to represent the effects of such
choices in the future waste management system.
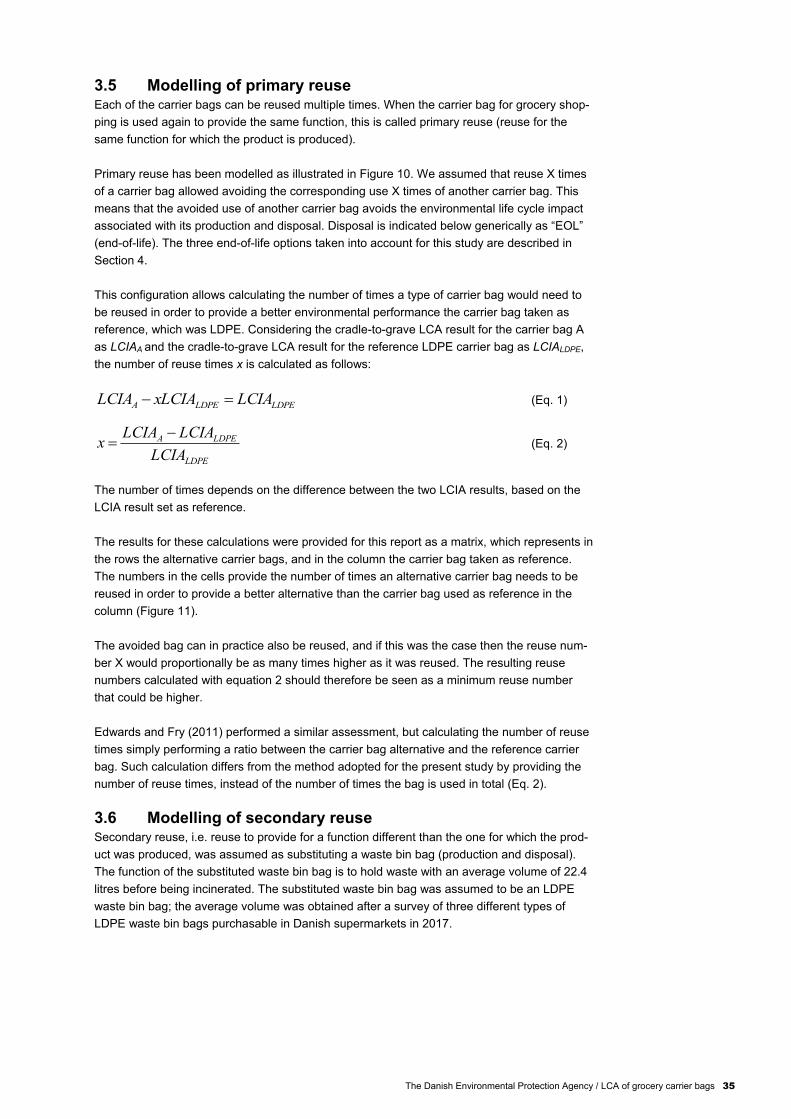
The Danish Environmental Protection Agency / LCA of grocery carrier bags 35
3.5 Modelling of primary reuse Each of the carrier bags can be reused multiple times. When the carrier bag for grocery shop-
ping is used again to provide the same function, this is called primary reuse (reuse for the
same function for which the product is produced).
Primary reuse has been modelled as illustrated in Figure 10. We assumed that reuse X times
of a carrier bag allowed avoiding the corresponding use X times of another carrier bag. This
means that the avoided use of another carrier bag avoids the environmental life cycle impact
associated with its production and disposal. Disposal is indicated below generically as “EOL”
(end-of-life). The three end-of-life options taken into account for this study are described in
Section 4.
This configuration allows calculating the number of times a type of carrier bag would need to
be reused in order to provide a better environmental performance the carrier bag taken as
reference, which was LDPE. Considering the cradle-to-grave LCA result for the carrier bag A
as LCIAA and the cradle-to-grave LCA result for the reference LDPE carrier bag as LCIALDPE,
the number of reuse times x is calculated as follows:
LDPELDPEA LCIAxLCIALCIA (Eq. 1)
LDPE
LDPEA
LCIA
LCIALCIAx
(Eq. 2)
The number of times depends on the difference between the two LCIA results, based on the
LCIA result set as reference.
The results for these calculations were provided for this report as a matrix, which represents in
the rows the alternative carrier bags, and in the column the carrier bag taken as reference.
The numbers in the cells provide the number of times an alternative carrier bag needs to be
reused in order to provide a better alternative than the carrier bag used as reference in the
column (Figure 11).
The avoided bag can in practice also be reused, and if this was the case then the reuse num-
ber X would proportionally be as many times higher as it was reused. The resulting reuse
numbers calculated with equation 2 should therefore be seen as a minimum reuse number
that could be higher.
Edwards and Fry (2011) performed a similar assessment, but calculating the number of reuse
times simply performing a ratio between the carrier bag alternative and the reference carrier
bag. Such calculation differs from the method adopted for the present study by providing the
number of reuse times, instead of the number of times the bag is used in total (Eq. 2).
3.6 Modelling of secondary reuse Secondary reuse, i.e. reuse to provide for a function different than the one for which the prod-
uct was produced, was assumed as substituting a waste bin bag (production and disposal).
The function of the substituted waste bin bag is to hold waste with an average volume of 22.4
litres before being incinerated. The substituted waste bin bag was assumed to be an LDPE
waste bin bag; the average volume was obtained after a survey of three different types of
LDPE waste bin bags purchasable in Danish supermarkets in 2017.
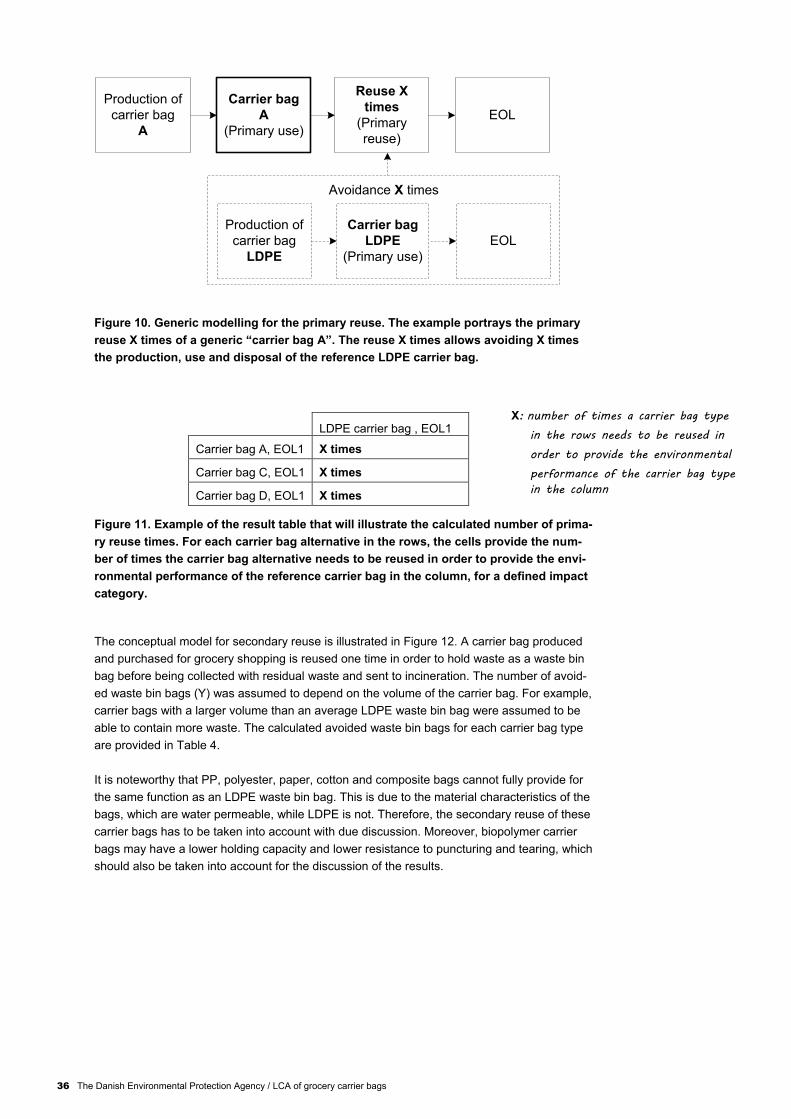
36 The Danish Environmental Protection Agency / LCA of grocery carrier bags
Figure 10. Generic modelling for the primary reuse. The example portrays the primary
reuse X times of a generic “carrier bag A”. The reuse X times allows avoiding X times
the production, use and disposal of the reference LDPE carrier bag.
LDPE carrier bag , EOL1
Carrier bag A, EOL1 X times
Carrier bag C, EOL1 X times
Carrier bag D, EOL1 X times
Figure 11. Example of the result table that will illustrate the calculated number of prima-
ry reuse times. For each carrier bag alternative in the rows, the cells provide the num-
ber of times the carrier bag alternative needs to be reused in order to provide the envi-
ronmental performance of the reference carrier bag in the column, for a defined impact
category.
The conceptual model for secondary reuse is illustrated in Figure 12. A carrier bag produced
and purchased for grocery shopping is reused one time in order to hold waste as a waste bin
bag before being collected with residual waste and sent to incineration. The number of avoid-
ed waste bin bags (Y) was assumed to depend on the volume of the carrier bag. For example,
carrier bags with a larger volume than an average LDPE waste bin bag were assumed to be
able to contain more waste. The calculated avoided waste bin bags for each carrier bag type
are provided in Table 4.
It is noteworthy that PP, polyester, paper, cotton and composite bags cannot fully provide for
the same function as an LDPE waste bin bag. This is due to the material characteristics of the
bags, which are water permeable, while LDPE is not. Therefore, the secondary reuse of these
carrier bags has to be taken into account with due discussion. Moreover, biopolymer carrier
bags may have a lower holding capacity and lower resistance to puncturing and tearing, which
should also be taken into account for the discussion of the results.
Carrier bag
A
(Primary use)
EOL
Reuse X
times
(Primary
reuse)
Production of
carrier bag
A
Carrier bag
LDPE
(Primary use)
EOL
Production of
carrier bag
LDPE
Avoidance X times
X: number of times a carrier bag type
in the rows needs to be reused in
order to provide the environmental
performance of the carrier bag type
in the column

The Danish Environmental Protection Agency / LCA of grocery carrier bags 37
Figure 12. Generic modelling for the secondary reuse. The example portrays the sec-
ondary avoided number Y of produced as disposed waste bin bags for the secondary
reuse of one carrier bag A.
Table 4. Number of avoided waste bin bags per carrier bag alternative.
Material Type Reference flow
(number of bags needed)
Volume
available
(L)
Y: number of
avoided waste bin
bags (fraction)
Plastic LDPE 1 (reference bag) 22.4 1.0
Plastic LDPE simple 2 38.4 1.7
Plastic LDPE rigid handle 1 24.8 1.1
Plastic LDPE recycled 2 43.3 1.9
Plastic LDPE recycled, simple 2 30.0 1.3
Plastic LDPE recycled, rigid handle 2 50.0 2.2
Plastic PP non-woven 1 29.0 1.3*
Plastic PP woven 1 36.7 1.6*
Plastic PET recycled 1 42.0 1.9*
Plastic Polyester 1 32.0 1.4*
Bioplastic Biopolymer 2 44.0 2.0*
Paper Paper 2 46.0 2.1*
Textile Cotton organic 2 40.0 1.8*
Textile Cotton conventional 1 27.0 1.2*
Composite Jute, PP, cotton 1 32.0 1.4*
* The indicated carrier bag alternatives cannot fully provide for the LDPE waste bin bag functionality due to
their water permeability; the biopolymer bag could be less resistant to tearing.
3.7 Modelling tools The study was carried out with the waste-LCA model EASETECH (Clavreul et al., 2014),
which was developed at DTU Environment and used for this assessment. EASETECH allows
modelling of the flow of material in the LCA as a mix of material fractions (e.g. plastic, paper,
etc.) and tracking their physico-chemical properties (e.g. energy content, fossil carbon, etc.)
throughout the modelled life-cycle steps. The tracking of the material composition on top of the
conventional mass flow-based LCA allows consumption and production of resources to be
based on the physico-chemical properties of the functional unit, and especially to express
emissions occurring during the end-of-life phases as a function of its chemical composition
(e.g. fossil carbon emitted during incineration).
Carrier bag
A
(Primary use)
EOL:
Incineration
Reuse 1 time
as waste bag
(Secondary
reuse)
Production of
carrier bag
A
Use of waste
bin bag
EOL:
Incineration
Production of
waste bin bag
Avoidance Y times
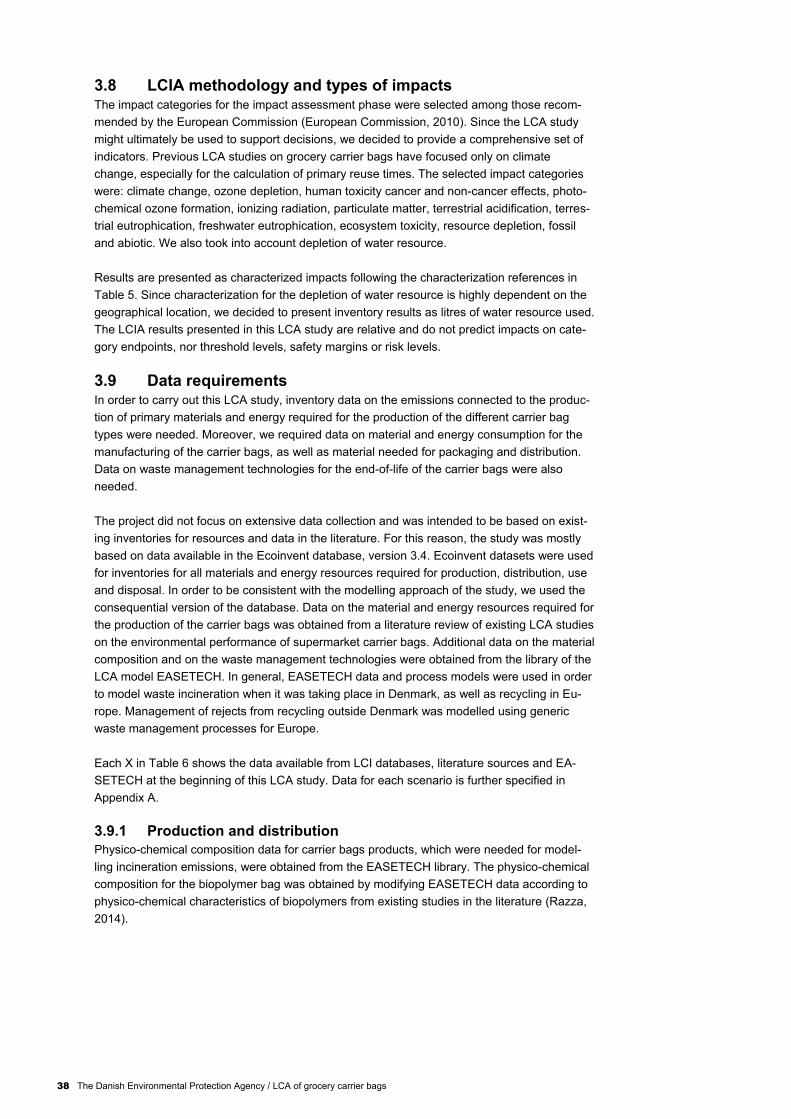
38 The Danish Environmental Protection Agency / LCA of grocery carrier bags
3.8 LCIA methodology and types of impacts The impact categories for the impact assessment phase were selected among those recom-
mended by the European Commission (European Commission, 2010). Since the LCA study
might ultimately be used to support decisions, we decided to provide a comprehensive set of
indicators. Previous LCA studies on grocery carrier bags have focused only on climate
change, especially for the calculation of primary reuse times. The selected impact categories
were: climate change, ozone depletion, human toxicity cancer and non-cancer effects, photo-
chemical ozone formation, ionizing radiation, particulate matter, terrestrial acidification, terres-
trial eutrophication, freshwater eutrophication, ecosystem toxicity, resource depletion, fossil
and abiotic. We also took into account depletion of water resource.
Results are presented as characterized impacts following the characterization references in
Table 5. Since characterization for the depletion of water resource is highly dependent on the
geographical location, we decided to present inventory results as litres of water resource used.
The LCIA results presented in this LCA study are relative and do not predict impacts on cate-
gory endpoints, nor threshold levels, safety margins or risk levels.
3.9 Data requirements In order to carry out this LCA study, inventory data on the emissions connected to the produc-
tion of primary materials and energy required for the production of the different carrier bag
types were needed. Moreover, we required data on material and energy consumption for the
manufacturing of the carrier bags, as well as material needed for packaging and distribution.
Data on waste management technologies for the end-of-life of the carrier bags were also
needed.
The project did not focus on extensive data collection and was intended to be based on exist-
ing inventories for resources and data in the literature. For this reason, the study was mostly
based on data available in the Ecoinvent database, version 3.4. Ecoinvent datasets were used
for inventories for all materials and energy resources required for production, distribution, use
and disposal. In order to be consistent with the modelling approach of the study, we used the
consequential version of the database. Data on the material and energy resources required for
the production of the carrier bags was obtained from a literature review of existing LCA studies
on the environmental performance of supermarket carrier bags. Additional data on the material
composition and on the waste management technologies were obtained from the library of the
LCA model EASETECH. In general, EASETECH data and process models were used in order
to model waste incineration when it was taking place in Denmark, as well as recycling in Eu-
rope. Management of rejects from recycling outside Denmark was modelled using generic
waste management processes for Europe.
Each X in Table 6 shows the data available from LCI databases, literature sources and EA-
SETECH at the beginning of this LCA study. Data for each scenario is further specified in
Appendix A.
3.9.1 Production and distribution
Physico-chemical composition data for carrier bags products, which were needed for model-
ling incineration emissions, were obtained from the EASETECH library. The physico-chemical
composition for the biopolymer bag was obtained by modifying EASETECH data according to
physico-chemical characteristics of biopolymers from existing studies in the literature (Razza,
2014).
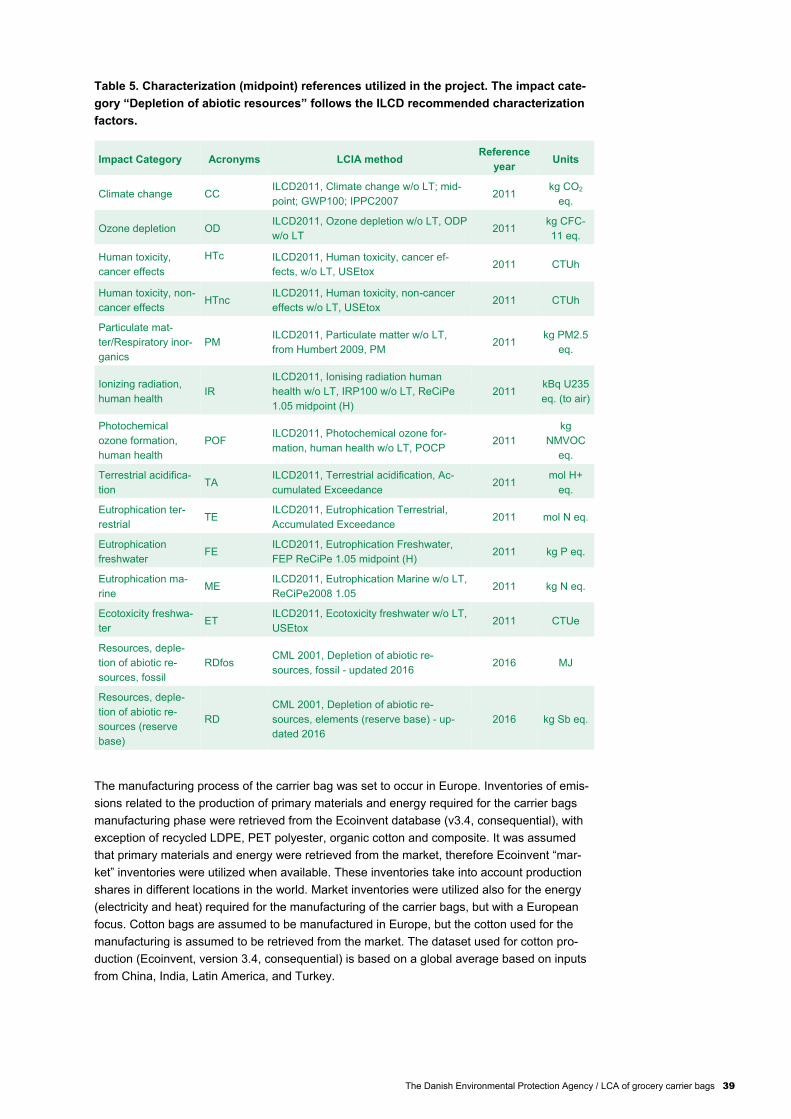
The Danish Environmental Protection Agency / LCA of grocery carrier bags 39
Table 5. Characterization (midpoint) references utilized in the project. The impact cate-
gory “Depletion of abiotic resources” follows the ILCD recommended characterization
factors.
Impact Category Acronyms LCIA method Reference
year Units
Climate change CC ILCD2011, Climate change w/o LT; mid-
point; GWP100; IPPC2007 2011
kg CO2
eq.
Ozone depletion OD ILCD2011, Ozone depletion w/o LT, ODP
w/o LT 2011
kg CFC-
11 eq.
Human toxicity,
cancer effects
HTc
ILCD2011, Human toxicity, cancer ef-
fects, w/o LT, USEtox 2011 CTUh
Human toxicity, non-
cancer effects HTnc
ILCD2011, Human toxicity, non-cancer
effects w/o LT, USEtox 2011 CTUh
Particulate mat-
ter/Respiratory inor-
ganics
PM ILCD2011, Particulate matter w/o LT,
from Humbert 2009, PM 2011
kg PM2.5
eq.
Ionizing radiation,
human health IR
ILCD2011, Ionising radiation human
health w/o LT, IRP100 w/o LT, ReCiPe
1.05 midpoint (H)
2011 kBq U235
eq. (to air)
Photochemical
ozone formation,
human health
POF ILCD2011, Photochemical ozone for-
mation, human health w/o LT, POCP 2011
kg
NMVOC
eq.
Terrestrial acidifica-
tion TA
ILCD2011, Terrestrial acidification, Ac-
cumulated Exceedance 2011
mol H+
eq.
Eutrophication ter-
restrial TE
ILCD2011, Eutrophication Terrestrial,
Accumulated Exceedance 2011 mol N eq.
Eutrophication
freshwater FE
ILCD2011, Eutrophication Freshwater,
FEP ReCiPe 1.05 midpoint (H) 2011 kg P eq.
Eutrophication ma-
rine ME
ILCD2011, Eutrophication Marine w/o LT,
ReCiPe2008 1.05 2011 kg N eq.
Ecotoxicity freshwa-
ter ET
ILCD2011, Ecotoxicity freshwater w/o LT,
USEtox 2011 CTUe
Resources, deple-
tion of abiotic re-
sources, fossil
RDfos CML 2001, Depletion of abiotic re-
sources, fossil - updated 2016 2016 MJ
Resources, deple-
tion of abiotic re-
sources (reserve
base)
RD
CML 2001, Depletion of abiotic re-
sources, elements (reserve base) - up-
dated 2016
2016 kg Sb eq.
The manufacturing process of the carrier bag was set to occur in Europe. Inventories of emis-
sions related to the production of primary materials and energy required for the carrier bags
manufacturing phase were retrieved from the Ecoinvent database (v3.4, consequential), with
exception of recycled LDPE, PET polyester, organic cotton and composite. It was assumed
that primary materials and energy were retrieved from the market, therefore Ecoinvent “mar-
ket” inventories were utilized when available. These inventories take into account production
shares in different locations in the world. Market inventories were utilized also for the energy
(electricity and heat) required for the manufacturing of the carrier bags, but with a European
focus. Cotton bags are assumed to be manufactured in Europe, but the cotton used for the
manufacturing is assumed to be retrieved from the market. The dataset used for cotton pro-
duction (Ecoinvent, version 3.4, consequential) is based on a global average based on inputs
from China, India, Latin America, and Turkey.

40 The Danish Environmental Protection Agency / LCA of grocery carrier bags
Data on the energy and material requirements (such as amount of electricity, ancillary materi-
als, and packaging) for most of the carrier bag manufacturing processes were available from
literature. Specific data was missing for woven PP, PET, polyester, organic cotton and compo-
site carrier bags. Transportation data was available as far as fuel consumption is concerned,
but data on kilometres driven was missing, since it was not possible to locate a precise geo-
graphical location for the production of the carrier bag.
3.9.2 End-of-life
On the other hand, as far as the end-of-life phase was concerned, extensive data and dedicat-
ed process models were available for incineration and recycling through the EASETECH data-
base. Incineration in Denmark was modelled with an input-specific process in EASETECH,
which took into account also direct emissions occurring from the incineration of the material.
Utilized and recovered electricity and heat were the marginal energy technologies described in
detail in Appendix B. The management of residues from the incineration process was also
taken into account and modelled. Recycling in European countries was modelled with EA-
SETECH and according to data available in the literature. Management of residues from the
recycling process was modelled with Ecoinvent waste management processes for Europe.
Ancillary materials required in the end-of-life processes were obtained from the Ecoinvent
database, version 3.4, consequential.
Table 6. Data completeness assessment. Inventory of the available data at the begin-
ning of the LCA study (without assumptions). X in the table represents available data.
Please see Appendix A for details on data selected for the assessment and on the litera-
ture references used for the carrier bag manufacturing data.
Carrier
bag
materi-
al
Physico-
chemical
composi-
tion data
Material pro-
duction data
Carrier bag
manufactur-
ing data
Transporta-
tion data
End-of-life:
incineration
End-of-life:
recycling
LDPE
X
EASETECH
(Riber et al.,
2009)
X
Ecoinvent 3.4,
consequen-
tial, global
market
X
X
EASETECH,
Ecoinvent
3.4, conse-
quential
X
EASETECH,
Ecoinvent
3.4, conse-
quential
LDPE
recycled
X
EASETECH
(Riber et al.,
2009)
X
EASETECH,
Ecoinvent
3.4, conse-
quential
X
EASETECH,
Ecoinvent
3.4, conse-
quential
PP non-
woven
X
EASETECH
(Riber et al.,
2009)
X
Ecoinvent 3.4,
consequen-
tial, global
market
X
X
EASETECH,
Ecoinvent
3.4, conse-
quential
X
EASETECH,
Ecoinvent
3.4, conse-
quential
PP
woven
X
EASETECH
(Riber et al.,
2009)
X
Ecoinvent 3.4,
consequen-
tial, global
market
X
EASETECH,
Ecoinvent
3.4, conse-
quential
X
EASETECH,
Ecoinvent
3.4, conse-
quential
PET
recycled
X
EASETECH
(Riber et al.,
2009)
X
Ecoinvent 3.4,
consequen-
tial, global
market
X
EASETECH,
Ecoinvent
3.4, conse-
quential
X
EASETECH,
Ecoinvent
3.4, conse-
quential

The Danish Environmental Protection Agency / LCA of grocery carrier bags 41
Table 6 (continued). Data completeness assessment. Inventory of the available data at
the beginning of the LCA study (without assumptions). X in the table represents availa-
ble data. Please see Appendix A for details on data selected for the assessment and on
the literature references used for the carrier bag manufacturing data.
Carrier bag
material
Physico-
chemical
composi-
tion data
Material
production
data
Carrier bag
manufactur-
ing data
Transporta-
tion data
End-of-life:
incineration
End-of-life:
recycling
PET Poly-
ester
X
EASETECH
(Riber et al.,
2009)
X
EASETECH,
Ecoinvent
3.4, conse-
quential
Biopolymer
X
EASETECH
(Razza,
2014; Riber
et al., 2009)
X
Ecoinvent
3.4, conse-
quential,
global market
X
X
EASETECH,
Ecoinvent
3.4, conse-
quential
Not recycled
Paper
X
EASETECH
(Riber et al.,
2009)
X
X
EASETECH,
Ecoinvent
3.4, conse-
quential
X
EASETECH,
Ecoinvent
3.4, conse-
quential
Cotton
organic
X
EASETECH
(Riber et al.,
2009)
X
EASETECH,
Ecoinvent
3.4, conse-
quential
Not recycled
Cotton
conven-
tional
X
EASETECH
(Riber et al.,
2009)
X
Ecoinvent
3.4, conse-
quential,
global market
X
X
EASETECH,
Ecoinvent
3.4, conse-
quential
Not recycled
Composite
(jute, PP,
cotton)
X
EASETECH
(Riber et al.,
2009)
X
EASETECH,
Ecoinvent
3.4, conse-
quential
Not recycled
3.10 Assumptions First of all, the present LCA study included in the assessment only the grocery carrier bag
types identified in the carrier bags survey (Section 2), which are carrier bag types available in
Danish supermarkets in 2017. Other carrier bags sold by other retailers, personal bags and
very lightweight carrier bags were excluded from the assessment.
In order to identify the functional unit and reference flow, we did not take into consideration
customers’ behavioural patterns, such as tendency to buy new bags for each grocery shop-
ping. We did not take into account whether differences could occur in shopping occurring at
different times of the week (weekdays versus weekends) or the size of the family unit. Effect of
taxation on customers’ behaviour or choices of the supermarkets was not included.
For biopolymer and textile bags, recycling was not considered (Table 6). For biopolymers they
do not recycle with other polymers, and are actually detrimental to the recycling of other plas-
tics. In the report we did not include negative effects from consumers that mistakenly would
place the biopolymer with the plastic recycling, therefore the result for biopolymer bags could
42 The Danish Environmental Protection Agency / LCA of grocery carrier bags
be worse if this effect was included. In addition we did not include material recovery through
composting for the compostable starch-biopolymer bags, since biopolymer bags are currently
sorted out from organic waste management plants and sent for incineration.
Recycling of textiles was not taken into account since it mainly occurs outside the Danish
waste management system, for example via charity organizations or through return schemes
at retailer shops. The extent of recovery of materials can be extremely variable according to
the specific collection selected, and the quality of the material collected.
3.10.1 Assumptions on missing data
In order to provide for the missing data identified in the completeness assessment (Table 6),
assumptions had to be made. The assumptions are reported in the following Table 7. First of
all, the material fractions used for the material composition in EASETECH were not as many
as the carrier bag types identified. We used the same material fraction for each of the three
types of material: plastic, paper and textiles.
Regarding the production of the primary materials required for the manufacturing of the carrier
bags, it was not possible to retrieve “market” production processes from Ecoinvent for all the
carrier bags materials assessed. Market inventories were not available for paper and for the
LDPE selected for the modelling of the waste bin bag. For these materials, production da-
tasets for Europe were chosen instead. A specific dataset for PET polyester production was
not available, so instead a market dataset for virgin PET was used.
Moreover, Ecoinvent did not provide inventories for the production of recycled LDPE and or-
ganic cotton. For this reason, we assumed that recycled LDPE could be modelled, as a first
assumption, utilizing the same dataset of virgin LDPE. For organic cotton, we modified the
Ecoinvent dataset for conventional cotton production by subtracting environmental impacts
connected to fertilizers and by lowering the production yield by 30 %. The yield of organic
versus conventional cotton was found to range between 20 % and 40 % in the literature, 30 %
according to a field test performed in India (Forster et al., 2013).
In order to model the production of composite material, we took into account the production of
each single material composing the composite bag, with an assumed percent share of 80%
jute, 10% PP and 10% cotton.
The available data on the manufacturing part of the carrier bags was lacking for the different
PP (woven or non-woven), PET recycled, polyester PET, organic cotton and composite. We
considered that the manufacturing materials and energy requirements were the same for wo-
ven and non-woven PP bags, as well as for PET and polyester PET. These types of carrier
bags were found having very similar characteristics from the survey conducted on carrier
bags. The same manufacturing data were used for the paper bleached and not bleached;
similarly the same production data was used for cotton conventional, organic and composite
bags (according to weight and materials used). We assumed that the packaging for shipping of
the bags was single-wall corrugated cardboard box for all carrier bag types, as found from the
conducted literature review.
We could not find literature data on the production and manufacturing of the waste bin bag.
The waste bin bags surveyed for this study were thinner and of a visibly lower quality com-
pared to the LDPE carrier bags. Due to the characteristics of the LDPE waste bin bags sur-
veyed, we assumed that the production of such bag was less demanding in terms of energy
and materials. For this reason, we decided to use the Ecoinvent dataset for the production of
LDPE packaging, which included extrusion of LDPE and ancillary materials consumption. The
Ecoinvent process chosen for waste bin bags production presented slightly lower overall im-
pacts compared to the one for the production of LDPE carrier bag.
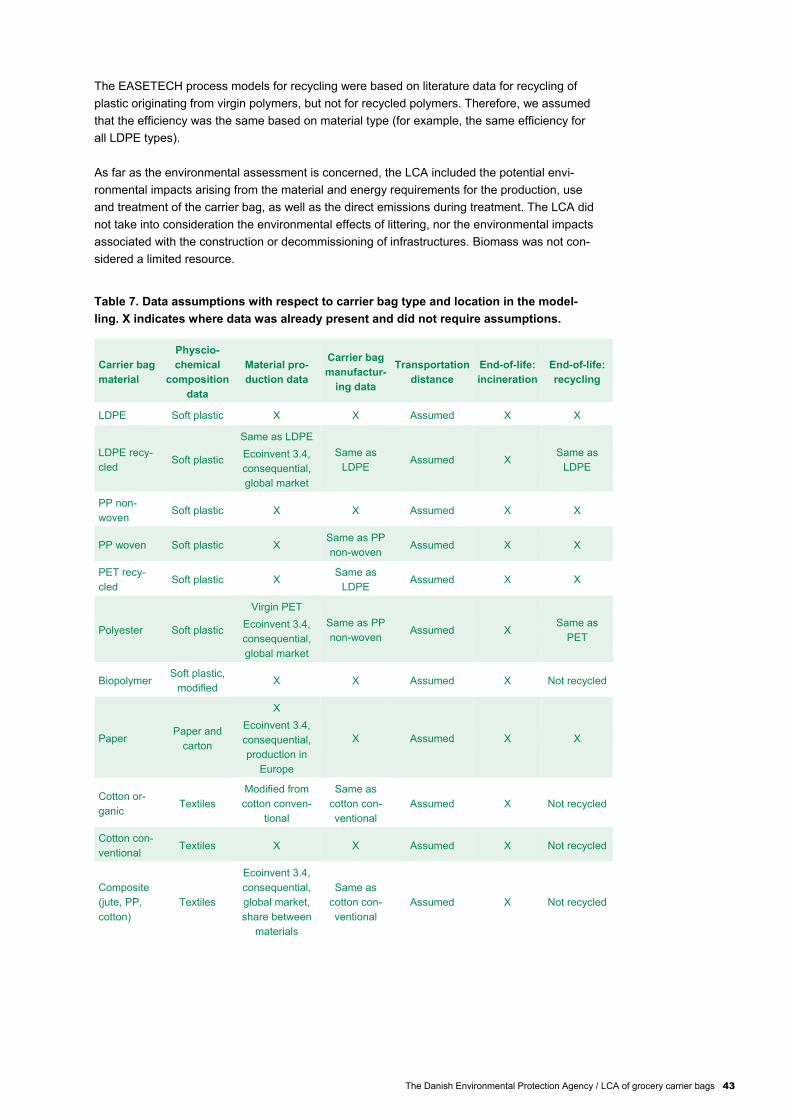
The Danish Environmental Protection Agency / LCA of grocery carrier bags 43
The EASETECH process models for recycling were based on literature data for recycling of
plastic originating from virgin polymers, but not for recycled polymers. Therefore, we assumed
that the efficiency was the same based on material type (for example, the same efficiency for
all LDPE types).
As far as the environmental assessment is concerned, the LCA included the potential envi-
ronmental impacts arising from the material and energy requirements for the production, use
and treatment of the carrier bag, as well as the direct emissions during treatment. The LCA did
not take into consideration the environmental effects of littering, nor the environmental impacts
associated with the construction or decommissioning of infrastructures. Biomass was not con-
sidered a limited resource.
Table 7. Data assumptions with respect to carrier bag type and location in the model-
ling. X indicates where data was already present and did not require assumptions.
Carrier bag
material
Physcio-
chemical
composition
data
Material pro-
duction data
Carrier bag
manufactur-
ing data
Transportation
distance
End-of-life:
incineration
End-of-life:
recycling
LDPE Soft plastic X X Assumed X X
LDPE recy-
cled Soft plastic
Same as LDPE
Ecoinvent 3.4,
consequential,
global market
Same as
LDPE Assumed X
Same as
LDPE
PP non-
woven Soft plastic X X Assumed X X
PP woven Soft plastic X Same as PP
non-woven Assumed X X
PET recy-
cled Soft plastic X
Same as
LDPE Assumed X X
Polyester Soft plastic
Virgin PET
Ecoinvent 3.4,
consequential,
global market
Same as PP
non-woven Assumed X
Same as
PET
Biopolymer Soft plastic,
modified X X Assumed X Not recycled
Paper Paper and
carton
X
Ecoinvent 3.4,
consequential,
production in
Europe
X Assumed X X
Cotton or-
ganic Textiles
Modified from
cotton conven-
tional
Same as
cotton con-
ventional
Assumed X Not recycled
Cotton con-
ventional Textiles X X Assumed X Not recycled
Composite
(jute, PP,
cotton)
Textiles
Ecoinvent 3.4,
consequential,
global market,
share between
materials
Same as
cotton con-
ventional
Assumed X Not recycled

44 The Danish Environmental Protection Agency / LCA of grocery carrier bags
3.11 Data quality assessment The information regarding volume, weight holding capacity and weight of the carrier bags was
retrieved by a survey for all carrier bags available for purchase in Danish supermarkets in
2017 and is considered reliable and current.
Considering the same material composition for some carrier bags assessed in this study
means that in the LCA results emissions from incineration of each material type are driven by
mass rather than by different chemical composition of the bags. This will affect results mainly
for the fossil carbon content of the material, which is emitted to air through incineration.
Regarding the datasets retrieved from the Ecoinvent database, the consequential version of
the database is considered consistent with the goal and scope of this LCA study. The version
of the database employed for this LCA was the latest available (3.4). All datasets used for this
study have been tested for their environmental impacts against other datasets for similar mate-
rials and energy before being selected and implemented in the modelling. For example, we
downloaded all available datasets for LDPE (market, production in various geographical loca-
tions) and verified that the dataset chosen for the modelling presented overall values in line
with other similar datasets. In general, market and global datasets provided slightly higher
emissions than production datasets in specific geographical locations. Therefore, the carrier
bags for which only production datasets were available are likely to have slightly lower emis-
sions than using market datasets. Assuming that the carrier bag manufacturers retrieve mate-
rials and energy from the market, our preference was always for the market datasets. When
not available, we used production datasets, preferably for Europe.
Specific manufacturing data for recycled LDPE, woven PP, recycled PET, polyester, bleached
paper, organic cotton and textile carrier bags were missing and available data from the most
similar carrier bags manufacturing process was assumed instead. These assumptions are not
considered limiting for the results since past LCAs on grocery carrier bags have evidenced
that most of the production impacts were ascribable to the production of the carrier bag mate-
rial (Edwards and Fry, 2011; Kimmel and Cooksey, 2014).
The data utilized to model material and energy requirements during the manufacturing pro-
cesses were retrieved from a series of well-documented LCA studies. For our references, we
gave priority to reviewed LCA studies and LCAs carried out by institutional bodies and with a
similar geographical scope (Europe). The manufacturing data was obtained as a range from
the values found in the literature, as reported in detail in Appendix A. When manufacturing
data for specific carrier bags were missing, as in the case of PET and PP bags, we utilized
data of peer-reviewed LCA studies for bags with similar characteristics.
The assumption of modelling the waste bin bag as an LDPE with lower quality was considered
in line with the intended use of the bag: the LDPE carrier bags are intended for multiple uses,
while the waste bin bag is intended for single use. Moreover, selecting a process with slightly
lower impacts for the production of the waste bin bag allows being more conservative regard-
ing the results, since lower benefits will arise from the saving of a waste bin bag.
The assumed transportation distances, which were the same for all the assessed carrier bags,
reflect that transportation could occur to be as far as southern Europe. This was considered
conservative, since the exact locations of the recycling plants were not known.
Data for end-of-life is considered technologically reliable. EASETECH allows modelling waste
management as input-specific and allows following the material flow. Values characterizing the
end-of-life processes are based on peer-reviewed literature and are extensively reported in
Appendix A. Regarding the missing data for the recycling of recycled polymer, the recovery
efficiencies could be lower if the quality of the polymer sent to recycling was lower, but we did

The Danish Environmental Protection Agency / LCA of grocery carrier bags 45
not have data to substantiate assumptions on lower recovery rates and higher residues pro-
duction for recycled polymers.
3.11.1 Critical assumptions
Overall, the present LCA study involved a series of assumptions. The following assumptions
were considered critical for the outcomes of the study:
The reference flow was calculated assuming that two bags were required when one carrier
bag could not provide for the same volume and weight holding capacity of an average LDPE
carrier bag, which was taken as reference. The study assumes that the customers of Danish
supermarkets would need to buy another bag of the same type in order to provide for the
same functionality (rounding). For some carrier bags this assumption could result in a large
overcapacity.
The recycled LDPE carrier bag was modelled using the same production dataset of virgin
LDPE. This modelling choice, due to unavailability of data, is considered to be conservative.
Recycled LDPE is expected to provide lower environmental impacts than virgin LDPE, as it
can be observed for recycled HDPE and recycled PET in comparison with virgin HDPE and
virgin PET (please see Appendix B).
The yield of organic cotton farming was assumed 30 % lower than conventional cotton. For
the modelling, this implies that 30 % more impacts are considered for the production of or-
ganic cotton than conventional cotton. The yield was found to vary in the literature between
20 % and 40 % and according to the geographical location (Forster et al., 2013). Since the
Ecoinvent dataset for cotton production is not linked to a specific geographical location, but
is based on a global average, 30 % was considered as average value. The selected value
influences the contribution of the production process to the overall impacts related to the or-
ganic cotton carrier bag.
Although the functional unit is based on carrier bags available for purchase in Danish su-
permarkets in 2017, the study is assumed to support decisions that will occur in a 10 year
period, using a future marginal energy is assumed to well represent the effects in the future
waste management system. Using a non-future marginal energy would have entailed having
coal in the energy mix, and would have provided higher savings from energy recovery in the
incineration process.
Recycling was not considered for biopolymer and textile bags. Considering recycling feasi-
ble would mean allowing for the recovery of these materials through separate collection and
re-processing, therefore lowering the impacts connected to the production of the carrier
bags.
Reuse as waste bin bag was modelled for all carrier bags included in the study, even if
some carrier bags may not be able to provide for the same functionality of an LDPE waste
bin bag.
Some of these critical assumptions were considered for sensitivity analysis, as explained in
the Life Cycle Interpretation Section.
3.12 Cut-offs As presented in the scope Section, the assessment did not include construction and decom-
missioning of infrastructure, buildings, machinery (capital goods), or analyses of existing ca-
pacities/new capacities requirements.
3.13 Limitations The assumptions and cut-offs listed above were not considered limiting for the results of the
assessment. First of all, the choice of the functional unit and reference flow was intentional for
the calculation of the number of primary reuse times, regardless of the consumers’ behavioural
patterns. Nevertheless, a different reference flow will be taken into consideration for a sensi-
tivity analysis of the results.
46 The Danish Environmental Protection Agency / LCA of grocery carrier bags
The choice of limiting the scope of the LCA to grocery carrier bags and not to personal bags
and bags sold from other retailers was necessary in order to provide a specific assessment of
the carrier bags available for purchase in Danish supermarkets, and to provide specific guid-
ance to retailers on the choice of the carrier bags based on their environmental performance.
The choice of using the same material fractions for plastic bags, paper bags and textile bags
will influence only the impacts that are modelled in EASETECH as a function of the material
composition. In the case of the scenarios modelled in this assessment, the choice of material
fractions will influence the emissions to atmosphere during incineration. Therefore, identifying
the fossil and non-fossil carbon content and the content of metals emitted to air of the material
fractions can cover the input-dependent part of the results.
Finally, littering effects were considered negligible for Denmark. Littering was mentioned in
Environment Australia (2002) as an effect of wind blowing on landfills and as a result of
missed environmental education.
3.14 Life Cycle Interpretation The Life Cycle Interpretation part of this study comprises the analysis of the results, which are
provided both as characterized and normalized impacts, and the discussion of such results.
The analysis of the results was carried out with respect to the three main aims stated in the
goal of the study: (1) identification of the best disposal option for each type of bag, (2) identifi-
cation of the carrier bag with the best environmental performance, and (3) identification of the
required number of primary reuse times based on the environmental assessment. The com-
parison of results was carried out per impact category and without employing any weighting.
1. Identification of the best disposal option for each type of bag
For each type of carrier bag and impact category at a time, we examined the character-
ized results for each of the end-of-life scenarios. The LCIA for each bag was assessed
with a contribution analysis, which identified the parts of the LCA model contributing the
most to the final results. We also provided a dedicated contribution analysis to the carrier
bag manufacturing part. This part of the interpretation of the results provided indication of
the most preferable disposal option for each carrier bag type based on the results of the
environmental assessment.
2. Identification of the carrier bag with the best environmental performance
For each impact category, we identified the carrier bag alternative and the end-of-life sce-
nario that provides the best environmental performance, as well as whether the identified
environmental performance was significantly better than the one provided by the other
carrier bag alternatives. The optimal end-of-life scenario identified in (1) was taken into
account for the discussion of the results.
3. Identification of the number of primary reuse times
As explained in the Section on modelling of primary reuse, we provided the calculated
number of primary reuse times required by a carrier bag alternative to provide a better en-
vironmental performance than a reference carrier bag. The number of reuse times was
calculated for each impact category and differences were discussed.
The results were discussed with respect to the goal and scope of the study, as well with re-
spect to the limitations and considerations about data quality.
The discussion of the results was supported by additional calculations carried out as scenario
analysis. A scenario analysis is a sensitivity analysis that takes into account the variation in the
final result that occurs with differences in the initial assumptions taken. In particular, the varia-
tion in the results obtained was observed with respect to:

The Danish Environmental Protection Agency / LCA of grocery carrier bags 47
different reference flow: not rounded to two bags but based on fractions that fulfil the weight
and volume criteria;
secondary reuse allowed for all carrier bag types versus only carrier bags that can fully pro-
vide for the waste bin bag functionality;
25 % lower impacts associated to virgin LDPE production.
3.15 Critical review This LCA study includes a critical review, carried out by Line Geest Jakobsen and Trine Lund
Neidel from COWI A/S in January 2018. The aim of the critical review is to assess the compli-
ance of the LCA study with the ISO standard and to increase the clarity and usefulness of the
result.
Although this LCA might be used to support decisions and that the comparative assertion
might ultimately be disclosed to the public, there are pre-defined limitations to the study re-
garding the fact that the critical review was not conducted while the project was being carried
out and by a panel of interested parties. For this reason, the report does not fully comply with
the ISO standard. The critical review is provided in Appendix D and the main outcomes are
summarized in the Executive Summary.
3.16 Format of the report The format of the report is:
Short executive summary in Danish (8 pages);
Short executive summary in English (7 pages);
Technical LCA report.
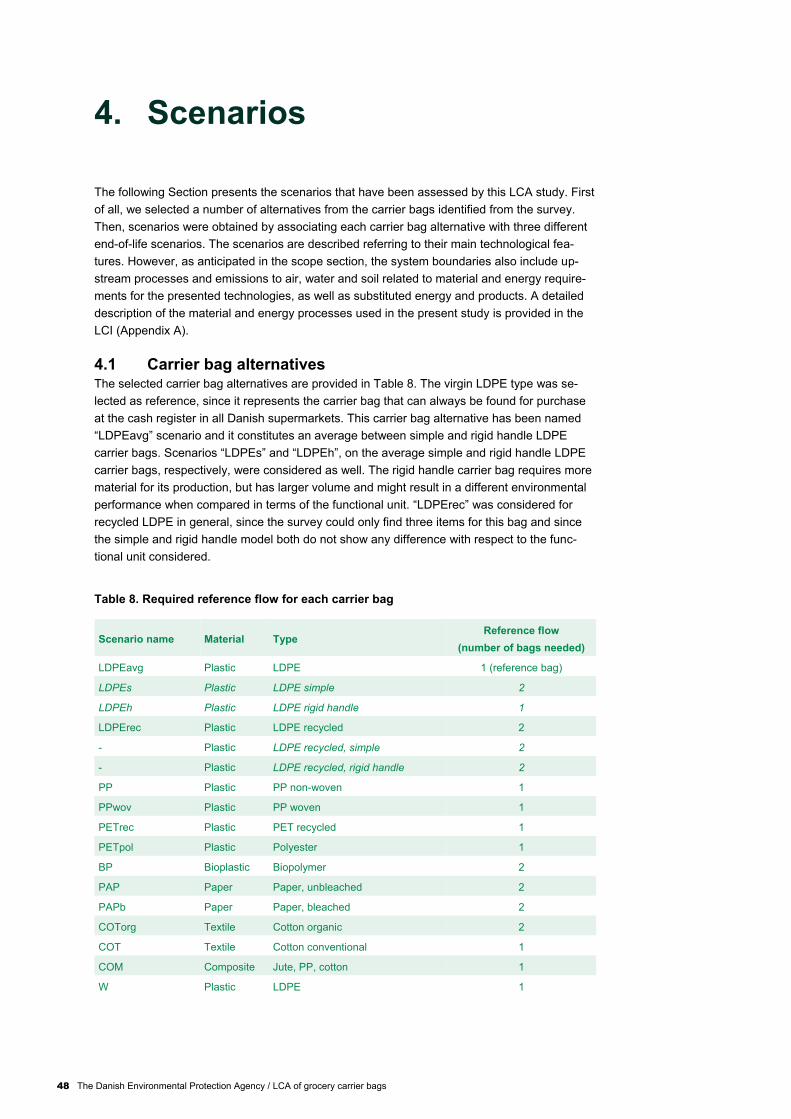
48 The Danish Environmental Protection Agency / LCA of grocery carrier bags
4. Scenarios
The following Section presents the scenarios that have been assessed by this LCA study. First
of all, we selected a number of alternatives from the carrier bags identified from the survey.
Then, scenarios were obtained by associating each carrier bag alternative with three different
end-of-life scenarios. The scenarios are described referring to their main technological fea-
tures. However, as anticipated in the scope section, the system boundaries also include up-
stream processes and emissions to air, water and soil related to material and energy require-
ments for the presented technologies, as well as substituted energy and products. A detailed
description of the material and energy processes used in the present study is provided in the
LCI (Appendix A).
4.1 Carrier bag alternatives The selected carrier bag alternatives are provided in Table 8. The virgin LDPE type was se-
lected as reference, since it represents the carrier bag that can always be found for purchase
at the cash register in all Danish supermarkets. This carrier bag alternative has been named
“LDPEavg” scenario and it constitutes an average between simple and rigid handle LDPE
carrier bags. Scenarios “LDPEs” and “LDPEh”, on the average simple and rigid handle LDPE
carrier bags, respectively, were considered as well. The rigid handle carrier bag requires more
material for its production, but has larger volume and might result in a different environmental
performance when compared in terms of the functional unit. “LDPErec” was considered for
recycled LDPE in general, since the survey could only find three items for this bag and since
the simple and rigid handle model both do not show any difference with respect to the func-
tional unit considered.
Table 8. Required reference flow for each carrier bag
Scenario name Material Type Reference flow
(number of bags needed)
LDPEavg Plastic LDPE 1 (reference bag)
LDPEs Plastic LDPE simple 2
LDPEh Plastic LDPE rigid handle 1
LDPErec Plastic LDPE recycled 2
- Plastic LDPE recycled, simple 2
- Plastic LDPE recycled, rigid handle 2
PP Plastic PP non-woven 1
PPwov Plastic PP woven 1
PETrec Plastic PET recycled 1
PETpol Plastic Polyester 1
BP Bioplastic Biopolymer 2
PAP Paper Paper, unbleached 2
PAPb Paper Paper, bleached 2
COTorg Textile Cotton organic 2
COT Textile Cotton conventional 1
COM Composite Jute, PP, cotton 1
W Plastic LDPE 1

The Danish Environmental Protection Agency / LCA of grocery carrier bags 49
Scenarios “PP” and “PPwov” consider non-woven and woven PP, respectively. “PETrec” rep-
resents recycled PET carrier bags, while “PETpol” refers to PET polyester. The “BP” scenario
models a biopolymer bag, which was assumed to be starch-complexed biopolymer (i.e. a so-
called compostable bag, as explained in Section 2). For the paper carrier bag, an additional
scenario was added to the carrier bag “PAP”: we introduced the scenario, “PAPb”, in order to
include also the effect of utilizing bleached paper instead of unbleached paper.
“COTorg” and “COT” scenarios model organic and conventional cotton, respectively. The
difference between the two scenarios lies in the fact that organic cotton will require less ferti-
lizers to be produced, but will also have a lower yield. It was estimated that the yield was 30 %
lower, as previously seen in Section 3. “COM” scenario models the composite bag case,
where the carrier bag is made of a mix of materials: jute, PP, and cotton.
Figure 13. General common structure for all carrier bag scenarios assessed in this LCA
study. The colour scales assigned to the different parts of the cradle to grave model will
be used also for the contribution analysis.
After being used by the customer, the carrier bag had three different end-of-life options (end-
of-life, orange): ending up in the residual waste collection and being incinerated (EOL1); being
separately collected within similar materials waste stream and sent to recycling (EOL2); or
being reused as a waste bin bag one time before ending up in the residual waste stream and
being incinerated (EOL3). The following Sections illustrate the different end-of-life options.
Production of
carrier bag
material
Manufacture
of carrier bag
Treatment
residues
Production of
packaging
material
Transport Use
Collection Transport
Collection
PRO – Production of material and manufacturing of bag, treatment of residues
DIS – Distribution: packaging production and transportation of carrier bag to supermarkets
USE – Use of carrier bag
DIS EOL – Treatment of packaging residues
EOL – End-of-life of carrier bag
End-of-life
packaging
End-of-life
carrier bag
(EOL1/EOL2/
EOL3)

50 The Danish Environmental Protection Agency / LCA of grocery carrier bags
4.2 End-of-life scenarios This Section introduces the three main end-of-life scenarios considered for this project and
indicates which carrier bags are associated with which end-of-life scenarios.
4.2.1 Incineration: EOL1 The carrier bag is produced and provided in Danish supermarkets. Here it is purchased and
used for its primary function, which is carrying grocery shopping from the supermarkets to
homes (primary use). After being used, the carrier bag is disposed in the residual waste, col-
lected and ultimately incinerated in Denmark. The electricity and heat produced during the
incineration process allows for avoiding the production of the same amount of electricity and
heat from other resources. This scenario will be further referred to as “EOL1”. The main fea-
tures of the EOL scenario are provided in Figure 14 below. The colour scale is the same as
Figure 13. Details are provided in Appendix A.
Figure 14. General EOL1 scenario structure. Dashed lines indicate substituted energy.
4.2.2 Recycling of material: EOL2 After being used for its primary function, the carrier bag is disposed with separately collected
waste material of the same type. The separately collected waste is sorted and sent to material
recycling, which is assumed to occur in Europe, but not in Denmark. The recycled secondary
material allows avoiding the production of the same amount of material from primary re-
sources. The residues from the recycling process are incinerated, allowing for the production
of electricity and heat, which substitute the production of the same amount of electricity and
heat from other resources. This scenario will be further referred to as “EOL2”. The main fea-
tures of the scenario are provided in Figure 15. The colour scale is the same as Figure 13.
Details are provided in Appendix A.
Figure 15. General EOL2 scenario structure.
Carrier bag
(Primary use)
Residual
waste
incineration
Electricity and
heat
Production of
electricity and
heat
Collection
Collection
and transport
Secondary
material for
market
Primary
material
production for
market
Carrier bag
(Primary use)
Residues
incineration
(EU)
Electricity and
heat
Production of
electricity and
heat
Recycling
(EU)
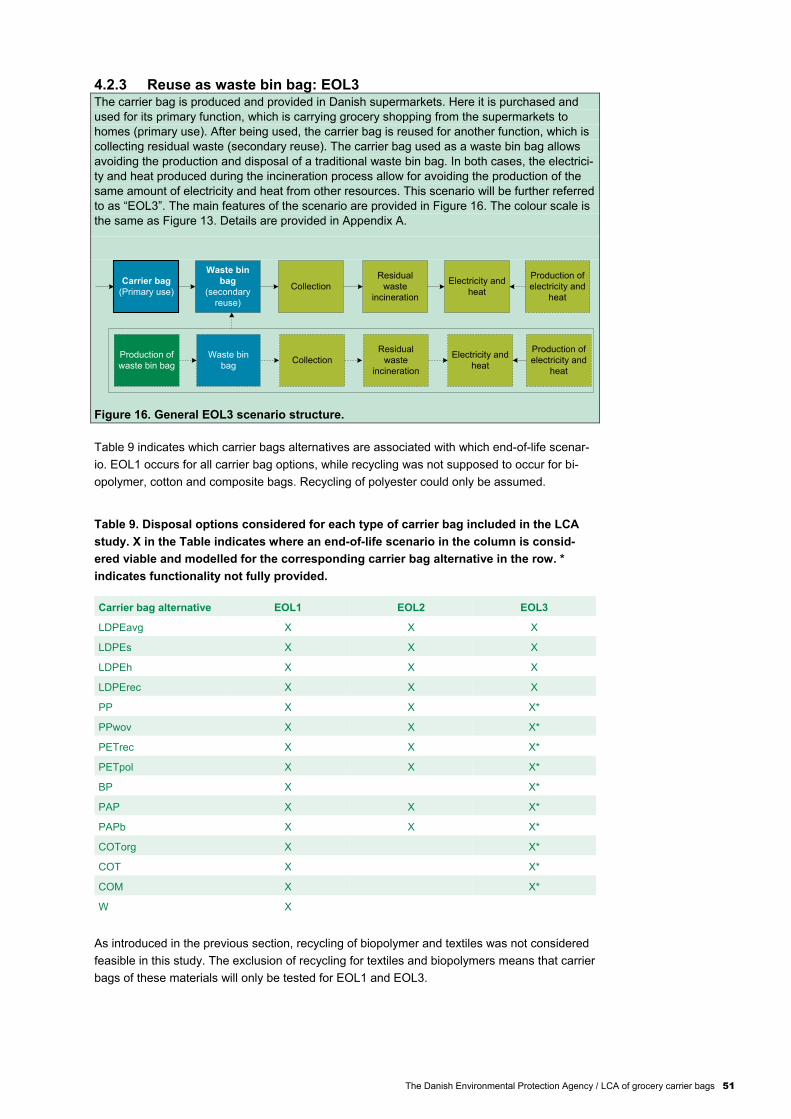
The Danish Environmental Protection Agency / LCA of grocery carrier bags 51
4.2.3 Reuse as waste bin bag: EOL3 The carrier bag is produced and provided in Danish supermarkets. Here it is purchased and
used for its primary function, which is carrying grocery shopping from the supermarkets to
homes (primary use). After being used, the carrier bag is reused for another function, which is
collecting residual waste (secondary reuse). The carrier bag used as a waste bin bag allows
avoiding the production and disposal of a traditional waste bin bag. In both cases, the electrici-
ty and heat produced during the incineration process allow for avoiding the production of the
same amount of electricity and heat from other resources. This scenario will be further referred
to as “EOL3”. The main features of the scenario are provided in Figure 16. The colour scale is
the same as Figure 13. Details are provided in Appendix A.
Figure 16. General EOL3 scenario structure.
Table 9 indicates which carrier bags alternatives are associated with which end-of-life scenar-
io. EOL1 occurs for all carrier bag options, while recycling was not supposed to occur for bi-
opolymer, cotton and composite bags. Recycling of polyester could only be assumed.
Table 9. Disposal options considered for each type of carrier bag included in the LCA
study. X in the Table indicates where an end-of-life scenario in the column is consid-
ered viable and modelled for the corresponding carrier bag alternative in the row. *
indicates functionality not fully provided.
Carrier bag alternative EOL1 EOL2 EOL3
LDPEavg X X X
LDPEs X X X
LDPEh X X X
LDPErec X X X
PP X X X*
PPwov X X X*
PETrec X X X*
PETpol X X X*
BP X X*
PAP X X X*
PAPb X X X*
COTorg X X*
COT X X*
COM X X*
W X
As introduced in the previous section, recycling of biopolymer and textiles was not considered
feasible in this study. The exclusion of recycling for textiles and biopolymers means that carrier
bags of these materials will only be tested for EOL1 and EOL3.
Carrier bag
(Primary use)
Residual
waste
incineration
Waste bin
bag
(secondary
reuse)
Electricity and
heat
Production of
electricity and
heat
Waste bin
bag
Residual
waste
incineration
Electricity and
heat
Production of
electricity and
heat
Production of
waste bin bag
Collection
Collection

52 The Danish Environmental Protection Agency / LCA of grocery carrier bags
The secondary reuse as a waste bin bag was modelled for all carrier bag options. However, as
previously explained in Section 3, the functionality of an LDPE waste bin bag cannot be fully
provided by bags that are permeable to water, such as PP, polyester, paper, cotton and com-
posite. Moreover, biopolymer bags may present a higher chance of puncturing and tearing.
EOL3 for these carrier bag types was calculated and then further discussed in the discussion
section.
4.3 Carrier bag scenarios For all carrier bag scenarios, the manufacturing stage was assumed to occur in Europe. The
produced carrier bags were distributed with single-wall corrugated cardboard packaging, and
transported from their place of production in Europe to Denmark, where they were put into use
in supermarkets. The packaging was assumed to be separately collected with cardboard
packaging, and to be transported abroad (Europe) for recycling. The carrier bag alternatives
were tested for the end-of-life scenarios as shown in Table 9. For EOL1 and EOL3, residual
waste was collected and incinerated in Denmark. For EOL2, the carrier bags were separately
collected and sorted (30 % sorted out as residues) in Denmark, then transported and recycled
in Europe.
4.3.1 LDPE carrier bags: LDPEavg, LDPEs, LDPEh, LDPErec
LDPE carrier bags include virgin LDPE carrier bags (LDPEavg, LDPEs, LDPEh), and recycled
LDPE carrier bags (LDPErec). The bags were associated with the same material composition
(soft plastic, Riber et al., 2009) and to the same manufacturing data; the scenarios differed for
the weight associated with each bag and the number of bags required to fulfil the function
expressed in the functional unit. The scenarios included the production of LDPE required for
the manufacturing of the bag, as well as ancillary materials and energy. The manufacturing of
the carrier bag produced around 5 % residues of LDPE from the initially required mass, which
were assumed to be incinerated. Recycling of LDPE in EOL2 (9.7 % residues) was assumed
to substitute LDPE production as granulate in Europe with a market response of 90 %. Resi-
dues were assumed to be incinerated in Europe.
4.3.2 PP carrier bags: PP, PPwov
PP carrier bags include non-woven (PP) and woven (PPwov) carrier bags. The bags were
associated with the same material composition (soft plastic, Riber et al., 2009) and to the
same manufacturing data; the scenarios differed for the weight associated with the carrier
bags. The scenarios included the production of PP required to manufacture the bags, as well
as energy and material requirements. 5 % of PP was assumed to be lost during production
and to be incinerated. Recycling of PP in EOL2 (9.7 % residues) was assumed to substitute
PP production as granulate in Europe with a market response of 90 %. Residues were as-
sumed to be incinerated in Europe.
4.3.3 Recycled PET carrier bags: PETrec
Recycled PET carrier bags were associated with the material composition of soft plastic (Riber
et al., 2009) and to the manufacturing consumption data of PP bags, due to the similarity in
shape and structure. The scenario included the production of recycled PET. During manufac-
turing, 5 % of material was assumed to be lost as residues, which were incinerated. The recy-
cling process in EOL2 (24.5 % residues) was assumed to produce recycled PET and to substi-
tute recycled PET granulate, amorphous, in Europe with a market response of 81 %. Residues
were assumed to be incinerated in Europe.
4.3.4 Polyester carrier bags: PETpol
Polyester carrier bags were also assumed representable by the material fraction soft plastic
(Riber et al., 2009). The scenario included production of PET polyester, which was assumed
ascribable to that of virgin PET. Due to the characteristics of the bag observed in the survey,
energy and materials needed for manufacturing were assumed the same as PP carrier bags.

The Danish Environmental Protection Agency / LCA of grocery carrier bags 53
The manufacturing process was assumed to produce 5 % residues, which were incinerated.
The recycling process in EOL2 was assumed to be similar to that of PET, with 24.5 % residues
produced and with a market response for recycled polyester of 81 %. Residues were assumed
to be incinerated in Europe.
4.3.5 Starch-complexed biopolymer bags: BP
The material composition for starch-complexed biopolymer bags was obtained from Razza,
(2014). The scenario included production of the biopolymer and manufacturing of the carrier
bag. The Ecoinvent dataset for the production of starch-complexed biopolymer does not take
into account carbon storage. Residues (1 %) were assumed to be incinerated. The recycling
scenario was not considered for this type of carrier bags, and should be avoided as it can be
detrimental to recycling of other plastic types.
4.3.6 Paper bags: PAP, PAPb
Paper carrier bags comprise unbleached (PAP) and bleached (PAPb) craft paper bags. Both
scenarios were associated with the material composition of paper and carton containers (Riber
et al., 2009) and to the same energy and material requirements for manufacturing. The sce-
narios differed for the material production process associated with unbleached and bleached
craft paper. Production was assumed to produce 5 % residues, which were incinerated. Recy-
cling in EOL2 (9 % residues) was assumed to produce craft liner for cardboard production,
with a market substitution in Europe of 90 %. Residues were assumed to be incinerated.
4.3.7 Cotton bags: COTorg, COT
Cotton bags comprise organic (COTorg) and conventional (COT) cotton. Both carrier bag
types were modelled as textiles materials (Riber et al., 2009). The scenarios differed for the
weight associated with the carrier bag, the number of bags required to fulfil the functional unit
and for the cotton production data. Organic cotton production was modelled by subtracting
fertilizers production data from conventional cotton production data and by lowering the yield
by 30 %. Residues from production (1 %) were assumed to be landfilled. The recycling scenar-
io was not considered for this type of carrier bag. If the bags were recycled it would lower the
impact of using the cotton bags. It would though be important what material the cotton would
substitute for the overall performance.
4.3.8 Composite bags: COM
The carrier bag composed of jute, PP and cotton was associated with the material fraction
textiles (Riber et al., 2009). The material production data of jute, PP and cotton was included
in the production inventory, as well as materials and energy requirements (assumed the same
as those of the cotton bags). Based on the survey, we assumed that the composition of the
bag was 80% jute, 10% PP and 10% cotton. Residues from production (1 %) were assumed to
be landfilled. The recycling scenario was not considered for this type of carrier bag.
4.3.9 LDPE waste bin bag
The LDPE waste bin bag production and disposal via incineration was modelled in order to be
used as avoided production in EOL3. The bag was modelled as soft plastic material (Riber et
al., 2009) and its production was associated with the process of extrusion of plastic, due to the
simplicity of the carrier bag. 5 % residues during production were assumed to be incinerated.

54 The Danish Environmental Protection Agency / LCA of grocery carrier bags
5. Life Cycle Impact Assessment
5.1 Results for each carrier bag This Section presents the characterized result scores for each carrier bag type and end-of-life
scenario. The characterized result scores are presented in Tables 10 – 12 below, one for each
end-of-life scenario. The LCIA results are relative and do not predict impacts on category end-
points, nor threshold levels, safety margins or risk levels. In order to facilitate the interpretation
of the results, results for the same type of carrier bags have been grouped and discussed in
detail in dedicated paragraphs. The results are subdivided according to the contribution of
production, distribution, use, and end-of-life of packaging and carrier bag to the overall results.
The colour scale of the contribution analysis in the following figures in this Section follows the
same colour scale of Figure 4 in Section 4. The contribution analyses for materials and energy
requirements in the manufacturing phase for each carrier bag are provided in table format.
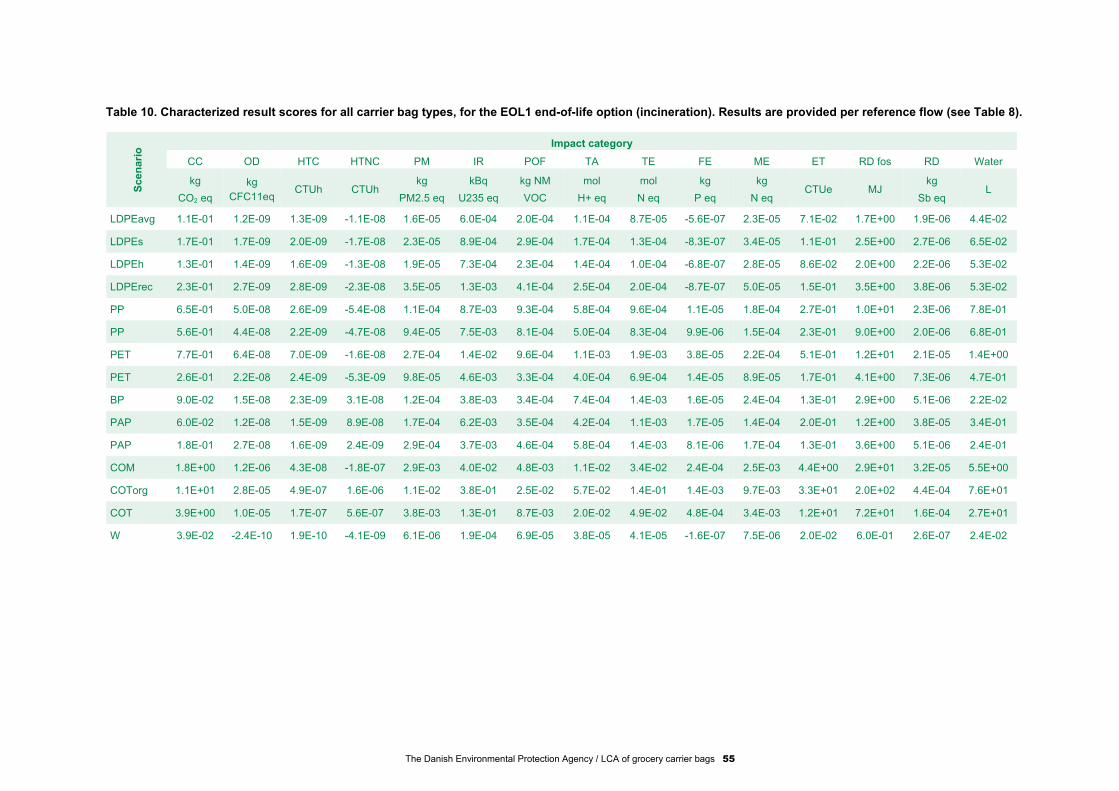
The Danish Environmental Protection Agency / LCA of grocery carrier bags 55
Table 10. Characterized result scores for all carrier bag types, for the EOL1 end-of-life option (incineration). Results are provided per reference flow (see Table 8).
Scen
ari
o Impact category
CC OD HTC HTNC PM IR POF TA TE FE ME ET RD fos RD Water
kg
CO2 eq
kg
CFC11eq CTUh CTUh
kg
PM2.5 eq
kBq
U235 eq
kg NM
VOC
mol
H+ eq
mol
N eq
kg
P eq
kg
N eq CTUe MJ
kg
Sb eq L
LDPEavg 1.1E-01 1.2E-09 1.3E-09 -1.1E-08 1.6E-05 6.0E-04 2.0E-04 1.1E-04 8.7E-05 -5.6E-07 2.3E-05 7.1E-02 1.7E+00 1.9E-06 4.4E-02
LDPEs 1.7E-01 1.7E-09 2.0E-09 -1.7E-08 2.3E-05 8.9E-04 2.9E-04 1.7E-04 1.3E-04 -8.3E-07 3.4E-05 1.1E-01 2.5E+00 2.7E-06 6.5E-02
LDPEh 1.3E-01 1.4E-09 1.6E-09 -1.3E-08 1.9E-05 7.3E-04 2.3E-04 1.4E-04 1.0E-04 -6.8E-07 2.8E-05 8.6E-02 2.0E+00 2.2E-06 5.3E-02
LDPErec 2.3E-01 2.7E-09 2.8E-09 -2.3E-08 3.5E-05 1.3E-03 4.1E-04 2.5E-04 2.0E-04 -8.7E-07 5.0E-05 1.5E-01 3.5E+00 3.8E-06 5.3E-02
PP 6.5E-01 5.0E-08 2.6E-09 -5.4E-08 1.1E-04 8.7E-03 9.3E-04 5.8E-04 9.6E-04 1.1E-05 1.8E-04 2.7E-01 1.0E+01 2.3E-06 7.8E-01
PP
wov
5.6E-01 4.4E-08 2.2E-09 -4.7E-08 9.4E-05 7.5E-03 8.1E-04 5.0E-04 8.3E-04 9.9E-06 1.5E-04 2.3E-01 9.0E+00 2.0E-06 6.8E-01
PET
rec
7.7E-01 6.4E-08 7.0E-09 -1.6E-08 2.7E-04 1.4E-02 9.6E-04 1.1E-03 1.9E-03 3.8E-05 2.2E-04 5.1E-01 1.2E+01 2.1E-05 1.4E+00
PET
pol
2.6E-01 2.2E-08 2.4E-09 -5.3E-09 9.8E-05 4.6E-03 3.3E-04 4.0E-04 6.9E-04 1.4E-05 8.9E-05 1.7E-01 4.1E+00 7.3E-06 4.7E-01
BP 9.0E-02 1.5E-08 2.3E-09 3.1E-08 1.2E-04 3.8E-03 3.4E-04 7.4E-04 1.4E-03 1.6E-05 2.4E-04 1.3E-01 2.9E+00 5.1E-06 2.2E-02
PAP 6.0E-02 1.2E-08 1.5E-09 8.9E-08 1.7E-04 6.2E-03 3.5E-04 4.2E-04 1.1E-03 1.7E-05 1.4E-04 2.0E-01 1.2E+00 3.8E-05 3.4E-01
PAP
b
1.8E-01 2.7E-08 1.6E-09 2.4E-09 2.9E-04 3.7E-03 4.6E-04 5.8E-04 1.4E-03 8.1E-06 1.7E-04 1.3E-01 3.6E+00 5.1E-06 2.4E-01
COM 1.8E+00 1.2E-06 4.3E-08 -1.8E-07 2.9E-03 4.0E-02 4.8E-03 1.1E-02 3.4E-02 2.4E-04 2.5E-03 4.4E+00 2.9E+01 3.2E-05 5.5E+00
COTorg 1.1E+01 2.8E-05 4.9E-07 1.6E-06 1.1E-02 3.8E-01 2.5E-02 5.7E-02 1.4E-01 1.4E-03 9.7E-03 3.3E+01 2.0E+02 4.4E-04 7.6E+01
COT 3.9E+00 1.0E-05 1.7E-07 5.6E-07 3.8E-03 1.3E-01 8.7E-03 2.0E-02 4.9E-02 4.8E-04 3.4E-03 1.2E+01 7.2E+01 1.6E-04 2.7E+01
W 3.9E-02 -2.4E-10 1.9E-10 -4.1E-09 6.1E-06 1.9E-04 6.9E-05 3.8E-05 4.1E-05 -1.6E-07 7.5E-06 2.0E-02 6.0E-01 2.6E-07 2.4E-02

56 The Danish Environmental Protection Agency / LCA of grocery carrier bags
Table 11. Characterized result scores for all carrier bag types, for the EOL2 end-of-life option (recycling). Results are provided per reference flow (see Table 8).
Scen
ari
o
Impact category
CC OD HTC HTNC PM IR POF TA TE FE ME ET RD fos RD Water
kg
CO2 eq
kg
CFC11 eq CTUh CTUh
kg
PM2.5 eq
kBq
U235 eq
kg NM
VOC
mol
H+ eq
mol
N eq
kg
P eq
kg
N eq CTUe MJ
kg
Sb eq L
LDPEavg 8.2E-02 5.6E-09 1.3E-09 -4.3E-10 3.0E-05 1.7E-03 1.7E-04 1.7E-04 2.7E-04 7.9E-07 3.3E-05 9.1E-02 1.3E+00 2.1E-06 8.6E-02
LDPEs 1.2E-01 8.3E-09 1.9E-09 -6.4E-10 4.4E-05 2.6E-03 2.6E-04 2.5E-04 4.0E-04 1.2E-06 4.9E-05 1.3E-01 2.0E+00 3.1E-06 1.3E-01
LDPEh 9.8E-02 6.7E-09 1.6E-09 -5.2E-10 3.6E-05 2.1E-03 2.1E-04 2.0E-04 3.3E-04 9.5E-07 3.9E-05 1.1E-01 1.6E+00 2.6E-06 1.0E-01
LDPErec 1.7E-01 1.2E-08 2.7E-09 -5.6E-10 6.5E-05 3.6E-03 3.6E-04 3.7E-04 5.8E-04 1.9E-06 7.0E-05 1.9E-01 2.8E+00 4.4E-06 9.6E-02
PP 5.0E-01 7.5E-08 3.2E-09 1.2E-08 2.1E-04 1.5E-02 9.8E-04 1.2E-03 2.4E-03 1.9E-05 2.6E-04 4.0E-01 8.9E+00 4.1E-06 1.0E+00
PP
wov
4.4E-01 6.5E-08 2.8E-09 1.0E-08 1.9E-04 1.3E-02 8.5E-04 1.0E-03 2.1E-03 1.6E-05 2.3E-04 3.5E-01 7.7E+00 3.5E-06 9.0E-01
PET
rec
6.6E-01 8.7E-08 6.4E-09 3.0E-08 3.3E-04 1.7E-02 1.2E-03 1.6E-03 3.1E-03 3.4E-05 3.0E-04 8.7E-01 1.2E+01 1.7E-05 1.3E+00
PET
pol
2.1E-01 2.8E-08 2.0E-09 9.4E-09 1.1E-04 5.5E-03 3.7E-04 5.1E-04 1.0E-03 1.1E-05 1.1E-04 2.9E-01 3.6E+00 5.2E-06 4.1E-01
BP - - - - - - - - - - - - - - -
PAP 1.1E-01 1.9E-08 1.7E-09 9.7E-08 2.5E-04 8.1E-03 4.4E-04 6.5E-04 1.6E-03 1.8E-05 1.6E-04 2.6E-01 2.2E+00 3.7E-05 1.6E+00
PAP
b
2.3E-01 3.3E-08 1.8E-09 1.1E-08 3.7E-04 5.6E-03 5.5E-04 8.0E-04 1.9E-03 8.9E-06 1.9E-04 1.8E-01 4.6E+00 4.8E-06 1.5E+00
COM - - - - - - - - - - - - - - -
COTorg - - - - - - - - - - - - - - -
COT - - - - - - - - - - - - - - -

The Danish Environmental Protection Agency / LCA of grocery carrier bags 57
Table 12. Characterized result scores for all carrier bag types, for the EOL3 end-of-life option (secondary reuse as a waste bin bag). Results are provided per refer-
ence flow (see Table 8).
Scen
ari
o
Impact category
CC OD HTC HTNC PM IR POF TA TE FE ME ET RD fos RD Water
kg
CO2 eq
kg
CFC11 eq
CTU
h
CTU
h
kg
PM2.5 eq
kBq
U235 eq
kg NM
VOC
mol
H+ eq
mol
N eq
kg
P eq
kg
N eq CTUe MJ
kg
Sb eq L
LDPE
avg
7.2E-02 1.4E-09 1.1E-09 -7.1E-09 9.6E-06 4.2E-04 1.3E-04 7.5E-05 4.6E-05 -4.1E-07 1.6E-05 5.2E-02 1.1E+00 1.6E-06 2.0E-02
LDPE
s
9.8E-02 2.2E-09 1.6E-09 -9.5E-09 1.3E-05 5.7E-04 1.7E-04 1.0E-04 5.8E-05 -5.6E-07 2.1E-05 7.2E-02 1.5E+00 2.3E-06 1.7E-02
LDPE
h
9.1E-02 1.7E-09 1.4E-09 -8.9E-09 1.2E-05 5.2E-04 1.6E-04 9.3E-05 5.9E-05 -5.0E-07 1.9E-05 6.4E-02 1.4E+00 1.9E-06 -5.7E-02
LDPE
rec
1.6E-01 3.1E-09 2.4E-09 -1.5E-08 2.4E-05 9.4E-04 2.7E-04 1.7E-04 1.2E-04 -5.6E-07 3.5E-05 1.1E-01 2.4E+00 3.3E-06 2.9E-02
PP 6.0E-01 5.1E-08 2.3E-09 -4.9E-08 1.0E-04 8.5E-03 8.4E-04 5.3E-04 9.0E-04 1.2E-05 1.7E-04 2.4E-01 9.6E+00 2.0E-06 7.6E-01
PP
wov
5.0E-01 4.4E-08 1.9E-09 -4.0E-08 8.4E-05 7.2E-03 6.9E-04 4.4E-04 7.6E-04 1.0E-05 1.4E-04 2.0E-01 8.0E+00 1.6E-06 6.5E-01
PET
rec
6.9E-01 6.5E-08 6.7E-09 -8.5E-09 2.6E-04 1.3E-02 8.3E-04 1.0E-03 1.8E-03 3.9E-05 2.0E-04 4.7E-01 1.1E+01 2.0E-05 1.4E+00
PET
pol
2.1E-01 2.2E-08 2.1E-09 5.4E-10 8.9E-05 4.3E-03 2.4E-04 3.5E-04 6.3E-04 1.4E-05 7.8E-05 1.4E-01 3.2E+00 6.9E-06 4.5E-01
BP 1.3E-02 1.5E-08 2.0E-09 3.9E-08 1.0E-04 3.5E-03 2.0E-04 6.6E-04 1.3E-03 1.7E-05 2.2E-04 9.5E-02 1.7E+00 4.6E-06 -2.6E-02
PAP -2.1E-02 1.3E-08 1.1E-09 9.7E-08 1.6E-04 5.8E-03 2.0E-04 3.5E-04 1.0E-03 1.7E-05 1.2E-04 1.6E-01 -1.4E-02 3.7E-05 2.9E-01
PAP
b
1.1E-01 2.7E-08 1.2E-09 9.7E-09 2.7E-04 3.3E-03 3.4E-04 5.1E-04 1.3E-03 8.4E-06 1.6E-04 9.5E-02 2.5E+00 4.7E-06 1.9E-01
COM 1.7E+00 1.2E-06 4.3E-08 -1.8E-07 2.9E-03 4.0E-02 4.7E-03 1.1E-02 3.4E-02 2.4E-04 2.5E-03 4.4E+00 2.8E+01 3.2E-05 5.5E+00
COTorg 1.1E+01 2.8E-05 4.9E-07 1.6E-06 1.1E-02 3.8E-01 2.5E-02 5.7E-02 1.4E-01 1.4E-03 9.7E-03 3.3E+01 2.0E+02 4.4E-04 7.6E+01
COT 3.8E+00 1.0E-05 1.7E-07 5.7E-07 3.8E-03 1.3E-01 8.6E-03 2.0E-02 4.8E-02 4.8E-04 3.4E-03 1.2E+01 7.1E+01 1.6E-04 2.7E+01
58 The Danish Environmental Protection Agency / LCA of grocery carrier bags
5.1.1 LDPE bags: LDPEavg, LDPEs, LDPEh, LDPErec, W
The performance of LDPE carrier bags can be described with the results associated with sce-
nario LDPEavg for LDPE carrier bags with average characteristics. The contribution of produc-
tion, distribution and end-of-life to the results was proportionally the same for scenarios
LDPEs, LDPEh and LDPErec, which differed for the weight of carrier bag and number of carri-
er bags needed to fulfil the function expressed in the functional unit. The results for the climate
change impact category for LDPEavg and the three end-of-life options is presented in Figure
8, with results subdivided according to production, distribution, use and end-of-life for the
packaging and the carrier bag (contribution analysis). A dedicated contribution analysis for the
production phase for the average virgin LDPE carrier bag is presented in Table 13.
For EOL1, LDPE bags presented net impacts for the climate change impact category. 70 % of
the impacts were related to the production of the carrier bag, of which 71 % were solely related
to the LDPE material production. The second largest contribution to the climate change im-
pacts was connected to the incineration process, where the fossil carbon in the LDPE was
released to the atmosphere through air emissions. In this case, the recovery of electricity and
heat from the incineration process lead to less savings in fossil carbon emissions than the
direct emissions. Further climate change impacts were linked to the distribution phase, mostly
from the transportation of the carrier bag.
EOL2 presented net climate change impacts as well, but with a lower magnitude than EOL1.
The production and distribution phases led to the same climate change impacts as EOL1, but
the recycling of LDPE at end-of-life provided climate change savings, which were mainly as-
cribable to the recovery of LDPE as secondary material for the market and consequent avoid-
ed LDPE production. Moreover, less fossil carbon was incinerated and released to atmos-
phere. EOL3 presented lower climate change impacts than EOL1 and EOL2. The reduced net
contribution of the production and distribution phases presented in Figure 8 are due to the
subtracted impacts connected to the waste bin bag that was avoided with the secondary reuse
of the LDPE carrier bag. Emissions of carbon fossil to atmosphere were also lower due to the
prevented emissions that would have occurred with incineration of the waste bin bag.
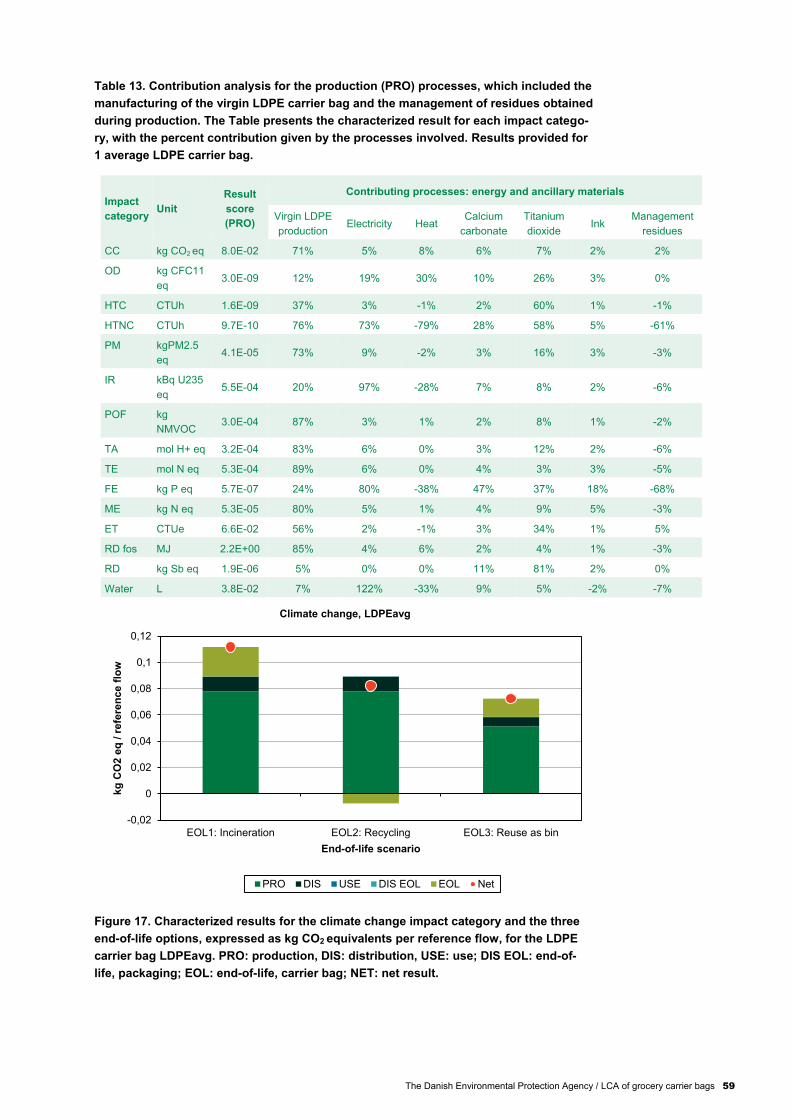
The Danish Environmental Protection Agency / LCA of grocery carrier bags 59
Table 13. Contribution analysis for the production (PRO) processes, which included the
manufacturing of the virgin LDPE carrier bag and the management of residues obtained
during production. The Table presents the characterized result for each impact catego-
ry, with the percent contribution given by the processes involved. Results provided for
1 average LDPE carrier bag.
Impact
category Unit
Result
score
(PRO)
Contributing processes: energy and ancillary materials
Virgin LDPE
production Electricity Heat
Calcium
carbonate
Titanium
dioxide Ink
Management
residues
CC kg CO2 eq 8.0E-02 71% 5% 8% 6% 7% 2% 2%
OD kg CFC11
eq 3.0E-09 12% 19% 30% 10% 26% 3% 0%
HTC CTUh 1.6E-09 37% 3% -1% 2% 60% 1% -1%
HTNC CTUh 9.7E-10 76% 73% -79% 28% 58% 5% -61%
PM kgPM2.5
eq 4.1E-05 73% 9% -2% 3% 16% 3% -3%
IR kBq U235
eq 5.5E-04 20% 97% -28% 7% 8% 2% -6%
POF kg
NMVOC 3.0E-04 87% 3% 1% 2% 8% 1% -2%
TA mol H+ eq 3.2E-04 83% 6% 0% 3% 12% 2% -6%
TE mol N eq 5.3E-04 89% 6% 0% 4% 3% 3% -5%
FE kg P eq 5.7E-07 24% 80% -38% 47% 37% 18% -68%
ME kg N eq 5.3E-05 80% 5% 1% 4% 9% 5% -3%
ET CTUe 6.6E-02 56% 2% -1% 3% 34% 1% 5%
RD fos MJ 2.2E+00 85% 4% 6% 2% 4% 1% -3%
RD kg Sb eq 1.9E-06 5% 0% 0% 11% 81% 2% 0%
Water L 3.8E-02 7% 122% -33% 9% 5% -2% -7%
Figure 17. Characterized results for the climate change impact category and the three
end-of-life options, expressed as kg CO2 equivalents per reference flow, for the LDPE
carrier bag LDPEavg. PRO: production, DIS: distribution, USE: use; DIS EOL: end-of-
life, packaging; EOL: end-of-life, carrier bag; NET: net result.
-0,02
0
0,02
0,04
0,06
0,08
0,1
0,12
EOL1: Incineration EOL2: Recycling EOL3: Reuse as bin
kg
CO
2 e
q /
refe
ren
ce f
low
End-of-life scenario
Climate change, LDPEavg
PRO DIS USE DIS EOL EOL Net

60 The Danish Environmental Protection Agency / LCA of grocery carrier bags
Overall, the climate change results indicate that recycling an LDPE carrier bag provides lower
impacts than incinerating it. Secondary reuse as waste bin bag, however, results in more ben-
efits than recycling. This trend in the impacts could be observed also for a few other impact
categories, which are: photochemical ozone formation, human toxicity, cancer effects and
resource depletion, fossil.
The remaining impact categories also provided overall net impacts, with exception of human
toxicity, non-cancer effects, and freshwater eutrophication. In these cases savings were asso-
ciated with the recovery of electricity and heat in the incineration process. Contrarily to the
climate change impact category, recycling never provided a better result than incineration for
these impact categories. This was mostly due to the energy requirements for the recycling
process and the transportation distances to the sorting and recycling facilities and the less
energy recovered in the incineration process. Reusing the LDPE carrier bag as a waste bin
bag before incineration always provided a better environmental performance than incineration
and recycling. For all end-of-life options, the management and recycling of the cardboard
packaging used for distribution of the carrier bags did not provide a high contribution to the
results, with exception of water use.
Regarding the contribution analysis for the production phase of average virgin LDPE carrier
bag provided in Table 13 (common to EOL1, EOL2 and EOL3), the LDPE material production
data largely contributed to the impacts in most of the impact categories, together with energy
consumption. Negative scores in some impact categories are due to the use of a consequen-
tial database. Depending on the way consequential modelling is applied in Ecoinvent, the
production of some intermediate exchanges can result in the decrease of production of anoth-
er, to which is assigned a negative sign. For example, in the case of market for heat from
natural gas that was used for this project, utilization of this heat source may lead to the avoid-
ed use of other heat sources, with a negative net impact.
The trend observed for LDPEavg in the results for all impact categories was similarly observed
for all the LDPE carrier bags. Differences were due to the weight of the different carrier bag
types and the number of bags necessary to fulfil the function. Figure 9 shows the climate
change characterized results for all the LDPE carrier bag options (LDPEavg, LDPEs, LDPEh,
LDPErec) and for the waste bin bag (W, also LDPE) for EOL1. Although some carrier bags
had lower weight than the other options to which they are compared, LDPEs and LDPErec
provided higher impacts because more than one bag was required in order to provide for the
functionality expressed in the functional unit. Between LDPE carrier bags, LDPEh (LDPE with
rigid handle) provided the best environmental performance for climate change. As previously
explained in the assumptions paragraph, it was not possible to model LDPErec with recycled
LDPE data, so the virgin LDPE production data was used instead.

The Danish Environmental Protection Agency / LCA of grocery carrier bags 61
Figure 9. Characterized results for the climate change impact category, incineration
end-of-life option (EOL1) expressed as kg CO2 equivalents per reference flow, for the
LDPE carrier bags LDPEavg, LDPEs, LDPEh, LDPErec and for the LDPE waste bin bag
(W). PRO: production, DIS: distribution, USE: use; DIS EOL: end-of-life, packaging;
EOL: end-of-life, carrier bag; NET: net result.
5.1.2 PP bags: PP, PPwov
The environmental performance of PP carrier bags can be described by the characterized
results associated with PP (non-woven PP carrier bag). The results for PPwov presented the
same contribution analysis, with slightly lower magnitude, since PPwov presented a slightly
lighter weight and consequently required less material and energy for its production.
As observed for the LDPE carrier bags, climate change results presented overall net impacts.
The impacts in EOL1 (and EOL2) were mainly associated with the production of the carrier
bag, of which 69 % were associated with the production of PP (Figure 10). Emissions were
also related to the release of fossil carbon to atmosphere during incineration and transporta-
tion. Recycling of PP presented lower impacts than incineration, for the recovery of material
and lower fossil carbon release to atmosphere. EOL3 presented reduced impacts with respect
to EOL1 for the savings associated with the avoided use and disposal of the waste bin bag,
but with a small difference. The mass of avoided LDPE was proportionally lower than in the
case of LDPE carrier bags, therefore it could not reduce the production and distribution im-
pacts as in the case of LDPE carrier bags. As a consequence, recycling resulted as more
beneficial disposal option than secondary reuse. PP carrier bags were considerably heavier
than the waste bin bag, so could proportionally substitute more primary produced PP than
avoiding the production of the LDPE waste bin bag. The same trend could be observed for the
impact category resource depletion, fossil.
All the remaining impact categories presented net impacts, with exception of human toxicity,
non-cancer effects. Savings for the latter impact category were associated with the recovery of
electricity and heat in the incineration process. However, for all impact categories different
than climate change, recycling was never more beneficial than incineration, and reuse as a
waste bin bag always provided the overall best environmental performance, even if with only a
slight difference with incineration. It is worth underlining that PP carrier bags may also not fully
provide for the functionality of an LDPE waste bin bag due to their permeability to water.
0,00
0,05
0,10
0,15
0,20
0,25
W LDPEavg LDPEs LDPEh LDPErec
kg
CO
2 e
q /
refe
ren
ce f
low
Waste bin bag / LDPE grocery carrier bags
Climate change, EOL1
PRO DIS USE DIS EOL EOL
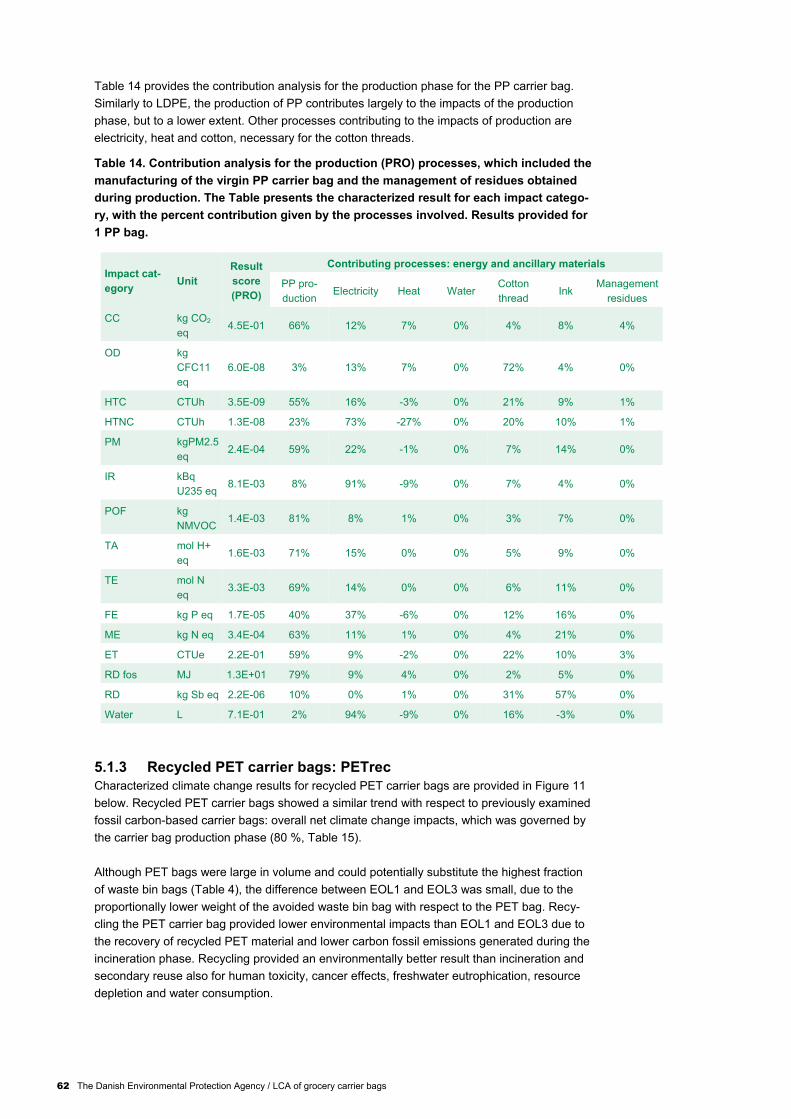
62 The Danish Environmental Protection Agency / LCA of grocery carrier bags
Table 14 provides the contribution analysis for the production phase for the PP carrier bag.
Similarly to LDPE, the production of PP contributes largely to the impacts of the production
phase, but to a lower extent. Other processes contributing to the impacts of production are
electricity, heat and cotton, necessary for the cotton threads.
Table 14. Contribution analysis for the production (PRO) processes, which included the
manufacturing of the virgin PP carrier bag and the management of residues obtained
during production. The Table presents the characterized result for each impact catego-
ry, with the percent contribution given by the processes involved. Results provided for
1 PP bag.
Impact cat-
egory Unit
Result
score
(PRO)
Contributing processes: energy and ancillary materials
PP pro-
duction Electricity Heat Water
Cotton
thread Ink
Management
residues
CC kg CO2
eq 4.5E-01 66% 12% 7% 0% 4% 8% 4%
OD kg
CFC11
eq
6.0E-08 3% 13% 7% 0% 72% 4% 0%
HTC CTUh 3.5E-09 55% 16% -3% 0% 21% 9% 1%
HTNC CTUh 1.3E-08 23% 73% -27% 0% 20% 10% 1%
PM kgPM2.5
eq 2.4E-04 59% 22% -1% 0% 7% 14% 0%
IR kBq
U235 eq 8.1E-03 8% 91% -9% 0% 7% 4% 0%
POF kg
NMVOC 1.4E-03 81% 8% 1% 0% 3% 7% 0%
TA mol H+
eq 1.6E-03 71% 15% 0% 0% 5% 9% 0%
TE mol N
eq 3.3E-03 69% 14% 0% 0% 6% 11% 0%
FE kg P eq 1.7E-05 40% 37% -6% 0% 12% 16% 0%
ME kg N eq 3.4E-04 63% 11% 1% 0% 4% 21% 0%
ET CTUe 2.2E-01 59% 9% -2% 0% 22% 10% 3%
RD fos MJ 1.3E+01 79% 9% 4% 0% 2% 5% 0%
RD kg Sb eq 2.2E-06 10% 0% 1% 0% 31% 57% 0%
Water L 7.1E-01 2% 94% -9% 0% 16% -3% 0%
5.1.3 Recycled PET carrier bags: PETrec
Characterized climate change results for recycled PET carrier bags are provided in Figure 11
below. Recycled PET carrier bags showed a similar trend with respect to previously examined
fossil carbon-based carrier bags: overall net climate change impacts, which was governed by
the carrier bag production phase (80 %, Table 15).
Although PET bags were large in volume and could potentially substitute the highest fraction
of waste bin bags (Table 4), the difference between EOL1 and EOL3 was small, due to the
proportionally lower weight of the avoided waste bin bag with respect to the PET bag. Recy-
cling the PET carrier bag provided lower environmental impacts than EOL1 and EOL3 due to
the recovery of recycled PET material and lower carbon fossil emissions generated during the
incineration phase. Recycling provided an environmentally better result than incineration and
secondary reuse also for human toxicity, cancer effects, freshwater eutrophication, resource
depletion and water consumption.
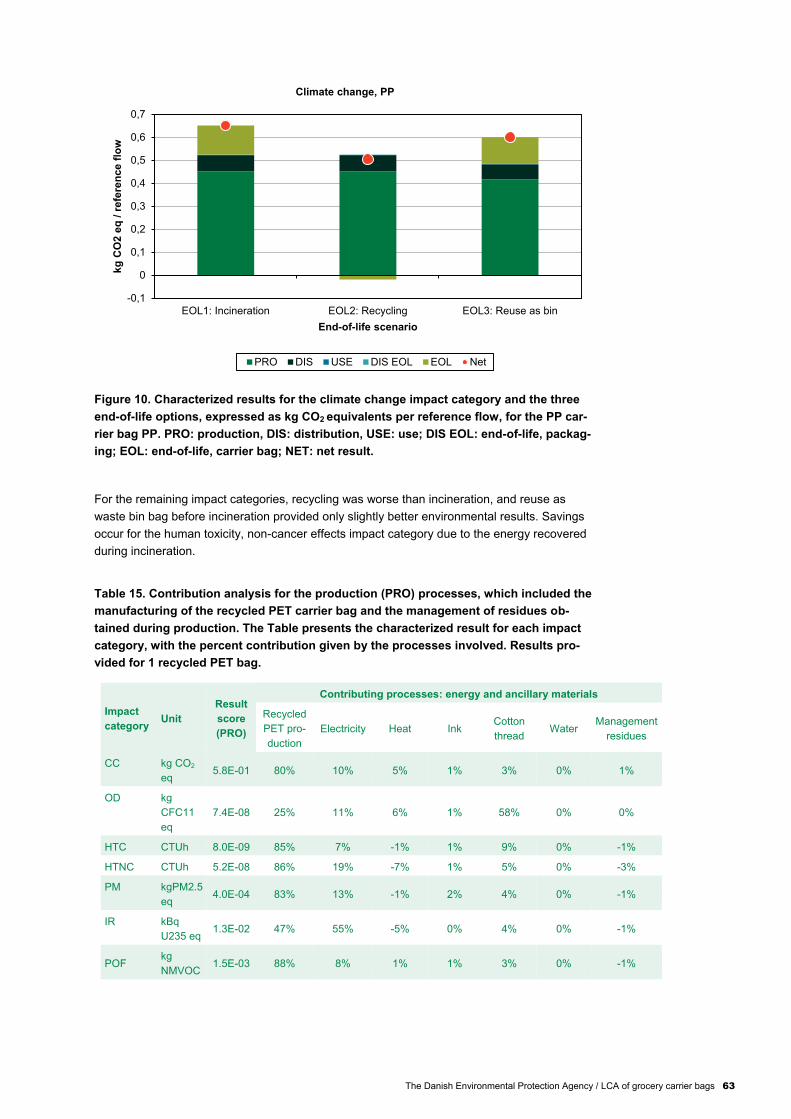
The Danish Environmental Protection Agency / LCA of grocery carrier bags 63
Figure 10. Characterized results for the climate change impact category and the three
end-of-life options, expressed as kg CO2 equivalents per reference flow, for the PP car-
rier bag PP. PRO: production, DIS: distribution, USE: use; DIS EOL: end-of-life, packag-
ing; EOL: end-of-life, carrier bag; NET: net result.
For the remaining impact categories, recycling was worse than incineration, and reuse as
waste bin bag before incineration provided only slightly better environmental results. Savings
occur for the human toxicity, non-cancer effects impact category due to the energy recovered
during incineration.
Table 15. Contribution analysis for the production (PRO) processes, which included the
manufacturing of the recycled PET carrier bag and the management of residues ob-
tained during production. The Table presents the characterized result for each impact
category, with the percent contribution given by the processes involved. Results pro-
vided for 1 recycled PET bag.
Impact
category Unit
Result
score
(PRO)
Contributing processes: energy and ancillary materials
Recycled
PET pro-
duction
Electricity Heat Ink Cotton
thread Water
Management
residues
CC kg CO2
eq 5.8E-01 80% 10% 5% 1% 3% 0% 1%
OD kg
CFC11
eq
7.4E-08 25% 11% 6% 1% 58% 0% 0%
HTC CTUh 8.0E-09 85% 7% -1% 1% 9% 0% -1%
HTNC CTUh 5.2E-08 86% 19% -7% 1% 5% 0% -3%
PM kgPM2.5
eq 4.0E-04 83% 13% -1% 2% 4% 0% -1%
IR kBq
U235 eq 1.3E-02 47% 55% -5% 0% 4% 0% -1%
POF kg
NMVOC 1.5E-03 88% 8% 1% 1% 3% 0% -1%
-0,1
0
0,1
0,2
0,3
0,4
0,5
0,6
0,7
EOL1: Incineration EOL2: Recycling EOL3: Reuse as bin
kg
CO
2 e
q /
refe
ren
ce f
low
End-of-life scenario
Climate change, PP
PRO DIS USE DIS EOL EOL Net

64 The Danish Environmental Protection Agency / LCA of grocery carrier bags
Table 15. (continued) Contribution analysis for the production (PRO) processes, which
included the manufacturing of the recycled PET carrier bag and the management of
residues obtained during production. The Table presents the characterized result for
each impact category, with the percent contribution given by the processes involved.
Results provided for 1 recycled PET bag.
Impact cat-
egory Unit
Result
score
(PRO)
Contributing processes: energy and ancillary materials
Recycled
PET produc-
tion
Electricity Heat Ink Cotton
thread Water
Management
residues
TA mol H+
eq 2.2E-03 86% 11% 0% 1% 4% 0% -2%
TE mol N
eq 4.3E-03 84% 11% 0% 2% 5% 0% -2%
FE kg P eq 4.5E-05 85% 14% -2% 1% 5% 0% -3%
ME kg N
eq 3.8E-04 84% 9% 1% 4% 4% 0% -1%
ET CTUe 4.7E-01 67% 4% -1% 1% 10% 0% 18%
RD fos MJ 1.4E+01 86% 8% 4% 1% 2% 0% -1%
RD kg Sb
eq 2.1E-05 95% 0% 0% 1% 3% 0% 0%
Water L 1.4E+00 49% 48% -5% 0% 8% 0% -1%
Figure 11. Characterized results for the climate change impact category and the three
end-of-life options, expressed as kg CO2 equivalents per reference flow, for the recycled
PET carrier bag PETrec. PRO: production, DIS: distribution, USE: use; DIS EOL: end-of-
life, packaging; EOL: end-of-life, carrier bag; NET: net result.
0
0,1
0,2
0,3
0,4
0,5
0,6
0,7
0,8
0,9
EOL1: Incineration EOL2: Recycling EOL3: Reuse as bin
kg
CO
2 e
q /
refe
ren
ce f
low
End-of-life scenario
Climate change, PETrec
PRO DIS USE DIS EOL EOL Net

The Danish Environmental Protection Agency / LCA of grocery carrier bags 65
5.1.4 Polyester bags: PETpol
In accordance with what already observed for other carrier bags, climate change impacts were
mostly ascribable to the carrier bag production phase (76 % of the climate change impacts, as
observed for recycled PET carrier bags). Table 16 provides the contribution analysis for the
production phase.
Table 16. Contribution analysis for the production (PRO) processes, which included the
manufacturing of the virgin PET polyester carrier bag and the management of residues
obtained during production. The Table presents the characterized result for each im-
pact category, with the percent contribution given by the processes involved. Results
provided for 1 PET polyester bag.
Impact
category Unit
Result
score
(PRO)
Contributing processes: energy and ancillary materials
Virgin
PET pro-
duction
Electricity Heat Ink Cotton
thread Water
Management
residues
CC kg CO2
eq 2.0E-01 76% 9% 5% 6% 3% 0% 1%
OD kg
CFC11
eq
2.5E-08 23% 11% 6% 3% 58% 0% 0%
HTC CTUh 2.7E-09 82% 7% -1% 4% 9% 0% -1%
HTNC CTUh 1.7E-08 83% 19% -7% 3% 5% 0% -3%
PM kgPM2.5
eq 1.4E-04 78% 12% -1% 8% 4% 0% -1%
IR kBq
U235 eq 4.4E-03 44% 56% -6% 2% 4% 0% -1%
POF kg
NMVOC 5.0E-04 84% 8% 1% 6% 3% 0% -1%
TA mol H+
eq 7.5E-04 81% 11% 0% 6% 4% 0% -2%
TE mol N
eq 1.5E-03 79% 10% 0% 8% 5% 0% -1%
FE kg P eq 1.6E-05 81% 14% -2% 6% 4% 0% -2%
ME kg N eq 1.4E-04 72% 8% 1% 16% 4% 0% -1%
ET CTUe 1.5E-01 63% 4% -1% 5% 11% 0% 18%
RD fos MJ 4.8E+00 83% 8% 4% 4% 2% 0% -1%
RD kg Sb eq 7.2E-06 91% 0% 0% 6% 3% 0% 0%
Water L 4.5E-01 49% 49% -5% -2% 8% 0% -1%
EOL 3 was the most favourable disposal option for climate change, while EOL1 was the worst,
due to fossil carbon emissions to air during incineration. The difference between EOL1 and
EOL3 results for climate change is due to the lower weight of the polyester bag with respect to
the recycled PET carrier bag, which therefore substitutes less material when reused as a
waste bin bag. EOL3 is the disposal option that provides the lowest impacts in most of the
impact categories assessed.
5.1.5 Comparison of fossil plastic carrier bags
The following Figure 12 aims at comparing the climate change results associated with the
fossil carbon-based grocery shopping bags that have been presented so far. The comparison
of results highlights that the lowest climate change impacts were calculated for LDPE. This
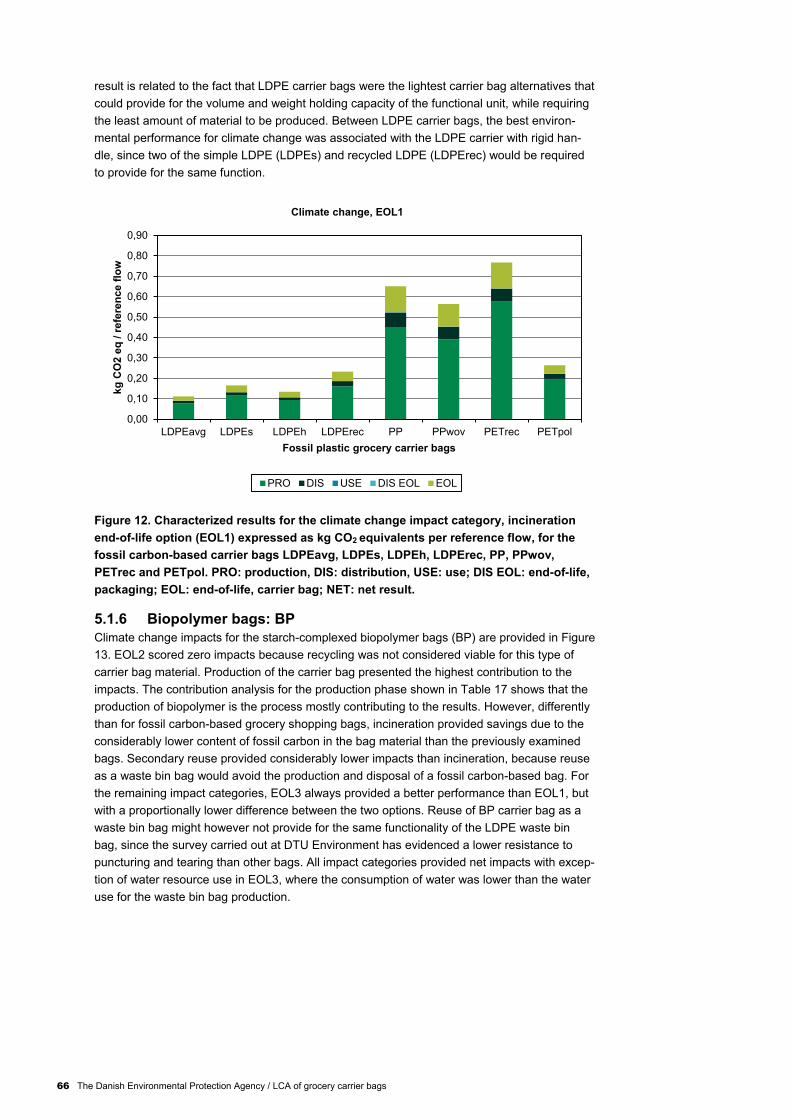
66 The Danish Environmental Protection Agency / LCA of grocery carrier bags
result is related to the fact that LDPE carrier bags were the lightest carrier bag alternatives that
could provide for the volume and weight holding capacity of the functional unit, while requiring
the least amount of material to be produced. Between LDPE carrier bags, the best environ-
mental performance for climate change was associated with the LDPE carrier with rigid han-
dle, since two of the simple LDPE (LDPEs) and recycled LDPE (LDPErec) would be required
to provide for the same function.
Figure 12. Characterized results for the climate change impact category, incineration
end-of-life option (EOL1) expressed as kg CO2 equivalents per reference flow, for the
fossil carbon-based carrier bags LDPEavg, LDPEs, LDPEh, LDPErec, PP, PPwov,
PETrec and PETpol. PRO: production, DIS: distribution, USE: use; DIS EOL: end-of-life,
packaging; EOL: end-of-life, carrier bag; NET: net result.
5.1.6 Biopolymer bags: BP
Climate change impacts for the starch-complexed biopolymer bags (BP) are provided in Figure
13. EOL2 scored zero impacts because recycling was not considered viable for this type of
carrier bag material. Production of the carrier bag presented the highest contribution to the
impacts. The contribution analysis for the production phase shown in Table 17 shows that the
production of biopolymer is the process mostly contributing to the results. However, differently
than for fossil carbon-based grocery shopping bags, incineration provided savings due to the
considerably lower content of fossil carbon in the bag material than the previously examined
bags. Secondary reuse provided considerably lower impacts than incineration, because reuse
as a waste bin bag would avoid the production and disposal of a fossil carbon-based bag. For
the remaining impact categories, EOL3 always provided a better performance than EOL1, but
with a proportionally lower difference between the two options. Reuse of BP carrier bag as a
waste bin bag might however not provide for the same functionality of the LDPE waste bin
bag, since the survey carried out at DTU Environment has evidenced a lower resistance to
puncturing and tearing than other bags. All impact categories provided net impacts with excep-
tion of water resource use in EOL3, where the consumption of water was lower than the water
use for the waste bin bag production.
0,00
0,10
0,20
0,30
0,40
0,50
0,60
0,70
0,80
0,90
LDPEavg LDPEs LDPEh LDPErec PP PPwov PETrec PETpol
kg
CO
2 e
q /
refe
ren
ce f
low
Fossil plastic grocery carrier bags
Climate change, EOL1
PRO DIS USE DIS EOL EOL

The Danish Environmental Protection Agency / LCA of grocery carrier bags 67
Table 17. Contribution analysis for the production (PRO) processes, which included the
manufacturing of the biopolymer carrier bag and the management of residues obtained
during production. The Table presents the characterized result for each impact catego-
ry, with the percent contribution given by the processes involved. Results provided for
1 biopolymer bag.
Impact cate-
gory Unit
Result score
(PRO)
Contributing processes: energy and ancillary materials
Biopolymer
production Electricity
Titanium
dioxide Water Ink
Manage-
ment resi-
dues
CC kg CO2 eq 4.9E-02 86% 9% 5% 0% 1% 0%
OD kg CFC11 eq 7.2E-09 87% 8% 5% 0% 0% 0%
HTC CTUh 1.2E-09 62% 4% 34% 0% 0% 0%
HTNC CTUh 1.9E-08 95% 4% 1% 0% 0% 0%
PM kgPM2.5 eq 6.3E-05 89% 6% 4% 0% 1% 0%
IR kBq U235 eq 1.7E-03 65% 34% 1% 0% 0% 0%
POF kg NMVOC 1.8E-04 89% 5% 5% 0% 1% 0%
TA mol H+ eq 4.1E-04 91% 5% 4% 0% 0% 0%
TE mol N eq 7.4E-04 94% 5% 1% 0% 1% 0%
FE kg P eq 8.3E-06 93% 6% 1% 0% 0% 0%
ME kg N eq 1.2E-04 95% 2% 2% 0% 1% 0%
ET CTUe 5.5E-02 79% 3% 17% 0% 0% 0%
RD fos MJ 1.5E+00 91% 6% 3% 0% 1% 0%
RD kg Sb eq 2.5E-06 78% 0% 26% 0% 1% -5%
Water L 2.1E-03 -26% 87% 41% 3% -13% 8%
Figure 13. Characterized results for the climate change impact category and the three
end-of-life options, expressed as kg CO2 equivalents per reference flow, for the starch-
complexed biopolymer carrier bag BP. PRO: production, DIS: distribution, USE: use;
DIS EOL: end-of-life, packaging; EOL: end-of-life, carrier bag; NET: net result.
-0,06
-0,04
-0,02
0
0,02
0,04
0,06
0,08
0,1
0,12
0,14
EOL1: Incineration EOL2: Recycling EOL3: Reuse as bin
kg
CO
2 e
q /
refe
ren
ce f
low
End-of-life scenario
Climate change, BP
PRO DIS USE DIS EOL EOL Net

68 The Danish Environmental Protection Agency / LCA of grocery carrier bags
5.1.7 Paper bags: PAP, PAPb
The environmental performance of paper carrier bags was calculated for the case of both
unbleached and bleached craft paper. The characterized results for the climate change impact
category for unbleached paper (PAP) are presented in Figure 14. Table 18 provides the con-
tribution analysis for the production phase. The majority of the impacts from the production can
be ascribed to craft paper production.
Table 18. Contribution analysis for the production (PRO) processes, which included the
manufacturing of the paper carrier bag and the management of residues obtained dur-
ing production. The Table presents the characterized result for each impact category,
with the percent contribution given by the processes involved. Results provided for 1
unbleached paper bag.
Impact
category Unit
Result
score
(PRO)
Contributing processes: energy and ancillary materials
Craft paper
production Electricity Glue Ink
Management
residues
CC kg CO2
eq 3.1E-02 87% 6% 2% 10% -5%
OD kg
CFC11
eq
4.9E-09 74% 6% 16% 4% 0%
HTC CTUh 7.1E-10 93% 3% 1% 4% -1%
HTNC CTUh 4.9E-08 100% 1% 0% 0% -1%
PM kgPM2.
5 eq 8.8E-05 95% 2% 0% 3% -1%
IR kBq
U235 eq 2.4E-03 78% 11% 11% 1% -1%
POF
kg
NMVOC 1.7E-04 91% 3% 3% 5% -2%
TA
mol H+
eq 2.5E-04 94% 3% 2% 5% -5%
TE
mol N
eq 6.0E-04 93% 3% 1% 5% -2%
FE kg P eq 8.3E-06 97% 3% 0% 3% -3%
ME kg N eq 6.6E-05 89% 2% 1% 9% -2%
ET CTUe 6.9E-02 96% 1% 1% 3% -1%
RD fos MJ 5.9E-01 79% 7% 11% 9% -6%
RD
kg Sb
eq 1.9E-05 100% 0% 0% 1% 0%
Water L 1.4E-01 88% 17% -2% -1% -1%
As in the case of the biopolymer bag, climate change impacts for the incineration process
provided net savings. The production process contributed proportionally less to the climate
change impacts than in the previously examined bags. Recycling of paper provided net and
higher climate change impacts than incineration, due to transportation distances, energy re-
quirements and, mostly, to the low savings associated with avoided production of craft paper.
The quality of craft paper used for paper bags was assumed to be only recyclable into paper
for cardboard production.
For all the remaining impact categories with exception of resource depletion, recycling always
performed worse than incineration, and secondary reuse always provided the absolute lowest

The Danish Environmental Protection Agency / LCA of grocery carrier bags 69
impacts (saving in the case of resource depletion), provided that the paper carrier bag can
provide the same functionality as a waste bin bag than the LDPE waste bin bag.
Impacts for the bleached paper bag (PAPb) were considerably higher due to the production
phase of the bleached paper. Overall, the same trend between disposal options was observed,
with recycling always providing larger impacts than incineration and secondary reuse. The
results of the environmental assessment indicate that utilizing unbleached paper for the paper
bag material is preferable than utilizing bleached paper.
Figure 14. Characterized results for the climate change impact category and the three
end-of-life options, expressed as kg CO2 equivalents per reference flow, for the un-
bleached paper carrier bag PAP. PRO: production, DIS: distribution, USE: use; DIS
EOL: end-of-life, packaging; EOL: end-of-life, carrier bag; NET: net result.
5.1.8 Cotton and composite bags: COTorg, COT, COM
The characterized results for the cotton bag options (COTorg, COT) and the carrier bag with
composite materials (COM) are presented in the same paragraph due to their shared charac-
teristics. As it is illustrated for the climate change results for organic cotton in Figure 15, these
types of carrier bags presented the highest observed impacts related to their production. EOL2
scored zero in Figure 15 since recycling was not considered viable for this type of carrier bag.
The same was assumed for COT and COM.
In the case of organic cotton (COTorg), production contributed to 99 % of the impact, 98 %
and 96% for COT and COM scenarios, respectively. The contribution analysis for the produc-
tion phase of these bags is provided in Tables 19 – 21. The high environmental cost of the
cotton production can be ascribed to the energy and material required, which is responsible for
80 % of the climate change impacts. In general, the results showed very little difference be-
tween EOL1 and EOL3, due to the comparatively small weight of the avoided waste bin bag in
comparison to the mass (and resources required for its production) of the cotton bag. The
same behaviour was observed for all impact categories, as well as for COT and COM, even if
with a lower magnitude in the impacts.
The environmental impacts connected to the production of the organic cotton bag (COTorg)
were considerably higher than those of the conventional cotton bag (COT). This is due to the
fact that organic cotton production does not involve the use of synthetic chemicals such as
-0,08
-0,06
-0,04
-0,02
0
0,02
0,04
0,06
0,08
0,1
0,12
EOL1: Incineration EOL2: Recycling EOL3: Reuse as bin
kg
CO
2 e
q /
refe
ren
ce f
low
End-of-life scenario
Climate change, PAP
PRO DIS USE DIS EOL EOL Net
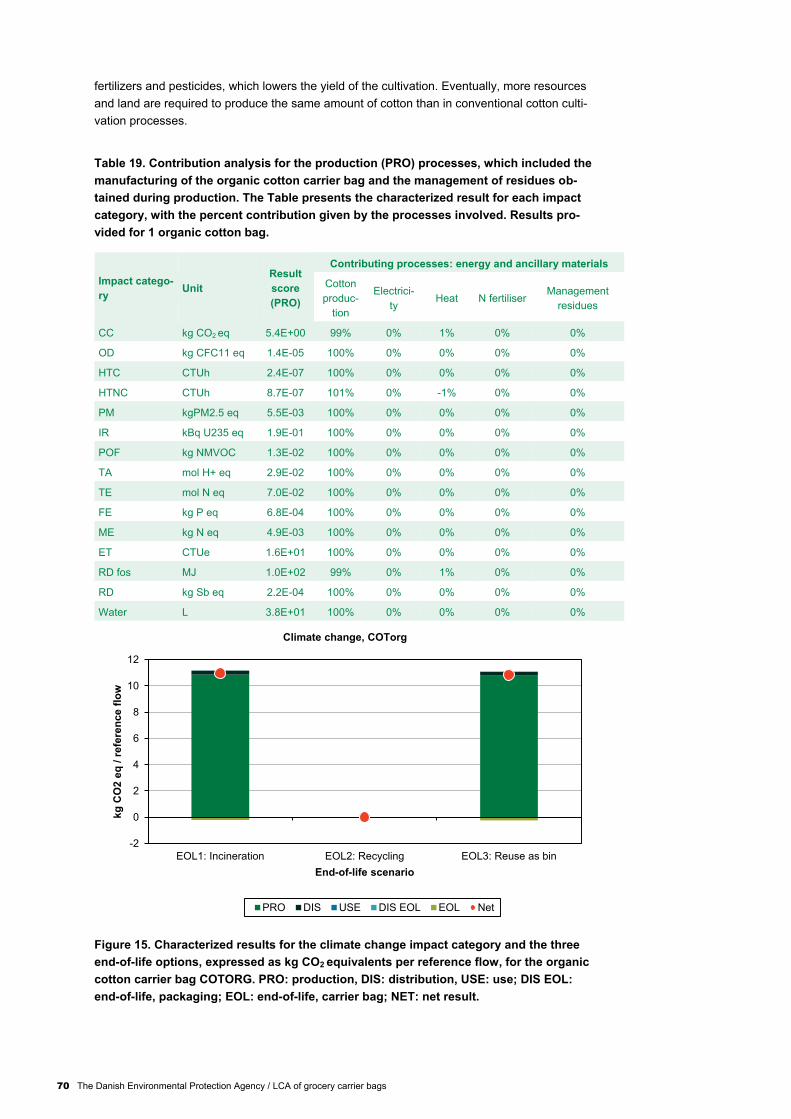
70 The Danish Environmental Protection Agency / LCA of grocery carrier bags
fertilizers and pesticides, which lowers the yield of the cultivation. Eventually, more resources
and land are required to produce the same amount of cotton than in conventional cotton culti-
vation processes.
Table 19. Contribution analysis for the production (PRO) processes, which included the
manufacturing of the organic cotton carrier bag and the management of residues ob-
tained during production. The Table presents the characterized result for each impact
category, with the percent contribution given by the processes involved. Results pro-
vided for 1 organic cotton bag.
Impact catego-
ry Unit
Result
score
(PRO)
Contributing processes: energy and ancillary materials
Cotton
produc-
tion
Electrici-
ty Heat N fertiliser
Management
residues
CC kg CO2 eq 5.4E+00 99% 0% 1% 0% 0%
OD kg CFC11 eq 1.4E-05 100% 0% 0% 0% 0%
HTC CTUh 2.4E-07 100% 0% 0% 0% 0%
HTNC CTUh 8.7E-07 101% 0% -1% 0% 0%
PM kgPM2.5 eq 5.5E-03 100% 0% 0% 0% 0%
IR kBq U235 eq 1.9E-01 100% 0% 0% 0% 0%
POF kg NMVOC 1.3E-02 100% 0% 0% 0% 0%
TA mol H+ eq 2.9E-02 100% 0% 0% 0% 0%
TE mol N eq 7.0E-02 100% 0% 0% 0% 0%
FE kg P eq 6.8E-04 100% 0% 0% 0% 0%
ME kg N eq 4.9E-03 100% 0% 0% 0% 0%
ET CTUe 1.6E+01 100% 0% 0% 0% 0%
RD fos MJ 1.0E+02 99% 0% 1% 0% 0%
RD kg Sb eq 2.2E-04 100% 0% 0% 0% 0%
Water L 3.8E+01 100% 0% 0% 0% 0%
Figure 15. Characterized results for the climate change impact category and the three
end-of-life options, expressed as kg CO2 equivalents per reference flow, for the organic
cotton carrier bag COTORG. PRO: production, DIS: distribution, USE: use; DIS EOL:
end-of-life, packaging; EOL: end-of-life, carrier bag; NET: net result.
-2
0
2
4
6
8
10
12
EOL1: Incineration EOL2: Recycling EOL3: Reuse as bin
kg
CO
2 e
q /
refe
ren
ce f
low
End-of-life scenario
Climate change, COTorg
PRO DIS USE DIS EOL EOL Net

The Danish Environmental Protection Agency / LCA of grocery carrier bags 71
Table 20. Contribution analysis for the production (PRO) processes, which included the
manufacturing of the conventional cotton carrier bag and the management of residues
obtained during production. The Table presents the characterized result for each im-
pact category, with the percent contribution given by the processes involved. Results
provided for 1 conventional cotton bag.
Impact category Unit
Result
score
(PRO)
Contributing processes: energy and ancillary
materials
Cotton
production Electricity Heat
Management
residues
CC kg CO2 eq 3.9E+00 99% 0% 1% 0%
OD kg CFC11
eq 1.0E-05 100% 0% 0% 0%
HTC CTUh 1.7E-07 100% 0% 0% 0%
HTNC CTUh 6.2E-07 101% 0% -1% 0%
PM kgPM2.5
eq 3.9E-03 100% 0% 0% 0%
IR kBq U235
eq 1.3E-01 101% 0% -1% 0%
POF kg NMVOC 8.9E-03 100% 0% 0% 0%
TA mol H+ eq 2.1E-02 100% 0% 0% 0%
TE mol N eq 5.0E-02 100% 0% 0% 0%
FE kg P eq 4.8E-04 100% 0% 0% 0%
ME kg N eq 3.5E-03 100% 0% 0% 0%
ET CTUe 1.1E+01 100% 0% 0% 0%
RD fos MJ 7.2E+01 99% 0% 1% 0%
RD kg Sb eq 1.6E-04 100% 0% 0% 0%
Water L 2.7E-01 100% 0% 0% 0%
Table 21. Contribution analysis for the production (PRO) processes, which included the
manufacturing of the composite carrier bag and the management of residues obtained
during production. The Table presents the characterized result for each impact catego-
ry, with the percent contribution given by the processes involved. Results provided for
1 composite bag.
Impact cate-
gory Unit
Result
score
(PRO)
Contributing processes: energy and ancillary mate-
rials
Jute
produc-
tion
Cotton
produc-
tion
PP pro-
duction Electricity Heat
Man-
agement
residues
CC kg CO2
eq 1.7E+00 68% 27% 3% 0% 2% 0%
OD kg
CFC11
eq
1.2E-06 3% 97% 0% 0% 0% 0%
HTC CTUh 4.3E-08 52% 48% 1% 0% 0% 0%
HTNC CTUh -1.2E-07 158% -62% 0% 0% 4% 0%
PM kgPM2.
5 eq 3.0E-03 84% 16% 1% 0% 0% 0%

72 The Danish Environmental Protection Agency / LCA of grocery carrier bags
Table 21. (continued) Contribution analysis for the production (PRO) processes, which
included the manufacturing of the composite carrier bag and the management of resi-
dues obtained during production. The Table presents the characterized result for each
impact category, with the percent contribution given by the processes involved. Results
provided for 1 composite bag.
Impact cate-
gory Unit
Result
score
(PRO)
Contributing processes: energy and ancillary materials
Jute
produc-
tion
Cotton
produc-
tion
PP pro-
duction Electricity Heat
Man-
agement
residues
IR kBq
U235
eq
3.6E-02 59% 44% 0% 0% -3% 0%
POF kg
NMVO
C
5.0E-03 74% 21% 5% 0% 0% 0%
TA mol H+
eq 1.1E-02 77% 21% 2% 0% 0% 0%
TE mol N
eq 3.5E-02 82% 17% 1% 0% 0% 0%
FE kg P eq 2.4E-04 76% 24% 1% 0% -1% 0%
ME kg N eq 2.6E-03 82% 16% 2% 0% 0% 0%
ET CTUe 4.2E+00 67% 33% 1% 0% 0% 0%
RD fos MJ 3.0E+01 62% 29% 7% 0% 3% 0%
RD kg Sb
eq 3.1E-05 39% 61% 0% 0% 0% 0%
Water L 5.1E+00 39% 62% 0% 0% -2% 0%
5.2 Overview The aim of the following Figures 16 and 17 is to provide a comparison between the climate
change results for the EOL1 disposal scenarios of all carrier bag alternatives. Cotton and
composite bags were left out of Figure 16 in order to visualize the results for the remaining
carrier bags, which would be out scaled otherwise, as shown in the following Figure 17.
The lowest climate change impacts were provided by LDPE carrier bags with rigid handle,
paper bags and biopolymer bags, with slight differences in results. Heavier PP, PET, polyester
and bleached paper carrier bags provided higher impact scores. The highest absolute impacts
were scored by organic cotton bags, mostly for the environmental cost of the organic cotton
production.

The Danish Environmental Protection Agency / LCA of grocery carrier bags 73
Figure 16. Characterized results for the climate change impact category, incineration
end-of-life option (EOL1) expressed as kg CO2 equivalents per reference flow, for the
carrier bags LDPEavg, LDPEs, LDPEh, LDPErec, PP, PPwov, PETrec, PETpol, BP, PAP,
PAPb. PRO: production, DIS: distribution, USE: use; DIS EOL: end-of-life, packaging;
EOL: end-of-life, carrier bag; NET: net result.
Figure 17. Characterized results for the climate change impact category, incineration
end-of-life option (EOL1) expressed as kg CO2 equivalents per reference flow, for the
carrier bags LDPEavg, LDPEs, LDPEh, LDPErec, PP, PPwov, PETrec, PETpol, BP, PAP,
PAPb, COM, COTorg, COT. PRO: production, DIS: distribution, USE: use; DIS EOL: end-
of-life, packaging; EOL: end-of-life, carrier bag; NET: net result
.
-0,1
0,0
0,1
0,2
0,3
0,4
0,5
0,6
0,7
0,8
0,9kg
CO
2 e
q /
refe
ren
ce f
low
Grocery carrier bags
Climate change, EOL1
PRO DIS USE DIS EOL EOL
-2
0
2
4
6
8
10
12
kg
CO
2 e
q /
refe
ren
ce f
low
Grocery carrier bags
Climate change, EOL1
PRO DIS USE DIS EOL EOL

74 The Danish Environmental Protection Agency / LCA of grocery carrier bags
6. Discussion
6.1 Identification of the best disposal option for each carrier bag
Table 22 indicates, for each of the carrier bags in the rows, the disposal option providing the
lowest environmental impacts, for each of the impact categories in the columns. In order to
facilitate reading, incineration (EOL1) was associated with red colour, recycling (EOL2) was
associated with light blue and secondary reuse as waste bin bag (EOL3) was assigned light
green colour.
Overall, EOL3 is the disposal option that provided the lowest environmental impacts for most
of the impact categories and carrier bag options. As observed in the contribution analysis for
each of the carrier bags, this is due to the fact that reuse as waste bin bag before incineration
allowed avoiding production and disposal of an LDPE carrier bag. The difference between
EOL1 results and EOL3 results was larger (and EOL3 comparatively more beneficial) when
the weight of the carrier bag was comparable to the weight of the LDPE waste bin bag, as in
the case of LDPE carrier bags (LDPEs, LDPEh, LDPErec), biopolymer bags (BP) and paper
bags (PAP, PAPb). For heavier carrier bags, and especially for the cotton (COTorg, COT) and
the composite (COM) bags, the difference between EOL1 and EOL3 result was smaller. EOL3
thus resulted being the overall best disposal option, provided that the reused carrier bag can
fulfil the waste bin bag function.
The results shown in the table also highlight that for heavier plastic carrier bags (PP, PPwov,
PETrec) recycling (EOL2) resulted in being the most favourable disposal option in some im-
pact categories, especially resource depletion and climate change. Therefore, collecting the
waste bin bags within the recyclables waste stream might be a viable option for this type of
carrier bags. The results for the ozone depletion, human toxicity, non-cancer effects and
freshwater eutrophication impact categories showed a consistent preference for the EOL1
disposal scenario, due to the avoided environmental impacts connected to electricity and heat
production that are avoided recovering energy within the incineration process.

The Danish Environmental Protection Agency / LCA of grocery carrier bags 75
Table 22. Disposal options providing the lowest environmental impacts for each of the
carrier bags in the rows and each of the impact categories in the columns. The colour
scale refers to the disposal option: red was assigned to incineration (EOL1), blue to
recycling (EOL2), and green to secondary reuse as a waste bin bag (EOL3). Please refer
to the abbreviations for the acronyms for carrier bags scenarios and impact categories.
Sce-nario name
CC OD HTC HTNC
PM IR POF TA TE FE ME ET RD fos
RD Wa-ter
LDPEavg
EOL 3
EOL 1
EOL 3
EOL 1
EOL 3
EOL 3
EOL 3
EOL 3
EOL 3
EOL 1
EOL 3
EOL 3
EOL 3
EOL 3
EOL 3
LDPEs
EOL 3
EOL 1
EOL 3
EOL 1
EOL 3
EOL 3
EOL 3
EOL 3
EOL 3
EOL 1
EOL 3
EOL 3
EOL 3
EOL 3
EOL 1
LDPEh
EOL 3
EOL 1
EOL 3
EOL 1
EOL 3
EOL 3
EOL 3
EOL 3
EOL 3
EOL 1
EOL 3
EOL 3
EOL 3
EOL 3
EOL 3
LDPErec
EOL 3
EOL 1
EOL 3
EOL 1
EOL 3
EOL 3
EOL 3
EOL 3
EOL 3
EOL 1
EOL 3
EOL 3
EOL 3
EOL 3
EOL 3
PP EOL
2 EOL
1 EOL
3 EOL
1 EOL
3 EOL
3 EOL
3 EOL
3 EOL
3 EOL
1 EOL
3 EOL
3 EOL
2 EOL
3 EOL
3
PPwov
EOL 2
EOL 1
EOL 3
EOL 1
EOL 3
EOL 3
EOL 3
EOL 3
EOL 3
EOL 1
EOL 3
EOL 3
EOL 2
EOL 3
EOL 3
PETrec
EOL 2
EOL 1
EOL 2
EOL 1
EOL 3
EOL 3
EOL 3
EOL 3
EOL 3
EOL 2
EOL 3
EOL 3
EOL 3
EOL 2
EOL 2
PET-pol
EOL 3
EOL 1
EOL 2
EOL 1
EOL 3
EOL 3
EOL 3
EOL 3
EOL 3
EOL 2
EOL 3
EOL 3
EOL 3
EOL 2
EOL 2
BP EOL
3 EOL
1 EOL
3 EOL
1 EOL
3 EOL
3 EOL
3 EOL
3 EOL
3 EOL
1 EOL
3 EOL
3 EOL
3 EOL
3 EOL
3
PAP EOL
3 EOL
1 EOL
3 EOL
1 EOL
3 EOL
3 EOL
3 EOL
3 EOL
3 EOL
1 EOL
3 EOL
3 EOL
3 EOL
3 EOL
3
PAPb EOL
3 EOL
1 EOL
3 EOL
1 EOL
3 EOL
3 EOL
3 EOL
3 EOL
3 EOL
1 EOL
3 EOL
3 EOL
3 EOL
3 EOL
3
CO-Torg
EOL 3
EOL 1
EOL 3
EOL 1
EOL 3
EOL 3
EOL 3
EOL 3
EOL 3
EOL 1
EOL 3
EOL 3
EOL 3
EOL 3
EOL 3
COT EOL
3 EOL
1 EOL
3 EOL
1 EOL
3 EOL
3 EOL
3 EOL
3 EOL
3 EOL
1 EOL
3 EOL
3 EOL
3 EOL
3 EOL
3
COM EOL
3 EOL
1 EOL
3 EOL
1 EOL
3 EOL
3 EOL
3 EOL
3 EOL
3 EOL
1 EOL
3 EOL
3 EOL
3 EOL
3 EOL
3

76 The Danish Environmental Protection Agency / LCA of grocery carrier bags
6.2 Which carrier bag provides the lowest environmental impact to fulfil the function?
Table 23 provides the hierarchy of the characterized results between all carrier bags and dis-
posal options. Each column provides the carrier bag and disposal option results, ordered from
lowest impact to highest impact, for each of the impact categories indicated in the columns.
The colour pattern was assigned in order to distinguish carrier bag types and to aid readability.
Dark blue was assigned to LDPE, lighter blue to PP bags and so on.
For climate change, the carrier bags scoring the lowest climate change impacts were un-
bleached paper, biopolymer and LDPE carrier bags. Paper and biopolymer bags provided the
lowest scores when reused as a waste bin bag. Whether it was reused or incinerated, paper
provided a slightly better climate change performance than LDPE carrier bags. LDPE carrier
bags provided a preferable performance than other carrier bags for climate change when they
were reused, secondarily when they were recycled and thirdly incinerated. Heavier carrier
bags provided the highest climate change impacts, with polyester, PP, recycled PET, compo-
site and cotton providing increasingly higher climate change impacts. As observed in the con-
tribution analysis, a similar pattern could be identified for the impact categories of human tox-
icity, cancer effects, and resource depletion, fossil. The lowest impacts for the remaining im-
pact categories were provided by LDPE carrier bags. LDPEavg results represent an average
LDPE carrier bag; between LDPE carrier bags LDPEh obtained the lowest impacts in most
impact categories. The highest impacts in all impact categories were provided by organic cot-
ton.
Overall, light carrier bags such as LDPE, paper and biopolymer were the carrier bag alterna-
tives that provided the lowest environmental impacts in order to provide for the function ex-
pressed in the functional unit of this LCA. Heavier multiple-use carrier bags such as composite
and cotton bags obtain the highest environmental impacts across all impact categories. For
this reason, it is useful to determine the number of necessary reuse times to lower the envi-
ronmental impacts related to their production to values comparable to lighter carrier bags.

The Danish Environmental Protection Agency / LCA of grocery carrier bags 77
Table 23. Hierarchy of the results obtained by each carrier bag alternative for each of
the disposal options, subdivided by impact categories. The cells in the table represent
the result scores, sorted from lowest (lowest environmental impacts per impact catego-
ry, top) to highest (highest environmental impacts per impact category, bottom). The
colour scale was assigned to facilitate distinguishing between carrier bag types.
CC OD HTC HTNC
PM IR POF TA TE FE ME ET RD fos
RD Wa-ter
PAP EOL3
LDPE avg
EOL1
PAP EOL3
COM EOL1
LDPE avg
EOL3
LDPE avg
EOL3
LDPEs EOL3
LDPE avg
EOL2
LDPE avg
EOL2
LDPE rec
EOL1
PPwov EOL3
LDPE avg
EOL3
PAP EOL3
PPwov EOL3
LDPEh EOL3
BP EOL3
LDPEh EOL1
LDPE avg
EOL3
PP EOL1
LDPEh EOL3
LDPEh EOL3
LDPE rec
EOL3
LDPEh EOL2
LDPEh EOL2
LDPEs EOL1
LDPE avg
EOL3
LDPEh EOL3
LDPE avg
EOL3
LDPE avg
EOL3
BP EOL3
PAP EOL1
LDPE avg
EOL3
PAPb EOL3
PPwov EOL1
LDPEs EOL3
LDPEs EOL3
LDPEh EOL3
LDPEs EOL2
LDPEs EOL2
LDPEh EOL1
LDPEh EOL3
LDPE avg
EOL1
PAP EOL1
LDPE avg
EOL1
LDPEs EOL3
LDPE avg
EOL3
LDPEh EOL3
LDPE avg
EOL2
LDPE rec
EOL1
LDPE avg
EOL1
LDPE avg
EOL1
LDPE avg
EOL3
LDPE rec
EOL2
LDPE avg
EOL1
LDPEs EOL3
PP EOL3
LDPEs EOL3
LDPE avg
EOL2
LDPEh EOL3
LDPE avg
EOL3
LDPE avg
EOL2
LDPEs EOL1
LDPE avg
EOL1
LDPEs EOL1
LDPEh EOL1
LDPEh EOL1
PAPb EOL3
PAPb EOL2
LDPEh EOL1
LDPE avg
EOL1
LDPEs EOL3
LDPEh EOL1
LDPEh EOL3
PP EOL3
BP EOL1
BP EOL1
LDPEs EOL3
LDPEh EOL3
PETrec EOL1
LDPEs EOL1
LDPEs EOL1
PPwov EOL3
PPwov EOL2
LDPE rec
EOL2
LDPE rec
EOL3
LDPE rec
EOL3
LDPE avg
EOL2
LDPEs EOL3
PPwov EOL1
LDPE rec
EOL3
LDPEh EOL3
LDPE rec
EOL1
PAP EOL1
LDPEh EOL1
LDPE rec
EOL3
LDPE rec
EOL3
PP EOL3
LDPE avg
EOL3
LDPEs EOL1
LDPEh EOL3
BP EOL3
PAPb EOL3
LDPEh EOL2
LDPE avg
EOL2
LDPE avg
EOL1
LDPEs EOL3
LDPE-rec
EOL3
LDPEh EOL2
LDPE avg
EOL1
LDPE avg
EOL2
LDPE rec
EOL1
PETpol EOL3
PETpol EOL2
PAP EOL2
LDPE avg
EOL3
PAPb EOL3
BP EOL3
LDPE avg
EOL1
LDPEh EOL1
LDPEh EOL1
LDPEh EOL2
LDPE avg
EOL2
PAPb EOL1
PETpol EOL1
LDPE rec
EOL1
LDPE avg
EOL2
BP EOL3
PAP EOL2
PETpol EOL2
LDPE avg
EOL2
PETpol EOL3
LDPEs EOL1
BP EOL3
LDPEs EOL3
LDPE rec
EOL1
PAP EOL2
LDPEh EOL2
LDPEh EOL1
PAPb EOL1
LDPEh EOL2
LDPEh EOL2
PAP EOL3
PP EOL2
PAPb EOL2
LDPEh EOL2
PETrec EOL3
LDPEh EOL2
LDPEs EOL2
PP EOL1
LDPEs EOL1
LDPE avg
EOL1
LDPEs EOL2
LDPEs EOL3
BP EOL1
LDPEs EOL2
LDPEs EOL2
PETrec EOL3
LDPEh EOL3
LDPE rec
EOL1
LDPEs EOL2
LDPE avg
EOL1
LDPE rec
EOL3
LDPEh EOL1
LDPEh EOL2
LDPE avg
EOL2
PAPb EOL3
LDPE rec
EOL2
PAP EOL2
PAP EOL1
LDPE rec
EOL2
PAPb EOL3
LDPE avg
EOL1
LDPEs EOL3
PPwov EOL2
LDPE rec
EOL2
LDPEh EOL1
PAPb EOL1
PAP EOL2
LDPEs EOL1
LDPE rec
EOL2
LDPEs EOL2
PAP EOL1
PAPb EOL2
COT EOL1
PPwov EOL3
BP EOL3
LDPEh EOL1
LDPE rec
EOL3
PP EOL2
PAPb EOL1
COM EOL3
BP EOL1
LDPE rec
EOL3
LDPEs EOL2
LDPEh EOL2
LDPEh EOL1
PAP EOL3
LDPEs EOL2
COT org
EOL1
PETpol EOL3
LDPE rec
EOL2
COM EOL3
PETrec EOL2
PETrec EOL2
PAPb EOL3
LDPEs EOL1
LDPEs EOL2
LDPEs EOL1
LDPE rec
EOL3
LDPEs EOL2
LDPE rec
EOL3
BP EOL1
PPwov EOL3
LDPE avg
EOL3
PPwov EOL1
PAPb EOL1
LDPEs EOL1
PETpol EOL3
PETpol EOL1
PAPb EOL2
PAP EOL3
PETpol EOL3
PAPb EOL3
PPwov EOL2
PAPb EOL3
LDPEs EOL1
BP EOL3
BP EOL3
LDPEh EOL3
PETpol EOL1
BP EOL1
PETpol EOL1
LDPE avg
EOL1
PPwov EOL1
PPwov EOL1
LDPE rec
EOL1
LDPE rec
EOL1
LDPE rec
EOL2
LDPE rec
EOL1
PAPb EOL1
LDPE rec
EOL2
PAP EOL2
LDPEs EOL1
LDPEs EOL3
PP EOL3
PETpol EOL3
BP EOL1
PAP EOL3
PP EOL1
PPwov EOL3
PETpol EOL1
PAP EOL3
BP EOL1
PP EOL2
PAP EOL3
PAPb EOL1
PETpol EOL1
PETpol EOL2
BP EOL3
BP EOL3
PETpol EOL1
PAP EOL1
LDPEh EOL1
PAP EOL1
PETpol EOL2
PAP EOL1
PETpol EOL1
PETpol EOL3
LDPE rec
EOL2
PAP EOL1
PETpol EOL3
PETpol EOL3
PETpol EOL3
PAP EOL3
PP EOL1
PETpol EOL2
LDPE rec
EOL1
PPwov EOL3
BP EOL1
PP EOL1
PPwov EOL1
PAPb EOL2
LDPE rec
EOL1
BP EOL3
PETpol EOL2
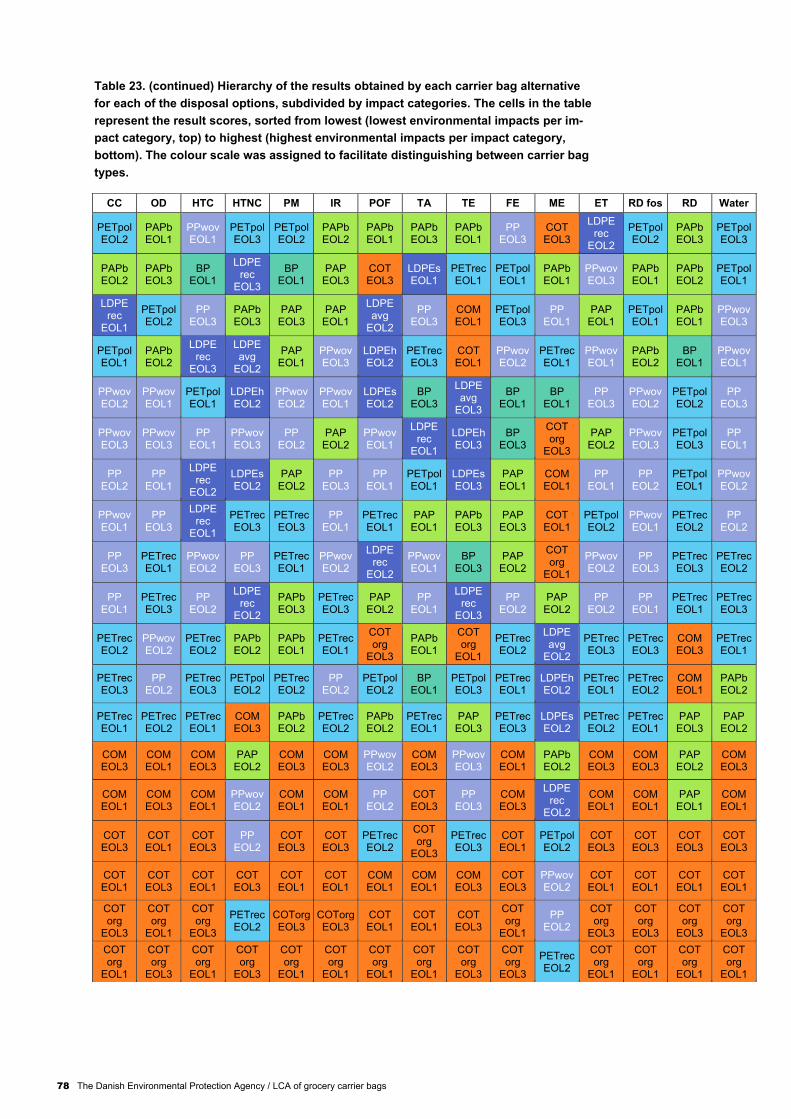
78 The Danish Environmental Protection Agency / LCA of grocery carrier bags
Table 23. (continued) Hierarchy of the results obtained by each carrier bag alternative
for each of the disposal options, subdivided by impact categories. The cells in the table
represent the result scores, sorted from lowest (lowest environmental impacts per im-
pact category, top) to highest (highest environmental impacts per impact category,
bottom). The colour scale was assigned to facilitate distinguishing between carrier bag
types.
CC OD HTC HTNC PM IR POF TA TE FE ME ET RD fos RD Water
PETpol EOL2
PAPb EOL1
PPwov EOL1
PETpol EOL3
PETpol EOL2
PAPb EOL2
PAPb EOL1
PAPb EOL3
PAPb EOL1
PP EOL3
COT EOL3
LDPE rec
EOL2
PETpol EOL2
PAPb EOL3
PETpol EOL3
PAPb EOL2
PAPb EOL3
BP EOL1
LDPE rec
EOL3
BP EOL1
PAP EOL3
COT EOL3
LDPEs EOL1
PETrec EOL1
PETpol EOL1
PAPb EOL1
PPwov EOL3
PAPb EOL1
PAPb EOL2
PETpol EOL1
LDPE rec
EOL1
PETpol EOL2
PP EOL3
PAPb EOL3
PAP EOL3
PAP EOL1
LDPE avg
EOL2
PP EOL3
COM EOL1
PETpol EOL3
PP EOL1
PAP EOL1
PETpol EOL1
PAPb EOL1
PPwov EOL3
PETpol EOL1
PAPb EOL2
LDPE rec
EOL3
LDPE avg
EOL2
PAP EOL1
PPwov EOL3
LDPEh EOL2
PETrec EOL3
COT EOL1
PPwov EOL2
PETrec EOL1
PPwov EOL1
PAPb EOL2
BP EOL1
PPwov EOL1
PPwov EOL2
PPwov EOL1
PETpol EOL1
LDPEh EOL2
PPwov EOL2
PPwov EOL1
LDPEs EOL2
BP EOL3
LDPE avg
EOL3
BP EOL1
BP EOL1
PP EOL3
PPwov EOL2
PETpol EOL2
PP EOL3
PPwov EOL3
PPwov EOL3
PP EOL1
PPwov EOL3
PP EOL2
PAP EOL2
PPwov EOL1
LDPE rec
EOL1
LDPEh EOL3
BP EOL3
COT org
EOL3
PAP EOL2
PPwov EOL3
PETpol EOL3
PP EOL1
PP EOL2
PP EOL1
LDPE rec
EOL2
LDPEs EOL2
PAP EOL2
PP EOL3
PP EOL1
PETpol EOL1
LDPEs EOL3
PAP EOL1
COM EOL1
PP EOL1
PP EOL2
PETpol EOL1
PPwov EOL2
PPwov EOL1
PP EOL3
LDPE rec
EOL1
PETrec EOL3
PETrec EOL3
PP EOL1
PETrec EOL1
PAP EOL1
PAPb EOL3
PAP EOL3
COT EOL1
PETpol EOL2
PPwov EOL1
PETrec EOL2
PP EOL2
PP EOL3
PETrec EOL1
PPwov EOL2
PP EOL3
PETrec EOL1
PPwov EOL2
LDPE rec
EOL2
PPwov EOL1
BP EOL3
PAP EOL2
COT org
EOL1
PPwov EOL2
PP EOL3
PETrec EOL3
PETrec EOL2
PP EOL1
PETrec EOL3
PP EOL2
LDPE rec
EOL2
PAPb EOL3
PETrec EOL3
PAP EOL2
PP EOL1
LDPE rec
EOL3
PP EOL2
PAP EOL2
PP EOL2
PP EOL1
PETrec EOL1
PETrec EOL3
PETrec EOL2
PPwov EOL2
PETrec EOL2
PAPb EOL2
PAPb EOL1
PETrec EOL1
COT org
EOL3
PAPb EOL1
COT org
EOL1
PETrec EOL2
LDPE avg
EOL2
PETrec EOL3
PETrec EOL3
COM EOL3
PETrec EOL1
PETrec EOL3
PP EOL2
PETrec EOL3
PETpol EOL2
PETrec EOL2
PP EOL2
PETpol EOL2
BP EOL1
PETpol EOL3
PETrec EOL1
LDPEh EOL2
PETrec EOL1
PETrec EOL2
COM EOL1
PAPb EOL2
PETrec EOL1
PETrec EOL2
PETrec EOL1
COM EOL3
PAPb EOL2
PETrec EOL2
PAPb EOL2
PETrec EOL1
PAP EOL3
PETrec EOL3
LDPEs EOL2
PETrec EOL2
PETrec EOL1
PAP EOL3
PAP EOL2
COM EOL3
COM EOL1
COM EOL3
PAP EOL2
COM EOL3
COM EOL3
PPwov EOL2
COM EOL3
PPwov EOL3
COM EOL1
PAPb EOL2
COM EOL3
COM EOL3
PAP EOL2
COM EOL3
COM EOL1
COM EOL3
COM EOL1
PPwov EOL2
COM EOL1
COM EOL1
PP EOL2
COT EOL3
PP EOL3
COM EOL3
LDPE rec
EOL2
COM EOL1
COM EOL1
PAP EOL1
COM EOL1
COT EOL3
COT EOL1
COT EOL3
PP EOL2
COT EOL3
COT EOL3
PETrec EOL2
COT org
EOL3
PETrec EOL3
COT EOL1
PETpol EOL2
COT EOL3
COT EOL3
COT EOL3
COT EOL3
COT EOL1
COT EOL3
COT EOL1
COT EOL3
COT EOL1
COT EOL1
COM EOL1
COM EOL1
COM EOL3
COT EOL3
PPwov EOL2
COT EOL1
COT EOL1
COT EOL1
COT EOL1
COT org
EOL3
COT org
EOL1
COT org
EOL3
PETrec EOL2
COTorg EOL3
COTorg EOL3
COT EOL1
COT EOL1
COT EOL3
COT org
EOL1
PP EOL2
COT org
EOL3
COT org
EOL3
COT org
EOL3
COT org
EOL3
COT org
EOL1
COT org
EOL3
COT org
EOL1
COT org
EOL3
COT org
EOL1
COT org
EOL1
COT org
EOL1
COT org
EOL1
COT org
EOL3
COT org
EOL3
PETrec EOL2
COT org
EOL1
COT org
EOL1
COT org
EOL1
COT org
EOL1

The Danish Environmental Protection Agency / LCA of grocery carrier bags 79
6.3 How many times should a carrier bag be reused? This Section provides the calculated number of primary reuse times for each carrier bag type,
as indicated in Section 3. The number of reuse times provided in Table 24 indicates how many
times the carrier bag alternatives in the rows should be reused in order to provide the same
environmental performance of the reference LDPE carrier bag (LDPEavg), associated with
EOL3 as a disposal option. The number of reuse times for each carrier bag alternative was
calculated for each disposal option: EOL1, EOL2, and EOL3
The results are provided for the climate change impact category, as well as across impact
categories. The result score across all impact categories was obtained by calculating the
number of primary reuse times necessary for each impact category, and identifying the maxi-
mum score across all impact categories. This maximum score represents the maximum num-
ber of reuse times that would be required to obtain the same environmental performance of
the reference LDPE carrier bag considering all impact categories. Results for each impact
category, minimum-maximum ranges between number of reuse times and average number of
reuse times are provided in Appendix C.
Zero values are shown where LDPEavg, EOL3 is compared to itself. Values lower than zero
corresponds to carrier bag options that already provide a better environmental performance
than the carrier bag option to which they are compared. Values higher than zero indicate how
many times the corresponding carrier bags in the rows should be reused before being dis-
posed of (with its corresponding end-of-life scenario) in order to provide the environmental
performance of LDPEavg, EOL3.
Table 24. Calculated number of primary reuse times for the carrier bags in the rows,
associated with the disposal options in the columns, necessary to provide the same
environmental performance of the average LDPE carrier bag, reused as a waste bin bag
before incineration (EOL3). Results are provided for the climate change impact category
and across impact categories. Yellow cells highlight the most preferable disposal op-
tion. Results for COTorg, COT and COM have been rounded.
LDPEavg, EOL3
Climate change All impact categories
EOL1 EOL2 EOL3 EOL1 EOL2 EOL3
LDPEavg 0.5 0.1 0.0 1.2 5.0 0.0
LDPEs 1.3 0.7 0.3 2.3 7.8 0.5
LDPEh 0.9 0.4 0.3 1.7 6.1 0.3
LDPErec 2.2 1.4 1.2 3.4 11.7 1.6
PP 8.0 6.0 7.3 38 52 37
PPwov 6.8 5.0 5.9 33 45 32
PETrec 9.6 8.2 8.6 95 84 96
PETpol 2.6 1.9 1.9 35 28 35
BP 0.2 - -0.8 41 - 42
PAP -0.2 0.5 -1.3 42 77 43
PAPB 1.5 2.2 0.6 30 72 43
COTorg 150 - 149 20000 - 20000
COT 53 - 52 7100 - 7100
COM 23 - 23 870 - 870

80 The Danish Environmental Protection Agency / LCA of grocery carrier bags
For climate change, the LDPE carrier bag alternatives LDPEs, LDPEh, LDPErec provided a
comparable performance to the average LDPE carrier bag, with lower number of reuse times
obtained for the EOL3 disposal options. The results indicate that LDPEh is the carrier bag
providing the best climate change performance, since this carrier bag type is associated to the
lowest number of reuse times for all end-of-life options. In general, LDPE carrier bags should
be reused at least one time before being used as a waste bin bag.
Heavier fossil-carbon based bags provided the lowest number of reuse times for the EOL2
disposal options. The results indicate that these types of carrier bags should be reused 5 – 10
times before being disposed, with exception for the polyester bag, whose preferable disposal
option was EOL3 and which scored a needed reuse of 2 times.
Unbleached paper and biopolymer bags scored negative values, indicating that the climate
change impact associated with these bags is already lower than the climate change impact
associated with the average LDPE carrier bag. The negative value indicates that for these
types of carrier bags, reuse before disposal would not even be necessary to provide a better
climate change result. Moreover, the results indicate that paper and biopolymer are a better
option than LDPE with respect to climate change impacts. Bleached paper should be reused
for 2 times, due to the higher environmental costs related to its production.
The absolute highest number of reuse times for the climate change impact category was ob-
tained for composite and cotton carrier bags. In particular, conventional cotton carrier bags
should be reused at least 50 times before being disposed of; organic cotton carrier bags
should be reused 150 times based on their environmental production cost. This calculated
number of primary reuse times for cotton bags complies with results of previous studies. For
example, Edwards and Fry (2011) calculated a number of around 130 reuse times required for
cotton carrier bags to provide similar climate change impacts in comparison to HDPE carrier
bags, which were chosen as reference in that study.
When all impact categories were taken into consideration, Table 24 provides the highest num-
ber of reuse times across all the considered environmental indicators. The results for each
impact category are available in Appendix C. LDPE carrier bags provided the absolute best
environmental performance. With reuse as waste bin bag as the considered as disposal op-
tion, it suffices to reuse LDPE carrier bags one time before reusing them as waste bin bag.
Heavier PP carrier bags and polyester bags would need to be reused 30 – 40 times. Paper
and biopolymer carrier bags should be reused up to 40 times in order to provide for a similar
environmental performance, mostly due to the impacts in the freshwater eutrophication impact
category. In a number of categories bleached paper was found to have a lower impact than
unbleached paper. The reason for this difference was found to be due to a lower data quality
for bleached paper that did not include as detailed a dataset. Since the difference in produc-
tion of bleached versus unbleached kraft paper is only the bleaching step, we did not find it
realistic that unbleached paper could have higher impacts. For these categories we therefore
assume that the bleached number must be the same or higher than the unbleached number.
In order to provide a comparable performance to LDPE in all impact categories, the number of
reuse times for cotton and composite bags increased to thousands of times.
For LDPE carrier bags, the number of reuse times was rather uniform across impact catego-
ries. For PP and PET bags, some impact categories presented higher reuse times than others,
especially ozone depletion, terrestrial eutrophication, freshwater eutrophication and water use.
For these indicators, the results of PP and PET carrier bags were considerably higher (such as
one order of magnitude) than the results obtained by the LDPE carrier bag. This occurred
because for PP and PET carrier bags the higher environmental cost of production is not com-
pensated by the energy or material recovered – while for the lighter LDPE carrier bag the
environmental production costs are lower. The same observations can be made for BP and

The Danish Environmental Protection Agency / LCA of grocery carrier bags 81
PAP carrier bags, which obtained considerably higher numbers of reuse times for terrestrial
and freshwater eutrophication impact categories. Lastly, the high number of reuse times
scored by cotton and composite bags is due only to the ozone depletion impact category,
where cotton production provides considerably large impacts.
It is important to remark that, even if LDPE scored a low (to zero) number of reuse times, this
is due to the fact that it was compared to a reference LDPE carrier bag. Reuse of each type of
carrier bags, even LDPE, should be carried out as many times as possible before disposal. In
the case of heavier carrier bags, customers of Danish supermarkets should be informed on the
optimal number of reuse times of multiple-use carrier bags offered as alternatives for the
LDPE carrier.
Finally, it is important to consider that the avoided reference bag can in practice also be re-
used, and if this is the case then the reuse number calculated above would proportionally be
as many times higher as it was reused. The resulting reuse numbers calculated in this study
should therefore be seen as a minimum reuse number that could be higher.
All results presented above are linked to specific types of bags used on the market today. If
the bags were designed differently with larger volume to carrying weight ratio, from recycled
material instead of primary material where only one type material is presented, or some other
type of improvement the results would come out better than the standard version of the same
bag.
This study focused on identifying the number of reuse times based on the environmental per-
formance of the carrier bags, rather than considering the actual realistic lifetime for different
bag types considering their material type, production, and functionality. The results obtained
on the minimum number of reuse times are intended to raise the discussion among the stake-
holders on the effective expected lifetime of each carrier bag. While the calculated number of
reuse times might be compliant with the functional lifetime of PP, PET and polyester carrier
bags, it might surpass the lifetime of bleached paper, composite and cotton carriers, especially
considering all environmental indicators.
6.4 Influence on data and assumptions on the results Data availability was found to be rather low. The number of reviewed LCA reports and data
available in the literature was limited. In particular, data on the manufacturing part for the car-
rier bags (energy and ancillary materials requirements) was rather scarce in the majority of the
LCA reports consulted for this project. As far as the production of the main material of the
carrier bags is concerned, more datasets were available for LDPE, and fewer datasets were
available for other plastic types, such as PP, polyester, biopolymers and textiles. This did not
allow as much preliminary testing on the datasets employed as it was possible for virgin LDPE.
Higher data quality and availability would allow LCA practitioners to explore better alternative
materials for the production of carrier bags, especially data on recycled polymers and their
performance during manufacture and recycling.
The physico-chemical material composition used for modelling input-specific emissions in the
EASETECH LCA model allowed retrieving generic impacts for material groups, such as plas-
tic, paper, textile. The emissions mostly contributed to impacts to atmosphere via the incinera-
tion process, especially for plastic carrier bags.
Regarding the carrier bag manufacturing process, we observed that most of the production
impacts were ascribable to the production of the carrier bag material (Tables 13 – 21). The
material production process contributed less only in the LDPE and PP carrier bags manufac-
turing, but described most of the impacts from the manufacturing phase for most of the re-
maining carrier bags, as observed in previous LCA studies. Carrying out a streamlined LCA

82 The Danish Environmental Protection Agency / LCA of grocery carrier bags
considering only the production of the carrier bags’ main material would have underestimated
the impacts for LDPE and PP. However, even if for LDPE carrier bags most of the production
emissions arise from manufacturing phase (energy and ancillary material requirements), these
carrier bags are still providing the overall best environmental performance. In general, manu-
facturing data quality was mostly sensitive when bags were composed of light material or
material with low associated impacts.
For the modelling of the virgin LDPE waste bin bag we employed a dataset representing lower
quality LDPE than the one used for modelling LDPE carrier bags. The use of this dataset re-
sulted in lower savings from avoiding production and disposal of a waste bin bag. If we had
modelled the waste bin bag as the LDPE carrier bags, savings from replacing a waste bin bag
would have been even higher. Still, even using a conservative assumption for the production
data of the waste bin bag, reuse as waste bin bag was one of the most preferable end-of-life
options, especially for low weight and non-fossil carbon carrier bags (LDPE, paper, biopoly-
mer). If the waste bin bag was made of recycled polymer material, we expect that the impacts
connected to its production would have been slightly lower. In this case, the carrier bag sce-
narios that would be mostly affected would be the ones associated with the lightest carrier bag
weight: LDPE, paper, biopolymer. These carrier bags would present slightly lower benefits
from EOL3, but still result among the carrier bags with the overall lowest associated impacts
for EOL1.
The large transportation distances were considered conservative. Although distribution did not
largely contribute to the impacts, knowing the exact location of the facilities, especially the
recycling facilities assumed to be in Europe, would probably lower the impacts connected to
transportation. Lower transportation distances are especially expected to slightly reduce the
impacts of the EOL2 scenarios.
We did not find any available specific end-of-life data for recycled polymers, therefore we
could not apply specific higher losses during material production and recovery. If higher losses
would occur during manufacturing and recovery, there would be higher impacts related to the
production of the carrier bag with recycled material, as well as lower revenues from the recy-
cling process. This would affect the result for EOL2 as preferable waste management option
for PETrec.
Regarding the critical assumptions highlighted in Section 3, rounding to two bags when the
functionality expressed in the functional unit was not provided resulted in larger impacts for
bags that did not comply with the functional unit. In particular, the organic cotton bag provided
considerably high impacts.
Moreover, using virgin LDPE to model recycled LDPE resulted in higher impacts from the
production phase of the LDPErec carrier bag, but also to higher revenues from recycling. In-
deed, the recycled material is going to substitute production of virgin material instead of recy-
cled polymer.
The assumption of lower yield used to model the production of organic cotton increased the
impacts connected to its production, as can be seen from the contribution analyses in Table 19
and 20. However, the use of two bags in order to comply for the functional unit for organic
cotton bags influenced the results to a larger extent. For example, comparing the climate
change score for one organic cotton bag (5.4 kg CO2-eq/bag, Table 19) and for one conven-
tional cotton bag (3.9 kg CO2-eq/bag, Table 20), we obtain the following:
38%100
3.9
3.95.4

The Danish Environmental Protection Agency / LCA of grocery carrier bags 83
%771100
3.9
3.925.4
Where 38 % represents the increase in climate change impact with respect to conventional
cotton by using a lower yield for organic cotton, and 177 % represents the Increase in climate
change impact with respect to conventional cotton by using 2 bags for organic cotton. 38 % is
higher than the assumed yield (-30 %) because organic cotton bags presented a slightly larger
weight with respect to conventional cotton bags.
If we had included the additional data on the conventional cotton bag pointed out by the pro-
ject partners after the first iteration of the report (please see Section 2), the average weight
associated to the conventional cotton bag would have lowered to 194.6 grams from the initial
232 grams (see Table 2), and the volume would have been 28.3 litres. The number of bags
required to fulfil the functional unit would have still been 1, but the lower weight would have
lowered the impacts (for example, we calculated 16 % lower impacts for climate change) and
lowered the number of reuse times by roughly 10 times. These considerations about volume of
the organic cotton bag and the weight of the conventional cotton bag will be expanded further
in a dedicated part about design considerations (please see Section 7).
As far as the choice for the marginal energy technologies is concerned, using a non-future
marginal energy would have entailed having coal in the energy mix, and would have provided
higher savings from energy recovery in the incineration process, especially for climate change.
Considering recycling feasible for biopolymer and textile carrier bags would mean allowing for
the recovery of these materials through separate collection and re-processing, therefore ulti-
mately lowering the impacts connected to the production of the carrier bags. However, specific
attention should be required to the substituted materials from such recovery processes, espe-
cially for cotton, which is unlikely to substitute production of primary cotton.
Lastly, in case the carrier bags cannot fulfil the functionality of waste bin bags, EOL3 should
not be considered as a viable option.
The choice of reference flow, the use of virgin LDPE data for LDPErec and reuse as waste bin
bag only for LDPE carrier bags were tested in a sensitivity analysis, which is provided in Sec-
tion 7.
84 The Danish Environmental Protection Agency / LCA of grocery carrier bags
7. Sensitivity analysis: critical assumptions
This Section evaluates whether and in what measure a selection of the modelling choices and
critical assumptions identified in the LCA methodology Section (Section 3) influence the re-
sults. The results for the most preferable disposal option and carrier bag, as well as number of
primary reuse times, were re-calculated according to alternative modelling choices.
7.1 Choice of reference flow: rounding The choice of calculating the reference flow by rounding to two carrier bags when one was not
sufficient to comply with the functional unit was tested by calculating the required number of
bags with fractions. This sensitivity analysis is based on the fact that the rounding to two bags
might provide a large overcapacity with respect to the functional unit. We also wanted to test
the effect on the results on “optimizing” the carrying capacity of the bags instead of just as-
suming that another bag of the same type would be bought by the customers.
The reference flow of this sensitivity analysis step was re-calculated for the bags that did not
comply with the functional unit and that required two bags (as shown in Table 3): LDPEs,
LDPErec, BP, PAP, PAPb and COTorg. The number of substituted waste bin bags was re-
calculated as well (Table 25). The effect of using fractions instead of rounding to another bag
has also lowered the number of substituted waste bin bags for the corresponding carrier bags.
For the bags that could provide more volume and weight holding capacity than the average
LDPE carrier bag (for example woven PP and conventional cotton) one bag was considered
instead of the fraction, and the number of substituted waste bin bags was left unchanged.
The reference flow change did not influence the preferred disposal option for each carrier bag.
The hierarchy of the most preferable carrier bag option for each impact category changed only
slightly. Paper obtained comparatively better results in human toxicity, cancer effects, and in
resource depletion, fossil, than in the present study, due to the lower environmental costs
related to the production of the carrier bag. The emissions related to production were larger
when the number of bags per reference flow was rounded to two. In general, LDPE carrier
bags still resulted as the carrier alternative providing the overall best performance in the high-
est number of impact categories, with LDPEs now providing the overall best performance
within virgin LDPE carrier bags.
The reference flow change for some of the carrier bags mostly influenced their calculated
number of reuse times. Table 26 shows that LDPEs and COTorg were the carrier bags that
considerably lowered the number of reuse times. In particular, when the reference flow was
not rounded, organic cotton presented less than half of the calculated number of reuse times
than what previously calculated, both for climate change and for all impact categories. The
results highlight the importance of the design of the bags, which is going to be discussed fur-
ther in a dedicated paragraph.
LDPEs, BP and PAP provided a negative number of reuse times, which signifies that these
carrier bag types provided a better environmental performance for climate change than the
average LDPE carrier bag. Across all impact categories, LDPE carrier bags provided a similar
performance, while heavier fossil carbon-based carrier bags, paper and biopolymer, presented
a generally higher number of calculated reuse times. Calculated number of reuse times for BP
and PAP was halved when considered across all impact categories.

The Danish Environmental Protection Agency / LCA of grocery carrier bags 85
Table 25. Reference flow and number of substituted bin bags used for the scenario
analysis.
Scenario
name
Volume
enough?
Weight holding
Capacity
enough?
Reference flow
calculation
Reference flow
(number of bags
needed)
Number of sub-
stituted bin
bags
LDPEavg Yes Yes Not changed 1.0 1.0
LDPEs No No 𝑀𝑎𝑥 (𝑉𝑜𝑙𝑢𝑚𝑒 𝐿𝐷𝑃𝐸𝑎𝑣𝑔
𝑉𝑜𝑙𝑢𝑚𝑒 𝐿𝐷𝑃𝐸𝑠,𝑊𝑒𝑖𝑔ℎ𝑡 ℎ𝑜𝑙𝑑. 𝐿𝐷𝑃𝐸𝑎𝑣𝑔
𝑊𝑒𝑖𝑔ℎ𝑡 ℎ𝑜𝑙𝑑. 𝐿𝐷𝑃𝐸𝑠) 1.2 1.0
LDPEh Yes Yes Not changed 1.0 1.1
LDPErec No No 𝑀𝑎𝑥 (𝑉𝑜𝑙𝑢𝑚𝑒 𝐿𝐷𝑃𝐸𝑎𝑣𝑔
𝑉𝑜𝑙𝑢𝑚𝑒 𝐿𝐷𝑃𝐸𝑟𝑒𝑐,𝑊𝑒𝑖𝑔ℎ𝑡 ℎ𝑜𝑙𝑑. 𝐿𝐷𝑃𝐸𝑎𝑣𝑔
𝑊𝑒𝑖𝑔ℎ𝑡 ℎ𝑜𝑙𝑑. 𝐿𝐷𝑃𝐸𝑟𝑒𝑐) 1.1 1.1
PP Yes Yes Not changed 1.0 1.3
PPwov Yes Yes Not changed 1.0 1.6
PETrec Yes Yes Not changed 1.0 1.9
PETpol Yes Yes Not changed 1.0 1.4
BP No No* 𝑀𝑎𝑥 (𝑉𝑜𝑙𝑢𝑚𝑒 𝐿𝐷𝑃𝐸𝑎𝑣𝑔
𝑉𝑜𝑙𝑢𝑚𝑒 𝐿𝐷𝑃𝐸𝑟𝑒𝑐,𝑊𝑒𝑖𝑔ℎ𝑡 ℎ𝑜𝑙𝑑. 𝐿𝐷𝑃𝐸𝑎𝑣𝑔
𝑊𝑒𝑖𝑔ℎ𝑡 ℎ𝑜𝑙𝑑. 𝐿𝐷𝑃𝐸𝑟𝑒𝑐) 1.0 1.0
PAP Yes No* 𝑊𝑒𝑖𝑔ℎ𝑡 ℎ𝑜𝑙𝑑. 𝐿𝐷𝑃𝐸𝑎𝑣𝑔
𝑊𝑒𝑖𝑔ℎ𝑡 ℎ𝑜𝑙𝑑. 𝑃𝐴𝑃 1.0 1.0
PAPb Yes No* 𝑊𝑒𝑖𝑔ℎ𝑡 ℎ𝑜𝑙𝑑. 𝐿𝐷𝑃𝐸𝑎𝑣𝑔
𝑊𝑒𝑖𝑔ℎ𝑡 ℎ𝑜𝑙𝑑. 𝑃𝐴𝑃𝑏 1.0 1.0
COTorg No Yes 𝑉𝑜𝑙𝑢𝑚𝑒 𝐿𝐷𝑃𝐸𝑎𝑣𝑔
𝑉𝑜𝑙𝑢𝑚𝑒 𝐶𝑂𝑇𝑜𝑟𝑔 1.1 1.0
COT Yes Yes Not changed 1.0 1.2
COM Yes Yes Not changed 1.0 1.4
* In this sensitivity analysis the weight holding capacity of 12.0 kg of paper and biopolymer bags was considered effec-
tive.
Table 26. Calculated number of primary reuse times for each carrier bag in the rows in
comparison to LDPEavg, EOL3, for the reference flow in Table 25. Results are provided
for the climate change impact category and across impact categories. Results for CO-
Torg, COT and COM have been rounded. Results in brackets report the previously cal-
culated results in Table 24 for the carrier bags with a changed reference flow.
LDPEavg, EOL3
Climate change All impact categories
EOL1 EOL2 EOL3 EOL1 EOL2 EOL3
LDPEs 0.3 (0.5) 0.0 (0.1) -0.2 (0.00) 0.9 (1.2) 4.1 (5.0) 0.2 (0.0)
LDPEh 0.9 0.4 0.3 1.7 6.1 0.3
LDPErec 0.8 (2.2) 0.3 (1.4) 0.2 (1.2) 1.7 (1.7) 6.2 (6.1) 0.5 (0.3)
PP 8.0 6.0 7.3 38 52 37
PPwov 6.8 5.0 5.9 33 45 32
PETrec 9.6 8.2 8.6 95 84 96
PETpol 2.6 1.9 1.9 35 28 35
BP -0.4 (0.2) - -0.9 (-0.8) 21 (41) - 22 (42)
PAP -0.6 (-0.2) -0.3 (0.5) -1.1 (-1.3) 22 (42) 38 22 (43)
PAPb8 0.3 0.6 -0.2 22 (42) 38 22 (43)
COTorg 84 (150) - 83 (149) 10000 (20000) - 10000 (20000)
COT 53 - 52 7100 - 7100
8 The highest value for bleached paper was increased to be equal to the value for unbleached paper
86 The Danish Environmental Protection Agency / LCA of grocery carrier bags
COM 23 - 23 870 - 870
7.2 Secondary reuse as a waste bin bag allowed only for LDPE carriers
In this Section, results are presented considering that secondary reuse as a waste bin bag
(EOL3) could be possible only for LDPE carrier bags. This modelling choice would represent
the choice of allowing secondary reuse as a waste bin bag only for the carrier bags that can
fully provide for the same functionality. The results for the best disposal option for each carrier
bag are provided in Table 26. As previously discussed, reuse as waste bin bag before being
incinerated is the best disposal option for LDPE carrier bags. For heavier plastic bags recy-
cling resulted often one of the best options, provided that the carrier bags can be effectively
recycled. For the remaining bags, incineration was the disposal option that provided the lowest
environmental impacts.
As far as the hierarchy of results is concerned, the carrier bags providing the lowest impacts
have only slightly changed. Incineration of paper and biopolymer carrier bags and secondary
reuse of the LDPE carrier bags still provided the lowest climate change environmental im-
pacts. For the other impact categories, LDPE carrier bags represented the alternative with the
overall lowest environmental impacts, as already observed. The results indicate that allowing
secondary reuse as waste bin bag only for LDPE carrier bag provides little influence on the
hierarchy of the most favourable carrier bag alternative for each impact category. For the
number of reuse times, if EOL3 is not allowed for all carrier bag alternatives other than LDPE
carrier bags, non-LDPE carrier bags have to be reused in average at least one additional time
before being incinerated. The results correspond to Table 24 presented previously, without
considering the EOL3 column for the non-LDPE carrier bags.
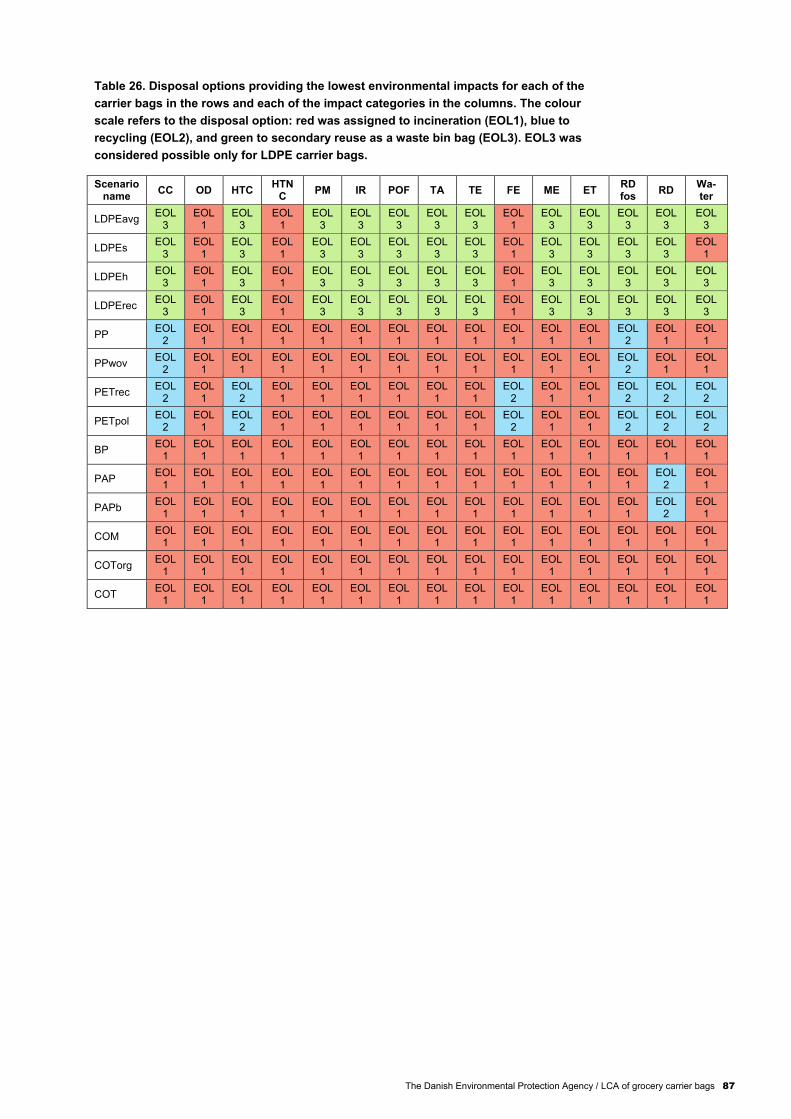
The Danish Environmental Protection Agency / LCA of grocery carrier bags 87
Table 26. Disposal options providing the lowest environmental impacts for each of the
carrier bags in the rows and each of the impact categories in the columns. The colour
scale refers to the disposal option: red was assigned to incineration (EOL1), blue to
recycling (EOL2), and green to secondary reuse as a waste bin bag (EOL3). EOL3 was
considered possible only for LDPE carrier bags.
Scenario name
CC OD HTC HTN
C PM IR POF TA TE FE ME ET
RD fos
RD Wa-ter
LDPEavg EOL
3 EOL
1 EOL
3 EOL
1 EOL
3 EOL
3 EOL
3 EOL
3 EOL
3 EOL
1 EOL
3 EOL
3 EOL
3 EOL
3 EOL
3
LDPEs EOL
3 EOL
1 EOL
3 EOL
1 EOL
3 EOL
3 EOL
3 EOL
3 EOL
3 EOL
1 EOL
3 EOL
3 EOL
3 EOL
3 EOL
1
LDPEh EOL
3 EOL
1 EOL
3 EOL
1 EOL
3 EOL
3 EOL
3 EOL
3 EOL
3 EOL
1 EOL
3 EOL
3 EOL
3 EOL
3 EOL
3
LDPErec EOL
3 EOL
1 EOL
3 EOL
1 EOL
3 EOL
3 EOL
3 EOL
3 EOL
3 EOL
1 EOL
3 EOL
3 EOL
3 EOL
3 EOL
3
PP EOL
2 EOL
1 EOL
1 EOL
1 EOL
1 EOL
1 EOL
1 EOL
1 EOL
1 EOL
1 EOL
1 EOL
1 EOL
2 EOL
1 EOL
1
PPwov EOL
2 EOL
1 EOL
1 EOL
1 EOL
1 EOL
1 EOL
1 EOL
1 EOL
1 EOL
1 EOL
1 EOL
1 EOL
2 EOL
1 EOL
1
PETrec EOL
2 EOL
1 EOL
2 EOL
1 EOL
1 EOL
1 EOL
1 EOL
1 EOL
1 EOL
2 EOL
1 EOL
1 EOL
2 EOL
2 EOL
2
PETpol EOL
2 EOL
1 EOL
2 EOL
1 EOL
1 EOL
1 EOL
1 EOL
1 EOL
1 EOL
2 EOL
1 EOL
1 EOL
2 EOL
2 EOL
2
BP EOL
1 EOL
1 EOL
1 EOL
1 EOL
1 EOL
1 EOL
1 EOL
1 EOL
1 EOL
1 EOL
1 EOL
1 EOL
1 EOL
1 EOL
1
PAP EOL
1 EOL
1 EOL
1 EOL
1 EOL
1 EOL
1 EOL
1 EOL
1 EOL
1 EOL
1 EOL
1 EOL
1 EOL
1 EOL
2 EOL
1
PAPb EOL
1 EOL
1 EOL
1 EOL
1 EOL
1 EOL
1 EOL
1 EOL
1 EOL
1 EOL
1 EOL
1 EOL
1 EOL
1 EOL
2 EOL
1
COM EOL
1 EOL
1 EOL
1 EOL
1 EOL
1 EOL
1 EOL
1 EOL
1 EOL
1 EOL
1 EOL
1 EOL
1 EOL
1 EOL
1 EOL
1
COTorg EOL
1 EOL
1 EOL
1 EOL
1 EOL
1 EOL
1 EOL
1 EOL
1 EOL
1 EOL
1 EOL
1 EOL
1 EOL
1 EOL
1 EOL
1
COT EOL
1 EOL
1 EOL
1 EOL
1 EOL
1 EOL
1 EOL
1 EOL
1 EOL
1 EOL
1 EOL
1 EOL
1 EOL
1 EOL
1 EOL
1

88 The Danish Environmental Protection Agency / LCA of grocery carrier bags
7.3 Recycled LDPE Since the dataset for recycled LDPE was missing in the Ecoinvent database, the recycled
LDPE carrier bag was modelled modifying the virgin LDPE production dataset. As shown in
Appendix B, for PET the recycled inventory dataset presents lower emissions than the virgin
inventory dataset for all impact categories. In this sensitivity analysis, the virgin LDPE produc-
tion inventory of emissions used for the recycled LDPE carrier bag was lowered by 25 %. This
signified that the environmental costs for the production of LDPE were lowered by the same
extent for all environmental indicators, as well as the benefits from the recycling of recycled
LDPE.
The results obtained by the recycled LDPE carrier bags lowered for all impact categories, as
shown in Table 27 below. Table 27 provides the percent variation of the newly tested LDPErec
scenario with the results presented in Tables (10 – 12). Climate change results lowered by 12
% for EOL1, by 18 % for EOL2, and by 8 % for EOL3. For human toxicity, cancer effects
(HTNC), and freshwater eutrophication (FE), the Table shows positive percent variation be-
cause the original result scores were already negative numbers. The highest variations oc-
curred for human toxicity, cancer effects, particulate matter (PM), photochemical ozone for-
mation (POF), terrestrial acidification (TA), terrestrial eutrophication (TE) and marine eutrophi-
cation (ME).
The preferred management option for LDPErec, which was mostly EOL3 for the different im-
pact categories, did not change. The hierarchy of the carrier bags providing the lowest perfor-
mance for each environmental indicator changed for the impact categories of particulate mat-
ter, photochemical ozone formation, terrestrial and freshwater eutrophication, where LDPErec
provided the best performance. The results for the remaining impact categories did not
change: virgin LDPE provided the overall best performance, along with paper and biopolymer
for the climate change impact category.
The number of reuse times was recalculated as well and it is presented in Table 28. Consider-
ing the end-of-life scenario where LDPErec provides the best performance, which is EOL3,
The number of reuse times lowered only slightly: by 0.4 for the climate change impact catego-
ry, and by 0.5 across all impact categories. The results are more comparable to those ob-
tained for virgin LDPE carrier bags in Table 24, but are still larger because of the two bags
required in order to provide for the functionality expressed in the functional unit.
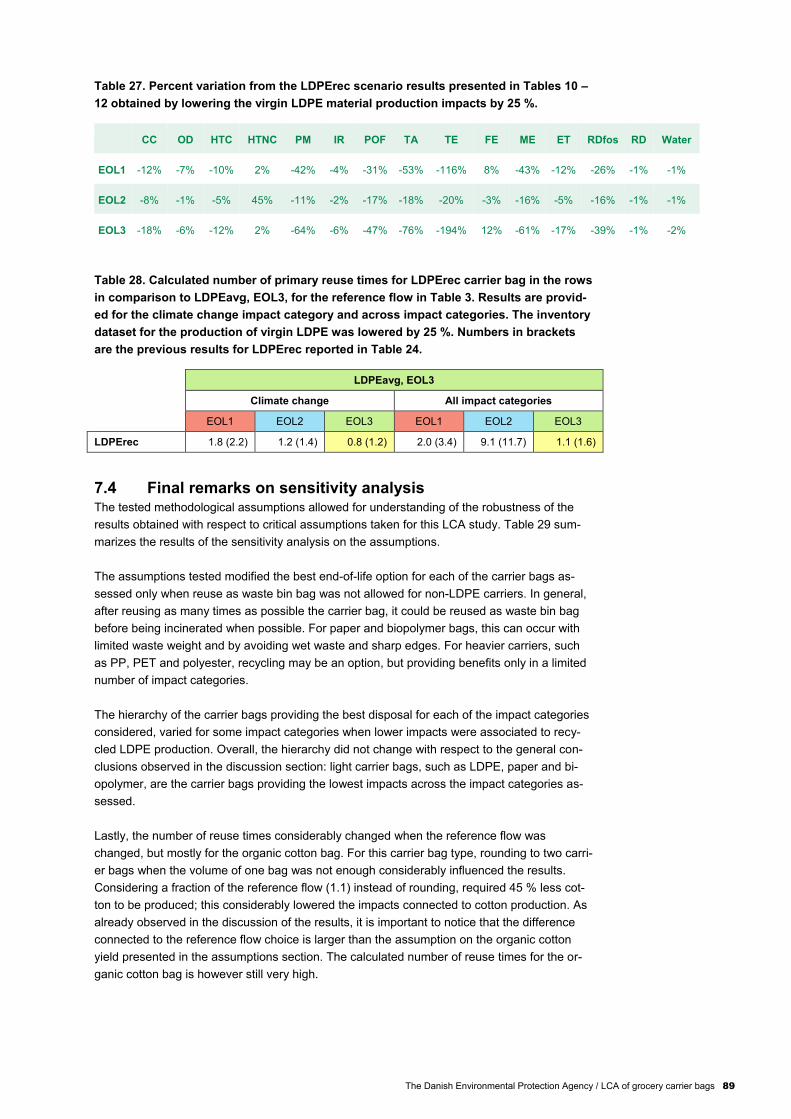
The Danish Environmental Protection Agency / LCA of grocery carrier bags 89
Table 27. Percent variation from the LDPErec scenario results presented in Tables 10 –
12 obtained by lowering the virgin LDPE material production impacts by 25 %.
CC OD HTC HTNC PM IR POF TA TE FE ME ET RDfos RD Water
EOL1 -12% -7% -10% 2% -42% -4% -31% -53% -116% 8% -43% -12% -26% -1% -1%
EOL2 -8% -1% -5% 45% -11% -2% -17% -18% -20% -3% -16% -5% -16% -1% -1%
EOL3 -18% -6% -12% 2% -64% -6% -47% -76% -194% 12% -61% -17% -39% -1% -2%
Table 28. Calculated number of primary reuse times for LDPErec carrier bag in the rows
in comparison to LDPEavg, EOL3, for the reference flow in Table 3. Results are provid-
ed for the climate change impact category and across impact categories. The inventory
dataset for the production of virgin LDPE was lowered by 25 %. Numbers in brackets
are the previous results for LDPErec reported in Table 24.
LDPEavg, EOL3
Climate change All impact categories
EOL1 EOL2 EOL3 EOL1 EOL2 EOL3
LDPErec 1.8 (2.2) 1.2 (1.4) 0.8 (1.2) 2.0 (3.4) 9.1 (11.7) 1.1 (1.6)
7.4 Final remarks on sensitivity analysis The tested methodological assumptions allowed for understanding of the robustness of the
results obtained with respect to critical assumptions taken for this LCA study. Table 29 sum-
marizes the results of the sensitivity analysis on the assumptions.
The assumptions tested modified the best end-of-life option for each of the carrier bags as-
sessed only when reuse as waste bin bag was not allowed for non-LDPE carriers. In general,
after reusing as many times as possible the carrier bag, it could be reused as waste bin bag
before being incinerated when possible. For paper and biopolymer bags, this can occur with
limited waste weight and by avoiding wet waste and sharp edges. For heavier carriers, such
as PP, PET and polyester, recycling may be an option, but providing benefits only in a limited
number of impact categories.
The hierarchy of the carrier bags providing the best disposal for each of the impact categories
considered, varied for some impact categories when lower impacts were associated to recy-
cled LDPE production. Overall, the hierarchy did not change with respect to the general con-
clusions observed in the discussion section: light carrier bags, such as LDPE, paper and bi-
opolymer, are the carrier bags providing the lowest impacts across the impact categories as-
sessed.
Lastly, the number of reuse times considerably changed when the reference flow was
changed, but mostly for the organic cotton bag. For this carrier bag type, rounding to two carri-
er bags when the volume of one bag was not enough considerably influenced the results.
Considering a fraction of the reference flow (1.1) instead of rounding, required 45 % less cot-
ton to be produced; this considerably lowered the impacts connected to cotton production. As
already observed in the discussion of the results, it is important to notice that the difference
connected to the reference flow choice is larger than the assumption on the organic cotton
yield presented in the assumptions section. The calculated number of reuse times for the or-
ganic cotton bag is however still very high.

90 The Danish Environmental Protection Agency / LCA of grocery carrier bags
Table 29. Overview of the changes in the results induced by changes in the assump-
tions for the reference flow, allowed secondary reuse and different calculation method
for the reuse times.
Tested assumption
Induced change
Best end-of-life option for
each carrier bag
Hierarchy of carrier bags for each
impact category
Calculate number of primary
reuse times
Reference flow Not changed Not changed
Yes, especially for organic
cotton: number of reuse
times reduced by half
EOL3 not allowed for non-LDPE
carriers
Yes,
EOL1 instead of EOL3 Not changed +1 (average)
LDPErec modelled by lowering
LDPE production impacts by
25%
Not changed LDPErec best option for PM,
POF, TE, FE -1 for LDPErec
7.4.1 Carrier bag design
The results of the sensitivity analysis suggest that for the carrier bags with the highest weight
and with the highest impacts connected to production, the ability to provide for the functionality
expressed in the functional unit is essential. In particular, if Danish retailers want to provide a
multiple-use carrier bag alternative to LDPE carrier bags that is made of cotton or textile-based
composite materials, their attention should be placed on the weight of the bag and on its vol-
ume. The textile bag should preferably be of light weight and with enough volume to provide
for the same capacity of LDPE carrier bags. The example provided in the discussion of the
results showed that using a conventional cotton bag of a lower weight had lowered the number
of reuse times by 10 units.
All the multiple use bags (PP, PET, Cotton etc.) could carry significantly more weight than the
reference flow, but varied highly in volume. This indicates that it is possible to design bags that
can be high in both volume and weight. For some consumers the weight could be the limiting
factor, but for other consumers it could for some bags mean that weight holding capacity
would be the limiting factor. No matter the consumer preference, there is not a rational for not
optimizing the volume per material weight.
As far as the carrier bag material is concerned, organic cotton provides environmentally pref-
erable production conditions by avoiding the use of fertilizers and pesticides, but with a lower
yield. The lower production yield translates in overall higher environmental impacts connected
to its production, and to a higher required number of reuse times in order to “amortize” its
environmental production costs.
Regarding the material of the carrier bags, one more observation could be raised for the use of
recycled polymers for the manufacturing of the carrier bags. If all the LDPE carrier bags had
the same volume capacity, weight holding capacity and thickness (and weight of the carrier
bag), the dataset for the production of recycled LDPE was available, the recycled LDPE would
result as the best option. This would be especially true for EOL3, since the recycled LDPE
would be substituting a virgin LDPE waste bin bag.
However, the virgin and recycled LDPE carrier bags examined for this LCA study had different
volume and weight holding capacities. In order for the recycled LDPE carrier bag to carry the
same volume as the virgin LDPE carrier bags, more than one bag would be required. This
increased the environmental impacts associated with the recycled LDPE carrier bag, and this
was the reason why it does not result as the best option between the carrier bags examined.

The Danish Environmental Protection Agency / LCA of grocery carrier bags 91
Indeed, the results for LDPErec were more influenced by the sensitivity analysis on the refer-
ence flow than the sensitivity analysis on the production data.
Lastly, it would be useful for customers to be reminded of the indicative number of reuse times
obtained by this report by adding this information on the multiple-use carrier bag, for example
“reuse me at least 10 times”, and together with a suggested end-of-life option “reuse me as
waste bin bag”, for example.

92 The Danish Environmental Protection Agency / LCA of grocery carrier bags
8. Conclusions
This study identified the best disposal option for each of the carrier bags available in Danish
supermarkets in 2017. In general, reusing the carrier bag as a waste bin bag is better than
simply throwing away the bag in the residual waste and it is better than recycling. Recycling
can potentially offer more benefits in the case of heavy plastic bags, such as PP, and PET.
Reuse as a waste bin bag is most beneficial for light carrier bags, such as LDPE, paper and
biopolymer. When reuse as a waste bin bag is not feasible, for example when the bag can
easily be punctured, torn, or wetted, incineration is the most preferable solution from an envi-
ronmental point of view.
In general, LDPE carrier bags, which are the bags that are always available for purchase in
Danish supermarkets, are the carriers providing the overall lowest environmental impacts
when not considering reuse. In particular, between the types of available carrier bags, LDPE
carrier bags with rigid handle are the most preferable. Effects of littering for this type of bag
were considered negligible for Denmark. Carrier bags alternatives that can provide a similar
performance are unbleached paper and biopolymer bags, but for a lower number of environ-
mental indicators. Heavier carrier bags, such as PP, PET, polyester, bleached paper and tex-
tile bags need to be reused multiple times in order to lower their environmental production
cost. Between the same bag types, woven PP carrier bags provided lower impacts than non-
woven PP bags, unbleached paper resulted more preferable than bleached paper, and con-
ventional cotton over organic cotton.
For all carrier bags, reuse as many times as possible before disposal is strongly encouraged.
This study also calculated how many times each bag would need to be reused in order to
lower its associated environmental impacts to the levels of the LDPE carrier bag. The number
of calculated reuse times varies if only one environmental indicator is observed, or if all envi-
ronmental indicators are taken into account.
The results are the following9:
Simple LDPE bags: Can be directly reused as waste bin bags for climate change, should
be reused at least 1 time for grocery shopping considering all other indicators; finally reuse
as waste bin bag.
LDPE bags with rigid handle: Can be directly reused as waste bin bags considering all
indicators; finally reuse as waste bin bag.
Recycled LDPE bags: Reuse for grocery shopping at least 1 time for climate change, at
least 2 times considering all indicators; finally reuse as waste bin bag.
PP bags, non-woven: Reuse for grocery shopping at least 6 times for climate change, and
up to 52 times considering all indicators; finally dispose with recyclables, otherwise reuse as
waste bin bag if possible, lastly incinerate.
9 The number of times for “all indicators” refers to the highest number of reuse times among those calcu-
lated for each impact category. For light carrier bags (LDPE, PP, PET...) the high numbers of reuse times
are given by a group of impact categories with similar high values. Conversely, for composite and cotton
the very high number of reuse times is given by the ozone depletion impact alone. Without considering
ozone depletion, the number of reuse times ranges from 50 to1400 for conventional cotton, from 150 to
3800 for organic cotton, and from 0 to 740 for the composite material bag. The highest number is due to
the use of water resource, but also to freshwater and terrestrial eutrophication. Results for the number of
reuse times for each impact category, minimum-maximum ranges and average number of reuse times
are provided in Appendix C.
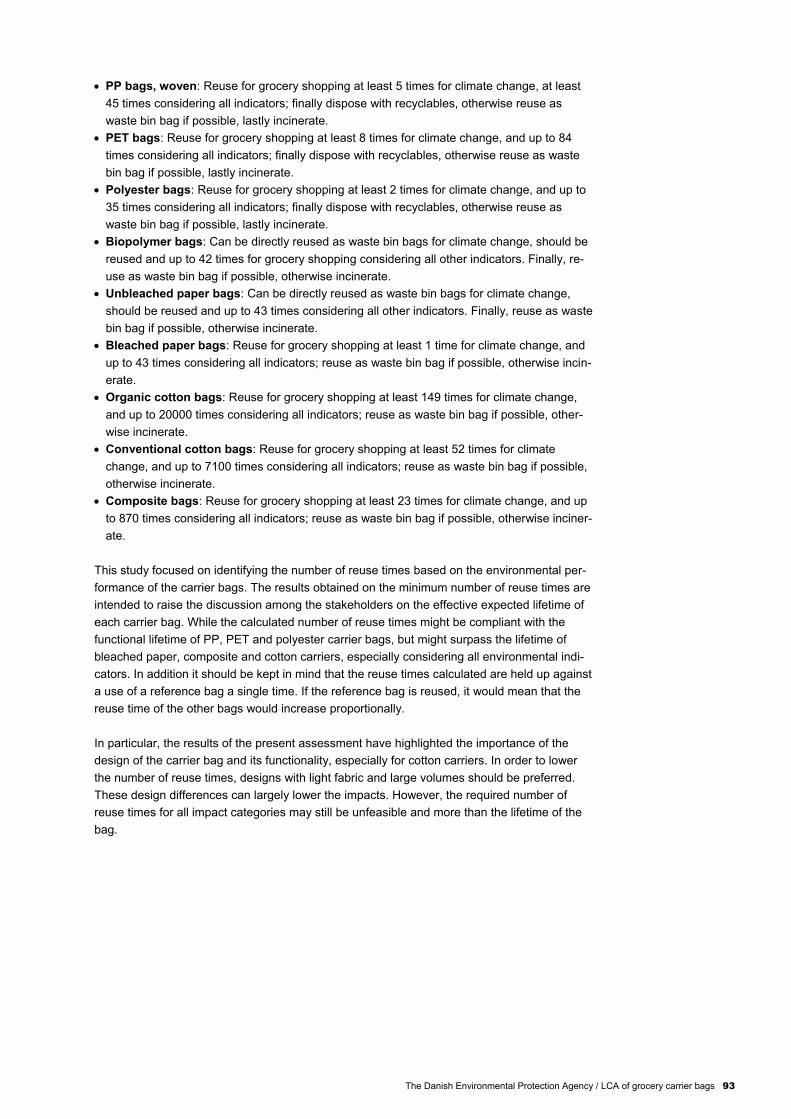
The Danish Environmental Protection Agency / LCA of grocery carrier bags 93
PP bags, woven: Reuse for grocery shopping at least 5 times for climate change, at least
45 times considering all indicators; finally dispose with recyclables, otherwise reuse as
waste bin bag if possible, lastly incinerate.
PET bags: Reuse for grocery shopping at least 8 times for climate change, and up to 84
times considering all indicators; finally dispose with recyclables, otherwise reuse as waste
bin bag if possible, lastly incinerate.
Polyester bags: Reuse for grocery shopping at least 2 times for climate change, and up to
35 times considering all indicators; finally dispose with recyclables, otherwise reuse as
waste bin bag if possible, lastly incinerate.
Biopolymer bags: Can be directly reused as waste bin bags for climate change, should be
reused and up to 42 times for grocery shopping considering all other indicators. Finally, re-
use as waste bin bag if possible, otherwise incinerate.
Unbleached paper bags: Can be directly reused as waste bin bags for climate change,
should be reused and up to 43 times considering all other indicators. Finally, reuse as waste
bin bag if possible, otherwise incinerate.
Bleached paper bags: Reuse for grocery shopping at least 1 time for climate change, and
up to 43 times considering all indicators; reuse as waste bin bag if possible, otherwise incin-
erate.
Organic cotton bags: Reuse for grocery shopping at least 149 times for climate change,
and up to 20000 times considering all indicators; reuse as waste bin bag if possible, other-
wise incinerate.
Conventional cotton bags: Reuse for grocery shopping at least 52 times for climate
change, and up to 7100 times considering all indicators; reuse as waste bin bag if possible,
otherwise incinerate.
Composite bags: Reuse for grocery shopping at least 23 times for climate change, and up
to 870 times considering all indicators; reuse as waste bin bag if possible, otherwise inciner-
ate.
This study focused on identifying the number of reuse times based on the environmental per-
formance of the carrier bags. The results obtained on the minimum number of reuse times are
intended to raise the discussion among the stakeholders on the effective expected lifetime of
each carrier bag. While the calculated number of reuse times might be compliant with the
functional lifetime of PP, PET and polyester carrier bags, but might surpass the lifetime of
bleached paper, composite and cotton carriers, especially considering all environmental indi-
cators. In addition it should be kept in mind that the reuse times calculated are held up against
a use of a reference bag a single time. If the reference bag is reused, it would mean that the
reuse time of the other bags would increase proportionally.
In particular, the results of the present assessment have highlighted the importance of the
design of the carrier bag and its functionality, especially for cotton carriers. In order to lower
the number of reuse times, designs with light fabric and large volumes should be preferred.
These design differences can largely lower the impacts. However, the required number of
reuse times for all impact categories may still be unfeasible and more than the lifetime of the
bag.

94 The Danish Environmental Protection Agency / LCA of grocery carrier bags
9. References
Aliexpress (2018) https://www.aliexpress.com/item/Size-45x55cm-Recycle-Polyester-Shoping-Bag-for-Supermarket-Colorful-reusable-grocery-bags-foldable-shopping-bags/1962073694.html, accessed 27 January 2018.
Alonso Altonaga, M., 2017. Environmental comparison of grocery shopping bags in Danish supermarkets – Reuse, recycling and disposal. Technical University of Denmark.
Amazon (2018) https://www.amazon.co.uk/Pack-Cotton-cotton-Natural-handle/dp/B00TVEJOMG, accessed 27 January 2018.
ASTM (2018) Standard Specification for Labeling of Plastics Designed to be Aerobically Com-posted in Municipal or Industrial Facilities. https://www.astm.org/Standards/D6400.htm, accessed 27 January 2018.
Astrup, T. (2008): Management of APC residues from W-t-E plants, an overview of manage-ment options and treatment methods. Second edition. Produced by members of ISWA-WG Thermal Treatment of waste subgroup on APC residues from W-t-E plants. ISWA, Copenhagen.
Bagsupplies (2018) https://bagsupplies.com.au/products/bag-supplies/bag-materials/custom-woven-polypropylene-bags, accessed 27 January 2018.
Bang Jensen, M., Kromann, M., Lund Neidel, T., Bjørn Jakobsen, J., Møller, J., 2013. Miljø- og samfundsøkonomisk vurdering af muligheder for øget genanvendelse af papir, pap, plast, metal og organisk affald fra dagrenovation, Miljøprojekt nr. 1458. Miljøministeriet. Miljøstyrelsen. doi:978-87-92903-80-8
Braratcottons (2018) http://www.bharatcottons.com/polypropylene-non-woven-fabrics-1013740.html, accessed 27 January 2018.
C-bags (2018) http://www.c-bags.be/plastieken-draagtassen-gallerij/soudal-ldpe-plastieken-draagtassen, accessed 27 January 2018.
Clavreul, J., Baumeister, H., Christensen, T.H., Damgaard, A., 2014. An environmental as-sessment system for environmental technologies. Environ. Model. Softw. 60, 18–30.
COWI, 2017. Personal Communication with Jens Bjørn Jacobsen, COWI, Denmark
Customgrocerybags (2018) https://www.customgrocerybags.com/100-recycled-p-e-t-glossy-shopper.html, accessed 27 January 2018.
Ecostoviglie (2018) https://www.ecostoviglie.com/shopper-sacchetti-e-bustine-monouso/shopper-fodere-e-cestini-compostabili/shopper-compostabile-in-mater-bi--light--2777x50-3-g.html, accessed 27 January 2018.
Edwards, C., Fry, J.M., 2011. Life cycle assessment of supermarket carrier bags: a review of the bags available in 2006, Evidence report. Bristol, United Kingdom.
Emadian, S.M., Onay, T.T., Demirel, B., 2017. Biodegradation of bioplastics in natural envi-ronments. Waste Management 59, 526–536.
Environment Australia, 2002. Plastic Shopping Bags – Analysis of Levies and Environmental Impacts Final Report. Victoria, Australia.
European Commission, 1994. European Parliament and Council Directive 94/62/EC of 20 December 1994 on packaging and packaging waste.
European Commission, 2010. Analysing of existing Environmental Impact Assessment meth-odologies for use in Life Cycle Assessment. International Reference Life Cycle Data System (ILCD) Handbook. European Commission, Joint Research Centre, Institute for Environment and Sustainability. Publications office of the European Union, Luxembourg.
European Commission, 2011. Assessment of impacts of options to reduce the use of single-use plastic carrier bags.
The Danish Environmental Protection Agency / LCA of grocery carrier bags 95
Forster, D., Andres, C., Verma, R., Zundel, C., Messmer, M.M., Mäder, P., 2013. Yield and economic performance of organic and conventional cotton-based farming systems--results from a field trial in India. PLoS One 8, e81039. doi:10.1371/journal.pone.0081039
Giugliano M, Cernuschi S, Grosso M, Rigamonti L. (2011) Material and energy recovery in integrated waste management system. An evaluation based on life cycle assessment. Waste Management 2011;31:2092–101.
Indiamart (2018) https://www.indiamart.com/zeelcreation/, accessed 27 January 2018.
Indiamart (2018b) https://www.indiamart.com/harshpackagingmumbai/, accessed 27 January 2018.
ISO, 2006. Environmental management - Life cycle assessment - Principles and framework - ISO 14040. International Organization for Standardization, Geneva, Switzerland.ISO, 2006b. Environmental management - Life cycle assessment - Requirements and guide-lines - ISO 14044.
Khoo, H.H., Tan, R.B.H., 2010. Environmental impacts of conventional plastic and bio-based carrier bags. Int. J. LIFE CYCLE Assess. 15, 338–345.
Kimmel, R.M., Cooksey, K.D., 2014. Life Cycle Assessment of Grocery Bags in Common Use in the United States, Environmen. ed. Clemson University Digital Press, Clemson, SC.
Mori, M., Drobnič, B., Gantar, G., Sekavčnik, M., 2013. Life Cycle Assessment of supermarket carrier bags and opportunity of biolpastics, in: Proceedings of SEEP2013. Maribor, Slo-venia.
Muthu, S.S., Li, Y., 2014. Assessment of Environmental Impact by Grocery Shopping Bags, EcoProduction. Springer Singapore, Singapore.
Natuerlich-verpacken (2018) https://www.natuerlich-verpacken.de/Paper-bag-220-x-110-x-260-mm-brown-smooth-flat-handle, accessed 27 January 2018.
Paxonplastic (2018) https://www.paxonplastic.com/ldpe-the-first-polyethylene/, accessed 27 January 2018.
Razza, F., 2014. Eco-balance of 3D-shaped renewable biopolymer foam for a novel genera-tion of transportation packaging: a “cradle to grave” approach using life cycle assess-ment (LCA) methodology. Universitá degli Studi della Tuscia di Viterbo.
Replast A/S (2000), Vojens, Denmark (from the EDIP97 database, based on IPU-NF-B2445).
Riber, C., Petersen, C., Christensen, T.H., 2009. Chemical composition of material fractions in Danish household waste. Waste Manag. 29, 1251–1257.
Rigamonti, L., Grosso, M., Møller, J., Martinez Sanchez, V., Magnani, S., Christensen, T.H., 2014. Environmental evaluation of plastic waste management scenarios. Resour. Con-serv. Recycl. 85, 42–53.
Schmidt, A. & Strömberg, K. (2006). Genanvendelse i LCA - systemudvidelse. Miljønyt nr. 81 2006. Miljøministeriet, Miljøstyrelsen.
Schmidt, A., Watson, D., Roos, S., Askham, C., Poulsen, P.B., 2016. Gaining benefits from discarded textiles – LCA of different treatment pathways. Copenhagen, Denmark.
Skjern Papirfabrik (2005) Sustainability report, Skjern Papirfabrik A/S, http://www.skjernpaper.com/sustainability
Topcottonbags (2018) http://www.topcottonbags.com/jute-bags/, accessed 27 January 2018.
Vestforbrænding (2013). Grønt regnskab. http://www.vestfor.dk/c/document_library/get_file?uuid=afcc6654-8748-

96 The Danish Environmental Protection Agency / LCA of grocery carrier bags
Life Cycle Appendix A.Inventories (LCIs)
This Section provides the data and corresponding references utilized for the present LCA
study.
Table A1. Material composition used for each carrier bag,
Scenario Material Material composition used
LDPEAVG LDPE Soft plastic (Riber et al., 2009)
LDPEs LDPE simple Soft plastic (Riber et al., 2009)
LDPEh LDPE rigid handle Soft plastic (Riber et al., 2009)
LDPErec LDPE recycled Soft plastic (Riber et al., 2009)
P2a PP non-woven Soft plastic (Riber et al., 2009)
PPwov PP woven Soft plastic (Riber et al., 2009)
PETREC PET recycled Soft plastic (Riber et al., 2009)
PETPOL Polyester Soft plastic (Riber et al., 2009)
BP Biopolymer Soft plastic (Riber et al., 2009); modified according to Razza (2014)
PAP Paper Paper and carton containers (Riber et al., 2009)
PAPB Paper Paper and carton containers (Riber et al., 2009)
COTORG Cotton organic Textiles (Riber et al., 2009)
COT Cotton conventional Textiles (Riber et al., 2009)
COM Jute, PP, cotton Textiles (Riber et al., 2009)
W1 LDPE Soft plastic (Riber et al., 2009)
All Packaging: cardboard Other clean cardboard (Riber et al., 2009)

The Danish Environmental Protection Agency / LCA of grocery carrier bags 97
Table A2. Amount of material needed for production of the carrier bags and the waste
bin bag, percent lost during production and final weight of the bag.
Scenario Amount material produced
(kg/bag)
Percent lost during manufacturing
(%/bag)
Weight carrier bag
(kg/bag)
LDPEavg 0.025 5.15 0.024
LDPEs 0.019 5.15 0.018
LDPEh 0.031 5.15 0.029
LDPErec 0.026 5.15 0.025
PP 0.144 5.05 0.137
PPwov 0.125 5.05 0.119
PETrec 0.159 5.15 0.151
PETpol 0.048 5.05 0.046
BP 0.018 1.03 0.018
PAP 0.045 5.15 0.042
PAPb 0.045 5.15 0.042
COTorg 0.254 0.98 0.252
COT 0.234 0.98 0.232
COM 0.282 0.98 0.279
W1 0.010 5.15 0.009
Table A3. Ecoinvent processes utilized to model the production of the material of the
carrier bags. All datasets were retrieved from Ecoinvent version 3.4 (2017), consequen-
tial.
Scenario Ecoinvent process name
LDPEavg Market for polyethylene, low density, granulate; GLO (kg)
LDPEs Market for polyethylene, low density, granulate; GLO (kg)
LDPEh Market for polyethylene, low density, granulate; GLO (kg)
LDPErec Market for polyethylene, low density, granulate; GLO (kg)
PP Market for polypropylene, granulate; GLO (kg)
PPwov Market for polypropylene, granulate; GLO (kg)
PETrec Market for polyethylene terephthalate, granulate, amorphous, recycled; RoW (kg)
PETpol Market for polyethylene terephthalate, granulate, amorphous; GLO (kg)
BP Market for polyester-complexed starch biopolymer; GLO (kg)
PAP Kraft paper production, unbleached; RER (kg)
PAPb Kraft paper production, bleached; RER (kg)
COTorg Market for textile, woven cotton; GLO (kg)
COT Market for textile, woven cotton; GLO (kg)
COM
Market for textile, jute; GLO (kg)
Market for polypropylene, granulate; GLO (kg)
Market for textile, woven cotton; GLO (kg)
W1 Packaging film production, low density polyethylene; RER (kg)

98 The Danish Environmental Protection Agency / LCA of grocery carrier bags
Table A4. Ecoinvent processes utilized to model the treatment of residues from produc-
tion, for each carrier bag. All datasets were retrieved from Ecoinvent version 3.4 (2017),
consequential.
Scenario Ecoinvent process name
LDPEAVG, LDPEs, LDPEh, LDPErec, W1 Treatment of waste polyethylene, municipal incineration; Europe
without Switzerland (kg)
P2a, PPwov Treatment of waste polypropylene, municipal incineration; CH
(kg)
PETREC, PETPOL Treatment of waste polyethylene terephthalate, municipal incin-
eration; Europe without Switzerland (kg)
BP, PAP, PAPB Treatment of waste paperboard, municipal incineration; Europe
without Switzerland (kg)
COTORG, COT, COM Treatment of waste textile, soiled, municipal incineration; RoW
(kg)

The Danish Environmental Protection Agency / LCA of grocery carrier bags 99
Table A5. Carrier bag production: material and energy requirements. The literature ref-
erences are provided as superscript. The references were used to obtain average con-
sumption values.
Scenario Electricity Heat Water
Titanium
dioxide Ink
Cotton
thread
PP
thread Glue
Packaging
amount
kWh/kg MJ/kg L/kg kg/kg kg/kg kg/kg kg/kg kg/kg kg/kg
LDPEAVG,
LDPEs,
LDPEh,
LDPErec
(LDPE)
0.741 1.522a - 0.034 0.011
a - - - 0.048
0.998a
0.032
a
0.078
a
0.987a
0.070
b
0.042
b
0.490b
0.001
c
0.024
c
0.609c
0.950
c
0.410
d
PP, PPwov
(PP)
1.854 1.308 0.807a - 0.054 0.007 0.004
a - 0.069
0.612b 2.616
a
0.067
d 0.004
a
0.087
a
1.500c Negligible
e
0.042
d 0.010
b
0.069
b
2.204d
0.009
d
0.050
c
3.100d
0.006
d
PETREC
(PET) 1.854 1.308 0.807
a - 0.054 0.007 0.004
a - 0.069
PETPOL (Pol-
yester) 1.854 1.308 0.807
a - 0.054 0.007 0.004
a - 0.069
BP (Biopoly-
mer)
1.112 - 1.343a 0.021
a 0.005
a - - - 0.043
1.066a Negligible
e
0.054
a
0.858c
0.033
c
1.413c
PAP, PAPB
(Paper)
0.216 - - - 0.014a - - 0.027 0.049
0.042b
0.027
a 0.058
a
0.390d
0.027
b 0.040
b
COTORG,
COT (Cotton) 0.006
a 0.092
a - - - 0.007
a - - 0.108
a
COM (Compo-
site) 0.006
a 0.092
a - - - 0.007
a - - 0.108
a
a (Edwards and Fry, 2011)
b (Kimmel and Cooksey, 2014)
c (Mori et al., 2013)
d (Muthu and Li, 2014)
e (Khoo and Tan, 2010)

100 The Danish Environmental Protection Agency / LCA of grocery carrier bags
Table A6. With reference to the energy and material requirements listed in Table
A4, this table provides the Ecoinvent datasets utilized for the corresponding energy and
material requirements. For completeness, the table reports in which scenarios the da-
tasets were used.
Ancillary material Scenario
Type
Ecoinvent process
(v 3.4, conse-
quential)
LDPEAVG
LDPEs
LDPEh
LDPErec
PP
PPwov PETREC PETPOL BP
PAP
PAPB
COTORG
COT COM
Electricity
Market group for
electricity, high
voltage; RER
(kWh)
X X X X X X X X
Heat
Market group for
heat, district or
industrial, natural
gas; RER (MJ)
X X X X X X
Water
Market for tap
water; Europe
without Switzer-
land (kg)
X X X X
Titanium
dioxide
Market for titani-
um dioxide; RoW
(kg)
X X
Ink
Market for printing
ink, rotogravure,
without solvent, in
55% toluene solu-
tion state; GLO
(kg)
X X X X X X
Cotton
thread
Market for textile,
woven cotton;
GLO (kg)
X X X X X
PP thread
Market for po-
lypropylene, gra-
nulate; GLO (kg)
X X X
Glue
Bitumen adhesive
compound pro-
duction, hot; RER
X
Packaging
Corrugated board
box production;
RER (kg)
X X X X X X X X

The Danish Environmental Protection Agency / LCA of grocery carrier bags 101
Table A7. Transportation distances utilized in this LCA study.
Transportation process Distance EOL1 EOL2 EOL3
Transport of packaging material to carrier bag production
facility (EU) 2000 km X X X
Transport of carrier bag to supermarket (EU-DK) 2000 km X X X
Collection of packaging from supermarkets (DK) 15 km X X X
Transport to packaging recycling (DK-EU) 2000 km X X X
Collection of residual waste (DK) 10 km X X
Transport fly ash (DK-EU) 500 km X X
Transport bottom ash (DK-EU) 100 km X X
Collection of recyclables (DK) 15 km X
Transportation to sorting (DK) 500 km X
Transportation to recycling (DK-EU) 2000 km X
Table A8. Ecoinvent process used in order to model transportation.
Transportation process Ecoinvent process (v 3.4, consequential)
Transport of packaging material to carrier bag production
facility (EU)
Transport, freight, lorry 16-32 metric ton,
EURO6; RER
(metric ton*km)
Transport of carrier bag to supermarket (EU-DK)
Transport to packaging recycling (DK-EU)
Transportation to sorting (DK)
Transport fly ash (DK-EU)
Transport bottom ash (DK-EU)
Transportation to recycling (DK-EU)
Collection of packaging from supermarkets (DK)
Collection of recyclables (DK)
Collection of residual waste (DK)
Table A9. Material losses during recycling of single-wall corrugated cardboard packag-
ing.
Material fraction Recycled (%) Residues (%)
Other clean cardboard (Riber et al., 2009) 91 9
Table A10. Material and energy requirements and corresponding Ecoinvent processes
used for the modelling of the recycling of single-wall corrugated cardboard packaging.
Material and energy requirements were obtained from Skjern Papirfabrik (2005).
Ecoinvent process name (v 3.4, consequential) Amount Unit
Market group for tap water; RER 17 kg/kg Total Wet Weight
Market group for electricity, high voltage; RER 1.5 kWh/kg Total Wet Weight
Natural gas, from high pressure network (1-5 bar), at service station; CH 0.069 kg/kg Total Wet Weight
Linerboard production, kraftliner; RER -0.9 kg/kg Total Wet Weight

102 The Danish Environmental Protection Agency / LCA of grocery carrier bags
Table A11. Emissions during recycling of single-wall corrugated cardboard packaging.
Elementary exchange Compartment Sub compartment Amount Unit Per
Nitrogen oxides air unspecified 8.80E-05 kg kg Total Wet Weight
Carbon dioxide, fossil air unspecified 0.18 kg kg Total Wet Weight
Sulfur dioxide air unspecified 0.0001 kg kg Total Wet Weight
COD, Chemical Oxygen Demand water surface water 0.0011 kg kg Total Wet Weight
Nitrogen water surface water 6.00E-05 kg kg Total Wet Weight
Phosphate water surface water 2.50E-06 kg kg Total Wet Weight
Suspended solids, unspecified water surface water 0.00016 kg kg Total Wet Weight
Particulates, > 2.5 um, and < 10um air unspecified 2.80E-05 kg kg Total Wet Weight
Table A12. Ecoinvent process used for modelling the treatment of residues from pack-
aging recycling.
Ecoinvent process name (v 3.4, consequential) Amount Unit
Treatment of waste paperboard, municipal incineration; Europe without Switzerland 1 kg/kg Total Wet Weight
Table A13. Material and energy requirements and corresponding Ecoinvent processes
used for the modelling of the incinerator technology. Material and energy requirements
were obtained from Vestforbrænding (2013). Electricity recovery was considered 22 %,
heat recovery 73 %. Please refer to Appendix B for the marginal electricity and heat
utilized.
Ecoinvent process name (v 3.4, consequential) Amount Unit
quicklime production, milled, packed; CH 0.00034 kg/kg Total Wet Weight
market for ammonia, liquid; RER 0.00153 kg/kg Total Wet Weight
activated carbon production, granular from hard coal; RER 0.00104 kg/kg Total Wet Weight
market for tap water; Europe without Switzerland 0.397 kg/kg Total Wet Weight
hydrochloric acid production, from the reaction of hydrogen with chlorine; RER 5.60E-06 kg/kg Total Wet Weight
market for sodium hydroxide, without water, in 50% solution state; GLO 2.40E-05 kg/kg Total Wet Weight
market for calcium carbonate, precipitated; GLO 0.00567 kg/kg Total Wet Weight
Marginal electricity, see Appendix B -0.22/3.6 kWh/MJ
Marginal heat, see Appendix B -0.73 MJ/MJ
Table A14. Emissions to the air, unspecified, Vestforbrænding (2013).
Elementary exchange Amount Unit
Carbon monoxide 3.30E-02 kg/kg Total Wet Weight
Dust 4.06E-03 kg/kg Total Wet Weight
HCl 6.58E-03 kg/kg Total Wet Weight
HF 2.70E-04 kg/kg Total Wet Weight
Manganese 1.12E-02 kg/kg Total Wet Weight
NH3 4.31E-03 kg/kg Total Wet Weight
Nickel 3.47E-06 kg/kg Total Wet Weight
Nitrogen Oxides (NOx) 5.49E-01 kg/kg Total Wet Weight
PAH (B[a]P-eq) 4.31E-06 kg/kg Total Wet Weight
PCDD/F 1.80E-11 kg/kg Total Wet Weight
SO2/SO3 1.08E-02 kg/kg Total Wet Weight

The Danish Environmental Protection Agency / LCA of grocery carrier bags 103
Table A15. Transfer coefficients to air emissions from input composition, Vestfor-
brænding (2013).
Parameter Unit Value
Hg % Hg in 0.7476
Cd % Cd in 0.0064
Pb % Pb in 0.0008
Cr % Cr in 0.0394
Cu % Cu in 0.003
As % As in 0.012
Ni % Ni in 0.033
Sb %Sb in 0.119
Table A16. Transfer coefficients for degradation and residues for the soft plastic mate-
rial fraction, Vestforbrænding (2013).
Fraction
name
Degradation Fly ash Scrap metals Bottom ash
Water
(%)
VS
(%TS)
Ash
(%TS)
Water
(%)
VS
(%TS)
Ash
(%TS)
Water
(%)
VS
(%TS)
Ash
(%TS)
Water
(%)
VS
(%TS)
Ash
(%TS)
Soft
plastic
100 99.9 0 0 0 12.6 0 0 0 0 0.1 87.4
Table A17. Emissions to water, Vestforbrænding incinerator.
Elementary exchange Compartment Value Unit
Antimony water 8.80E-06 kg/kg Total Wet Weight
Arsenic water 5.60E-07 kg/kg Total Wet Weight
Barium water 7.20E-06 kg/kg Total Wet Weight
Cadmium water 9.67E-08 kg/kg Total Wet Weight
Calcium water 4.16E-02 kg/kg Total Wet Weight
Chloride water 4.11E+00 kg/kg Total Wet Weight
Chromium water 4.48E-06 kg/kg Total Wet Weight
Cobalt water 4.00E-08 kg/kg Total Wet Weight
Copper water 2.00E-04 kg/kg Total Wet Weight
Fluoride water 2.08E-03 kg/kg Total Wet Weight
Iron water 4.00E-05 kg/kg Total Wet Weight
Lead water 1.20E-06 kg/kg Total Wet Weight
Magnesium water 2.56E-05 kg/kg Total Wet Weight
Manganese water 6.40E-07 kg/kg Total Wet Weight
Mercury water 1.35E-07 kg/kg Total Wet Weight
Molybdenum water 7.20E-05 kg/kg Total Wet Weight
Nickel water 1.68E-06 kg/kg Total Wet Weight
Selenium water 1.12E-06 kg/kg Total Wet Weight
Silicon water 2.40E-04 kg/kg Total Wet Weight
Zinc water 2.56E-06 kg/kg Total Wet Weight

104 The Danish Environmental Protection Agency / LCA of grocery carrier bags
Table A18. Material and energy requirements and corresponding Ecoinvent processes
used for the modelling of the treatment of fly ashes. Values for material and energy
requirements were obtained from Astrup (2008).
Ecoinvent process name (v 3.4, consequential) Amount Unit
market for calcium carbonate, precipitated; GLO -0.035 kg/kg Total Wet Weight
market group for electricity, high voltage; RER 0.013 kWh/kg Total Wet Weight
market group for diesel; RER 0.0006 kg/kg Total Wet Weight
Table A19. Emissions from treatment of fly ashes. (Astrup, 2008).
Elementary exchange Compartment Sub compartment Amount Unit Per
Cadmium, ion water surface water 3.10E-09 kg kg Total Wet Weight
Chloride water surface water 0.0092 kg kg Total Wet Weight
Lead water surface water 3.10E-10 kg kg Total Wet Weight
Mercury water surface water 6.10E-11 kg kg Total Wet Weight
Nickel, ion water surface water 1.50E-09 kg kg Total Wet Weight
Sulfate water surface water 0.00082 kg kg Total Wet Weight
Thallium water surface water 4.10E-10 kg kg Total Wet Weight
Zinc, ion water surface water 1.40E-08 kg kg Total Wet Weight
Table A20. Bottom ashes treatment was assumed to occur in a mineral landfill.
Ecoinvent process name (v 3.4, consequential) Amount Unit
process-specific burdens, slag landfill; Europe without Switzerland 1 kg/kg Total Wet Weight
Table A21. Sorting efficiency for recyclables. This sorting plant is assumed to operate
in Denmark. COWI (2017)
Carrier bag material Scenarios Sorted (%) Residues (%)
LDPE LDPEAVG, LDPEs, LDPEh,
LDPErec 70 30 (to incineration in DK)
PP PP, PPwov 70 30 (to incineration in DK)
Recycled PET PETREC 70 30 (to incineration in DK)
Polyester PETPOL 70 30 (to incineration in DK)
Paper PAP, PAPB 70 30 (to incineration in DK)
Table A22. Material and energy requirements, sorting plant for recyclables in Denmark.
COWI (2017).
Ecoinvent process name (v 3.4, consequential) Amount Unit
Marginal electricity, see Appendix B 0.00982 kWh/kg Total Wet Weight
Marginal heat, see Appendix B 0.0189 MJ/kg Total Wet Weight

The Danish Environmental Protection Agency / LCA of grocery carrier bags 105
Table A23. Sorting efficiency of recyclables, at recycling plant. COWI (2017).
Carrier bag material Scenarios Sorted (%) Residues (%) Reference
LDPE LDPEAVG, LDPEs,
LDPEh, LDPErec 90.3 9.7 (to incineration in EU) Replast A/S (2000)
PP PP, PPwov 90.3 9.7 (to incineration in EU) Replast A/S (2000)
Recycled PET PETREC 75.5 24.5 (to incineration in
EU) Giugliano et al. (2011)
Polyester PETPOL 75.5 24.5 (to incineration in
EU) Giugliano et al. (2011)
Paper PAP, PAPB 91 9 (to incineration in EU) Skjern Papirfabrik (2005)
Table A24. Material and energy requirements, LDPE recycling (Schmidt and Strömberg,
2006).
Ecoinvent process name (v 3.4, consequential) Amount Unit
market group for electricity, high voltage; RER 0.76 kWh/kg Total Wet Weight
market group for tap water; RER 2.6 kg/kg Total Wet Weight
market group for diesel; RER 0.00047 kg/kg Total Wet Weight
steam production, in chemical industry; RER 0.32 kg/kg Total Wet Weight
polyethylene production, low density, granulate; RER -0.9 kg/kg Total Wet Weight recycled
Table A25. Ecoinvent process used to model end-of-life of LDPE residues from the re-
cycling process.
Ecoinvent process name (v 3.4, consequential) Amount Unit
treatment of waste polyethylene, municipal incineration; Europe without Switzerland 1 kg/kg Total Wet Weight
Table A26. Material and energy requirements, PP recycling (Schmidt and Strömberg,
2006).
Ecoinvent process name (v 3.4, consequential) Amount Unit
market group for electricity, high voltage; RER 0.76 kWh/kg Total Wet Weight
market group for tap water; RER 2.6 kg/kg Total Wet Weight
market group for diesel; RER 0.00047 kg/kg Total Wet Weight
steam production, in chemical industry; RER 0.89/2.75 kg/kg Total Wet Weight
polypropylene production, granulate; RER -0.9 kg/kg Total Wet Weight recycled
Table A27. Ecoinvent process used to model end-of-life of PP residues from the recy-
cling process.
Ecoinvent process name (v 3.4, consequential) Amount Unit
treatment of waste polypropylene, municipal incineration; CH 1 kg/kg Total Wet Weight
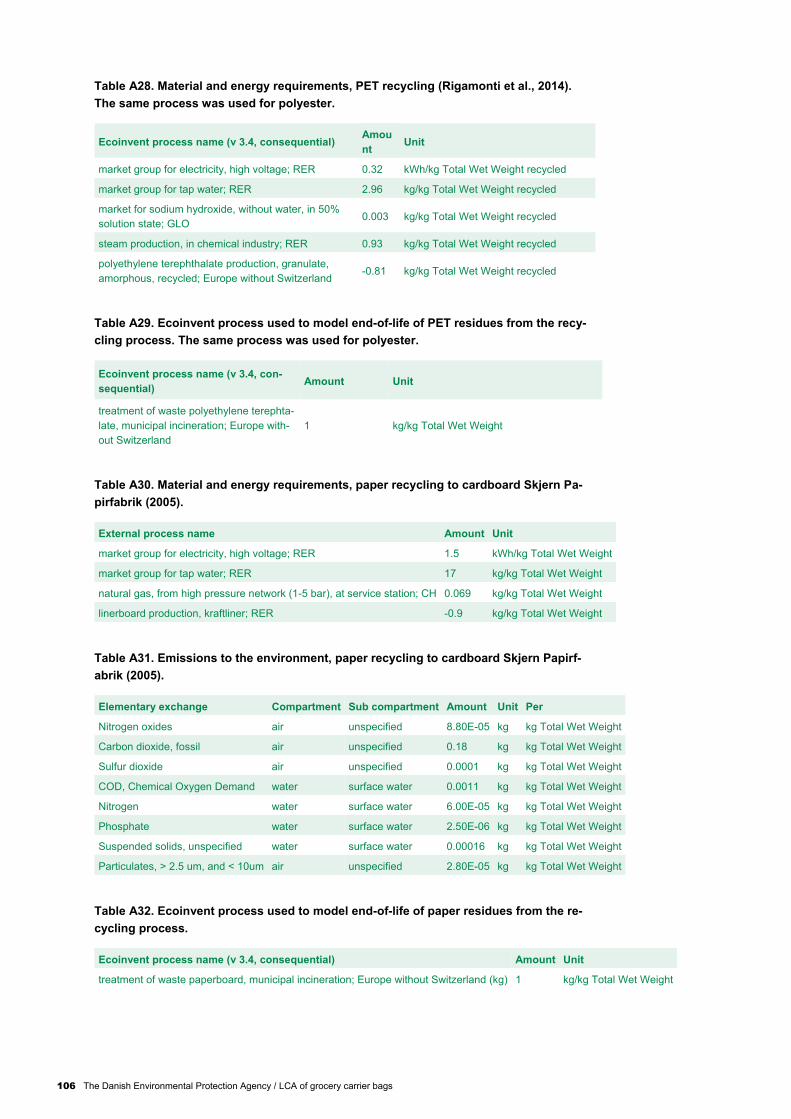
106 The Danish Environmental Protection Agency / LCA of grocery carrier bags
Table A28. Material and energy requirements, PET recycling (Rigamonti et al., 2014).
The same process was used for polyester.
Ecoinvent process name (v 3.4, consequential) Amou
nt Unit
market group for electricity, high voltage; RER 0.32 kWh/kg Total Wet Weight recycled
market group for tap water; RER 2.96 kg/kg Total Wet Weight recycled
market for sodium hydroxide, without water, in 50%
solution state; GLO 0.003 kg/kg Total Wet Weight recycled
steam production, in chemical industry; RER 0.93 kg/kg Total Wet Weight recycled
polyethylene terephthalate production, granulate,
amorphous, recycled; Europe without Switzerland -0.81 kg/kg Total Wet Weight recycled
Table A29. Ecoinvent process used to model end-of-life of PET residues from the recy-
cling process. The same process was used for polyester.
Ecoinvent process name (v 3.4, con-
sequential) Amount Unit
treatment of waste polyethylene terephta-
late, municipal incineration; Europe with-
out Switzerland
1 kg/kg Total Wet Weight
Table A30. Material and energy requirements, paper recycling to cardboard Skjern Pa-
pirfabrik (2005).
External process name Amount Unit
market group for electricity, high voltage; RER 1.5 kWh/kg Total Wet Weight
market group for tap water; RER 17 kg/kg Total Wet Weight
natural gas, from high pressure network (1-5 bar), at service station; CH 0.069 kg/kg Total Wet Weight
linerboard production, kraftliner; RER -0.9 kg/kg Total Wet Weight
Table A31. Emissions to the environment, paper recycling to cardboard Skjern Papirf-
abrik (2005).
Elementary exchange Compartment Sub compartment Amount Unit Per
Nitrogen oxides air unspecified 8.80E-05 kg kg Total Wet Weight
Carbon dioxide, fossil air unspecified 0.18 kg kg Total Wet Weight
Sulfur dioxide air unspecified 0.0001 kg kg Total Wet Weight
COD, Chemical Oxygen Demand water surface water 0.0011 kg kg Total Wet Weight
Nitrogen water surface water 6.00E-05 kg kg Total Wet Weight
Phosphate water surface water 2.50E-06 kg kg Total Wet Weight
Suspended solids, unspecified water surface water 0.00016 kg kg Total Wet Weight
Particulates, > 2.5 um, and < 10um air unspecified 2.80E-05 kg kg Total Wet Weight
Table A32. Ecoinvent process used to model end-of-life of paper residues from the re-
cycling process.
Ecoinvent process name (v 3.4, consequential) Amount Unit
treatment of waste paperboard, municipal incineration; Europe without Switzerland (kg) 1 kg/kg Total Wet Weight

The Danish Environmental Protection Agency / LCA of grocery carrier bags 107

108 The Danish Environmental Protection Agency / LCA of grocery carrier bags
Marginal Appendix B.technologies
This Section summarizes the technological processes that have been selected as marginal
technologies for the present LCA study. “Marginal technologies” are the technologies that are
assumed to be displaced by the additional functionalities provided by the functional unit. A
classic example for LCAs of waste management systems is the energy produced during the
treatment of waste by incineration. The energy produced represents an additional function,
and electricity and heat produced are used in the energy system instead of producing primary
energy from other sources.
For the present studies, marginal technologies needed to be identified for the energy recov-
ered during incineration in Denmark and for the secondary material produced from the recy-
cling processes. The following subsections present the processes and datasets chosen. In
order to facilitate reading, the selected processes are also provided with their LCIA results
according to the same references provided in Table 5 in the report. In addition, in order to
provide results in the same figures, we have used the following normalization references.
Table B1. Normalization references for the impact categories in Table 5. The Normaliza-
tion references are from the Prosuite project which was developed specifically for the
recommended ILCD method (Laurent et al., 2013), excluded the long-term compartment.
The impact category “Depletion of abiotic resources” respects ILCD recommended
characterization factors
Impact Category Acronyms Normalization references Units
Climate change CC 8.10E+03 PE/year
Ozone depletion OD 4.14E-02 PE/year
Human toxicity, cancer effects HTc 5.42E-05 PE/year
Human toxicity, non-cancer effects HTnc 1.10E-03 PE/year
Particulate matter/Respiratory inorganics PM 2.76E+00 PE/year
Ionizing radiation, human health IR 1.33E+03 PE/year
Photochemical ozone formation, human health POF 5.67E+01 PE/year
Terrestrial acidification TA 4.96E+01 PE/year
Eutrophication terrestrial TE 1.15E+02 PE/year
Eutrophication freshwater FE 6.20E-01 PE/year
Eutrophication marine ME 9.38E+00 PE/year
Ecotoxicity freshwater ET 6.65E+02 PE/year
Resources, depletion of abiotic resources, fossil RDfos 6.24E+04 PE/year
Resources, depletion of abiotic resources (reserve base) RD 0.0343 PE/year

The Danish Environmental Protection Agency / LCA of grocery carrier bags 109
Appendix B.1 Marginal energy technologies
Electricity
In accordance with the Danish Environmental Protection Agency, the marginal energy tech-
nologies used for this project were based on the latest published project from the Danish Envi-
ronmental Protection Agency, which provided marginal energy technologies for electricity and
heat: TemaNord 2016:537 - Gaining benefits from discarded textiles - LCA of different treat-
ment pathways, published by the Nordic Council of Ministers (Schmidt et al., 2016).
In this project, the long-term marginal was defined as capacity growth over a defined period
(2020-2030). The marginal was provided as a mix of contributing resources, as shown in Table
B2. The electricity marginal mix was then composed of electricity production from single-
technology processes from the Ecoinvent v3.4 database, consequential version. The normal-
ized results of the created process for electricity were compared to those of the electricity
market, high voltage, for Denmark in Ecoinvent v3.4, consequential and found compliant (Fig-
ure B1).
Table B2. Marginal mix, electricity, TemaNord 2016:537
Resource Percent contribution (%) Ecoinvent v3.4 process
Biomass 49.8 Electricity production, wood, future; GLO (kWh), consequential
Gas 18.6 Electricity production, natural gas, 10MW; CH, (kWh), consequential
Wind 31.6 Electricity production, wind, <1MW turbine, onshore; DK (kWh), consequential
Figure B1. Marginal electricity mix normalized results, obtained from single technology
dataset from Ecoinvent v3.4, consequential, according to the percent contribution iden-
tified in TemaNord 2016:537, compared to the normalized results of the market for elec-
tricity process, retrieved from Ecoinvent v3.4, consequential.
-2.00E-05
0.00E+00
2.00E-05
4.00E-05
6.00E-05
8.00E-05
1.00E-04
1.20E-04
1.40E-04
1.60E-04
1.80E-04
CC OD HTC HTNC PM IR POF TA TE FE ME ET RD fos RD
Marginal electricity mix, TemaNord 2016:537, single technologies from Ecoinvent v3.4, consequential
Market for electricity, high voltage; DK, Ecoinvent v3.4, consequential

110 The Danish Environmental Protection Agency / LCA of grocery carrier bags
Heat
In the TemaNord 2016:537 project the marginal technology from heat was chosen based on
the project Miljøprojekt 1458 (Bang Jensen et al., 2013). The contribution of resources to the
marginal heat mix is provided in Table B3. In Miljøprojekt 1458 it was assumed that waste heat
could not replace waste heat, therefore heat from incineration is not part of the heat marginal
mix. The Ecoinvent 3.4 processes used to compose the dataset are specified in Table B3. For
all processes, the selection involved finding heat production datasets from single technologies
and comparing the normalized results of many single-technologies for heat production of the
same type. Due to high differences between the normalized results and to the unavailability of
single technologies datasets for biogas, we selected a process from the allocation at the point
of substitution database instead of the consequential one. The differences in the overall nor-
malized result are minor, due to the minor contribution of biogas. Figure B2 provides a contri-
bution analysis of the single technologies composing the dataset.
Table B2. Marginal mix, electricity, Miljøprojekt 1458
Resource Percent cont-
ribution (%)
Ecoinvent v3.4 process
Biomass 39 Heat production, hardwood chips from forest, at furnace 5000kW, state-of-the-art
2014; CH (MJ), consequential
Gas 26 Heat production, natural gas, at boiler modulating >100kW; Europe without Switzer-
land (MJ), consequential
Coal 20 Heat production, at hard coal industrial furnace 1-10MW; Europe without Switzer-
land (MJ), consequential
Oil 9 Heat production, heavy fuel oil, at industrial furnace 1MW; CH (MJ), consequential
Biogas 6 Heat and power co-generation, biogas, gas engine; DK (MJ), allocation at the point
of substitution
Figure B2. Normalized results and contribution analysis associated with the marginal
heat technology (mix) selected for the present LCA study.
0.00E+00
5.00E-06
1.00E-05
1.50E-05
2.00E-05
2.50E-05
3.00E-05
3.50E-05
APOS, heat and power co-generation,biogas, gas engine; DK APOS, Ecoinvent3.4
CON, heat production, heavy fuel oil, atindustrial furnace 1MW; CH CON,Ecoinvent 3.4
CON, heat production, at hard coalindustrial furnace 1-10MW; Europewithout Switzerland CON, Ecoinvent 3.4
CON, heat production, natural gas, atboiler modulating >100kW; Europe withoutSwitzerland CON, Ecoinvent 3.4
CON, heat production, hardwood chipsfrom forest, at furnace 5000kW, state-of-the-art 2014; CH CON, Ecoinvent 3.4

The Danish Environmental Protection Agency / LCA of grocery carrier bags 111
Appendix B.2 Marginal materials
The following Table B4 provides a summary of the datasets selected for the production of
materials and for the recycling (for the carrier bags for which it was considered possible). All
datasets were retrieved from Ecoinvent 3.4, consequential version.
Each dataset was selected after comparison of many datasets for the production of the same
material. The criterion for selection of the dataset was general compliance in results with da-
tasets for the same function, and availability of the dataset. For production, market datasets
were always selected (if available), since market comprises production shares globally and
average transport distances. For substitution, we selected simply the production in a specific
geographical area (preferably Europe, since it is where the recycling process is assumed to
occur).
For recycled LDPE, there was no available dataset on the production. Therefore, the LCA was
carried out considering the same production as virgin LDPE. The results obtained are as-
sumed to be conservative, since the impacts connected to virgin plastics are usually larger
than the ones of recycled plastics, as it is shown in Figure B3 for PET, for both datasets are
available in Ecoinvent v3.4, consequential.
Table B4. Summary of datasets used as production of materials and for the materials
substituted by the secondary material produced from the recycling processes.
Material Production Substitution
LDPE Market for polyethylene, low density,
granulate; GLO (kg)
Polyethylene production, low density,
granulate; RER (kg)
Recycled LDPE Market for polyethylene, low density,
granulate; GLO (kg)
Polyethylene production, low density,
granulate; RER (kg)
PP Market for polypropylene, granulate;
GLO (kg)
Polypropylene production, granulate;
RER (kg)
Recycled PET
Market for polyethylene terephthalate,
granulate, amorphous, recycled; RoW
(kg)
Polyethylene terephthalate produc-
tion, granulate, amorphous, recycled;
Europe without Switzerland (kg)
Polyester Market for polyethylene terephthalate,
granulate, amorphous; GLO (kg)
Polyethylene terephthalate produc-
tion, granulate, amorphous; RER (kg)
Starch-complexed biopolymer Market for polyester-complexed starch
biopolymer; GLO (kg) -
Unbleached paper Kraft paper production, unbleached;
RER (kg)
Linerboard production, kraftliner; RER
(kg)
Bleached paper Kraft paper production, bleached; RER
(kg)
Linerboard production, kraftliner; RER
(kg)
Cotton organic
Market for textile, woven cotton; GLO
(kg)
Minus “CON, market for nitrogen fertilis-
er, as N; GLO (kg)”
-
Cotton conventional Market for textile, woven cotton; GLO
(kg) -
Jute Market for textile, jute; GLO (kg) -
LDPE bin bag Packaging film production, low density
polyethylene; RER (kg) -

112 The Danish Environmental Protection Agency / LCA of grocery carrier bags
Figure B3. Normalized impact scores for virgin and recycled PET production.
0
0.0005
0.001
0.0015
0.002
0.0025
0.003
0.0035
0.004
0.0045
CC OD HTC HTNC PM IR POF TA TE FE ME ET RD fos RD
PE
Market for polyethylene terephthalate, granulate, amorphous; GLO
Polyethylene terephthalate production, granulate, amorphous, recycled; RoW

The Danish Environmental Protection Agency / LCA of grocery carrier bags 113

114 The Danish Environmental Protection Agency / LCA of grocery carrier bags
Additional Appendix C.results
This Section reports the primary reuse times calculated for all impact categories, which were
omitted from the main report for brevity.
Tables C1-C14 provide the calculated number of primary reuse times for each carrier bag in
comparison to the reference bag LDPEavg, for each impact category. Table C15 provides a
minimum – maximum range obtained with the calculated number of primary reuse times for
each impact category. Table C16 provides the minimum-maximum range without the ozone
depletion impact category, which provided high result scores affecting the cotton and compo-
site bags. Table C17 provides the average number of reuse times obtained averaging results
across all impact categories. Results in Tables C15, C16 and C17 are rounded.
Table C1. Calculated number of primary reuse times for the carrier bags in the rows,
associated to the disposal options in the columns, necessary to provide the same envi-
ronmental performance of the average LDPE carrier bag, reused as a waste bin bag
before incineration (EOL3), for the ozone depletion impact category
LDPEavg, EOL3
Ozone Depletion
EOL1 EOL2 EOL3
LDPEavg -0.2 2.9 0.0
LDPEs 0.2 4.8 0.5
LDPEh 0.0 3.7 0.2
LDPErec 0.9 7.3 1.2
PP 34.5 52.0 34.7
PPwov 29.7 44.9 30.0
PETrec 44.3 60.3 44.7
PETpol 14.3 18.6 14.6
BP 9.4 - 9.7
PAP 7.6 12.0 7.9
PAPb 17.9 22.4 18.2
COTorg 19961.8 - 19962.3
COT 7069.0 - 7069.2
COM 874.1 - 874.3
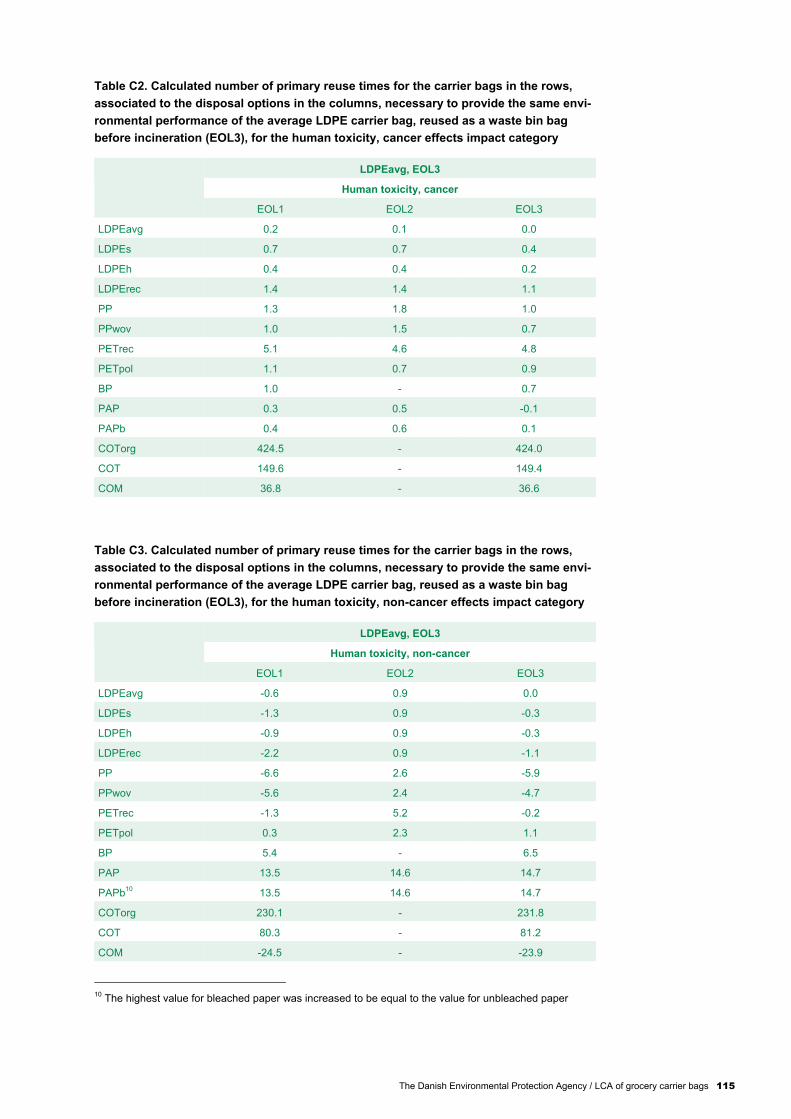
The Danish Environmental Protection Agency / LCA of grocery carrier bags 115
Table C2. Calculated number of primary reuse times for the carrier bags in the rows,
associated to the disposal options in the columns, necessary to provide the same envi-
ronmental performance of the average LDPE carrier bag, reused as a waste bin bag
before incineration (EOL3), for the human toxicity, cancer effects impact category
LDPEavg, EOL3
Human toxicity, cancer
EOL1 EOL2 EOL3
LDPEavg 0.2 0.1 0.0
LDPEs 0.7 0.7 0.4
LDPEh 0.4 0.4 0.2
LDPErec 1.4 1.4 1.1
PP 1.3 1.8 1.0
PPwov 1.0 1.5 0.7
PETrec 5.1 4.6 4.8
PETpol 1.1 0.7 0.9
BP 1.0 - 0.7
PAP 0.3 0.5 -0.1
PAPb 0.4 0.6 0.1
COTorg 424.5 - 424.0
COT 149.6 - 149.4
COM 36.8 - 36.6
Table C3. Calculated number of primary reuse times for the carrier bags in the rows,
associated to the disposal options in the columns, necessary to provide the same envi-
ronmental performance of the average LDPE carrier bag, reused as a waste bin bag
before incineration (EOL3), for the human toxicity, non-cancer effects impact category
LDPEavg, EOL3
Human toxicity, non-cancer
EOL1 EOL2 EOL3
LDPEavg -0.6 0.9 0.0
LDPEs -1.3 0.9 -0.3
LDPEh -0.9 0.9 -0.3
LDPErec -2.2 0.9 -1.1
PP -6.6 2.6 -5.9
PPwov -5.6 2.4 -4.7
PETrec -1.3 5.2 -0.2
PETpol 0.3 2.3 1.1
BP 5.4 - 6.5
PAP 13.5 14.6 14.7
PAPb10
13.5 14.6 14.7
COTorg 230.1 - 231.8
COT 80.3 - 81.2
COM -24.5 - -23.9
10
The highest value for bleached paper was increased to be equal to the value for unbleached paper

116 The Danish Environmental Protection Agency / LCA of grocery carrier bags

The Danish Environmental Protection Agency / LCA of grocery carrier bags 117
Table C4. Calculated number of primary reuse times for the carrier bags in the rows,
associated to the disposal options in the columns, necessary to provide the same envi-
ronmental performance of the average LDPE carrier bag, reused as a waste bin bag
before incineration (EOL3), for the particulate matter impact category
LDPEavg, EOL3
Particulate matter
EOL1 EOL2 EOL3
LDPEavg 0.6 2.1 0.0
LDPEs 1.4 3.6 0.3
LDPEh 1.0 2.7 0.3
LDPErec 2.7 5.7 1.4
PP 10.2 21.2 9.4
PPwov 8.7 18.2 7.7
PETrec 26.7 32.8 25.5
PETpol 9.1 10.5 8.2
BP 11.1 - 9.9
PAP 16.6 25.3 15.3
PAPb 28.6 37.2 27.4
COTorg 1119.8 - 1118.0
COT 394.6 - 393.7
COM 300.1 - 299.3
Table C5. Calculated number of primary reuse times for the carrier bags in the rows,
associated to the disposal options in the columns, necessary to provide the same envi-
ronmental performance of the average LDPE carrier bag, reused as a waste bin bag
before incineration (EOL3), for the ionizing radiation impact category
LDPEavg, EOL3
Ionising radiation
EOL1 EOL2 EOL3
LDPEavg 0.4 3.2 0.0
LDPEs 1.1 5.1 0.4
LDPEh 0.7 4.0 0.2
LDPErec 2.1 7.7 1.3
PP 19.8 35.8 19.3
PPwov 17.0 30.8 16.3
PETrec 32.1 40.6 31.3
PETpol 9.9 12.2 9.3
BP 8.2 - 7.3
PAP 13.8 18.4 12.9
PAPb11
13.8 18.4 12.9
COTorg 906.7 - 905.4
COT 321.9 - 321.3
COM 95.5 - 95.0
11
The highest value for bleached paper was increased to be equal to the value for unbleached paper
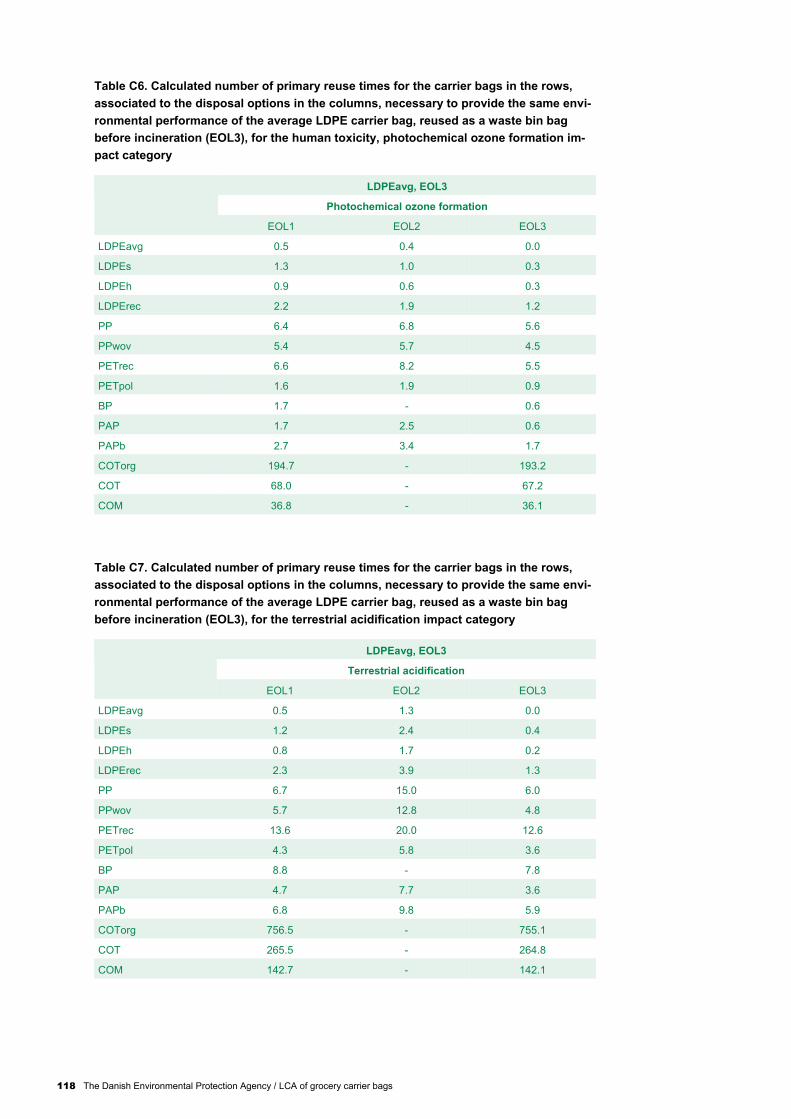
118 The Danish Environmental Protection Agency / LCA of grocery carrier bags
Table C6. Calculated number of primary reuse times for the carrier bags in the rows,
associated to the disposal options in the columns, necessary to provide the same envi-
ronmental performance of the average LDPE carrier bag, reused as a waste bin bag
before incineration (EOL3), for the human toxicity, photochemical ozone formation im-
pact category
LDPEavg, EOL3
Photochemical ozone formation
EOL1 EOL2 EOL3
LDPEavg 0.5 0.4 0.0
LDPEs 1.3 1.0 0.3
LDPEh 0.9 0.6 0.3
LDPErec 2.2 1.9 1.2
PP 6.4 6.8 5.6
PPwov 5.4 5.7 4.5
PETrec 6.6 8.2 5.5
PETpol 1.6 1.9 0.9
BP 1.7 - 0.6
PAP 1.7 2.5 0.6
PAPb 2.7 3.4 1.7
COTorg 194.7 - 193.2
COT 68.0 - 67.2
COM 36.8 - 36.1
Table C7. Calculated number of primary reuse times for the carrier bags in the rows,
associated to the disposal options in the columns, necessary to provide the same envi-
ronmental performance of the average LDPE carrier bag, reused as a waste bin bag
before incineration (EOL3), for the terrestrial acidification impact category
LDPEavg, EOL3
Terrestrial acidification
EOL1 EOL2 EOL3
LDPEavg 0.5 1.3 0.0
LDPEs 1.2 2.4 0.4
LDPEh 0.8 1.7 0.2
LDPErec 2.3 3.9 1.3
PP 6.7 15.0 6.0
PPwov 5.7 12.8 4.8
PETrec 13.6 20.0 12.6
PETpol 4.3 5.8 3.6
BP 8.8 - 7.8
PAP 4.7 7.7 3.6
PAPb 6.8 9.8 5.9
COTorg 756.5 - 755.1
COT 265.5 - 264.8
COM 142.7 - 142.1
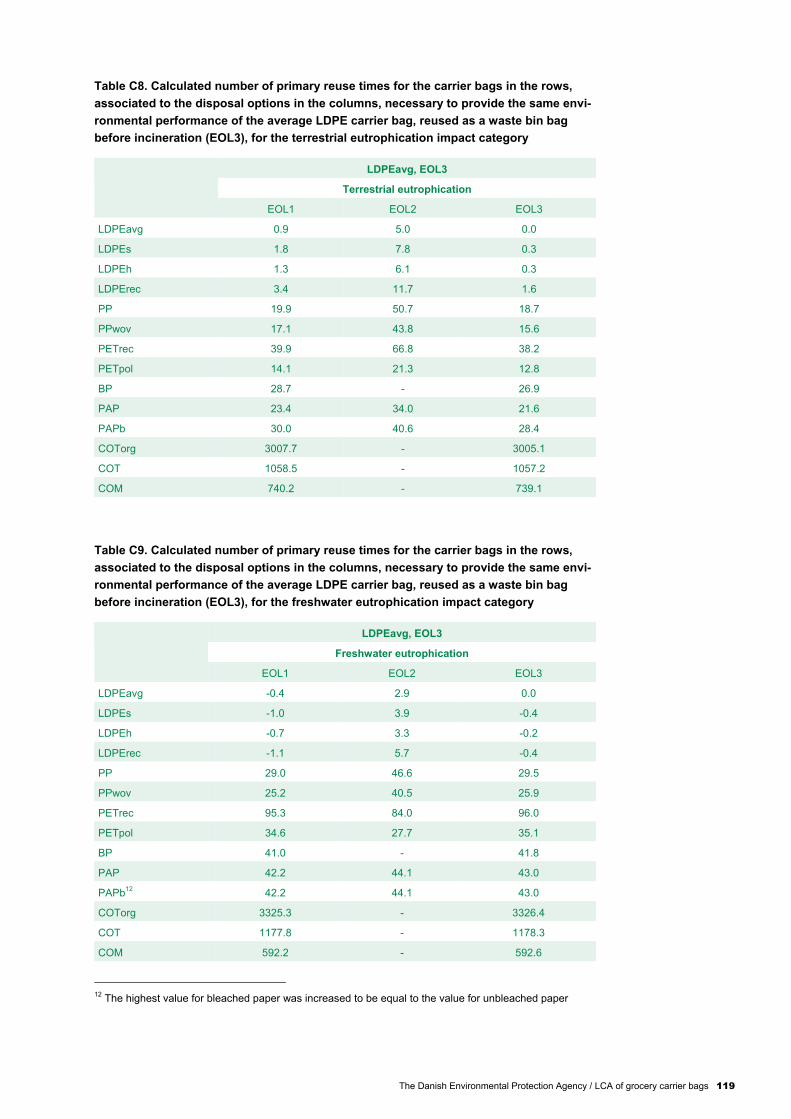
The Danish Environmental Protection Agency / LCA of grocery carrier bags 119
Table C8. Calculated number of primary reuse times for the carrier bags in the rows,
associated to the disposal options in the columns, necessary to provide the same envi-
ronmental performance of the average LDPE carrier bag, reused as a waste bin bag
before incineration (EOL3), for the terrestrial eutrophication impact category
LDPEavg, EOL3
Terrestrial eutrophication
EOL1 EOL2 EOL3
LDPEavg 0.9 5.0 0.0
LDPEs 1.8 7.8 0.3
LDPEh 1.3 6.1 0.3
LDPErec 3.4 11.7 1.6
PP 19.9 50.7 18.7
PPwov 17.1 43.8 15.6
PETrec 39.9 66.8 38.2
PETpol 14.1 21.3 12.8
BP 28.7 - 26.9
PAP 23.4 34.0 21.6
PAPb 30.0 40.6 28.4
COTorg 3007.7 - 3005.1
COT 1058.5 - 1057.2
COM 740.2 - 739.1
Table C9. Calculated number of primary reuse times for the carrier bags in the rows,
associated to the disposal options in the columns, necessary to provide the same envi-
ronmental performance of the average LDPE carrier bag, reused as a waste bin bag
before incineration (EOL3), for the freshwater eutrophication impact category
LDPEavg, EOL3
Freshwater eutrophication
EOL1 EOL2 EOL3
LDPEavg -0.4 2.9 0.0
LDPEs -1.0 3.9 -0.4
LDPEh -0.7 3.3 -0.2
LDPErec -1.1 5.7 -0.4
PP 29.0 46.6 29.5
PPwov 25.2 40.5 25.9
PETrec 95.3 84.0 96.0
PETpol 34.6 27.7 35.1
BP 41.0 - 41.8
PAP 42.2 44.1 43.0
PAPb12
42.2 44.1 43.0
COTorg 3325.3 - 3326.4
COT 1177.8 - 1178.3
COM 592.2 - 592.6
12
The highest value for bleached paper was increased to be equal to the value for unbleached paper

120 The Danish Environmental Protection Agency / LCA of grocery carrier bags
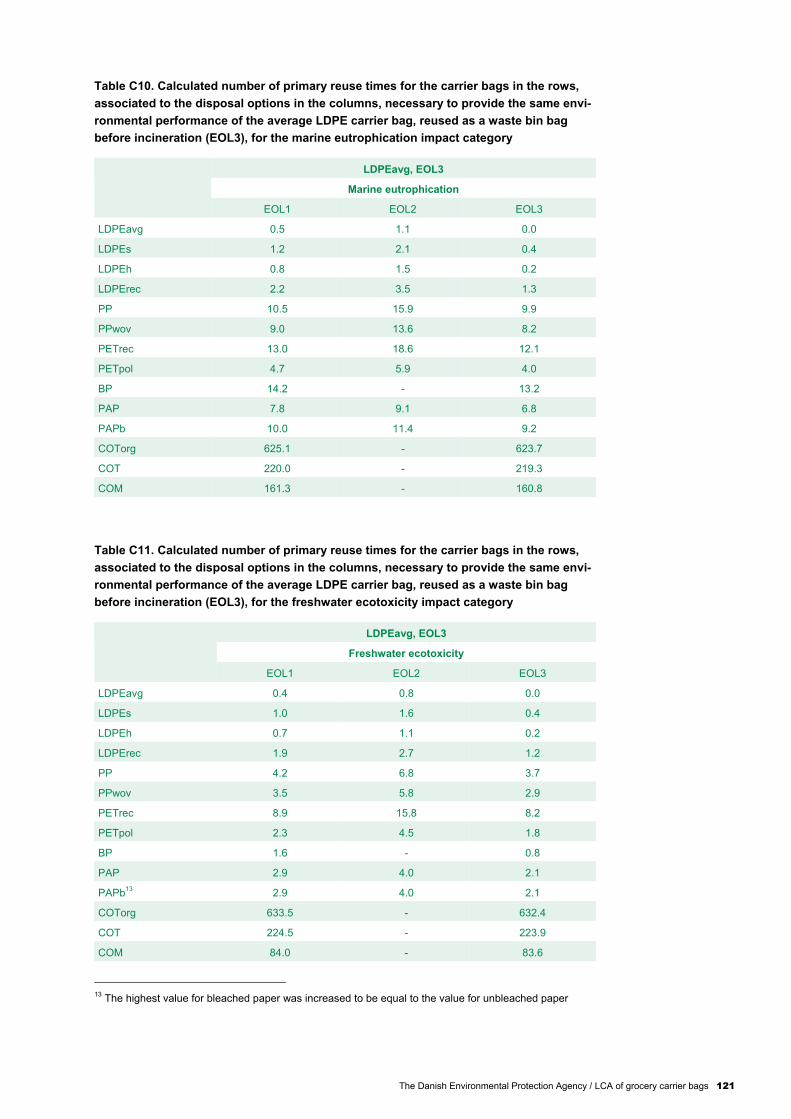
The Danish Environmental Protection Agency / LCA of grocery carrier bags 121
Table C10. Calculated number of primary reuse times for the carrier bags in the rows,
associated to the disposal options in the columns, necessary to provide the same envi-
ronmental performance of the average LDPE carrier bag, reused as a waste bin bag
before incineration (EOL3), for the marine eutrophication impact category
LDPEavg, EOL3
Marine eutrophication
EOL1 EOL2 EOL3
LDPEavg 0.5 1.1 0.0
LDPEs 1.2 2.1 0.4
LDPEh 0.8 1.5 0.2
LDPErec 2.2 3.5 1.3
PP 10.5 15.9 9.9
PPwov 9.0 13.6 8.2
PETrec 13.0 18.6 12.1
PETpol 4.7 5.9 4.0
BP 14.2 - 13.2
PAP 7.8 9.1 6.8
PAPb 10.0 11.4 9.2
COTorg 625.1 - 623.7
COT 220.0 - 219.3
COM 161.3 - 160.8
Table C11. Calculated number of primary reuse times for the carrier bags in the rows,
associated to the disposal options in the columns, necessary to provide the same envi-
ronmental performance of the average LDPE carrier bag, reused as a waste bin bag
before incineration (EOL3), for the freshwater ecotoxicity impact category
LDPEavg, EOL3
Freshwater ecotoxicity
EOL1 EOL2 EOL3
LDPEavg 0.4 0.8 0.0
LDPEs 1.0 1.6 0.4
LDPEh 0.7 1.1 0.2
LDPErec 1.9 2.7 1.2
PP 4.2 6.8 3.7
PPwov 3.5 5.8 2.9
PETrec 8.9 15.8 8.2
PETpol 2.3 4.5 1.8
BP 1.6 - 0.8
PAP 2.9 4.0 2.1
PAPb13
2.9 4.0 2.1
COTorg 633.5 - 632.4
COT 224.5 - 223.9
COM 84.0 - 83.6
13
The highest value for bleached paper was increased to be equal to the value for unbleached paper

122 The Danish Environmental Protection Agency / LCA of grocery carrier bags

The Danish Environmental Protection Agency / LCA of grocery carrier bags 123
Table C12. Calculated number of primary reuse times for the carrier bags in the rows,
associated to the disposal options in the columns, necessary to provide the same envi-
ronmental performance of the average LDPE carrier bag, reused as a waste bin bag
before incineration (EOL3), for the resource depletion, fossil impact category
LDPEavg, EOL3
Resource depletion, fossil
EOL1 EOL2 EOL3
LDPEavg 0.6 0.2 0.0
LDPEs 1.3 0.8 0.3
LDPEh 0.9 0.5 0.3
LDPErec 2.3 1.6 1.2
PP 8.7 7.3 7.9
PPwov 7.4 6.2 6.5
PETrec 9.9 9.8 8.8
PETpol 2.8 2.3 2.0
BP 1.7 - 0.6
PAP 0.1 1.1 -1.0
PAPb 2.3 3.3 1.4
COTorg 185.9 - 184.3
COT 65.2 - 64.4
COM 26.0 - 25.3
Table C13. Calculated number of primary reuse times for the carrier bags in the rows,
associated to the disposal options in the columns, necessary to provide the same envi-
ronmental performance of the average LDPE carrier bag, reused as a waste bin bag
before incineration (EOL3), for the resource depletion, abiotic impact category
LDPEavg, EOL3
Resource depletion
EOL1 EOL2 EOL3
LDPEavg 0.2 0.3 0.0
LDPEs 0.7 1.0 0.4
LDPEh 0.4 0.6 0.2
LDPErec 1.4 1.8 1.1
PP 0.5 1.6 0.2
PPwov 0.3 1.2 0.0
PETrec 12.2 9.6 11.8
PETpol 3.6 2.3 3.3
BP 2.2 - 1.9
PAP 22.7 22.5 22.4
PAPb14
22.7 22.5 22.4
COTorg 278.2 - 277.7
COT 98.0 - 97.8
COM 19.2 - 19.0
14
The highest value for bleached paper was increased to be equal to the value for unbleached paper

124 The Danish Environmental Protection Agency / LCA of grocery carrier bags

The Danish Environmental Protection Agency / LCA of grocery carrier bags 125
Table C14. Calculated number of primary reuse times for the carrier bags in the rows,
associated to the disposal options in the columns, necessary to provide the same envi-
ronmental performance of the average LDPE carrier bag, reused as a waste bin bag
before incineration (EOL3), for the water resource depletion impact category
LDPEavg, EOL3
Water use
EOL1 EOL2 EOL3
LDPEavg 1.2 3.3 0.0
LDPEs 2.3 5.4 -0.2
LDPEh 1.7 4.2 -3.9
LDPErec 1.7 3.8 0.5
PP 38.4 51.3 37.2
PPwov 33.1 44.3 31.9
PETrec 69.7 66.2 68.5
PETpol 22.9 19.7 21.6
BP 0.1 - -2.3
PAP 16.1 77.2 13.6
PAPb15
16.1 77.2 13.6
COTorg 3832.8 - 3830.4
COT 1359.3 - 1358.1
COM 276.5 - 275.3
Table C15. Calculated number of primary reuse times for the carrier bags in the rows,
associated to the disposal options in the columns, necessary to provide the same envi-
ronmental performance of the average LDPE carrier bag, reused as a waste bin bag
before incineration (EOL3). The Table shows a (min, max) range obtained considering
the minimum and maximum number calculated for each bag for all impact categories.
Numbers lower than zero indicate when the carrier bag in the row already provides a
better performance than the LDPEavg reference bag.
LDPEavg, EOL3
Min - Max ranges, all impact categories
EOL1 EOL2 EOL3
LDPEavg (-1, 1) (0, 5) (0, 0)
LDPEs (-1, 2) (1, 8) (0, 1)
LDPEh (-1, 2) (0, 6) (-4, 0)
LDPErec (-2, 3) (1, 12) (-1, 2)
PP (-7, 38) (2, 52) (-6, 37)
PPwov (-6, 33) (1, 45) (-5, 32)
PETrec (-1, 95) (5, 84) (0, 96)
PETpol (0, 35) (1, 28) (1, 35)
BP (0, 41) - (-2, 42)
PAP (0, 42) (0, 77) (-1, 43)
PAPb16
(0, 42) (1, 77) (0, 43)
15
The highest value for bleached paper was increased to be equal to the value for unbleached paper
16 The highest value for bleached paper was increased to be equal to the value for unbleached paper

126 The Danish Environmental Protection Agency / LCA of grocery carrier bags
COTorg (150, 20000) - (150, 20000)
COT (50, 7100) - (50, 7100)
COM (-20, 870) - (-20, 870)
Table C16. Calculated number of primary reuse times for the carrier bags in the rows,
associated to the disposal options in the columns, necessary to provide the same envi-
ronmental performance of the average LDPE carrier bag, reused as a waste bin bag
before incineration (EOL3). The Table shows a (min, max) range obtained considering
the minimum and maximum number calculated for each bag for all impact categories,
without ozone depletion. Numbers lower than zero indicate when the carrier bag in the
row already provides a better performance than the LDPEavg reference bag.
LDPEavg, EOL3
Min - Max ranges, all impact categories w/o ozone depletion
EOL1 EOL2 EOL3
LDPEavg (-1, 1) (0, 5) (0, 0)
LDPEs (-1, 2) (1, 8) (0, 0)
LDPEh (-1, 2) (0, 6) (-4, 0)
LDPErec (-2, 3) (1, 12) (-1, 2)
PP (-7, 38) (2, 51) (-6, 37)
PPwov (-6, 33) (1, 44) (-5, 32)
PETrec (-1, 95) (5, 84) (0, 96)
PETpol (0, 35) (1, 28) (1, 35)
BP (0, 41) - (-2, 42)
PAP (0, 42) (0, 77) (-1, 43)
PAPb (0, 30) (1, 72) (0, 28)
COTorg (150, 3800) - (150, 3800)
COT (50, 1400) - (50, 1400)
COM (-20, 740) - (-20, 740)
Table C17. Average number of primary reuse times for the carrier bags in the rows,
associated to the disposal options in the columns, necessary to provide the same envi-
ronmental performance of the average LDPE carrier bag, reused as a waste bin bag
before incineration (EOL3). The average number was obtained averaging the results of
the carrier bags in the rows for each impact category.
LDPEavg, EOL3
Average number of reuse times
EOL1 EOL2 EOL3
LDPEavg 0 2 0
LDPEs 1 3 0
LDPEh 1 2 0
LDPErec 2 4 1
PP 13 21 12
PPwov 11 18 10
PETrec 26 30 25
PETpol 9 9 8
BP 9 - 8
PAP 12 18 11
PAPb 10 16 9

The Danish Environmental Protection Agency / LCA of grocery carrier bags 127
COTorg 2376 - 2375
COT 840 - 840
COM 226 - 225

128 The Danish Environmental Protection Agency / LCA of grocery carrier bags
Critical review Appendix D.
KRITISK REVIEW AF "MILJØMÆSSIGE EFFEKTER AF BRUG AF PLASTBÆREPOSER I
FORHOLD TIL ALTERNATIVE BÆREPOSER"
KRISTISK REVIEW AF LCA UDFØRT AF EKSTERN EKSPERT EFTER ISO 14044
Indledning
Dette kritiske review af livscyklusanalysen "LCA of grocery carrier bags" angående miljøeffek-
terne ved produktion, anvendelse og affaldsbehandling af bæreposer er udført af COWI efter
den internationale standard ISO 14044, så vidt muligt.
Processen for det kritiske review var som følger:
COWI gennemfører første review udført januar 2018.
DTU forholder sig til reviewet og laver eventuelle rettelser (ny version af rap-port) februar
2018
COWI forholder sig til rettelserne (nedenstående afsnit og tabel) i det endelige review notat
februar 2018
Fra COWI blev det kritiske review gennemført af Line Geest Jakobsen og Trine Lund Neidel.
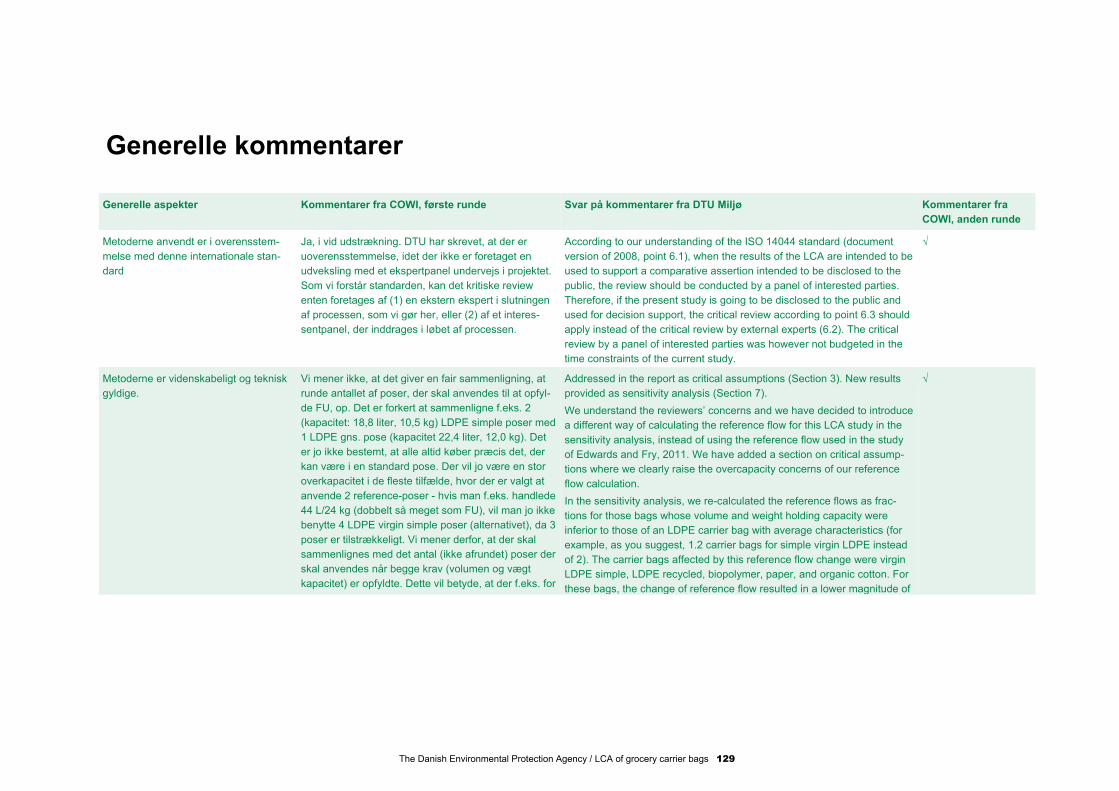
The Danish Environmental Protection Agency / LCA of grocery carrier bags 129
Generelle kommentarer
Generelle aspekter Kommentarer fra COWI, første runde Svar på kommentarer fra DTU Miljø Kommentarer fra
COWI, anden runde
Metoderne anvendt er i overensstem-
melse med denne internationale stan-
dard
Ja, i vid udstrækning. DTU har skrevet, at der er
uoverensstemmelse, idet der ikke er foretaget en
udveksling med et ekspertpanel undervejs i projektet.
Som vi forstår standarden, kan det kritiske review
enten foretages af (1) en ekstern ekspert i slutningen
af processen, som vi gør her, eller (2) af et interes-
sentpanel, der inddrages i løbet af processen.
According to our understanding of the ISO 14044 standard (document
version of 2008, point 6.1), when the results of the LCA are intended to be
used to support a comparative assertion intended to be disclosed to the
public, the review should be conducted by a panel of interested parties.
Therefore, if the present study is going to be disclosed to the public and
used for decision support, the critical review according to point 6.3 should
apply instead of the critical review by external experts (6.2). The critical
review by a panel of interested parties was however not budgeted in the
time constraints of the current study.
√
Metoderne er videnskabeligt og teknisk
gyldige.
Vi mener ikke, at det giver en fair sammenligning, at
runde antallet af poser, der skal anvendes til at opfyl-
de FU, op. Det er forkert at sammenligne f.eks. 2
(kapacitet: 18,8 liter, 10,5 kg) LDPE simple poser med
1 LDPE gns. pose (kapacitet 22,4 liter, 12,0 kg). Det
er jo ikke bestemt, at alle altid køber præcis det, der
kan være i en standard pose. Der vil jo være en stor
overkapacitet i de fleste tilfælde, hvor der er valgt at
anvende 2 reference-poser - hvis man f.eks. handlede
44 L/24 kg (dobbelt så meget som FU), vil man jo ikke
benytte 4 LDPE virgin simple poser (alternativet), da 3
poser er tilstrækkeligt. Vi mener derfor, at der skal
sammenlignes med det antal (ikke afrundet) poser der
skal anvendes når begge krav (volumen og vægt
kapacitet) er opfyldte. Dette vil betyde, at der f.eks. for
Addressed in the report as critical assumptions (Section 3). New results
provided as sensitivity analysis (Section 7).
We understand the reviewers’ concerns and we have decided to introduce
a different way of calculating the reference flow for this LCA study in the
sensitivity analysis, instead of using the reference flow used in the study
of Edwards and Fry, 2011. We have added a section on critical assump-
tions where we clearly raise the overcapacity concerns of our reference
flow calculation.
In the sensitivity analysis, we re-calculated the reference flows as frac-
tions for those bags whose volume and weight holding capacity were
inferior to those of an LDPE carrier bag with average characteristics (for
example, as you suggest, 1.2 carrier bags for simple virgin LDPE instead
of 2). The carrier bags affected by this reference flow change were virgin
LDPE simple, LDPE recycled, biopolymer, paper, and organic cotton. For
these bags, the change of reference flow resulted in a lower magnitude of
√

130 The Danish Environmental Protection Agency / LCA of grocery carrier bags
“LDPE virgin simple” vil skulle sammenlignes med 1,2
poser i stedet for 2 (22,4/18,8=1,2).
the results.
As far as the overall results are concerned:
the most preferable end-of-life option for each carrier bag was not affected
the bags providing the lowest impacts for each impact category were still
paper, biopolymer and virgin LDPE carrier bags – the best performance
among virgin LDPE carrier bags was provided by simple virgin LDPE bags
the number of reuse times decreased for the bags affected by the refer-
ence flow change. For simple virgin LDPE, recycled LDPE, biopolymer
and paper bags, the calculated number of reuse times was similar to the
previous results. Biopolymer and paper presented lower number of reuse
times across all impact categories. Organic cotton presented a havened
number of reuse times: around 80 times for climate change and more than
10000 for all impact categories.
The results of this sentivity analysis showed that the choice of reference
flow influenced heavily the carrier bag with higher impacts connected to
production and with a lower volume than expressed in the functional unit.
We have added a dedicated section on carrier bag design where we pro-
vided comments on the influence of the design of the carrier bags on the
results.
Anvendte data er hensigtsmæssige og
fornuftige
Hvad menes med polyester. Polyester dækker over
flere polymerer, bl.a. PET, så hvad menes med denne
posetype?
Corrected.
We had used a generic polyester production data from Ecoinvent. After
your comment, we verified the polymer material of the surveyed polyester
bags, which showed to be virgin PET (We have re-modelled the results for
this carrier bag type using an Ecoinvent production dataset for virgin PET
because a dataset for “polyester PET” was not available. Results have
been updated throughout the report and executive summary.
√
Uddyb beskrivelsen af biopolymer, linje 555 og frem.
Er det en komposterbar pose?
Added (now line 645)
Yes, the bag is a compostable bag. (+ design considerations on effective
compostability)
√
Vurderingsrapporten er gennemskuelig
og konsekvent
Det danske resumé har brug for en kritisk gennem-
læsning ift. sprog. F.eks. står der organisk i stedet for
We have done a full readthrough of the Danish Summary. √

The Danish Environmental Protection Agency / LCA of grocery carrier bags 131
økologisk, og ozonforstyrrelse i stedet for ozonned-
brydning.
Småting Det er svært at huske hvad scenariebetegnelserne
står for. Kunne man overveje forkortelser, der i højere
grad er forbundet til materialetype?
Changed.
Please see the new list of abbreviations for the carrier bag scenarios..
√
I resuméerne kan der i linje 120/270 stå de fire LDPE
pose typer, der er undersøgt
Added.
In the Danish and English summaries, we added a brief description of the
four LDPE carrier bags investigated.
“Low-density polyethylene (LDPE), 4 types: an LDPE carrier bag with
average characteristics, an LDPE carrier bag with soft handle, an LDPE
carrier bag with rigid handle and a recycled LDPE carrier bag.”
√
Der er forskel i tabellerne IV i de to resumé. Corrected. √
Pilen i figur I (dansk resume) fra Produktion af embal-
lage materiale er vendt forkert.
Corrected √
Linje 463 under lightweight plastic carrier bags -
skriftstørrelsen er forskellig.
Corrected. √
Table 2, linje 600, antal LDPE poser simple og rigid
handle adderer ikke til 23.
Corrected.
The numbers erroneously referred to a previous version of the Table,
where there was no distinction between virgin LDPE carrier bags (in total
23) and recycled LDPE carrier bags (in total 3).
√
Hvorfor står der “no” i table 3, linje 740 for vægt kapa-
citet for flg. LDPE recycled, rigid handle, biopolymer
og paper - de har en kapacitet på 12 kg?
Corrected.
Yes, the recycled LDPE carrier bag with rigid handle has a weight holding
capacity of 12 kg. The “No” erroneously reported was a typo.
We decided to report the reference flow for simple and rigid handle recy-
cled LDPE carrier bag in Table 3 for completeness, but in the end we
considered only a scenario with a recycled LDPE carrier bag with average
characteristics, due to the low number of recycled LDPE carrier bags
encountered in the survey, and due to the lack of data for recycled LDPE
carrier bag production.
√
Table 5, linje 816, i “Human toxicity, non-cancer ef- Corrected. √
132 The Danish Environmental Protection Agency / LCA of grocery carrier bags
fects” står der CTUh/PE/year - skal der ikke bare stå
CTUh?
The impact assessment unit was in fact CTUh, CTUh/PE/year refers to
the normalized unit, which was not used in the present study and was
erroneously reported in Table 5.
Anvend samme rækkefølge for poserne i alle tabeller. Corrected. √
Kan der komme et tal efter komma i Figure 16 i y-
aksen?
Corrected.
Now Figure 16 provides one digit after the comma.
√
Kan det i Table 15 indikeres, hvilken påvirkningskate-
gori der giver udslag i det største antal genbrug? I har
taget "den værste" kategori, men det er væsentligt for
tolkningen, at man kan se, om det er generelt
højt/lavt, eller skyldes stor spredning imellem impact
kategorierne (evt. pga. varierende datakvalitet).
Added in the text.
We added in the discussion of the results that for some carrier bags the
number of reuse times was rather homogeneous among impact catego-
ries, for other carrier bags the number of reuse times was mainly provided
by few or just one impact category (as in the case of organic cotton,
where the number of reuse times strongly depends on ozone depletion
results).
This could be related to data (in general, whether it has low quality or not),
but also to the structure of the model (for example, the resulting climate
change score from the interaction of carrier bag material production data,
input specific emissions and energy recovery). For the organic cotton bag,
the ozone depletion results were governed by cotton production data.
√
Det ville være dejligt med billeder af de forskellige
posetyper ved beskrivelserne af poserne i afsnit 2, så
man i højere grad får et indtryk af hvilke poser, der er
tale om.
Provided.
Photos have been provided in order to complement the description of the
surveyed carried bags in Section 2. (Figures 1-9). We had initially decided
not to include the photos in order not to show the brand names on the
carrier bags. The Miljøstyrelsen agrees with your request, but suggested
to provide examples of the carrier bags instead of photos of the surveyed
carrier bags, which would display the names of the retailers.
√

The Danish Environmental Protection Agency / LCA of grocery carrier bags 133
Tjekliste
Følgende skal være dækket af tredjepartsrapporten
Aspekter fra ISO 14044 Kommentarer fra COWI, første runde Svar på kommentarer fra DTU Miljø Kommentarer fra CO-
WI, anden runde
Generelle aspekter
livscyklusvurderingens opdragsgiver, udøveren af
livscyklusvurderingen
√
rapportens dato √
erklæring om, at vurderingen er udført i overens-
stemmelse med kravene i ISO 14044
√
Vurderingens formål
grundene til at foretage vurderingen √
dens påtænkte anvendelser √
målgrupperne √
erklæring om, hvorvidt vurderingen påtænkes at un-
derstøtte sammenlignende påstande, som er beregnet
til offentliggørelse
√
Vurderingens afgrænsning
funktion, herunder
erklæring om ydeevneegenskaber √
eventuel udeladelse af yderligere funktioner i sam-
menligninger
√
funktionel enhed, herunder

134 The Danish Environmental Protection Agency / LCA of grocery carrier bags
overensstemmelse med formål og afgrænsning Nej, se nedenfor
definition Der står intet omkring produktion, distribution og
affaldsbehandling.
Corrected.
The functional unit now specifies more details regarding
production, distribution and waste management. Further
details have been added in the text following the functional
unit definition.
“Carrying one time grocery shopping with an average vol-
ume of 22 litres and with an average weight of 12 kilograms
from Danish supermarkets to homes in 2017 with a (newly
purchased) carrier bag. The carrier bag is produced in Eu-
rope and distributed to Danish supermarkets. After use, it is
collected by the Danish waste management system.”
√
resultat af ydeevnemåling √
systemgrænse, herunder
udeladelser af livscyklusfaser, processer eller databe-
hov
I EoL scenarierne 1 og 3 er der i boksene der star-
ter i linje 1008 samt 1029 ikke indtegnet indsamling
- hvorfor ikke? Det er vel medtaget ikke?
Added collection box in Figures 14-16.
Yes, collection was included in the study for cardboard
packaging collection and for the collection of the carrier
bags for the different end-of-life scenarios. We have added
more details in Figures 14-16 by specifying “collection” in
the processes. We have provided the same colours as Fi-
gure 13.
√
kvantificering af energi-og materialeinput og –output Mht. anvendelse af produktion af jomfruelig LDPE til
at repræsentere den genanvendte LDPE; det ser ud
til at der er ret stor forskel for PET, hvilket må for-
modes for LDPE også. Jeg vil foreslå at lave en
følsomhedsanalyse, hvor man f.eks. anvender 25 %
mindre udledninger.
Added as sensitivity analysis.
The reduced impacts connecetd to LDPE production have
lowered the impacts for recycled LDPE carrier bags. LDPE
recycled resulted the carrier bag with the lowest associated
impacts for particulate matter, photochemical ozone for-
mation, terrestrial and freashwater eutrophication. The cal-
culated number of reuse times decreased by 1 unit.
We observed in the discussion of the sensitivity analysis
that the sensitivity performed on the reference flow provided
larger variations in the results for the calculated number of
√

The Danish Environmental Protection Agency / LCA of grocery carrier bags 135
reuse times for this type of carrier bag.
Hvorfor er der anvendt forskellig ekstern process for
produktion af LDPE til bæreposen og affaldsposen?
(s. 85)
Yes, we have used different external processes for the
production of the bags.
First of all, for LDPE carrier bags we had some data regard-
ing the production of the carrier bag, for example energy
and materials required per kg of produced carrier bag. For
the waste bin bag, we did not have such data. For this rea-
son, we decided to use the Ecoinvent dataset for the pro-
duction of LDPE packaging, which included extrusion of
LDPE and ancillary materials consumption.
Secondly, the waste bin bags surveyed for this study were
thinner and of a visible lower quality compared to the LDPE
carrier bags. The Ecoinvent process chosen for waste bin
bags production presented slightly lower overall impacts
compared to the modelled one for the production of LDPE
carrier bag. This was considered in line with the intended
use of the bag: the LDPE carrier bags are intended for mul-
tiple uses, while the waste bin bag is intended for single
use.
During the modelling phase, we performed a sensitivity
analysis and modelled the waste bin bag exactly as the
LDPE carrier bag, but according to the mass of the waste
bin bag. The environmental impacts resulted similar to the
chosen Ecoinvent process for waste bin bags.
Finally, selecting a process with slightly lower impacts for
the production of the waste bin bag allows being more con-
servative regarding the results, since lower benefits will
arise from the saving of a waste bin bag.
√
Burde produktion af komposit-posen ikke bestå af
de andre dele end jute også, PP og bomuld? I har
allerede data for disse processer, så der skal bare
en fordeling af de tre materialer til.
Yes, the composite bag was modelled as a combination of
the three materials: PP, jute and cotton. Based on the sur-
vey, we assumed 80% jute, 10% PP and 10% cotton.
This proportion was present in the description of the com-
√

136 The Danish Environmental Protection Agency / LCA of grocery carrier bags
posite bag scenario in Section 4. We added these details
also in the assumptions section.
Er der i produktion af biopolymer medtaget karbon-
lagring?
No, to our understanding the Ecoinvent dataset for the pro-
duction of starch-complexed biopolymer does not take into
account carbon storage.
We added this detail in the description of the biopolymer
carrier bag scenario, Section 4.
√
Antagelsen om, at der er det samme tab i sortering
før genanvendelse for jomfruelig LDPE og genan-
vendt LDPE i genanvendelsesprocessen kan disku-
teres (linje 1065). For genanvendt PET er tabet
højere end for ikke genanvendt LDPE (24,5% for
genanvendt PET sammenlignet med 9,7% for
LDPE). Tabet er måske i højere grad afhængigt af
hvorvidt der er tale om genanvendt eller virgint plast
og ikke polymer-afhængigt? Vi mener, at tabet for
genanvendt LDPE er sat for lavt.
We did not have actual data for recovery efficiencies and
residues occurring during recycling for recycled polymers,
we only had data for recycling of virgin polymers. Therefore,
we assumed that the efficiency was the same based on
material type (ex/ same for all LDPE types).
Of course the recovery efficiencies could be lower if the
quality of the polymer sent to recycling was lower, but we
did not have data to substantiate assumptions on lower
recovery rates and higher residues production.
In any case, even with high recovery rates and low amount
of residues produced, EOL2 resulted rarely among the pref-
erable end-of-life options.
These assumptions are now specified in Section 3.
√
Antagelse af at rest-produkter fra sortering til gen-
anvendelse af plast- og papirposer foregår i Dan-
mark – det sker ikke i dag. Bør det ikke antages, at
det sker i Tyskland eller Sverige – og dermed ikke
går til forbrænding i DK? Betyder det ikke det store,
så argumenter for det.
Specified in the text.
Yes, recycling does not occur in Denmark.
The cardboard packaging is assumed to be collcted in
Denmark, but then transported abroad (Europe) for sorting
and recycling. The same is assumed for the collection for
recycling for all the separately collected fractions, which are
transported abroad (Europe), sorted and recycled.
In both cases, residues are incinerated in an average Euro-
pean incineration process (which was modelled with Ecoin-
vent processes) and are not assumed to be incinerated in
Denmark.
√
The Danish Environmental Protection Agency / LCA of grocery carrier bags 137
The location of the recycling plat was not disclosed by the
project partners, so we assumed a general transportation
distance of 2000 km (including also southern Europe) and
used Ecoinvent processes based on Europe when possible.
antagelser vedrørende elektricitetsproduktion I valgt en fremtidig marginal for elektricitet - Er dette
korrekt når nu FU siger 2017?
Specified in the text.
Yes, the functional unit is based on carrier bags available
for purchase in Danish supermarkets in 2017. However,
since the study is assumed to support decisions that will
occur in a 10 year period, using a future marginal energy is
assumed to well represent the effects in the future waste
management system.
Moreover, this LCA study is part of a series of assessments
conducted by DTU for the Miljøstyrelsen in the end of 2017
regarding decision support for future waste management
options. All the assessments are based on the same mar-
ginal energy choices.
√
afskæringskriterier for den indledende/første medta-
gelse af input og output, herunder
beskrivelse af afskæringskriterier og antagelser √
udvælgelsens indvirkning på resultater Savner en kommentar på hvad udelukkelse af gen-
anvendelse af tekstilerne og biopolymeren betyder.
Specified in the text (line 1029-1038).
Excluding recycling for textiles and biopolymers means that
carrier bags of these materials will only be tested for EOL1
and EOL3. Considering recycling feasible would mean al-
lowing the recovery of these materials through separate
collection and re-processing, therefore lowering the impacts
connected to the production of the carrier bags. Recycling of
textiles was not taken into account since it mainly occurs
outside the Danish waste management system, for example
via charity organizations or through return schemes at re-
tailer shops. The extent of recovery of materials can be
extremely variable according to the specific collection se-
lected. Regarding biopolymer carrier bags, which are com-
√
Vi kan ikke helt følge
argumentationen for ikke
at medtage genanven-
delse af tekstiler, da
indsamlingsmetoden (at
den ikke foregår i kom-
munalt regi) ikke skulle
påvirke genanvendelsen.
Vi tænker mere, at ar-
gumentet skal være, at
der kun i ringe grad på
nuværende tidspunkt

138 The Danish Environmental Protection Agency / LCA of grocery carrier bags
postable starch-biopolymer bags, we did not include materi-
al recovery through composting, since biopolymer bags are
currently sorted out from organic waste management plants.
sker materialegenan-
vendelse af tekstiler,
men primært genbrug,
som ikke er så relevant i
denne evaluering.
medtagelse af afskæringskriterier for masse, energi
og miljø
Ikke specifikt uddybet. Corrected.
We have re-written the system boundaries section, provid-
ing a better description of the inputs and outputs.
√
Livscykluskortlægning
dataindsamlingsprocedurer √
kvalitativ og kvantitativ beskrivelse af enhedsproces-
ser
Der savnes beskrivelse af f.eks. om processerne
inkluderer biomassebegrænsning.
Specified in the text (line 1079).
Biomass was not considered a limited resource.
√
kilder til udgivet litteratur Der savnes en kilde på de 30% mindre udbytte fra
økologisk bomuldsproduktion (s. 35, linje 862)
Added.
The yield of organic cotton farming was assumed 30 %
lower than conventional cotton. For the modelling, this im-
plies that 30 % more impacts are considered for the produc-
tion of organic cotton than conventional cotton. The yield
was found to vary in the literature between 20 % and 40 %
and according to the geographical location (Forster et al.,
2013). Since the Ecoinvent dataset for cotton production is
not linked to a specific geographical location, 30 % was
considered as average value. The selected value influences
the contribution of the production process to the overall
impacts related to the organic cotton carrier bag.
√
beregningsprocedurer √
validering af data, herunder
datakvalitetsvurdering Mangler, f.eks. vurderes det ikke, hvad det betyder,
at nogle processer er globale i stedet for europæi-
Added.
In Section 3, we have provided a discussion on data re-
√

The Danish Environmental Protection Agency / LCA of grocery carrier bags 139
ske. quirements, assumptions used to provide missing data, and
critical assumptions.
In Section 5, we have provided a discussion of the results in
the light of data quality and assumptions.
Critical assumptions have been tested as sensitivity analy-
sis and discussed in Section 7.
Among other data issues, we have specifically discussed
the influence on the results of the choice of European ver-
sus global data.
behandling af manglende data √
følsomhedsanalyse til raffinering af systemgrænsen 1. "Choice of reference flow" – lidt svært at forstå
hvordan antallet af poser er beregnet. Kan det be-
skrives bedre, hvordan den nye ydeevne (antal
genstande) relateres til de anvendte ydeevner i
resten af studiet (bæreevne og volumen).
Specified in the text and in the sensitivity analysis.
The reference flow for each bag subtype in Table 3 was
calculated taking into consideration both volume and weight
holding capacity as conditions that had to be fulfilled at the
same time. This means that, for each carrier bag, if the
volume or/and the weight holding capacity were lower than
the ones specified in the functional unit, we assumed that
the customers would need to buy two bags instead of one in
order to comply for the same functionality (a grocery shop-
ping of the volume of 22 litres and/or a weight of 12 kilo-
grams). When a bag was required two times, it was mod-
elled by multiplying by two the average weight and volume
provided in Table 2. In the cases of biopolymer and paper
carrier bags, the weight holding capacity surveyed was in
average compliant with the virgin LDPE carrier bag, but
provided the highest variance between the samples. For
example, the weight that these types of bags were capable
of holding varied greatly in the tested samples, especially if
the items placed in the bags for the survey had sharp an-
gles, which tore the bags much more easily than for other
carrier bag types (Alonso Altonaga, 2017). For these rea-
sons, the weight holding capacity for the reference flow was
√

140 The Danish Environmental Protection Agency / LCA of grocery carrier bags
considered not respected, and that two bags would be re-
quired to carry the same weight.
We have decided to replace the sensitivity analysis that
used the reference flow of the UK study performed by
Edwards and Fry (2011) with a sensitivity analysis that cal-
culated the “fractions” for the carrier bags that required
rounding to two bags in order to provide for the functional
unit.
In the sensitivity analysis, we provided the formula used to
re-calculate the reference flow.
Table 17: Er værdierne for Biopolymer EOL3 kor-
rekte? De virker lave ift, hvor meget EOL1 værdier-
ne stiger.
The sensitivity analysis results presented in the previous
version of the report (old Table 17) is not present anymore.
Anyhow, the results for BP, EOL3 were correctly lower than
EOL1: this non-fossil carbon and lightweight carrier bag
provides larger advantages when used for substituting a
virgin LDPE waste bin bag.
√
3. “Different way to calculate primary reuse” (linje
1553 og frem) giver ingen mer-værdi. Det er jo bare
om man regner på antal primær genbrug eller antal
gange man bruger posen i alt. Skriv 1-2 linjer om
dette i valg af metode i stedet for.
Agree.
We have added a sentence in the section “modelling of
primary reuse”.
Edwards and Fry (2011) performed a similar assessment,
but calculating the number of reuse times simply performing
a ratio between the carrier bag alternative and the reference
carrier bag. Such calculation differs from the method adopt-
ed for the present study by providing the number of reuse
times, instead of the number of times the bag is used in total
(Eq. 2).
√
Gentager, at vi anbefaler en følsomhedsanalyse,
hvor man f.eks. anvender 25 % mindre udledninger
for produktion af jomfruelig LDPE til at repræsentere
den genanvendte LDPE.
Added. Please see point 3.3b above. √
allokeringsprincipper og –procedurer, herunder
The Danish Environmental Protection Agency / LCA of grocery carrier bags 141
dokumentation og begrundelse for allokeringsproce-
durer
Jeg kan ikke læse om der er anvendt biomassebe-
grænsning eller ej.
Added (please see above comment 4.2). √
ensartet anvendelse af allokeringsprocedurer √
Vurdering af miljøpåvirkninger i livscyklus, hvis an-
vendt
LCIA-procedurer, beregninger og resultater af vurde-
ringen
√
begrænsninger af LCIA-resultater, som vedrører livs-
cyklusvurderingens formål og afgrænsning
√
sammenhængen mellem LCIA-resultater og formål og
afgrænsning
I skriver i linje 677 at "Then, the calculated number
of reuse times based on environmental performance
was compared to the expected lifetime of the bag
and used as a basis for discussion." – Dette synes
jeg ikke, at jeg kan se af LCIA/diskussionen. Der er
ingen kvantitative levetider på poserne.
Rephrased (now line 792)
“Then, the calculated number of reuse times based on envi-
ronmental performance is intended to raise the discussion
among the stakeholders on the effective expected lifetime of
each carrier bag.”
√
sammenhæng mellem LCIA-resultaterne og LCI-
resultaterne
√
påvirkningskategorier og kategoriindikatorer under
betragtning, herunder den logiske begrundelse for, at
de er valgt, herunder antagelser og begrænsninger
√
beskrivelse af eller henvisning til alle anvendte karak-
teriseringsmodeller, karakteriseringsfaktorer og meto-
der, herunder antagelser og begrænsninger
√
beskrivelse af eller henvisning til alle anvendte værdi-
baserede valg i forhold til påvirkningskategorier, ka-
rakteriseringsmodeller, karakteriseringsfaktorer, nor-
malisering, gruppering, vægtning og, andre steder i
LCIA-en, en begrundelse af deres anvendelse og
påvirkning på resultaterne
-
en erklæring om, at LCIA-resultaterne er relative ud- Mangler Added both in the LCIA methods description and in the √
142 The Danish Environmental Protection Agency / LCA of grocery carrier bags
tryk, som ikke forudsiger påvirkninger på kategori-
end-point, eller overskridelser af tærskelværdier, sik-
kerhedsmarginer eller risikoniveauer og, når medtaget
som en del af livscyklusvurderingen (LCA), også
section providing the characterized results.
en beskrivelse af og begrundelse for definitionen og
beskrivelsen af eventuelle nye påvirkningskategorier,
kategoriindikatorer eller karakteriseringsmodeller
anvendt til LCIA'en
√
en fremstilling af og begrundelse for eventuel gruppe-
ring af påvirkningskategorierne
na
eventuelle yderligere procedurer, som omregner indi-
katorresultaterne, og en begrundelse for de valgte,
referencer, vægtningsfaktorer etc.
na
en eventuel analyse af indikatorresultaterne, fx føl-
somheds- og usikkerhedsanalyse eller anvendelse af
miljødata, herunder eventuel betydning for resultater-
ne
√
data og indikatorresultater fra før en eventuel normali-
sering, gruppering eller vægtning skal gøres tilgænge-
lige sammen med de normaliserede, grupperede eller
vægtede resultater
√
Livscyklusfortolkning
resultaterne Kan det specificeres yderligere, hvad det f.eks. er i
materialeproduktion der betyder mest for udlednin-
gerne?
Added contribution analysis for the production part for each
carrier bag type (Tables 13-21).
√
Kunne man ud fra konklusionerne om, hvor mange
gange poserne skal genanvendes for at matche
miljøeffekten for referencen, for hver posetype vur-
dere, hvorvidt dette er realistisk? Evt. med en farve-
skala (grøn=realistisk, gul=måske og rød=ikke reali-
stisk)? Som støtte til beslutningstagere. Evt. i resu-
We have decided not to do this, as it will have a part as-
sumptions on average life times. We will leave this to the
EPA in their choice on how they wish to use the report. We
have commented further on the importance to do such a
realism check.
√

The Danish Environmental Protection Agency / LCA of grocery carrier bags 143
meet.
antagelser og begrænsninger, som vedrører fortolk-
ningen af resultater, både metodik- og datarelaterede
Kan der siges noget om, hvad betyder, det at nogle
af materialeproduktionerne er globale, andre euro-
pæiske og nogle andre dele af verden?
Added.
We have added a specific paragraph on assumptions and
critical assumptions.
In particular, with respect to dataset referring to differen
geographical locations:
“In general, market and global datasets provided slightly
higher emissions than production datasets in specific geo-
graphical locations. Therefore, the carrier bags for which
only production datasets were available are likely to have
slightly lower emissions than using market datasets. Assum-
ing that the carrier bag manufacturers retrieve materials and
energy from the market, our preference was always for the
market datasets. When not available, we used production
datasets, preferably for Europe.”
√
datakvalitetsvurdering Mangelfuld Added a discussion of the results with respect to the high-
lighted data limitations and assumptions.
√
fuld gennemskuelighed, hvad angår værdibaserede
valg, logiske begrundelser og ekspertvurderinger
√
Kritisk review
navn på og tilhørsforhold for de personer, der udfører
review
Navne skal tilføjes √
redegørelse fra kritisk review √
svar på anbefalinger fra det kritisk review Kommer senere √

The Danish Environmental
Protection Agency
Haraldsgade 53
DK-2100 København Ø
www.mst.dk
Life Cycle Assessment of grocery carrier bags
Currently, Danish supermarkets provide multiple-use grocery carrier bags of different
materials (such as plastic, paper and cotton) that are designed for multiple uses. In
order to compensate the environmental impacts connected to the production of the
bags, these multiple-use carrier bags need to be reused a number of times.
This Life Cycle Assessment study examined the environmental impacts connected to
the production, distribution, use and disposal of multiple-use grocery carrier bags
available for purchase in Danish supermarkets for a range of environmental indica-
tors. The study identified which carrier bags provide the lowest impacts for their pro-
duction and which is the optimal disposal option for specific carrier bag materials.
The goal of the study was quantifying the required minimum number of reuse times
for each of the multiple-use carrier bags based on their environmental performance.