do bans on plastic grocery bags save cities money?
TRANSCRIPT

N AT I O N A L C E N T E R F O R P O L I C Y A N A LY S I S
Do Bans on Plastic Grocery Bags Save Cities Money?
Consumers choose plastic bags far more often than paper or reusable bags to carry their purchases. Consumers like the fact that compared to paper and reusable bags, plastic bags are lightweight, strong, flexible and moisture resistant. In addition, they are easy to store and reusable for multiple purposes. Despite these characteristics and their popularity, a growing number of municipalities and some states are enacting laws aimed at reducing the use of plastic (and sometimes paper) grocery bags.
Executive SummaryConsumers choose plastic bags far more often than paper or reusable bags to carry their purchases. Compared to paper and reusable bags, plastic bags are lightweight, strong, flexible and moisture resistant. In addition, they are easy to store and reusable for multiple purposes. Despite these characteristics and their popularity, a growing number of municipalities and some states are enacting laws aimed at reducing the use of plastic (and sometimes paper) grocery bags. The laws range from outright bans to taxes. Advocates have given a number of justifications for placing restrictions on consumers’ use of carry-out plastic bags. These include concerns about the scarce resources used to create the bags, environmental harms when they are disposed of improperly, the visible blight of roadside litter, and the cost of disposing or recycling them.
However, an examination of the bag bans and budgets for litter collection and waste disposal in San Francisco, San Jose, and the City and County of Los Angeles, Calif.; Washington, D.C.; and Brownsville and Austin, Texas, shows no evidence of a reduction in costs attributable to reduced use of plastic bags.
San Francisco. In 2007, San Francisco became the first city in the nation to ban common, thin-film plastic carryout bags at large grocery stores and pharmacies. In 2012, the city amended the original ban to include all retail stores and food establishments, and added a 10-cent charge on all paper and reusable bags.
Prior to the ban San Francisco City Supervisor Ross Mirkarimi estimated that bag disposal and lost revenue cost the city and the private waste disposal and recycling contractor at least 17 cents per bag, or $8.49 million annually. However, his estimate lumps paper and plastic bags together, whereas the vast majority of collection and disposal costs are due to paper bags. Plastic bags amount to less than 0.5 percent of the waste stream, and a similarly miniscule amount of landfill space. Paper bags are six times heavier and take up 10 times more space than
Policy Report No. 353 by H. Sterling Burnett December 2013
Dallas Headquarters: 12770 Coit Road, Suite 800
Dallas, TX 75251972.386.6272
www.ncpa.org
Washington Office: 601 Pennsylvania Avenue NW,
Suite 900, South BuildingWashington, DC 20004
202.220.3082
ISBN #1-56808-233-9www.ncpa.org/pub/st353

Do Bans on Plastic Grocery Bags Save Cities Money?
2
plastic bags. Thus, plastic bags should be responsible for no more than $900,000 of San Francisco’s annual collection and disposal costs, and $300,000 of the landfill liability.
In addition, in contrast to the state and local studies cited by the city supervisor’s office, a nationwide study found that plastic bags make up only 0.6 percent of litter; thus, the cost of clearing plastic bags in San Francisco should be less than $1.3 million.
San Jose. In 2011, San Jose, Calif., became the largest city at that time to adopt a ban, approving one of the strictest bag bans in the nation, effective January 2012. San Jose banned plastic bags from both large and small retailers, excepting only restaurants, nonprofits, social organizations and retailers that use plastic or paper bags for such things as fresh produce, meat or bulk goods. Though some argued the bag ban would save the city money by reducing litter collection costs, environmental arguments dominated the debate, there was no explicit estimate of the expected savings, and data on the ban is still relatively incomplete.
However, the city council adopted budgets that increased spending from about $95.5 million for the 2009-2010 budget year to $110.4 million in 2012-2013 (the ban’s first year), a 15.6 percent rise. The proposed budget for 2013-2014 is $105.3 million, a 4.6 percent decline, but still considerably higher than before the ban.
County and City of Los Angeles, California. A November 2010 Los Angeles County, Calif., ordinance outlawed retail use of thin-film polyethylene bags. Los Angeles County faced significant spending cuts during the 2010-2011 and 2011-2012 budget years of more than $175 million and $35 million, respectively. Budget cuts did not extend to solid waste collection or disposal. Spending for solid waste rose 30.17 percent from the budget year 2006-2007 to 2011-2012, and projected spending rose 5.9 percent from 2011-2012 to the adopted budget for 2012-2013.
In June 2013, the City of Los Angeles followed suit by approving an ordinance banning plastic bags, effective January 2014 for large stores and July 2014 for smaller stores. The law requires customers to either use their own reusable bags or pay 10 cents per paper bag.
Brownsville, Texas. On December 15, 2009, one of the poorest cities in Texas became the first city to place restrictions on plastic carry out bags. Since January 5, 2011, most retailers have been prohibited from providing free plastic bags (or paper bags below a certain weight and without handles), and may only offer reusable bags. However, there are a number of exceptions and any retailer could continue to provide plastic bags if they collect a surcharge of $1.00 per transaction from consumers and remit it to the city.
The revenue generated by the program has exceeded its expenses, including spending for litter control programs, by more than $1 million. Subsequently, the city decided that it will keep the fee, rather than ban the bags altogether. Brownsville evidently realized plastic bags are a source of income to be encouraged rather than a cost to be avoided.
Brownsville’s overall solid waste expenditures rose 90.72 percent from 2004 to 2012. Despite the bag fee, Brownsville’s solid waste revenues and expenses have risen in both of the first two years of the ban. Brownsville’s garbage collection fees and waste disposal expenses have seen extreme swings, with a general upward trend but no discernible pattern.
Washington, D.C. In June 2009, the Washington, D.C., city council passed Bill 18-150, the Anacostia River Clean-Up and Protection Act of 2009. Commonly known as the “Bag Tax,” the law imposed a 5-cent tax on paper and plastic grocery bags, which took effect on January 1, 2010. The main impetus for the bill was to reduce the amount of litter in the Anacostia River and its tributaries. The tax applied to both paper and plastic bags, which still had to be 100 percent recyclable. Unrecyclable single-use bags were banned outright and the law specified what counted as recyclable, so as to rule out common single-use plastic bags.
Washington claimed that plastic bag use had declined by 80 percent, but an independent analysis indicated the likely decline was closer to 67 percent. However, for the first two years of the program, 60 percent and 52 percent, respectively, of establishments inspected by the district did not comply with the ordinance. As a result, if only 40 percent to 48 percent of the regulated establishments actually charge the tax, it is unlikely Washington’s plastic bag use has declined by the amount claimed.
3
Spending on public space cleaning increased dramatically in 2010 (the first year of the tax), but it declined 33 percent in 2011. There was a more modest decline in costs for solid waste collection and removal, and sanitation disposal. However the data indicates the reductions stem almost entirely from substantial federal and local budget cuts.
Austin, Texas. The city of Austin, Texas, estimated that residents use approximately 263 million plastic bags per year, costing the city approximately $850,000 annually in litter control. This figure makes the costs of litter control of plastic bags just 3.2 cents per bag, considerably less than San Francisco’s estimate of 5.2 cents per bag, and a small part of Austin’s overall waste disposal and recycling costs.
In the cities that have adopted bag bans, fees or taxes, there is little evidence so far that banning or taxing plastic bags will reduce waste disposal costs and save money. Those who make this claim must provide evidence to back it up, but they have rarely attempted to do so, and when they have, the evidence has proven questionable at best.
About the AuthorH. Sterling Burnett is a senior fellow with the National Center for Policy Analysis. While he works on a number of issues, he specializes in issues involving environmental and energy policy. He also serves as an adviser to the American Legislative Exchange Council Energy, Environment, Natural Resources and Agriculture Task Force (1996 - Present); a senior fellow with the Texas Public Policy Foundation (2005 - Present); and a contributing editor to Environment & Climate News (2005 – Present). Dr. Burnett has been published in Ethics, Environmental Ethics, Environmental Values, The Re-view of Metaphysics, International Studies in Philosophy, The World and I, USA Today and the Washington Post. Dr. Burnett received a Ph.D. in Applied Philosophy from Bowling Green State University in 2001.

Do Bans on Plastic Grocery Bags Save Cities Money?
4
IntroductionConsumers choose plastic bags far more often than paper or reusable bags to carry their purchases. Consumers like the fact that compared to paper and reusable bags, plastic bags are lightweight, strong, flexible and moisture resistant. In addition, they are easy to store and reusable for multiple purposes.
Despite these characteristics and their popularity, a growing number of municipalities and some states are enacting laws aimed at reducing the use of plastic (and sometimes paper) grocery bags. The laws range from outright bans to taxes. In 2007, San Francisco became the first city in the nation to ban common, thin-film plastic carryout bags at large grocery stores and pharmacies. In 2010, Washington, D.C., became the first city in the United States to impose a tax (5 cents per bag) on plastic and paper bags.
Advocates use various arguments to justify restrictions on the use of plastic bags. Environmentalists argue plastic bags are bad for the environment, while city leaders argue the bags result in excessive litter, take up too much landfill space and are difficult to recycle. Every type of grocery bag incurs environmental costs, but the evidence shows that in terms of energy use, greenhouse gas emissions, water use and various toxic inputs and emissions, paper and reusable bags are worse for the environment than plastic bags.1 Some believe plastic bags are a highly visible aesthetic challenge, and problematic for wildlife, especially in the ocean. However,
plastic grocery bags make up just 0.6 percent of all litter.2 In addition, the U.S. Environmental Protection Agency (EPA) has found that plastic bags account for less than 0.5 percent of the entire waste stream, and are completely recyclable.3
Proponents of plastic grocery bag bans argue that banning plastic bags saves cities money by reducing litter, solid waste disposal and recycling costs. And in tight fiscal times, when municipal budgets are strained, the argument is compelling. This paper will show that there is no evidence plastic bag restrictions reduce litter, solid waste disposal and recycling costs. Because proponents are the ones advocating restrictions on the freedom of choice of businesses and consumers for the public good, they should provide evidence to support their claims.
The six cities that have enacted restrictions on plastic grocery bags include three from California (where the anti-plastic bag movement began), and three cities outside of California. The study analyzes public solid waste and recycling data for these cities both before and after the bans to determine if restrictions have reduced costs. Because legislators have only recently attempted to limit plastic bag use, data is sparse and in some cases unavailable. Still, absent evidence that bans or taxes produce savings, the argument for banning grocery bag use fails.
California versus Plastic Bags: Let the Ban BeginThree California cities and
the County of Los Angeles have imposed fees or outright bans on plastic bags.
San Francisco. In 2007, San Francisco became the first city to restrict plastic grocery bags. The city’s ordinance initially applied only to large supermarkets — stores with gross annual sales of $2 million or more — and retail pharmacies with five or more locations under the same ownership. The stores covered by the ordinance were only allowed to provide compostable plastic bags, recyclable paper bags and reusable bags of any material.
In 2012, the city amended the original ban to include all retail stores and food establishments, and added a 10-cent charge on all compliant (paper and reusable) bags.
San Francisco’s bag ban efforts actually began in January 2005, when the subject of plastic bag restrictions was first broached. City and county officials had adopted the goal of diverting 75 percent of waste from landfills by 2010 and having zero waste by 2020. Claiming that plastic bags were an impediment to that goal, the city’s mayor and Board of Supervisors passed a resolution requesting city staff to draft an ordinance imposing a fee on supermarket check-out bags, before conducting any research to support their assertions. Less than a month later, city leaders instructed the Department of Environment to conduct a study to determine the costs of disposable

5
shopping bags and the legality of imposing a fee on their use.
No results were ever released, however, and there is no evidence such a study was ever completed, or even begun. But the lack of hard data did not stop City Supervisor Ross Mirkarimi from claiming that a 17-cent charge for plastic bags was reasonable. Mirkarimi’s office later released an unsubstantiated calculation of the cost of plastic bag use to the city and Norcal (now Recology), the private contractor that disposes the city’s solid waste and operates its recycling program. The combined estimate was at least 17 cents per bag in disposal costs and lost revenue. According to a breakdown of costs on a “fact” sheet provided by Mirkarimi:4
1. Norcal Recycling Contamination Costs. Norcal employs 12 waste classifiers at a cost of $494,000 annually to remove bag contamination from recycling equipment and machinery; spends $100,000 annually to clear machinery jams caused by bags; and loses $100,000 annually to reduced sales of recyclable materials due to bag contamination. The total is $694,000 annually, or 1.4 cents per bag.
2. Norcal Composting Contamination Costs. Removing plastic, picking up litter and reduced revenue on the sale of compostable materials due to bag contamination totals $400,000 annually, about 0.8 cents per bag.
3. Collection and Disposal Costs. Based on the $180 million cost for annual
collection and disposal of all of San Francisco’s waste, and the estimate that 2 percent of the waste stream is comprised of paper and plastic bags, the annual cost for collection and disposal of bags alone totals $3.6 million, or 7.2 cents per bag.
4. City Street Cleaning Costs. Cleaning San Francisco’s streets costs $26 million annually, including both mechanical and manual collection of litter. Some 10 percent of litter collection costs are for bag collection and transportation, amounting to
$2.6 million annually, or 5.2 cents per bag.
5. City Future Landfill Liability Costs, Including Post-Closure. Future liability costs will total $1.2 million annually, based on an analysis of potential remediation and processing costs of $85.50 a ton, or 2.4 cents per bag.
Several questionable assumptions underlie Mirkarimi’s $8.49 million total. First, the collection and disposal costs lump paper and plastic bags together; however, the vast majority of that cost is due to paper bags, with plastic bags amounting to less than 0.5 percent of the waste stream, and a similarly
miniscule amount of landfill space.5 Thus, plastic bags should be responsible for no more than $900,000 of San Francisco’s annual collection and disposal costs, and $300,000 of the landfill liability. This is a reasonable calculation because paper bags are six times heavier and take up 10 times more space than plastic bags.6 In addition, in contrast to the state and local studies cited by the city supervisor’s office, a nationwide study found that plastic bags and wrappings of all types make up only 5 percent of litter, however, a breakdown of those numbers shows that plastic grocery bags make up less than 0.6 percent of litter; thus, the cost of clearing plastic bags from San Francisco’s streets, alleys and parks should be less than $1.3 million.7 If the cost figures from Norcal are correct, plastic bags should have cost the city less than 7.9 cents per bag, not 17 cents — a considerable difference.
Even the 7.9 cents figure is suspect, because it assumes that each plastic bag is used only once, thrown away and ends up in the waste stream. However, plastic bags are rarely used only once. People find a variety of ways to reuse them long after unloading their groceries at home. They may line bathroom trash bins, collect dog waste and used cat litter, secure soiled diapers and more. Other uses include carrying donation items to charities, transporting dry cleaning, and storing items in garages, closets and attics.8 In addition, major grocery chains in San Francisco had already implemented plastic bag recycling programs. Recycling rates were low, less than 10 percent, but it does mean a portion of the bags never
Insert callout here.“Plastic bags are less than 0.5 percent of the
waste stream.”

Do Bans on Plastic Grocery Bags Save Cities Money?
6
impacted San Francisco’s budget.Finally, Norcal/Recology likely
overstates the number of times that plastic grocery bags clog recycling machinery and thus the costs of clearing machinery due to plastic bag contamination. A presentation to the Association of Oregon Recyclers found that thin film plastic materials as a whole were only 18 percent of the unwanted material clogging up machinery, and plastic retail bags were responsible for only a fraction of the this problem. Thus, most of the labor costs associated with cleaning the machines would remain even if plastic retail bags were banned.9 Similarly, a report conducted by the Solid Waste Agency of Lake County, in Lake County, Il., found that plastic bags were only a small part of the materials entering recycling machines.10
Whether the cost of plastic bags to the city is $3.5 million or the $8.49 million calculated by Mirkarimi’s office, all else equal, the implementation of the 2007 ban should have somewhat decreased costs for solid waste recovery, disposal and recycling. Yet the available data do not reveal such savings.
Under the 1932 Refuse Collection and Disposal Initiative Ordinance, the City and County of San Francisco sets residential refuse (garbage) rates. San Francisco currently employs Recology to perform disposal and recycling. As a private company, Recology is not required to file annual reports. Because the city budget does not include a line item or description of solid waste pick up and disposal spending, one can’t discern costs directly from the city; therefore,
this study analyzes the residential rates set by the city and paid to Recology. The rates vary for odd-sized containers, commercial or multi-residential buildings, and trend lower for households with income of less than or equal to 150 percent of poverty level. The single household rate for three 32-gallon cans (trash, composting, recycling) has steadily increased since the ban took effect [see Figure I].11
San Francisco’s population has grown since 2005, but inflation has been low and the city experienced a
number of budget cuts and staff reductions. Nevertheless, household garbage rates increased, despite the city’s claim that the overall amount of garbage collected would decrease due to the bag ban. Indeed, from 2005-2013, as San Francisco’s population grew 5.08 percent, garbage and recycling rates rose more than 78.6 percent.
Based on the available data, there is no evidence that the plastic bag ban has saved the city or its contractor money.
San Jose, California. In 2007, San Jose city councilman Kansen Chu proposed banning thin-film plastic bags in the city. Three years later, on December 14, 2010, the San Jose city council approved one of the strictest bag bans in the nation, making it the largest city at that time to adopt a ban. San
2005 2006 2010 2012 2013
$19.08 $22.29
$27.55 $27.91
$34.08
Single-Family Household Rate for 32 Gallon Cans Since Plastic Bag Ban
Source: City and County of San Francisco Department of Public Works, “San Francisco Sets New Refuse Rates,” June 27, 2006, available at http://sfdpw.org/index/aspx?page=785; City and County of San Francisco Department of Public Works, “Uniform Residential Rates,” undated, available at http://sfdpw.org/Modules/ShowDocument.aspx?documentid=335; City and County of San Francisco Department of Public Works, “Rate Board Approves New Garbage Rates,” July 31, 2013, available at
Figure I
7
Jose banned plastic bags from both large and small retailers, excepting only restaurants, nonprofits, social organizations and retailers that use plastic or paper bags for such things as fresh produce, meat or bulk goods. The regulations allowed stores to provide paper bags made of 40 percent post-consumer recycled material, but also required them to charge a minimum fee of 10 cents per bag, which will increase to 25 cents in 2014.
Giving retailers time to adjust, the ban took effect in January 2012. For the first two years of the program, affected stores were allowed to provide free, approved paper bags to customers purchasing food using food stamps (SNAP, or Supplemental Nutrition Assistance Program) or WIC benefits (Special Supplemental Nutrition Program for Women, Infants, and Children).12
Though some argued the bag ban would save the city money by reducing litter collection costs, environmental arguments dominated the debate, and no explicit estimate of the expected savings was given. Still, since San Jose is larger than San Francisco, all else equal — unless San Franciscans are unusually wasteful, the savings to San Jose should be larger. But the city budget reveals no savings.
Data for the ban is still relatively incomplete. The city council adopted budgets that increased spending from about $95.5 million in fiscal year (FY) 2009-2010 to $110.4 million in FY 2012-2013 (the ban’s first year), a 15.6 percent rise. The proposed budget for FY 2013-2014 is $105.3 million, a 4.6 percent decline, but still
considerably higher than before the ban. In each year examined, the actual budget adopted for garbage and recycling services has been less than the amount proposed.13
San Jose officials stated that the $6 million increase in expenditures for 2011-2012 is associated with increased contract costs for vehicle maintenance and replacement, labor and the cost of diesel fuel. The City’s agreements with the residential garbage contractors require that the City adjust contractor compensation annually to cover increases or decreases in these costs based on annual changes in the Consumer Price Index.
In 2011, San Jose recommended annual increases of up to 9 percent for single family and multifamily dwellings for each year from 2011 through 2013. At the same time, the cost of litter control, including streets and storm sewers, was expected to rise nearly 6 percent.14
Why are garbage, recycling and litter control rates all expected to continue rising even after all vehicles have been replaced and diesel fuel prices have leveled off? Costs are going up, while in theory solid waste and litter should be declining. In short, there is no evidence that the ban on plastic bags and the charge for paper bags have saved the city money.
Los Angeles County, then City. A November 2010 Los Angeles county ordinance outlawed retailers’ use of thin-film polyethylene bags. The bag ban was implemented in unincorporated areas (outside city limits) of Los Angeles County in two stages. At first, the bag ban applied to large stores — with gross
annual sales of at least $2 million or 10,000 square feet of retail space. The second stage of the ban included stores with gross annual sales of less than $2 million or less than 10,000 square feet of retail space. This phase included small grocery stores, drug stores and convenience stores.
Other details of the law require covered stores to:
■ Cease providing customers plastic carryout bags (produce bags or product bags are exempt).
■ Make paper carryout bags or reusable carryout bags available to customers.
■ Charge customers using recyclable paper carryout bags 10 cents per bag. (No reimbursement is allowed and the monies collected remain with the store.)
■ Provide at the point of sale, free of charge, either reusable bags or recyclable paper carryout bags or both (at the store’s option), to any customer participating in either WIC or CalFresh/SNAP.
■ Indicate the number of recyclable paper carryout bags provided and the total amount charged for the bags on customer receipts.
■ Complete and submit Bag Ordinance Store Quarterly Reports no later than 30 days after the end of each quarter.
In June 2013, the City of Los Angeles followed the county’s lead by approving an ordinance banning plastic bags citywide, effective January 2014 for large stores and July 2014 for smaller stores. The law requires customers to either use

Do Bans on Plastic Grocery Bags Save Cities Money?
8
their own reusable bags or pay 10 cents per paper bag at the store.15
Los Angeles County faced significant budget cuts in 2010-11 and 2011-12 of more than $175 million and $35 million, respectively.16 Budget cuts did not extend to solid waste collection or disposal. Los Angeles County accounts for its solid waste revenues and expenses across a number of different categories. Spending for solid waste rose 30.17 percent from the budget year 2006-07 to 2011-12, and projected spending rose 5.9 percent from 2011-12 to the adopted budget for 2012-13.
It should be noted that each year the county had to adjust actual budget expenditures upward by more than $1million, with the adjustments topping out at $15 million in 2010-11. The rise in
requested spending for 2012-13 is approximately the same as the average rise in costs over the entire six-year period — in other words, if savings exist from L.A. County’s plastic bag ban, they have not been reflected in spending on the combined solid waste budgets.
A separate solid waste disposal budget item for services and supply reveals:
■ The Solid Waste Management Fund’s services and supplies spending increased 2.45 percent, 3.19 percent and 0.22 percent for 2006-07, 2007-08 and 2008-09, respectively.
■ But in 2009-10 to 2010-11, spending increased 10.39 percent — though the ban became effective July 1, 2011.
■ In 2011-12, the first full year of the ban, there was a decline in expenditures; however, the city refuses to state officially that
the decrease is due to the bag ban. Despite the lower expenditure for 2011-12, the budget is still higher any other previous year, with the increase well above its recent low rate of rise [see Figure II].
Beyond California
California pioneered bag bans and fees, but they have been adopted by cities in
other states. Brownsville, Texas. On
December 15, 2009, one of the poorest cities in Texas became the first in the state to restrict plastic carryout bag use. Compared to restrictions in other municipalities, Brownsville’s are less coercive. Beginning in 2010, the city imposed a voluntary ban on plastic shopping bags in preparation for a mandatory ban beginning January 5, 2011. Since then, most business establishments have been prohibited from providing plastic bags (or paper bags below a certain weight and without handles), and may only offer reusable bags. While the ban sounds stringent, there are a number of exemptions:
■ paper bags at convenience stores;
■ paper bags at restaurants;
2006-07 2007-08 2008-09 2009-10 2010-11 2011-12
$19.97 $20.46
$21.11 $21.15
$23.35
$22.19
Source: Los Angeles County budgets from 2006-2007 to 2011-2012.
Los Angeles County Services & Supplies Expenditures (millions of dollars)
Figure II
Budget Year

9
■ prescription and medical supply bags;
■ paper bags for carryout beverages or liquor sales;
■ plastic garment or laundry bags;
■ plastic bags provided for food safety;
■ plastic bags provided by veterinarians and pharmacies;
■ plastic bags provided in exchange for a surcharge of $1.00 per transaction.
While the ban seems quite broad, applying to retailers as well as grocers, the last exemption is key. It allows consumers who prefer thin-film plastic bags to simply pay a fee of $1.00 per transaction regardless of how many bags are needed. Ninety-five percent of the fees collected by retailers are remitted to the city, while the store keeps the remaining 5 percent.
In a New York Times story, Brownsville Mayor Pat Ahumada boasted that since the ordinance took effect, the ban had reduced the plastic bag use by 350,000 units per day. But the claim seems highly unlikely, because it would mean that this city of only 180,000 people decreased its use of plastic bags by more than 127 million bags annually. Because plastic grocery bag use is still high, one wonders
how many plastic bags Brownsville residents used before the ban, as the number reduced is three times the number of total plastic bags that San Francisco, a city of 825,000 — more than 4 times the population of Brownsville — estimated their residents used before the ban.
The environmental fee is slated to finance city environmental programs, including recycling and cleanup initiatives. As of August 2013, Brownsville had collected more than $1.9 million dollars in “Bring your own bag” fees. The revenue generated by the program has exceeded its expenses, including fees dispersed for litter control programs, by more than $1 million. Subsequently, the city decided that it will not phase out the fee and eventually ban plastic bags. Instead, Brownsville realized plastic bags are a source of income to be encouraged rather than a cost to be
avoided. While the fees proved to be a
source of revenue, Brownsville’s garbage collection fees and waste disposal expenses have seen extreme swings, with a general upward trend but no discernible pattern [see Figure III]. However, Brownsville’s overall solid waste expenditures rose 90.72 percent from 2004 to 2012. Despite the bag fee, Brownsville’s solid waste revenues and expenses have risen in both of the first two years of the ban.
Brownsville’s experience provides no convincing evidence that the plastic bag restrictions have reduced waste disposal costs; but the associated fees have increased the city’s income. Thus, plastic bag use seems likely to continue.
Washington, D.C. In June
2004 2005 2006 2007 2008 2009 2010 2011 2012 2013
$2.05
$2.89 $3.09
$2.83
$3.40 $3.15
$3.42 $3.52 $3.92
$3.17
Brownsville Waste Disposal Expenses (millions of dollars)
Figure III
Source: Brownsville "Fiscal Year 2013 Annual Budget."

Do Bans on Plastic Grocery Bags Save Cities Money?
10
2009, the Washington city council passed Bill 18-150, “The Anacostia River Clean-Up and Protection Act of 2009.” Commonly known as the “Bag Tax,” the law imposed a 5-cent tax on paper and plastic grocery bags, which took effect January 1, 2010.17 As the title of the ordinance indicates, the main impetus for the bill was to reduce the amount of litter in the Anacostia River and its tributaries.
As mentioned, the tax applies to both paper and plastic bags, which still have to be 100 percent recyclable. Unrecyclable single-use bags are banned outright — with specifications spelling out what counted as recyclable, so as to rule out common single-use plastic bags. Approved disposable plastic carryout bags are made of high-density polyethylene film marked with the Society of Plastics Industry resin identification code 2, or low-density polyethylene film marked with the SPI code 4. A disposable carryout bag must meet the requirements of this section, even if the bag is biodegradable or compostable — for instance, thin film plastic bags made of corn starch.
The tax applies to any bags sold at any retail establishment requiring:18
■ a “Public Health: Food Establishment Retail” endorsement to a basic business license D.C. Official Code § 47-2827; and
■ any business required to have an off-premises retailer’s license, class A or B, pursuant to D.C. Official Code § 25-112.
■ Such retail establishments include, but are not limited
to, the following types of businesses: bakeries; delicatessens; grocery stores; convenience stores that sell food; restaurants; food vendors; street vendors that sell food; liquor stores; and any business that sells food items, whether or not the principal purpose of the business is to sell food items, including a department store or electronics store that has a “Public Health: Food Establishment Retail” endorsement to its basic business license.
The range of the businesses covered by this tax was quite comprehensive from the outset;
nevertheless, as with other cities, there were exemptions for certain plastic bags, including: 19
■ Bags used inside stores to package bulk items, such as fruit, vegetables, nuts, grains or candy;
■ Bags used to contain or wrap frozen foods, meat or fish, whether or not the items are prepackaged;
■ Bags used to contain or wrap flowers, potted plants or other items where dampness may be a problem;
■ Bags used to contain unwrapped prepared foods or bakery goods;
■ Bags used by a pharmacist to contain prescription drugs;
■ A newspaper bag, door-hanger bag, laundry-dry cleaning bag or bags sold in a package intended for use as garbage, pet waste or yard waste bags;
■ A bag provided to a customer by the retail establishment for the purpose of transporting a partially consumed bottle of wine;
■ A paper carryout bag provided to a customer to take food away from a restaurant with seating; and,
■ A reusable carryout bag.Approved bags are required to
display such language as “Please Recycle This Bag,” with specific rules about the size of the imprinted letters. Grocery receipts must contain a line item for the bag tax, if approved bags are used. Four cents of each bag fee goes to the Anacostia River Cleanup and Protection Fund, with businesses keeping the remaining one cent.
As mentioned earlier, the prime motive for the tax was to reduce waste in the Anacostia River. The 8.7-mile river runs from Prince George’s County in Maryland to the Potomac River in D.C. Before the tax, district officials estimated about 20,000 tons of trash enter the river each year. Plastic bags make up half of the debris — though it is not clear whether this figure is the sheer number of items collected or its their weight.20
So far, the fund has paid for river restoration, trash traps that catch debris before it hits the Anacostia, anti-litter education for students and the community, and the River
Insert callout here.
“Brownsville, Texas, imposed a fee;
Washington, D.C., imposed a tax.”

11
Smart Homes project, which offers incentives for D.C. residents to remove storm water pollution from their properties.
Whether the bag tax has significantly reduced the shoppers’ use of plastic bags is an open question. Anecdotally, those involved with cleanup efforts indicate they are seeing a considerable decline in the number of plastic bags, but there is no official count of the weight or volume of trash still being retrieved from the river. The fund has generated $5 million thus far; less than half what city officials expected. But officials have used the shortfall as evidence that plastic bag use has declined. Furthermore, despite the less than expected revenue, the D.C. Office of Chief Financial Officer (OCFO) estimates bag use has declined 80 percent.
There are a number of indications that this figure is far too high. Since the city assumed 100 percent compliance, if there was an 80 percent decline in use, one would expect the fees collected would be even lower than $5 million. The fact that the fees collected are only half what was expected indicates more bags are being used.
In addition, the assumption of 100 percent compliance is suspect in theory. For instance, an independent analysis of the bag tax indicated that, in the first year, bag use declined approximately 67 percent (not the 80 percent claimed) and that there will be a rebound effect after people adjust to the tax, with a projected 57 percent increase in bag use by 2016. Thus, overall bag use per capita will decline less than 50 percent.21
The OCFO’s claims ignore evidence that bag bans and taxes cause some consumers to shift their shopping to nearby areas that don’t have the tax to benefit from the convenience of plastic bags. Washington is a commuter city. Commuters who might otherwise buy goods on their lunch hour or on their way home may shift their shopping to establishments not bound by the tax.22 Indeed, the Beacon Hill Institute estimated that in the first nine months alone the city lost more than 100 jobs and $5.6 million dollars in real disposable income and in lower tax collections in other budget areas.
There was some early confusion
concerning which kinds of bags were to be taxed and which establishments had to collect the tax.23 Based upon available data, however, Beacon Hill’s initial estimate of a 67 percent decline in bag use is very unlikely. For instance, the District Department of the Environment conducted inspections in 2011 and 2012. Whether due to confusion about the law, simple indifference, or willful refusal to obey the law and collect the tax, a considerable number of regulated establishments did not, in fact, charge customers for the bags they used.
For instance, in Fiscal Year 2011 DDOE Staff conducted 325 inspections and issued 188 Notices of Violation and 13 Notices of Infraction. The inspections were randomly conducted by the DDOE Director, who posed as a shopper. After buying an item from the store, the Director checked the receipt to learn if she was charged for the plastic bag. If the Director was not charged, the store was issued a Notice of Violation. NOVs are written warnings to stores, reminding them to collect the bag fee. If, after the initial warning, the store fails to charge bag fees, the Director issues a Notice of Infraction, with fines ranging from $100 for the first infraction to $500 each for the third and subsequent infractions.
Thus, for the first two years of the program, 60 percent and 52 percent, respectively, of the inspected establishments did not comply with the ordinance. If only 40 percent to 48 percent of the regulated establishments actually charge the tax, it is unlikely Washington’s plastic bag use has declined 80 percent, or even 67 percent.
While there is no good accounting of the overall waste reduction in the Anacostia River due to the bag fee ordinance, data does exist for the District’s Sanitation Services. Washington, D.C., has seen a dramatic decline in its solid waste management budget since 2009. Spending on public space cleaning increased dramatically in 2010 (the first year of the tax), but it declined 33 percent in 2011. There was a more modest decline in costs for solid waste collection and removal, and sanitation disposal.
Insert callout here.
“Spending on sanitation services in Washington declined due to budget
cuts.”

Do Bans on Plastic Grocery Bags Save Cities Money?
12
However, none of this data indicates any of these reductions came from decreased plastic bag use or less need for waste collection. Rather, the reductions seem to stem almost entirely from federal and local budget cuts. Full-time equivalent employees in the entire Sanitation Services Department declined from 1,865 in 2008 to just 404 in 2011.
According to the D.C. Department of Public Works, “Funding for services that help keep the city clean, like the enforcement of sanitation laws, trash pickup, and public space cleaning, was reduced by nearly one-third in the period between 2008 and 2011. The FY 2012 budget proposes further cuts of $4 million.”24 For instance [see Figure IV]:
■ Cuts to sanitation services resulted in the loss of over 100
full-time positions since 2008. The FY 2012 budget proposed eliminating another 100 full-time positions, raising the total to 200 full-time positions eliminated since 2008.
■ Between 2008 and 2011, funds for sanitation collections and removal (trash pickup) were cut about $7 million, or 25 percent. The FY 2012 budget proposed an additional $1 million cut to funds for trash pickup.
D.C.’s problems have persisted since 2012. The District has lost more than 8,900 federal workers in the past 20 months.
Since the District depends upon the federal government for most of its employment, and must receive federal approval for its budget, the recent shutdown and sequester
have had a disproportionate impact on its finances.25
Austin, Texas. When arguing for the plastic bag ban in Austin, Texas, city officials used strong words. Some deemed plastic bags blowing about on the streets as litter, some called them a blight, and others called them a scourge. The city estimated Austinites use approximately 263 million plastic bags per year, costing the city approximately $850,000 annually for litter control.26 But this figure makes the costs of litter control of plastic bags just 3.2 cents per bag, considerably less than San Francisco’s estimate of 5.2 cents per bag, and a small part Austin’s overall waste disposal and recycling
costs. Nevertheless, the Austin City Council considers a penny saved a penny earned. Thus, in March 2012, the city council adopted an ordinance banning most single-use bags (plastic and paper). Despite the fact that single-use plastic bags are entirely recyclable, the ordinance specified that:
■ Reusable carryout bags must be constructed of cloth or other washable fabric or durable material woven or non-woven;
■ Recyclable plastic must be greater than 4 mil (0.004 inch) in thickness; or,
■ Recyclable paper must have a minimum of 40 percent recycled content on March 1, 2013, and a minimum of 80 percent recycled content by March 1, 2014.
Fiscal Year 2008 Fiscal Year 2012
$25.92
$18.12
Source: DC Fiscal Policy Institute.
Funding for Sanitation Collections and Removal, 2008-2012
(millions of dollars)
Figure IV
13
■ Reusable carryout bags must display language describing the bag’s ability to be reused and recycled.
■ Businesses must prominently display signs regarding the bags in English and Spanish.
Single-use bags exempted from this ordinance include laundry bags; door hangers; newspaper bags; garbage bags; pet waste bags; yard waste bags; prescription and medical supply bags (if recyclable under Austin’s residential recycling program); recyclable paper bags at restaurants (if recyclable); single-use plastic bags at restaurants for moisture control; bulk food bags; plastic wraps; moisture barriers; and bags used by nonprofits or charity to distribute items.27
The ban took effect March 1, 2013, one year after adoption. In the year from the ordinance’s adoption to its full implementation, Austin spent $850,000 on a bag-ban public education campaign — the same amount the city estimated it spent on litter control.
Other than litter control, Austin provided no independent estimate of the annual cost of plastic bags to the city or the savings from banning them.28 Accordingly, this study examines available budget estimates to determine whether the city projects lower solid waste and litter collection and disposal costs — or at least a lower rate of growth — after the ban than before.
Austin’s solid waste budget account is called the “Austin Resource Recovery Fund.” Including all items related to waste disposal and recycling — insurance, worker’s compensation and other
nonwaste recovery or recycling accounts — Austin’s resource recovery costs rose 28.21 percent from 2009-10 to 2012-2013.29 This is despite the fact that the approved budget for FY 2013 included no money for the cost of enforcing the ban, such as inspections by code compliance officers.
Eliminating funds for enforcement seems unrealistic, especially because the bag ban is clearly an additional compliance responsibility. More than $9 million was budgeted for code compliance for 2011-2012. The zeroing out of the compliance budget is reflected
in the proposed 2012-13 budget, though the overall budget would decline only $5 million. Thus, other line items increased at least $4 million. And the approved budget for 2013-2014 will rise an additional $4 million from the 2012-2013 budget year.
Looking only at budget items related to actual waste collection, recycling and disposal, the projected increase from 2009-10 to 2013-14 is 32.86 percent, and the costs associated with actual waste collection and disposal rise each year. Based on the relevant data, there is no indication Austin will save any money due to its single-use plastic bag ban.
ConclusionAdvocates have given a number
of justifications for restricting consumers’ use of carryout plastic bags. These include concerns about the scarce resources used to create the bags, the environmental harms that can result when they are improperly disposed of, the visible blight they cause when they wind up as roadside litter, and the cost of disposing or recycling them.
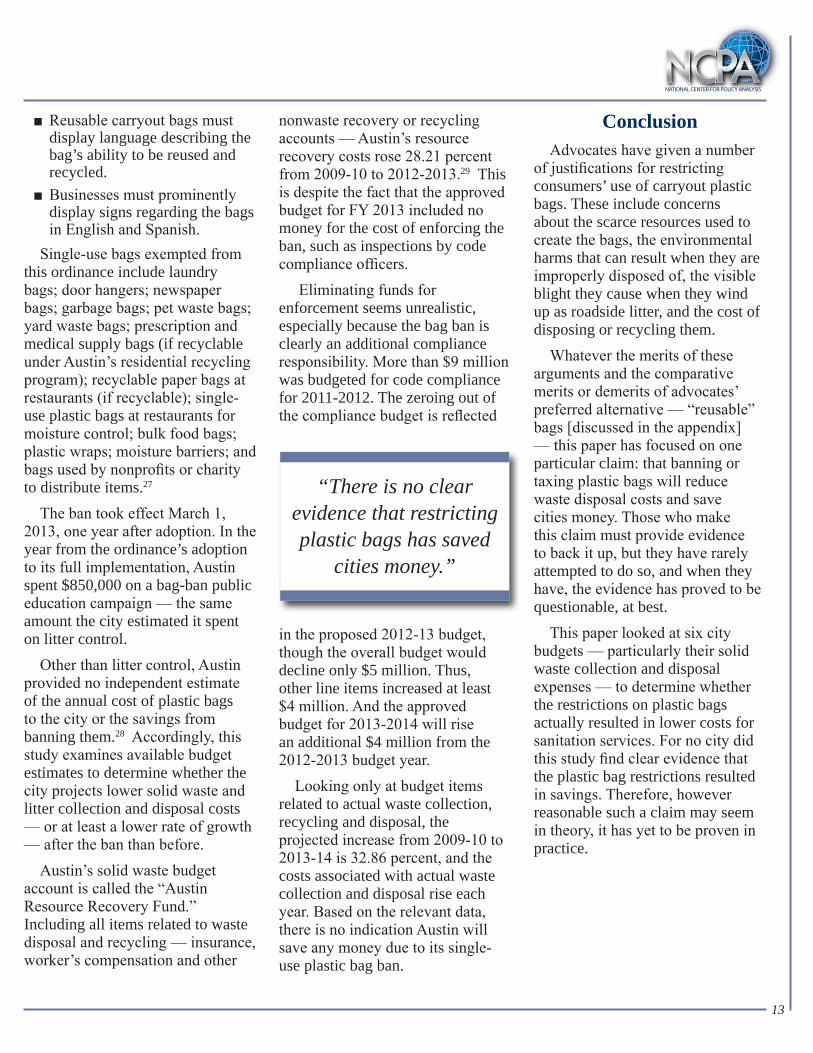
Whatever the merits of these arguments and the comparative merits or demerits of advocates’ preferred alternative — “reusable” bags [discussed in the appendix] — this paper has focused on one particular claim: that banning or taxing plastic bags will reduce waste disposal costs and save cities money. Those who make this claim must provide evidence to back it up, but they have rarely attempted to do so, and when they have, the evidence has proved to be questionable, at best.
This paper looked at six city budgets — particularly their solid waste collection and disposal expenses — to determine whether the restrictions on plastic bags actually resulted in lower costs for sanitation services. For no city did this study find clear evidence that the plastic bag restrictions resulted in savings. Therefore, however reasonable such a claim may seem in theory, it has yet to be proven in practice.
Insert callout here.
“There is no clear evidence that restricting plastic bags has saved
cities money.”

Do Bans on Plastic Grocery Bags Save Cities Money?
14
Appendix
The Cost of AlternativesTo properly assess the costs of plastic bags to cities, and whether various types of restrictions on them will save any municipality money, one must account for the costs of consumers switching to alternative modes of carrying their purchases. This study does not analyze the costs of switching to paper bags, as the same cities that have banned or taxed plastic bags have generally placed similar restrictions on paper bags. The cities examined are primarily encouraging the use of reusable bags.
Both domestic and international studies demonstrate consumers can be quite creative in their response to plastic bag restrictions. For instance, a study in Ireland found that in 2002, after the country implemented a 15 cents per bag (equivalent to 24 cents per bag in the United States), plastic bag used dropped from an estimated 328 bags per person each year to 21 per person annually, with a rebound to 31 bags per person within five years.30 However, according to Ireland’s most popular newspaper, the nation’s largest retailer saw a 77 percent increase in the sale of diaper bin liners and trash bag liners — with a similar increase at smaller stores surveyed. In addition, one Irish plastic trash bag manufacturer reported a 300 percent to 400 percent increase in demand since the bag ban went into effect. Indeed, the company doubled the shifts of workers to keep pace with demand.
Furthermore, there is plentiful evidence that reusable bags have hidden, unanticipated costs cities fail to consider. From both the environmental and human health perspective, plastic bags often out-perform reusable bags.
For instance, manufacturing and shipping reusable bags produces far more greenhouse gas emissions than plastic bags. A British study found that a reusable bag made of cotton must be used more than 131 times before it achieves a lower greenhouse gas potential than a plastic bag used only once.31 This point is critical since more than 90 percent of Americans reuse their plastic bags at least once.32
However, based on data from the University of Chico, the University of Clemson, the U.S. Census Bureau and the U.S. International Trade Commission, the average reusable bag is only reused 7.81 times prior to disposal.33 Reusable bags might be tossed after relatively few uses because they become dirty, out of fear of contamination, due to wear from washing — reusable bags made from plastic don’t hold up well in the wash — or other reasons, but there is no case can for using renewable bags based on their greenhouse gas profile.
In addition, the average plastic grocery bag weighs one-third as much as the average reusable plastic bag, and only one-tenth to 6 percent as much as the average reusable cotton bag.34 And, per 1,000 bags, manufacture of plastic grocery bags uses only one-fifth as much electricity as reusable plastic bags and 40 percent less electricity than cotton bags. Cotton bags also produce more than four times more waste than the average plastic bag and require much more water to produce.35
Because more than 95 percent of the reusable bags sold in the United States come from overseas — primarily from China — they also require much more fuel to produce and transport than common plastic grocery bags. And numerous reports have revealed that some reusable bags from China contain toxic chemicals that are forbidden in U.S.-produced bags or products.36
From a public health perspective, unless reusable bags are regularly and thoroughly cleaned (which reduces their useful life), they are prone to carry potentially harmful bacteria. A University of Arizona study found that 50 percent of all reusable bags contained food-borne bacteria, such as salmonella. Twelve percent contained E. coli, indicating the presence of fecal matter and other pathogens.37 A Canadian study found bacteria build-up on reusable bags was 300 percent higher than what is considered safe.38 This problem can become even worse if the bags are stored in a hot, humid place like an automobile trunk (which many people do so they don’t leave them at home), because these conditions can cause bacteria to grow 10 times faster.39 And the reusable bag portents danger not just

15
to its owner, but to the general public, because the bags can leave bacteria on store checkout counters and conveyor belts.
Finally, from an economic perspective, bag bans and taxes reduce tax receipts and retail sales and cause job losses where they are enacted, while those same factors increase tax receipts, sales and job gains in the cities and regions immediately abutting those areas.40 From a national perspective, because the United States manufactures most plastic bags, while the vast majority of reusable bags come from China, plastic bag restrictions harm workers in the United States and ships jobs overseas — a politically inflicted offshoring of jobs.

Do Bans on Plastic Grocery Bags Save Cities Money?
16
Endnotes1. Aviya Kushner, “Paper or Plastic? What’s the Environmental Choice?” Bankrate, available at http://www.bankrate.com/brm/news/cheap/20041215a1.asp; Catalina Gaitan, “Hot Seat: David Tyler,” Willamette Week, available at http://www.wweek.com/portland/article-20963-hotseat_david_tyler.html; Jane McGrath, “Which is More Environmentally Friendly: Paper or Plastic?” How Stuff Works, available at http://science.howstuffworks.com/environmental/green-science/paper-plastic1.htm; Universal Plastic & Metal Manufacturing Limited, available at http://upmplastic.com/Cornstarch_degradable_epi_oxo_technical7.asp. 2. Mid-Atlantic Solid Waste Consultants, 2009 National Visible Litter Survey and Litter Cost Study, Final Report, Keep America Beautiful, September 18, 2009. Available at http://www.kab.org/site/DocServer/Final_KAB_Report_9-18-09.pdf. 3. United States Environmental Protection Agency, “Municipal Solid Waste in the United States: 2009 Facts and Figures,” December 2010. Available at http://www.epa.gov/osw/nonhaz/municipal/pubs/msw2009rpt.pdf.4. Ross Mirkarimi, “Fact Sheet: Costs Associated With Paper and Plastic Bags 1,” City and County of San Francisco, 2007; “Checkout Bag Fee Resolution,” San Francisco Environment, Resolution Number 007-04-COE, January 25, 2005; “Nexus Study,” San Francisco Board of Supervisors, Resolution Number 123-05, February 9, 2005. 5. U.S. Environmental Protection Agency, “Municipal Solid Waste in the United States: 2009 Facts and Figures,” December 2010. Available at http://www.epa.gov/osw/nonhaz/municipal/pubs/msw2009rpt.pdf.6. Environment Agency, “Life Cycle Assessment of Supermarket Carrier Bags,” Report: SC030148, February 2011. Available at http://www.savetheplasticbag.com/UploadedFiles/British percent20LCA.pdf. 7. “Ohio Statewide Litter Study,” Ohio Department of Natural Resources and Davey Resource Group, June 2004, available at http://ohiodnr.com/Portals/15/tools/pubs/ODNR percent20Litter percent20Study percent20Final percent20Report1.pdf; “The Florida Litter Study:1998,” Florida Center For Solid and Hazardous Waste Management, Report #98-9, July 1998, available at http://litterinfo.org/98_florida_litter_study.pdf; “2001 Roadside Litter Study,” Keep Iowa Beautiful and Barker Lemar Engineering Consultants, Spring 2001; “2008 National Visible Litter Survey and Litter Cost Study,” Mid Atlantic Solid Waste Consultants, September 18, 2009, available at http://www.kab.org/site/DocServer/Final_KAB_Report_9-18-09.pdf?docID=4561.8. Bag the Ban, “Reusing,” undated. Available at http://www.bagtheban.com/learn-the-facts/reusing.9. Chris Thomas, “Curbside Commingled Recycling Quality,” Waste Connections, Inc., June 2011. Available at http://www.aorr.org/events/conference/2011/presentations/thomas_commingling_contam_061611.pdf. 10. The Solid Waste Agency of Lake County, Illinois, Report to the Illinois General Assembly Pursuant toP.A. 95-026, The Plastic Bag Recycling Task Force, May 2010. Available at http://www.swalco.org/Recycling/Documents/Plastic%20Bag%20Recycling%20Task%20Force%20Report%20May,%202010.pdf. 11. City and County of San Francisco Department of Public Works, “San Francisco Sets New Refuse Rates,” June 27, 2006, available at http://sfdpw.org/index/aspx?page=785; City and County of San Francisco Department of Public Works, “Uniform Residential Rates,” undated, available at http://sfdpw.org/Modules/ShowDocument.aspx?documentid=335; City and County of San Francisco Department of Public Works, “Rate Board Approves New Garbage Rates,” July 31, 2013, available at http://www.sfdpw.org/index.aspx?page=1712.12. City of San Jose Code of Ordinances, “Chapter 9.10 Solid Waste Management,” undated. Available at http://sanjose.amlegal.com/nxt/gateway.dll/California/sanjose_ca/title9healthandsafety/chapter910solidwastemanagement?f=templates$fn=default.htm$3.0$vid=amlegal:sanjose_ca$anc=JD_Title9,Ch.9.10,Part13.13. The 2012-2013 actual budget numbers were not yet available when this study was written.14. John Stufflebean, “Memorandum,” City of San Jose, June 2, 2011. Available at http://www3.sanjoseca.gov/clerk/Agenda/20110614/20110614_0306.pdf.15. Because the City of Los Angeles’ ban had not yet become effective at the time this study was written, only the impact and potential savings for the county’s waste disposal budget are examined.

17
16. County of Los Angeles, California, “Comprehensive Annual Financial Report for the Fiscal Year Ended June 30, 2010,” available at http://file.lacounty.gov/lac/cms1_155095.pdf; Jonathan Randles, “County trims down budget,” Santa Clarita Valley Signal, June 8, 2010, available at http://www.signalscv.com/archives/29659/; CBS Los Angeles, “LA County Cutting $35M From Budget, Avoiding Layoffs And Furloughs,” April 18, 2011, available at http://losangeles.cbslocal.com/2011/04/18/la-county-cutting-35m-from-budget-avoiding-layoffs-and-furloughs/.17. Tim Craig and Bill Turque, “Paper or Plastic? D.C. Council Votes for 5-Cent Tax on Both,” Washington Post, June 3, 2009. Available at http://articles.washingtonpost.com/2009-06-03/news/36930547_1_plastic-bags-5-cent-fee-reusable-bags.18. “Regulations On Retail Establishment Carryout Bags,” Government of the District of Columbia, Department of the Environment, Natural Resources Administration, Stormwater Management Division, undated. Available at http://green.dc.gov/sites/default/files/dc/sites/ddoe/publication/attachments/DC.BagLawRegs.pdf.19. Ibid.20. Stephanie Steinberg, “Officials rejoice over low 5-cent bag fee revenue,” WTOP 103.5 FM, October 4, 2012. Available at http://www.wtop.com/41/3062667/Officials-rejoice-over-low-5-cent-bag-fee-revenue.21. The Beacon Hill Institute at Suffolk University, “Two Years of the Washington, D.C. Bag Tax: An Analysis,” August 2012. Available at http://s3.amazonaws.com/atrfiles/files/files/BHI_Report.pdf.22. Ibid; Pamela Villarreal and Baruch Feigenbaum, “A Survey on the Economic Effects of Los Angeles County’s Plastic Bag Ban,” National Center for Policy Analysis, Policy Report No. 340, August 2012. Available at http://www.ncpa.org/pub/st340.23. Sara Murray, “In Washington, a Lesson In Bureaucracy Comes in Every Bag,” Wall Street Journal, January 25, 2010. Available at http://online.wsj.com/news/articles/SB20001424052748704509704575019271558165744.24. DC Fiscal Policy Institute, “The Cost of Cuts to DC’s Department of Public Works,” undated. Available at http://www.dcfpi.org/wp-content/uploads/2011/04/The-Cost-of-Cuts-to-DPW1.pdf. 25. Reuters, “Update 1-S&P sees US shutdown hurting D.C. budget; cuts score,” October 9, 2013. Available at http://www.reuters.com/article/2013/10/09/usa-fiscal-sp-dc-idUSL1N0HZ15R20131009.26. Sarah Coppola, “City Council moves ahead on plastic bag ban,” Austin American-Statesman, August 4, 2011. Available at http://www.statesman.com/news/news/local/city-council-moves-ahead-on-plastic-bag-ban/nRdFN/.27. Ashley Goudeau, “Austin preparing retailers for next month’s bag ban,” KVUE, February 7, 2013. Available at http://www.kvue.com/news/Final-informational-meetings-on-bag-ban-190172541.html.28. Because the ban became effective in 2013, no hard data on results were available when this study was written.29. City of Austin, “Austin, Texas 2013-2014 Proposed Budget Volume One.” Available at https://assets.austintexas.gov/budget/13-14/downloads/FY percent2014_proposed_volume_i_undistilled.pdf. 30. Paul Frisman, “Effect of Plastic Bag Taxes and Bans on Garbage Bag Sales,” Office of Legislative Research, Connecticut General Assembly, Research Report, December 17, 2008. Available at http://www.cga.ct.gov/2008/rpt/2008-R-0685.htm.31. Environment Agency, “Life Cycle Assessment of Supermarket Carrier Bags: a review of the bags available in 2006,” Report: SC030148, February 2011. Available at http://a0768b4a8a31e106d8b0-50dc802554eb38a24458b98ff72d550b.r19.cf3.rackcdn.com/scho0711buan-e-e.pdf.32. American Plastics Council and APCO Insight, “National Plastic Shopping Bag Recycling Signage Testing: A Survey of the General Population,” March 2007. Available at http://www.bagtheban.com/assets/content/bag-recycling-signage-testing.pdf.33. Daphne Lofquist et al., “Households and Families: 2010,” United States Census Bureau, Census Briefs, April 2012, available at http://www.census.gov/prod/cen2010/briefs/c2010br-14.pdf; United States International Trade Commission, “Interactive Tariff and Trade DataWeb,” available at http://dataweb.usitc.gov/; Joseph Greene, “Survey of Reusable and Single-use Grocery Bags in Northern California,” California State University, Chico Research Foundation, August 31, 2010.

Do Bans on Plastic Grocery Bags Save Cities Money?
18
34. Environment Agency, “Life Cycle Assessment of Supermarket Carrier Bags,” Report: SC030148, February 2011. Available at http://www.savetheplasticbag.com/UploadedFiles/British percent20LCA.pdf.35. Pamela Villarreal and Baruch Feigenbaum, “A Survey on the Economic Effects of Los Angeles County’s Plastic Bag Ban,” National Center for Policy Analysis, Policy Report No. 340, August 16, 2012. Available at http://www.ncpa.org/pub/st340.36. Michael M. Grynbaum, “Even Reusable Bags Carry Environmental Risk,” New York Times, November 14, 2010. Available at http://www.nytimes.com/2010/11/15/nyregion/15bags.html?_r=0. 37. David L. Williams et al., “Assessment of the Potential for Cross-contamination of Food Products by Reusable Shopping Bags,” International Association for Food Protection, Food Protection Trends, Vol. 31, No. 8, pages 508-513, August 2011, available at http://www.foodlegal.com.au/uploads/Cross percent20contamination percent20of percent20reusable percent20shopping percent20bags_i171.pdf. 38. Richard Summerbell, “A Microbiological Study of Reusable Bags and ‘First or single-use’ Plastic Bags,” Environment and Plastics Industry Council, May 20, 2009. Available at http://www.plastics.ca/_files/file.php?filename=file_A_Microbiological_Study_of_Reusable_Grocery_Bags_May20_09.pdf.39. David L. Williams et al., “Assessment of the Potential for Cross-contamination of Food Products by Reusable Shopping Bags,” International Association for Food Protection, Food Protection Trends, Vol. 31, No. 8, pages 508-513, August 2011. Available at http://www.foodlegal.com.au/uploads/Cross percent20contamination percent20of percent20reusable percent20shopping percent20bags_i171.pdf.40. “Two Years of the Washington, D.C. Bag Tax: An Analysis,” Beacon Hill Institute at Suffolk University, August 2012. Available at http://s3.amazonaws.com/atrfiles/files/files/BHI_Report.pdf.

19
About the NCPA
“The NCPA generates more analysis per dollar than any think tank in the country. It does an amazingly good job of going out and finding the right things and talking about them in intelligent ways.” Newt Gingrich, former Speaker of the U.S. House of Representatives
“We know what works. It’s what the NCPA talks about: limited government, economic freedom; things like Health Savings Accounts. These things work, allowing people choices. We’ve seen how this created America.”John Stossel, host of “Stossel,” Fox Business Network
“I don’t know of any organization in America that produces better ideas with less money than the NCPA.” Phil Gramm, former U.S. Senator
“Thank you . . . for advocating such radical causes as balanced budgets, limited government and tax reform, and to be able to try and bring power back to the people.” Tommy Thompson, former Secretary of Health and Human Services
Health Care Policy.
The NCPA is probably best known for developing the concept of Health Savings Accounts (HSAs), previously known as Medical Savings Accounts (MSAs). NCPA President John C. Goodman is widely acknowledged (Wall Street Journal, WebMD and the National Journal) as the “Father of HSAs.” NCPA research, public education and briefings for members of Congress and the White House staff helped lead Congress to approve a pilot MSA program for small businesses and the self-employed in 1996 and to vote in 1997 to allow Medicare beneficiaries to have MSAs. In 2003, as part of Medicare reform, Congress and the President made HSAs available to all nonseniors, potentially revolutionizing the entire health care industry. HSAs now are potentially available to 250 million nonelderly Americans.
The NCPA outlined the concept of using federal tax credits to encourage private health insurance and helped formulate bipartisan proposals in both the Senate and the House. The NCPA and BlueCross BlueShield of Texas devel-oped a plan to use money that federal, state and local governments now spend on indigent health care to help the poor purchase health insurance. The SPN Medicaid Exchange, an initiative of the NCPA for the State Policy Network, is identifying and sharing the best ideas for health care reform with researchers and policymakers in every state.
Taxes & Economic Growth.
The NCPA helped shape the pro-growth approach to tax policy during the 1990s. A package of tax cuts designed by the NCPA and the U.S. Chamber of Com-merce in 1991 became the core of the Contract with America in 1994. Three of the five proposals (capital gains tax cut, Roth IRA and eliminating the Social Security earnings penalty) became law. A fourth proposal — rolling back the tax on Social Security benefits — passed the House of Repre-sentatives in summer 2002. The NCPA’s proposal for an across-the-board tax cut became the centerpiece of President Bush’s tax cut proposals.
NCPA research demonstrates the benefits of shifting the tax burden on work and productive investment to consumption. An NCPA study by Boston University economist Laurence Kotlikoff analyzed three versions of a consumption tax: a flat tax, a value-added tax and a national sales tax. Based on this work, Dr. Goodman wrote a full-page editorial for Forbes (“A Kinder, Gentler Flat Tax”) advocating a version of the flat tax that is both progressive and fair.
The NCPA’s online Social Security calculator allows visitors to discover their expected taxes and benefits and how much they would have accumulated had their taxes been invested privately.
Environment & Energy. The NCPA’s E-Team is one of the largest collections of energy and environmental policy experts and scientists who believe that sound science, economic prosperity and protecting the environment are compatible. The team seeks to correct misinformation and promote sensible solutions to energy and environment problems. A pathbreaking 2001 NCPA study showed that the costs of the Kyoto agreement to reduce carbon emissions in developed countries would far exceed any benefits.
Educating the next generation.
The NCPA’s Debate Central is the most comprehensive online site for free information for 400,000 U.S. high school debaters. In 2006, the site drew more than one million hits per month. Debate Central received the prestigious Temple-ton Freedom Prize for Student Outreach.
Promoting Ideas. NCPA studies, ideas and experts are quoted frequently in news stories nationwide. Columns written by NCPA scholars appear regularly in national publications such as the Wall Street Journal, the Washington Times, USA Today and many other major-market daily newspapers, as well as on radio talk shows, on television public affairs programs, and in public policy newslet-ters. According to media figures from BurrellesLuce, more than 900,000 people daily read or hear about NCPA ideas and activities somewhere in the United States.
The NCPA is a nonprofit, nonpartisan organization established in 1983. Its aim is to examine public policies in areas that have a significant impact on the lives of all Americans — retirement, health care, education, taxes, the economy, the environment — and to propose innovative, market-driven solutions. The NCPA seeks to unleash the power of ideas for positive change by identifying, encouraging and aggressively marketing the best scholarly research.
A major NCPA study, “Wealth, Inheritance and the Estate Tax,” completely undermines the claim by proponents of the estate tax that it prevents the concentration of wealth in the hands of financial dynasties. Senate Majority Leader Bill Frist (R-TN) and Senator Jon Kyl (R-AZ) distributed a letter to their colleagues about the study. The NCPA recently won the Templeton Freedom Award for its study and report on Free Market Solutions. The report outlines an approach called Enterprise Programs that creates job opportunities for those who face the greatest challenges to employment.
Retirement Reform. With a grant from the NCPA, economists at Texas A&M University developed a model to evaluate the future of Social Security and Medicare, working under the direction of Thomas R. Saving, who for years was one of two private-sector trustees of Social Security and Medicare.
The NCPA study, “Ten Steps to Baby Boomer Retirement,” shows that as 77 million baby boomers begin to retire, the nation’s institutions are totally unprepared. Promises made under Social Security, Medicare and Medicaid are inadequately funded. State and local institutions are not doing better — millions of government workers are discovering that their pensions are under-funded and local governments are retrenching on post-retirement health care promises.
Pension Reform.Pension reforms signed into law include ideas to improve 401(k)s developed and proposed by the NCPA and the Brookings Institution. Among the NCPA/Brookings 401(k) reforms are automatic enrollment of employees into companies’ 401(k) plans, automatic contribution rate increases so that workers’ contributions grow with their wages, and better default investment options for workers who do not make an investment choice. The NCPA is a 501(c)(3) nonprofit public policy organization. We depend entirely on the financial support of individuals, corporations and foundations that believe in private
sector solutions to public policy problems. You can contribute to our effort by mailing your donation to our Dallas headquarters at 12770 Coit Road, Suite 800, Dallas, TX 75251, or visiting our Web site at www.ncpa.org and clicking “Support Us.”
NCPA President John C. Goodman is called
the “Father of HSAs” by The Wall Street Journal, WebMD
and the National Journal.
What Others Say About the NCPA