liddell monthly data summary november 2018
TRANSCRIPT

Monthly Data Summary
v
A1 Licence Holder
Licence Number 2122
Licence Holder AGL MACQUARIE
Trading Name (if applicable)
ABN 18 167 859 494
A2 Premises to which Licence Applies (if applicable)
Common Name (if any) LIDDELL POWER STATION
Premises NEW ENGLAND HIGHWAY MUSWELLBROOK NSW 2333
A3 Activities to which Licence Applies
Electricity Generating Works
Coal Works
A4 Other Activities (if applicable)
Helicopter-related facilities
Chemical storage
Operation of Emergency 1.5 MW diesel generator
Operation of Gas turbine
Sewage treatment
Waste storage
A5 Fee-Based Activity Classifications
Note that the fee based activity classification is used to calculate the administrative fee.
Fee-based activity Activity scale Unit of measure
Coal works > 5,000,000.00 T handled
Generation of electrical power from coal > 4,000.00 Gwh generated
LIDDELL MONTHLY DATA SUMMARY NOVEMBER 2018
LICENCE NO
REPORTING PERIOD
LICENCE HOLDER
NOVEMBER 2018
AGL MACQUARIE
2122
Licence 2122 Page 1

Monthly Data Summary
Discharge & Monitoring Point 7301204 East 6416350 North
Discharge to Air
MonthDate of
PublicationPollutant
Unit of
measure
Sampling /
measurment
frequency
Averaging period Data capture %
Lowest
sample
value
Mean of
samples
Highest
sample
value
EPL Limit
NOVEMBER 2018 14/12/2018milligrams per
cubic metre500.8 669.2 1137.5 1500 mg/m
3
NOVEMBER 2018 14/12/2018 parts per million 244.0 326.1 554.2 700 ppm
NOVEMBER 2018 14/12/2018milligrams per
cubic metre708.3 950.3 1530.4
NOVEMBER 2018 14/12/2018 parts per million 247.8 332.5 535.5 600 ppm
NOVEMBER 2018 14/12/2018Opacity -
Undifferentiated
particles
Percent Continuous One hour >99% 1.7 4.8 8.7 20%
Comments:
Annual monitoring of discharges to air
MonthDate of
PublicationPollutant
Unit of
measure
No. of samples
required by
licence
Samples
collected and
analysed
Sample value EPL Limit
mg/m3
Oct-18 8/11/2018 Cadmiummilligrams per
cubic metre1 1 <0.0001 1.0
Oct-18 8/11/2018 Chlorinemilligrams per
cubic metre1 1 0.0 200
Oct-18 8/11/2018 Coppermilligrams per
cubic metre1 1 0.0017
Oct-18 8/11/2018Hazardous
substances (Metals)
milligrams per
cubic metre1 1 ≤0.058 5
Oct-18 8/11/2018 Hydrogen chloridemilligrams per
cubic metre1 1 26.0 100
Oct-18 8/11/2018 Mercurymilligrams per
cubic metre1 1 0.00330 1.0
Oct-18 8/11/2018 Nitrogen oxidesmilligrams per
cubic metre1 1 810 1500
Oct-18 8/11/2018 Solid particlesmilligrams per
cubic metre1 1 5.5 100
Oct-18 8/11/2018Sulfuric acid mist and
sulfur trioxide
milligrams per
cubic metre1 1 2.000 100
Oct-18 8/11/2018 Sulphur dioxide milligrams per
cubic metre1 1 1200
Oct-18 8/11/2018 Total fluoride milligrams per
cubic metre1 1 12.0 50
Oct-18 8/11/2018Volatile organic
compounds
milligrams per
cubic metre1 1 <0.03
Comments:
In the flue gases of unit 1boiler labelled as "Unit 1 Boiler 1-2 Chimney Stack" on plan no. LD 800474 amended 03 and dated 6/5/2003
Nitrogen Oxides >99%Continuous
>99%Continuous
One hour
Sulphur dioxide
Air emission monitoring, Boiler 1 stack emissions, shown on plan no LD800474 amended 03 and dated 6/5/2003
One hour
Monitoring of emission from each of the 4 boilers for the substances in this table is required annually.
Licence 2122 Page 2
Monthly Data Summary
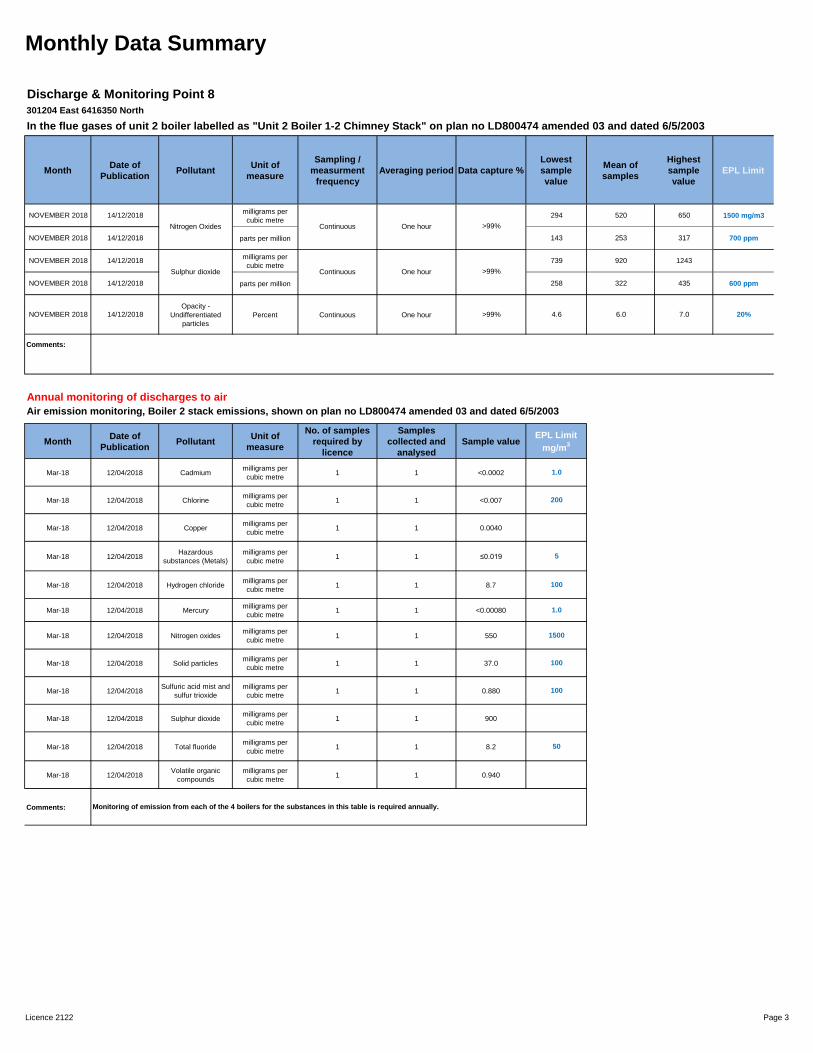
Discharge & Monitoring Point 8
301204 East 6416350 North
In the flue gases of unit 2 boiler labelled as "Unit 2 Boiler 1-2 Chimney Stack" on plan no LD800474 amended 03 and dated 6/5/2003
MonthDate of
PublicationPollutant
Unit of
measure
Sampling /
measurment
frequency
Averaging period Data capture %
Lowest
sample
value
Mean of
samples
Highest
sample
value
EPL Limit
NOVEMBER 2018 14/12/2018milligrams per
cubic metre294 520 650 1500 mg/m3
NOVEMBER 2018 14/12/2018 parts per million 143 253 317 700 ppm
NOVEMBER 2018 14/12/2018milligrams per
cubic metre739 920 1243
NOVEMBER 2018 14/12/2018 parts per million 258 322 435 600 ppm
NOVEMBER 2018 14/12/2018Opacity -
Undifferentiated
particles
Percent Continuous One hour >99% 4.6 6.0 7.0 20%
Comments:
Annual monitoring of discharges to air
MonthDate of
PublicationPollutant
Unit of
measure
No. of samples
required by
licence
Samples
collected and
analysed
Sample value EPL Limit
mg/m3
Mar-18 12/04/2018 Cadmiummilligrams per
cubic metre1 1 <0.0002 1.0
Mar-18 12/04/2018 Chlorinemilligrams per
cubic metre1 1 <0.007 200
Mar-18 12/04/2018 Coppermilligrams per
cubic metre1 1 0.0040
Mar-18 12/04/2018Hazardous
substances (Metals)
milligrams per
cubic metre1 1 ≤0.019 5
Mar-18 12/04/2018 Hydrogen chloridemilligrams per
cubic metre1 1 8.7 100
Mar-18 12/04/2018 Mercurymilligrams per
cubic metre1 1 <0.00080 1.0
Mar-18 12/04/2018 Nitrogen oxidesmilligrams per
cubic metre1 1 550 1500
Mar-18 12/04/2018 Solid particlesmilligrams per
cubic metre1 1 37.0 100
Mar-18 12/04/2018Sulfuric acid mist and
sulfur trioxide
milligrams per
cubic metre1 1 0.880 100
Mar-18 12/04/2018 Sulphur dioxide milligrams per
cubic metre1 1 900
Mar-18 12/04/2018 Total fluoride milligrams per
cubic metre1 1 8.2 50
Mar-18 12/04/2018Volatile organic
compounds
milligrams per
cubic metre1 1 0.940
Comments: Monitoring of emission from each of the 4 boilers for the substances in this table is required annually.
Sulphur dioxide
Continuous
>99%
>99%
Continuous
Air emission monitoring, Boiler 2 stack emissions, shown on plan no LD800474 amended 03 and dated 6/5/2003
One hour
One hour
Nitrogen Oxides
Licence 2122 Page 3

Monthly Data Summary
Discharge & Monitoring Point 9
301204 East 6416350 North
MonthDate of
PublicationPollutant
Unit of
measure
Sampling /
measurment
frequency
Averaging period Data capture %
Lowest
sample
value
Mean of
samples
Highest
sample
value
EPL Limit
NOVEMBER 2018 14/12/2018milligrams per
cubic metre- - - 1500 mg/m3
NOVEMBER 2018 14/12/2018 parts per million - - - 700 ppm
NOVEMBER 2018 14/12/2018milligrams per
cubic metre- - -
NOVEMBER 2018 14/12/2018 parts per million - - - 600 ppm
NOVEMBER 2018 14/12/2018Opacity -
Undifferentiated
particles
Percent Continuous One hour - - - - 20%
Comments:
Annual monitoring of discharges to air
MonthDate of
PublicationPollutant
Unit of
measure
No. of samples
required by
licence
Samples
collected and
analysed
Sample value EPL Limit
mg/m3
Oct-17 1/12/2017 Cadmiummilligrams per
cubic metre1 1 <0.0001 1.0
Oct-17 1/12/2017 Chlorinemilligrams per
cubic metre1 1 0.0 200
Oct-17 1/12/2017 Coppermilligrams per
cubic metre1 1 0.0037
Oct-17 1/12/2017Hazardous
substances (Metals)
milligrams per
cubic metre1 1 ≤0.02 5
Oct-17 1/12/2017 Hydrogen chloridemilligrams per
cubic metre1 1 20.0 100
Oct-17 1/12/2017 Mercurymilligrams per
cubic metre1 1 0.00051 1.0
Oct-17 1/12/2017 Nitrogen oxidesmilligrams per
cubic metre1 1 770 1500
Oct-17 1/12/2017 Solid particlesmilligrams per
cubic metre1 1 42.0 100
Oct-17 1/12/2017Sulfuric acid mist and
sulfur trioxide
milligrams per
cubic metre1 1 1.700 100
Oct-17 1/12/2017 Sulphur dioxide milligrams per
cubic metre1 1 1300
Oct-17 1/12/2017 Total fluoride milligrams per
cubic metre1 1 9.8 50
Oct-17 1/12/2017Volatile organic
compounds
milligrams per
cubic metre1 1 <0.02
Comments:
Unit was out of service during November 2018
Air emission monitoring, Boiler 3 stack emissions, shown on plan no LD800474 amended 03 and dated 6/5/2003
Monitoring of emission from each of the 4 boilers for the substances in this table is required annually.
One hour
In the flue gases of unit 3 boiler labelled as "Unit 3 Boiler 3-4 Chimney Stack" on plan no LD800474 amended 03 and dated 6/5/2003
Nitrogen Oxides Continuous
-ContinuousSulphur dioxide One hour
-
Licence 2122 Page 4

Monthly Data Summary
Discharge & Monitoring Point 10
301204 East 6416350 North
In the flue gases of unit 4 boiler labelled as "Unit 4 Boiler 3-4 Chimney Stack" on plan no LD800474 amended 03 and dated 6/5/2003
MonthDate of
PublicationPollutant
Unit of
measure
Sampling /
measurment
frequency
Averaging period Data capture %
Lowest
sample
value
Mean of
samples
Highest
sample
value
EPL Limit
NOVEMBER 2018 14/12/2018milligrams per
cubic metre429.1 628.5 712.7 1500 mg/m3
NOVEMBER 2018 14/12/2018 parts per million 209.1 306.2 347.3 700 ppm
NOVEMBER 2018 14/12/2018milligrams per
cubic metre763.2 976.8 1201.1
NOVEMBER 2018 14/12/2018 parts per million 267.0 341.8 420.3 600 ppm
NOVEMBER 2018 14/12/2018Opacity -
Undifferentiated
particles
Percent Continuous One hour >99% 2.3 6.2 17.0 20%
Annual monitoring of discharges to air
MonthDate of
PublicationPollutant
Unit of
measure
No. of samples
required by
licence
Samples
collected and
analysed
Sample value EPL Limit
mg/m3
Oct-18 29/11/2018 Cadmiummilligrams per
cubic metre1 1 <0.0001 1.0
Oct-18 29/11/2018 Chlorinemilligrams per
cubic metre1 1 0.0 200
Oct-18 29/11/2018 Coppermilligrams per
cubic metre1 1 0.0007
Oct-18 29/11/2018Hazardous
substances (Metals)
milligrams per
cubic metre1 1 ≤0.013 5
Oct-18 29/11/2018 Hydrogen chloridemilligrams per
cubic metre1 1 21.0 100
Oct-18 29/11/2018 Mercurymilligrams per
cubic metre1 1 0.00037 1.0
Oct-18 29/11/2018 Nitrogen oxidesmilligrams per
cubic metre1 1 540 1500
Oct-18 29/11/2018 Solid particlesmilligrams per
cubic metre1 1 16.0 100
Oct-18 29/11/2018Sulfuric acid mist and
sulfur trioxide
milligrams per
cubic metre1 1 0.900 100
Oct-18 29/11/2018 Sulphur dioxide milligrams per
cubic metre1 1 1100
Oct-18 29/11/2018 Total fluoride milligrams per
cubic metre1 1 11.0 50
Oct-18 29/11/2018Volatile organic
compounds
milligrams per
cubic metre1 1 <0.02
Comments: Monitoring of emission from each of the 4 boilers for the substances in this table is required annually.
Comments:
ContinuousSulphur dioxide >99%
Air emission monitoring, Boiler 4 stack emissions, shown on plan no LD800474 amended 03 and dated 6/5/2003
One hour
One hour
Continuous Nitrogen Oxides >99%
Licence 2122 Page 5
Monthly Data Summary
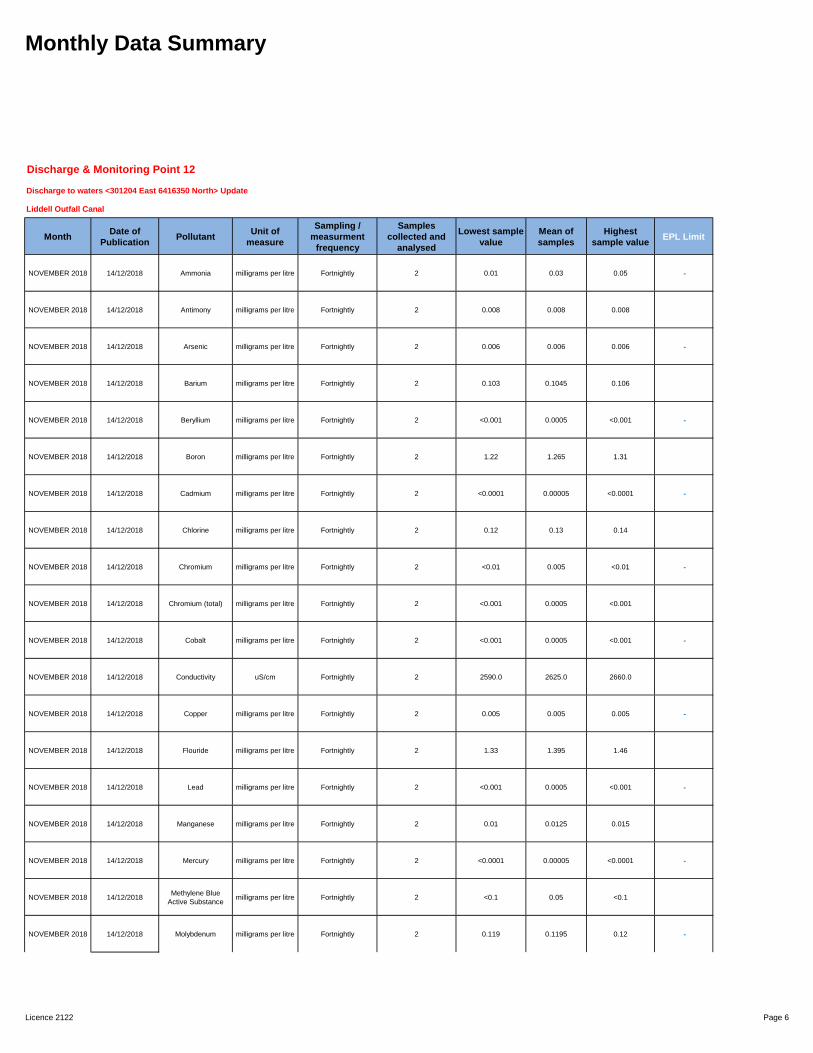
Discharge & Monitoring Point 12
Discharge to waters <301204 East 6416350 North> Update
Liddell Outfall Canal
MonthDate of
PublicationPollutant
Unit of
measure
Sampling /
measurment
frequency
Samples
collected and
analysed
Lowest sample
value
Mean of
samples
Highest
sample valueEPL Limit
NOVEMBER 2018 14/12/2018 Ammonia milligrams per litre Fortnightly 2 0.01 0.03 0.05 -
NOVEMBER 2018 14/12/2018 Antimony milligrams per litre Fortnightly 2 0.008 0.008 0.008
NOVEMBER 2018 14/12/2018 Arsenic milligrams per litre Fortnightly 2 0.006 0.006 0.006 -
NOVEMBER 2018 14/12/2018 Barium milligrams per litre Fortnightly 2 0.103 0.1045 0.106
NOVEMBER 2018 14/12/2018 Beryllium milligrams per litre Fortnightly 2 <0.001 0.0005 <0.001 -
NOVEMBER 2018 14/12/2018 Boron milligrams per litre Fortnightly 2 1.22 1.265 1.31
NOVEMBER 2018 14/12/2018 Cadmium milligrams per litre Fortnightly 2 <0.0001 0.00005 <0.0001 -
NOVEMBER 2018 14/12/2018 Chlorine milligrams per litre Fortnightly 2 0.12 0.13 0.14
NOVEMBER 2018 14/12/2018 Chromium milligrams per litre Fortnightly 2 <0.01 0.005 <0.01 -
NOVEMBER 2018 14/12/2018 Chromium (total) milligrams per litre Fortnightly 2 <0.001 0.0005 <0.001
NOVEMBER 2018 14/12/2018 Cobalt milligrams per litre Fortnightly 2 <0.001 0.0005 <0.001 -
NOVEMBER 2018 14/12/2018 Conductivity uS/cm Fortnightly 2 2590.0 2625.0 2660.0
NOVEMBER 2018 14/12/2018 Copper milligrams per litre Fortnightly 2 0.005 0.005 0.005 -
NOVEMBER 2018 14/12/2018 Flouride milligrams per litre Fortnightly 2 1.33 1.395 1.46
NOVEMBER 2018 14/12/2018 Lead milligrams per litre Fortnightly 2 <0.001 0.0005 <0.001 -
NOVEMBER 2018 14/12/2018 Manganese milligrams per litre Fortnightly 2 0.01 0.0125 0.015
NOVEMBER 2018 14/12/2018 Mercury milligrams per litre Fortnightly 2 <0.0001 0.00005 <0.0001 -
NOVEMBER 2018 14/12/2018Methylene Blue
Active Substancemilligrams per litre Fortnightly 2 <0.1 0.05 <0.1
NOVEMBER 2018 14/12/2018 Molybdenum milligrams per litre Fortnightly 2 0.119 0.1195 0.12 -
Licence 2122 Page 6
Monthly Data Summary
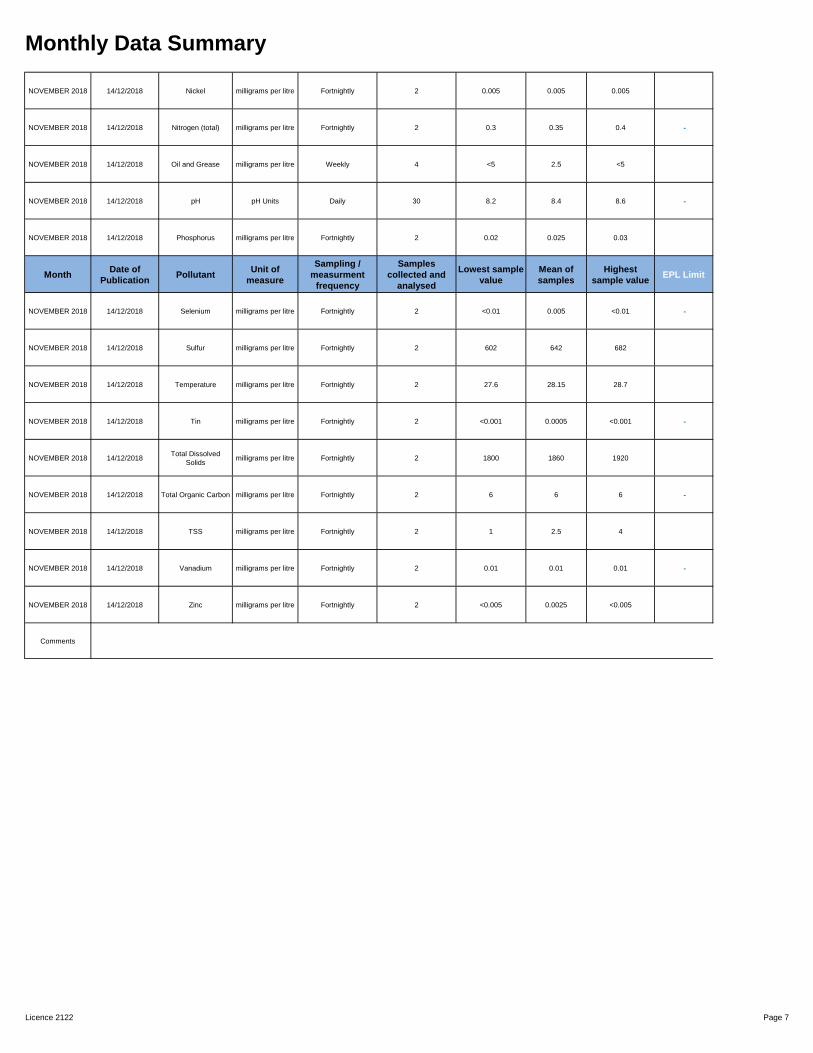
NOVEMBER 2018 14/12/2018 Nickel milligrams per litre Fortnightly 2 0.005 0.005 0.005
NOVEMBER 2018 14/12/2018 Nitrogen (total) milligrams per litre Fortnightly 2 0.3 0.35 0.4 -
NOVEMBER 2018 14/12/2018 Oil and Grease milligrams per litre Weekly 4 <5 2.5 <5
NOVEMBER 2018 14/12/2018 pH pH Units Daily 30 8.2 8.4 8.6 -
NOVEMBER 2018 14/12/2018 Phosphorus milligrams per litre Fortnightly 2 0.02 0.025 0.03
MonthDate of
PublicationPollutant
Unit of
measure
Sampling /
measurment
frequency
Samples
collected and
analysed
Lowest sample
value
Mean of
samples
Highest
sample valueEPL Limit
NOVEMBER 2018 14/12/2018 Selenium milligrams per litre Fortnightly 2 <0.01 0.005 <0.01 -
NOVEMBER 2018 14/12/2018 Sulfur milligrams per litre Fortnightly 2 602 642 682
NOVEMBER 2018 14/12/2018 Temperature milligrams per litre Fortnightly 2 27.6 28.15 28.7
NOVEMBER 2018 14/12/2018 Tin milligrams per litre Fortnightly 2 <0.001 0.0005 <0.001 -
NOVEMBER 2018 14/12/2018Total Dissolved
Solidsmilligrams per litre Fortnightly 2 1800 1860 1920
NOVEMBER 2018 14/12/2018 Total Organic Carbon milligrams per litre Fortnightly 2 6 6 6 -
NOVEMBER 2018 14/12/2018 TSS milligrams per litre Fortnightly 2 1 2.5 4
NOVEMBER 2018 14/12/2018 Vanadium milligrams per litre Fortnightly 2 0.01 0.01 0.01 -
NOVEMBER 2018 14/12/2018 Zinc milligrams per litre Fortnightly 2 <0.005 0.0025 <0.005
Comments
Licence 2122 Page 7
Monthly Data Summary
Comments
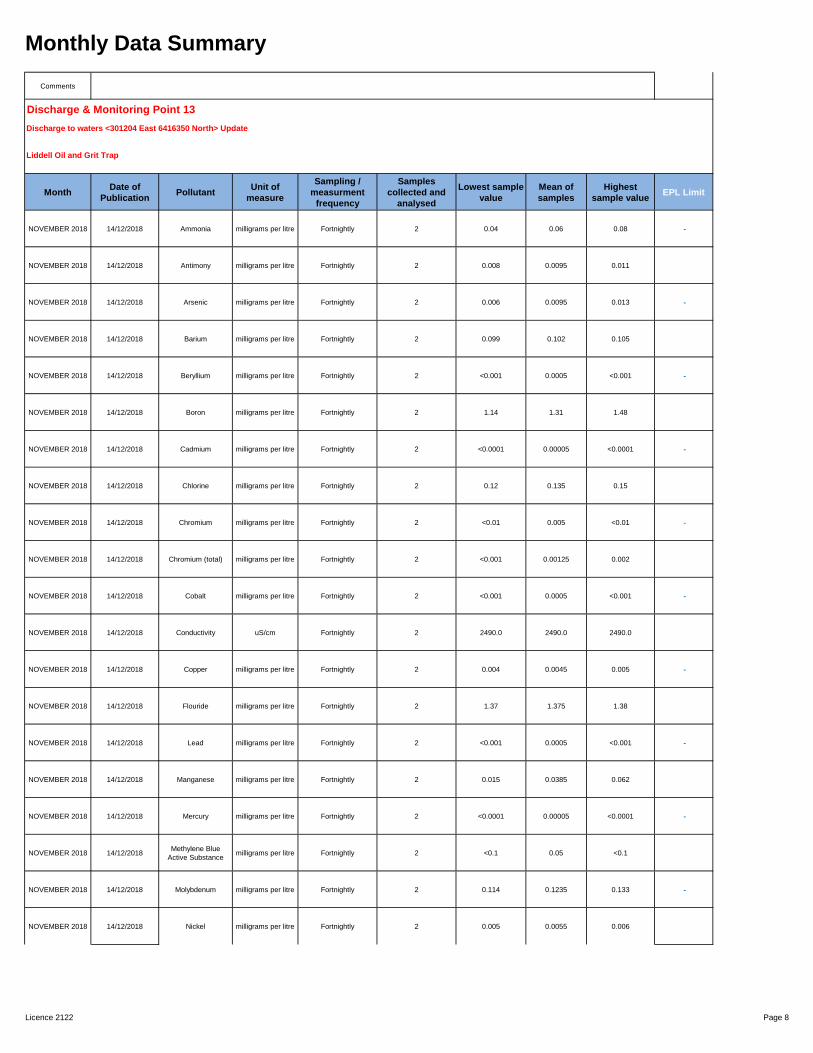
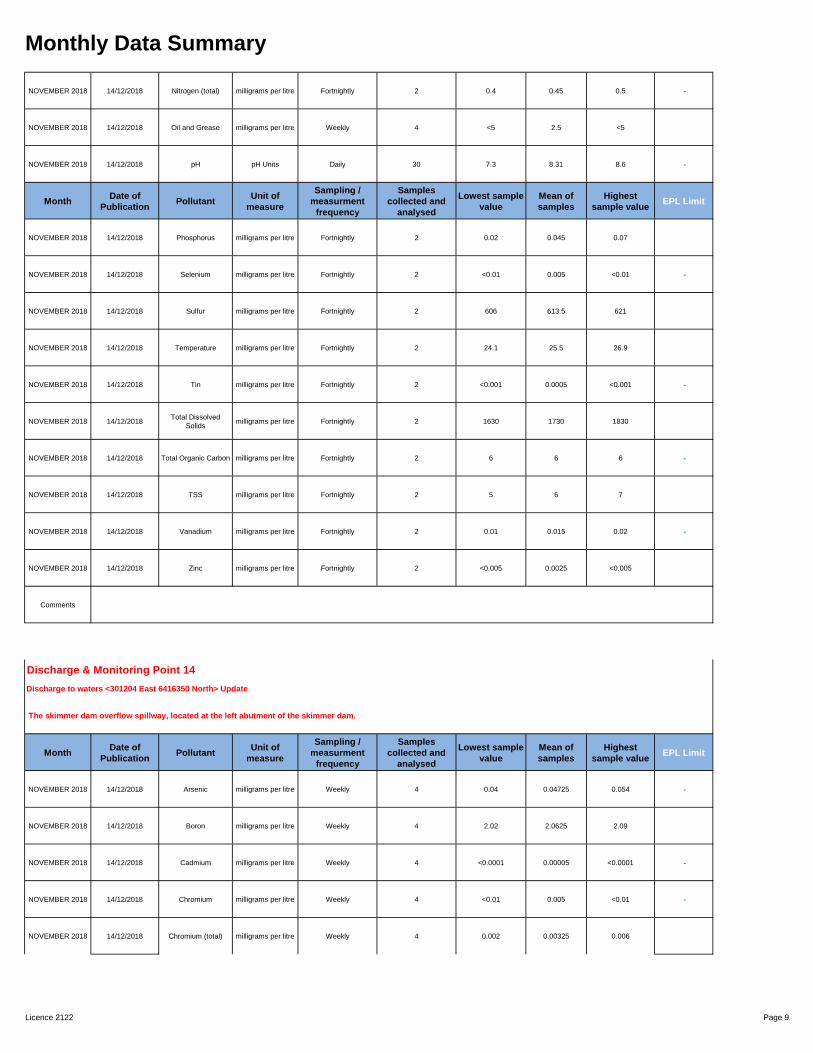
Discharge & Monitoring Point 13
Discharge to waters <301204 East 6416350 North> Update
Liddell Oil and Grit Trap
MonthDate of
PublicationPollutant
Unit of
measure
Sampling /
measurment
frequency
Samples
collected and
analysed
Lowest sample
value
Mean of
samples
Highest
sample valueEPL Limit
NOVEMBER 2018 14/12/2018 Ammonia milligrams per litre Fortnightly 2 0.04 0.06 0.08 -
NOVEMBER 2018 14/12/2018 Antimony milligrams per litre Fortnightly 2 0.008 0.0095 0.011
NOVEMBER 2018 14/12/2018 Arsenic milligrams per litre Fortnightly 2 0.006 0.0095 0.013 -
NOVEMBER 2018 14/12/2018 Barium milligrams per litre Fortnightly 2 0.099 0.102 0.105
NOVEMBER 2018 14/12/2018 Beryllium milligrams per litre Fortnightly 2 <0.001 0.0005 <0.001 -
NOVEMBER 2018 14/12/2018 Boron milligrams per litre Fortnightly 2 1.14 1.31 1.48
NOVEMBER 2018 14/12/2018 Cadmium milligrams per litre Fortnightly 2 <0.0001 0.00005 <0.0001 -
NOVEMBER 2018 14/12/2018 Chlorine milligrams per litre Fortnightly 2 0.12 0.135 0.15
NOVEMBER 2018 14/12/2018 Chromium milligrams per litre Fortnightly 2 <0.01 0.005 <0.01 -
NOVEMBER 2018 14/12/2018 Chromium (total) milligrams per litre Fortnightly 2 <0.001 0.00125 0.002
NOVEMBER 2018 14/12/2018 Cobalt milligrams per litre Fortnightly 2 <0.001 0.0005 <0.001 -
NOVEMBER 2018 14/12/2018 Conductivity uS/cm Fortnightly 2 2490.0 2490.0 2490.0
NOVEMBER 2018 14/12/2018 Copper milligrams per litre Fortnightly 2 0.004 0.0045 0.005 -
NOVEMBER 2018 14/12/2018 Flouride milligrams per litre Fortnightly 2 1.37 1.375 1.38
NOVEMBER 2018 14/12/2018 Lead milligrams per litre Fortnightly 2 <0.001 0.0005 <0.001 -
NOVEMBER 2018 14/12/2018 Manganese milligrams per litre Fortnightly 2 0.015 0.0385 0.062
NOVEMBER 2018 14/12/2018 Mercury milligrams per litre Fortnightly 2 <0.0001 0.00005 <0.0001 -
NOVEMBER 2018 14/12/2018Methylene Blue
Active Substancemilligrams per litre Fortnightly 2 <0.1 0.05 <0.1
NOVEMBER 2018 14/12/2018 Molybdenum milligrams per litre Fortnightly 2 0.114 0.1235 0.133 -
NOVEMBER 2018 14/12/2018 Nickel milligrams per litre Fortnightly 2 0.005 0.0055 0.006
Licence 2122 Page 8
Monthly Data Summary
NOVEMBER 2018 14/12/2018 Nitrogen (total) milligrams per litre Fortnightly 2 0.4 0.45 0.5 -
NOVEMBER 2018 14/12/2018 Oil and Grease milligrams per litre Weekly 4 <5 2.5 <5
NOVEMBER 2018 14/12/2018 pH pH Units Daily 30 7.3 8.31 8.6 -
MonthDate of
PublicationPollutant
Unit of
measure
Sampling /
measurment
frequency
Samples
collected and
analysed
Lowest sample
value
Mean of
samples
Highest
sample valueEPL Limit
NOVEMBER 2018 14/12/2018 Phosphorus milligrams per litre Fortnightly 2 0.02 0.045 0.07
NOVEMBER 2018 14/12/2018 Selenium milligrams per litre Fortnightly 2 <0.01 0.005 <0.01 -
NOVEMBER 2018 14/12/2018 Sulfur milligrams per litre Fortnightly 2 606 613.5 621
NOVEMBER 2018 14/12/2018 Temperature milligrams per litre Fortnightly 2 24.1 25.5 26.9
NOVEMBER 2018 14/12/2018 Tin milligrams per litre Fortnightly 2 <0.001 0.0005 <0.001 -
NOVEMBER 2018 14/12/2018Total Dissolved
Solidsmilligrams per litre Fortnightly 2 1630 1730 1830
NOVEMBER 2018 14/12/2018 Total Organic Carbon milligrams per litre Fortnightly 2 6 6 6 -
NOVEMBER 2018 14/12/2018 TSS milligrams per litre Fortnightly 2 5 6 7
NOVEMBER 2018 14/12/2018 Vanadium milligrams per litre Fortnightly 2 0.01 0.015 0.02 -
NOVEMBER 2018 14/12/2018 Zinc milligrams per litre Fortnightly 2 <0.005 0.0025 <0.005
Comments
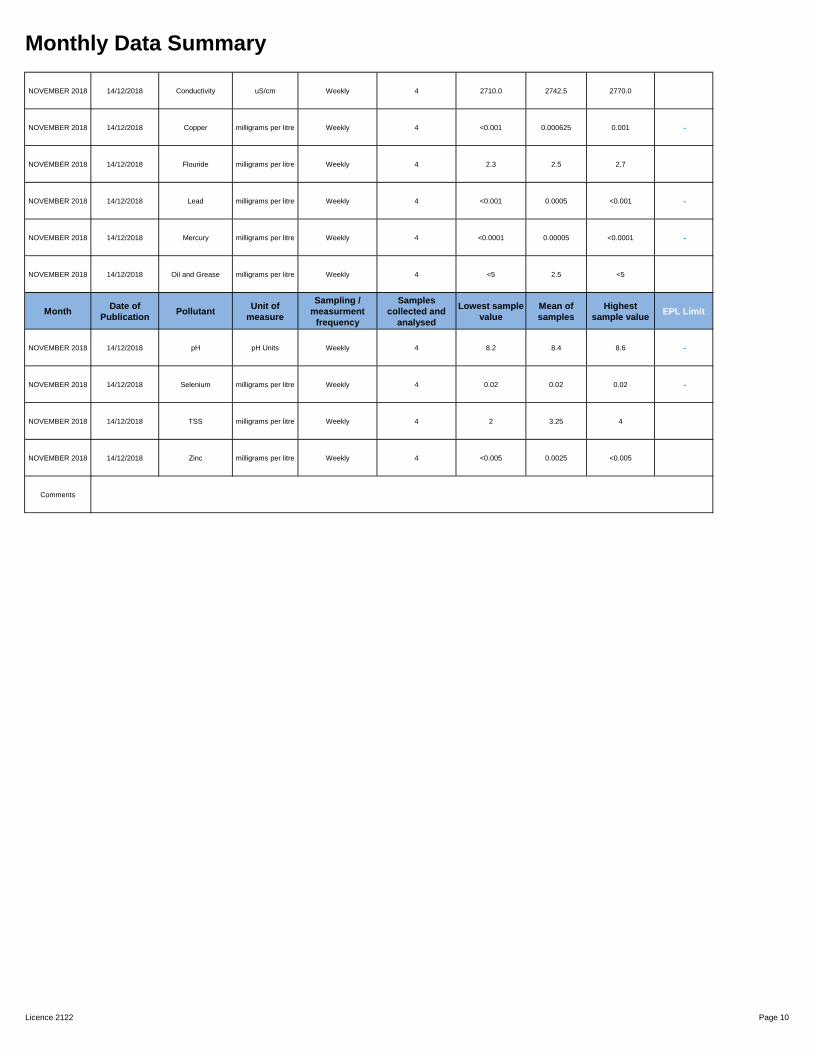
Discharge & Monitoring Point 14
Discharge to waters <301204 East 6416350 North> Update
The skimmer dam overflow spillway, located at the left abutment of the skimmer dam.
MonthDate of
PublicationPollutant
Unit of
measure
Sampling /
measurment
frequency
Samples
collected and
analysed
Lowest sample
value
Mean of
samples
Highest
sample valueEPL Limit
NOVEMBER 2018 14/12/2018 Arsenic milligrams per litre Weekly 4 0.04 0.04725 0.054 -
NOVEMBER 2018 14/12/2018 Boron milligrams per litre Weekly 4 2.02 2.0625 2.09
NOVEMBER 2018 14/12/2018 Cadmium milligrams per litre Weekly 4 <0.0001 0.00005 <0.0001 -
NOVEMBER 2018 14/12/2018 Chromium milligrams per litre Weekly 4 <0.01 0.005 <0.01 -
NOVEMBER 2018 14/12/2018 Chromium (total) milligrams per litre Weekly 4 0.002 0.00325 0.006
Licence 2122 Page 9
Monthly Data Summary
NOVEMBER 2018 14/12/2018 Conductivity uS/cm Weekly 4 2710.0 2742.5 2770.0
NOVEMBER 2018 14/12/2018 Copper milligrams per litre Weekly 4 <0.001 0.000625 0.001 -
NOVEMBER 2018 14/12/2018 Flouride milligrams per litre Weekly 4 2.3 2.5 2.7
NOVEMBER 2018 14/12/2018 Lead milligrams per litre Weekly 4 <0.001 0.0005 <0.001 -
NOVEMBER 2018 14/12/2018 Mercury milligrams per litre Weekly 4 <0.0001 0.00005 <0.0001 -
NOVEMBER 2018 14/12/2018 Oil and Grease milligrams per litre Weekly 4 <5 2.5 <5
MonthDate of
PublicationPollutant
Unit of
measure
Sampling /
measurment
frequency
Samples
collected and
analysed
Lowest sample
value
Mean of
samples
Highest
sample valueEPL Limit
NOVEMBER 2018 14/12/2018 pH pH Units Weekly 4 8.2 8.4 8.6 -
NOVEMBER 2018 14/12/2018 Selenium milligrams per litre Weekly 4 0.02 0.02 0.02 -
NOVEMBER 2018 14/12/2018 TSS milligrams per litre Weekly 4 2 3.25 4
NOVEMBER 2018 14/12/2018 Zinc milligrams per litre Weekly 4 <0.005 0.0025 <0.005
Comments
Licence 2122 Page 10
Monthly Data Summary
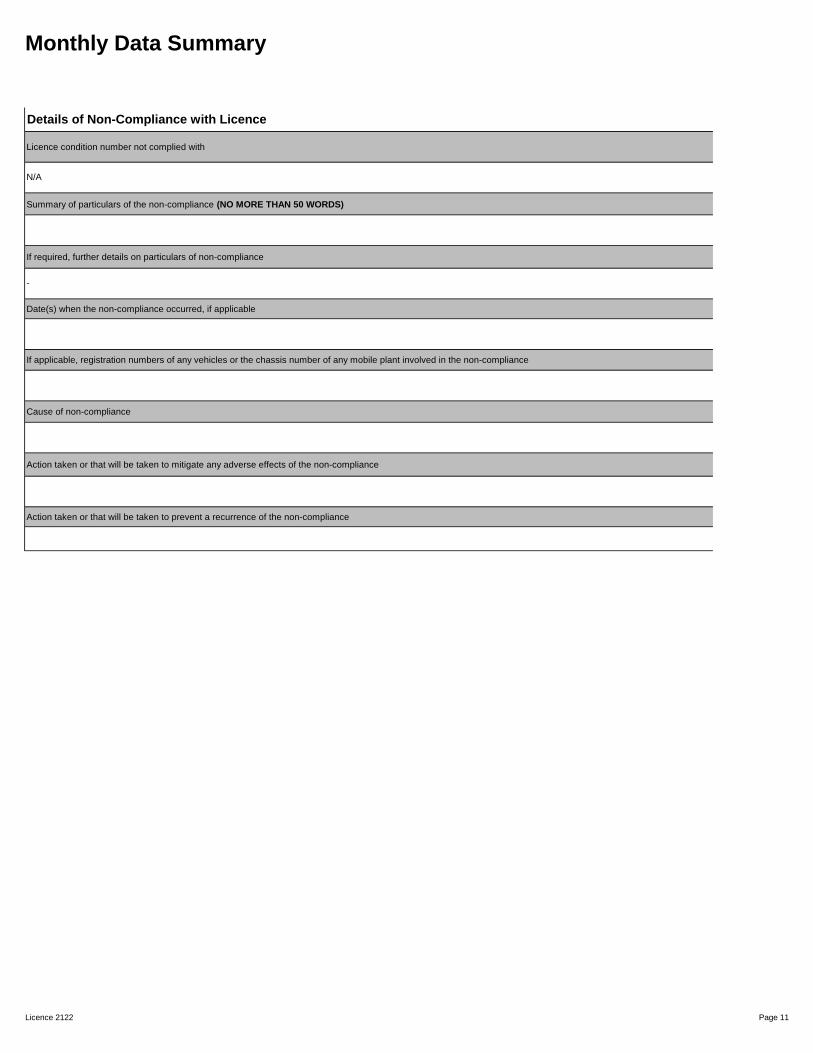
Licence condition number not complied with
Summary of particulars of the non-compliance (NO MORE THAN 50 WORDS)
If required, further details on particulars of non-compliance
Date(s) when the non-compliance occurred, if applicable
If applicable, registration numbers of any vehicles or the chassis number of any mobile plant involved in the non-compliance
Cause of non-compliance
Action taken or that will be taken to mitigate any adverse effects of the non-compliance
Action taken or that will be taken to prevent a recurrence of the non-compliance
Details of Non-Compliance with Licence
N/A
-
Licence 2122 Page 11

Monthly Data Summary
Licence 2122 Page 12

Monthly Data Summary
Licence 2122 Page 13

Monthly Data Summary
Licence 2122 Page 14
Monthly Data Summary
Licence 2122 Page 15

Monthly Data Summary
Licence 2122 Page 16

Monthly Data Summary
Licence 2122 Page 17

Monthly Data Summary
Licence 2122 Page 18

Monthly Data Summary
Licence 2122 Page 19

Monthly Data Summary
Licence 2122 Page 20

Monthly Data Summary
Licence 2122 Page 21

Monthly Data Summary
Licence 2122 Page 22