lic nomura mf factsheet june 2013licnomuramf.com/admin/downloads/lic_nomura_mf_fact... · us, the...
TRANSCRIPT

MUTUAL INTERESTJune, 2013 Investment Managers: LIC Nomura Mutual Fund Asset Management Company Ltd.
lWorld-c lass asset management Access to g loba l research Enhanced of fer ings of serv ices & products l
Mutual Fund investments are subject to market risks, read all scheme related documents carefully
When knowledge andpractice come together
Performance
Presenting

2 MUTUAL INTEREST June, 2013
Mutual Fund investments are subject to market risks, read all scheme related documents carefully
Open-ended Debt scheme providing liquidity and attractive returns.
Growth, Dividend - Reinvestment and Dividend payout option.
T + 1 Redemption facility.
Daily, Weekly, Monthly Dividend.
LIC Nomura MF Income Plus Fundupgraded by ICRA
An open-ended Debt Scheme
A1+mfs
Applicable Criteria is available on ICRA’s website at www.icra.in. All ICRA Credit Ratings are subject to certain Limitations and Disclaimers. Please read these
Limitations and Disclaimers. For Complete rating scale and definitions please refer to ICRA Website or other ICRA rating publications.

MARKET REVIEW
3
Shri S. RamasamyCIO - Debt
DEBT MARKET REVIEW
The Benchmark indices ended positively for the month of May 2013. While BSE Sensex rose by 1.31%, Nifty gained 0.94%. The Reserve Bank of India cut interest rates by 25 basis points this month and India saw its WPI inflation figure ease below 5 percent. India's growth slowed to a decade's low of 5% as 4QFY13 GDP print came in at 4.8% (in line with expectations) and the rupee also had a grim run as it depreciated sharply 3.5% against the dollar.
As we moved to the last leg of the earnings season, we saw mixed results - beats from the likes of Sun Pharma and Tata Steel and misses from other heavyweights like SBI and ONGC.
Sector-wise, among the top gainers were IT, consumer durable and FMCG which rose by 6.23%, 3.53%, and 3.41% respectively. IT stocks rose on positive economic data in the US, the biggest outsourcing market for the Indian IT firms and on value buying after the recent sell-off. Realty, Capital Goods and metal index fell by 11.4%, 3.2% and 1.71% respectively. Fall in the realty index was led by a ~18% fall in its largest constituent DLF (weight of 36%) following its IPP (Institutional Placement Program) of Rs 18bn.
In the pharma sector Ranbaxy had a bad run in May, it was down ~17% as it agreed to pay a fine of $500mn to US FDA on felony charges and market was concerned about the impact of heightened scrutiny of Ranbaxy's drugs on its future sales.
Capital flows:
FIIs were net buyers in the equity to the tune of Rs 17637crore in the month of May and were net buyers in equity to the tune of Rs 78673crore from January 2013 to May 2013. (Source: SEBI)
Outlook:
GDP growth is well below the potential growth rate of 7-7.5% estimated by RBI and other analysts- 4QFY13 GDP grew by 4.8% yoy and the FY13 growth was 5% yoy. WPI inflation for the month of April 2013 came in at 4.9% (and was a pleasant surprise for the markets) while the CPI inflation continues to remain elevated at 9.4%, albeit lower by ~100 bps from the March 2013 print. The moderation in international commodity prices, sustained fiscal discipline exhibited by GoI (fiscal deficit-to-GDP ratio down to 4.9% in FY13 against the budgeted 5.2%) and significant moderation in pricing power of corporates are the likely reasons for the sharp moderation in WPI inflation.
Continued measures like hiking diesel prices by Rs0.5/liter (5th such increase since Jan'13 and cumulative increase of Rs3/- per liter since); electricity tariff hikes by key states like Rajasthan, UP are much needed to correct the artificial demand pressures, align retail prices with their economic prices and add credibility to the fiscal consolidation path.
Political calendar is also heavy for the next 12 months with the elections scheduled for the central and key state legislatures. Political uncertainty could continue to remain an overhang for the markets and prevent a runaway rally. In conclusion, we expect the RBI to adopt a more growth supportive stance in the remainder of the year while the government undertakes action for fiscal consolidation and administrative steps to resolve some of the issues plaguing the investment climate. This macro-economic milieu should be supportive for markets, particularly given reasonable valuations and depressed investor expectations.
Shri Nobutaka KitajimaCIO - Equity
EQUITY MARKET REVIEW
Further to our outlook last month, RBI in its monetary policy on 3rd May 2013, reduced the repo rate by 25 bps bringing it to 7.25%. Reverse repo came down to 6.25% and Marginal standing facility automatically adjusted at 8.25%. Decline in repo rate brought down the general interest rate levels, leading to lowering of borrowing cost for banks and which in trun passed on the benefits to borrowers.
Further Wholesale Price Index(WPI) came down from 6.84% to 4.9% in April 2013, Consumer Price Index (CPI) also came down to 9.4% from 10.91%. With decline in commodity prices and crude oil also helped to reduce the inflation arising due to import. For FY14, RBI projects inflation to be at an average of 5.5 per cent. Declining interest rates does not seem to be linear across maturities and asset classes, making it challenging environment.
Banks have borrowed daily at an average of Rs 96,000 Crores from the RBI under LAF facility. As the advance tax outflow expecting in June quarter, RBI may come up with open market operations to address the liquidity deficit in the system.
Following movements took place in the month of May 2013:
lThe average Call & average CBLO rates were at 7.35% & 7.10% respectively as on 31st May 2013.
lThe 1 year and 5 year OIS ended at 7.22% (7.21%) & 6.98% (6.92%) respectively as on 31st May 2013.
lRBI infused Rs.75,135 crores in the repo auction on 31st May 2013 and absorbed Rs 3,335 crores in the reverse repo auction.
lPSU banks issued 3 months CD at an average yield of 8.15% and 1 year CD at an average of 8.35%.
lThe 10 year bond traded at an average yield of 7.498%.
lThe Rupee Dollar Exchange rate has been in the range of Rupees 53.65 to 56.57 in the month of May 2013 and depreciated compared to the month of April 2013 range of 53.90 to 54.90 and traded at an average of 55.01
lMibor rate were in the range of 7.30% to 7.61% during the month of May and closed at 7.30% on 31st May 2013.
Outlook for the month of June 2013:
With RBI constantly expressing its limited ability for further easing in rates and growing concern over the CAD due to heavy gold imports, the long term yields are likely to harden. However the market expectation of further rate cuts would keep the yields away from steeper rise. With the impact of earlier rate cuts slowly showing effect the short term yields are likely to be soft with a positive bias. The rupee- dollar exchange rate could come in focus in view of action by FIIs who have been heavy buyers in G-Sec oflate.
Benchmark Index Latest Price 1 month return (%)
3 months return (%)
6 months return (%)
S&P BSE SENSEX 19760.30 1.31 4.77 2.17
CNX Nifty Index 5985.95 0.94 5.14 1.80
S&P BSE 100 5991.11 0.84 4.74 1.39
S&P BSE 200 2409.22 0.85 4.39 0.82
S&P BSE 500 7441.89
0.77
3.88 -0.41
S&P BSE Mid-Cap 6389.47
0.72
1.38 -7.43
S&P BSE Small -Cap 5943.46
-1.29
-4.23 -18.31
Benchmark Index Latest Price
1 month return
(%)
3 months
return (%)
6 months
return (%)
S&P BSE IT 6065.34 6.23 -10.20 3.00
S&P BSE AUTO Index 11166.34
1.90
6.77 3.25
S&P BSE BANKEX 14261.24
-0.71
8.01 2.22
S&P BSE Capital Goods
9407.38
-3.20
2.43 -15.10
S&P BSE Consumer
Durables 7695.00
3.53
7.29 -4.19
S&P BSE FMCG 6772.13 3.41 19.46 12.16
S&P BSE Health Care 8846.91 1.79 13.27 11.33
S&P BSE METAL Index 8503.01 -1.71 -6.23 -17.89
S&P BSE OIL & GAS Index 8654.79 -0.65 0.08 4.88
S&P BSE Power Index 1755.12 -0.39 0.63 -11.37
S&P BSE Realty Index 1684.92 -11.4 -16.19 -15.68

LIC NOMURA MF LIQUID FUND
* For Dividend History refer to page no. 26
INVESTMENT OBJECTIVE
An open ended scheme which seeks to generate reasonable returns with low risk and high liquidity through judicious mix of investment in money market instruments and quality debt instruments.
SCHEME FEATURES
FUND MANAGER
EXPENSE RATIO :
PORTFOLIO METRICS
Scheme Type: Debt - Liquid
Launch Date: March 11, 2002
AUM as on 31/05/2013: INR 2569.98 Cr
Load Structure:
Entry Load: Nil
Exit Load: Nil
Benchmark: Crisil Liquid Fund Index
Minimum Investment: Rs. 25000/-
Name: Shri Killol Pandya
For all the plans and options
NAV as on May 31, 2013 Per Unit
Growth 2157.4916
Dividend 1098.0000
Direct Growth 2157.8954
Direct Dividend 1098.0000
0.16%
Average Maturity 19 days
Duration 0.05 yrs
4 MUTUAL INTEREST June, 2013
DISCRETE 12 MONTHS RETURNS
ANNUALISED PERFORMANCE
As on 28 March 2013
As on 31 May 2013
POINT TO POINT RETURNS
As on 28 March 2013
Lumpsum investment of 10,000 invested
Period Fund C Fund~LX 1 year T-bill
Last 1 Year 10,833
Last 2 Years 10,881 10,845 11,547
Last 3 Years 10,635 10,621 11,993
Since Inception 21,264 NA 18,058
10,898 10,818
Since Inception(CAGR)
7.07% NA 5.52%
Period Fund C Fund~LX 1 year T-bill
Mar 30, 2012 To Mar 28, 2013 8.97% 8.17% 8.33%
Mar 31, 2011 To Mar 30, 2012 8.80% 8.44% 6.59%
Mar 31, 2010 To Mar 31, 2011 6.35% 6.21% 3.86%
Period Fund C Fund~LX 1 yr T-bill
Last 7 Days 7.64% 7.28%
Last 15 Days 7.77% 7.14% 5.27%
Last 30 Days 7.98% 8.17% 8.83%
3.58%
ASSET ALLOCATION
PORTFOLIO
Company Industry/Rating % to NavMONEY MARKET INSTRUMENTSCertificate of DepositVIJAYA BANK CARE A1+ 3.88%CANARA BANK CRISIL A1+ 3.87%ALLAHABAD BANK ICRA A1+ 1.94%ALLAHABAD BANK CRISIL A1+ 1.94%SYNDICATE BANK CARE A1+ 1.94%STATE BANK OF HYDERABAD CRISIL A1+ 1.94%KOTAK MAHINDRA BANK LTD CRISIL A1+ 1.94%ANDHRA BANK FITCH A1+ 1.94%PUNJAB NATIONAL BANK CARE A1+ 1.94%CENTRAL BANK OF INDIA ICRA A1+ 0.97%INDIAN BANK FITCH A1+ 0.97%STATE BANK OF PATIALA ICRA A1+ 0.97%ICICI BANK LTD CRISIL A1+ 0.97%CENTRAL BANK OF INDIA CARE A1+ 0.97%STATE BANK OF PATIALA CRISIL A1+ 0.97%IDBI BANK LTD CRISIL A1+ 0.97%ORIENTAL BANK OF COMMERCE CRISIL A1+ 0.97%UNITED BANK OF INDIA CARE A1+ 0.78%Certificate of Deposit Total 29.84%Commercial PaperINDIAN OIL CORPORATION LTD ICRA A1+ 9.70%ADITYA BIRLA FINANCE LTD CRISIL A1+ 4.44%TATA CAPITAL HOUSING FINANCE LTD CRISIL A1+ 3.89%CHENNAI PETROLEUM CORPORATION LTD ICRA A1+ 3.88%MAHINDRA & MAHINDRA FINANCIAL SERVICES LTD CRISIL A1+ 3.87%INDIAN OIL CORPORATION LTD CRISIL A1+ 3.87%BAJAJ FINANCE LTD CRISIL A1+ 3.87%RELIANCE CAPITAL LTD CRISIL A1+ 3.87%INFRASTRUCTURE DEVELOPMENT FINANCE COMPANY LTD ICRA A1+ 2.91%APOLLO TYRES LTD CRISIL A1+ 2.79%GRUH FINANCE LTD ICRA A1+ 1.94%SBI CARDS & PAYMENT SERVICES PVT LTD CRISIL A1+ 1.94%NATIONAL BANK FOR AGRICULTURE AND RURAL DEVELOPMENT CRISIL A1+ 1.94%TATA MOTORS LTD ICRA A1+ 1.94%INDIABULLS HOUSING FINANCE LTD CRISIL A1+ 1.93%L&T FINANCE LTD CARE A1+ 1.93%L & T INFRASTRUCTURE FINANCE CO LTD CARE A1+ 1.93%NATIONAL HOUSING BANK ICRA A1+ 0.97%TATA MOTORS FINANCE LTD CRISIL A1+ 0.97%RELIANCE CAPITAL LTD CARE A1+ 0.97%KOTAK MAHINDRA INVESTMENTS LTD ICRA A1+ 0.97%FULLERTON INDIA CREDIT CO LTD ICRA A1+ 0.97%BLUE STAR LTD CARE A1+ 0.97%L & T HOUSING FINANCE CARE A1+ 0.96%IL&FS FINANCIAL SERVICES LTD ICRA A1+ 0.78%Commercial Paper Total 64.21%MONEY MARKET INSTRUMENTS Total 94.05%Cash & Other ReceivablesCBLO / REPO 5.91%NET RECEIVALBES/(PAYABLES) 0.04%Cash & Other Receivables 5.95%Grand Total 100.00%
MATURITY PROFILE FOR THE PORTFOLIO RATING PROFILE FOR THE PORTFOLIO
CARE A1+, CRISIL A1+,ICRA A1+, FITCH A1+

LIC NOMURA MF SAVINGS PLUS FUND
* For Dividend History refer to page no. 26
INVESTMENT OBJECTIVE
The investment objective of the Scheme is to generate income by investing in a portfolio of quality short term debt securities.
SCHEME FEATURES
FUND MANAGER
NAV
EXPENSE RATIO :
PORTFOLIO METRICS
Scheme Type:
Launch Date: May 29, 2003
AUM as on 31/05/2013: INR 228.72 Cr
Load Structure:
Entry Load: Nil
Exit Load: Nil
Benchmark: Crisil Liquid Fund Index
Minimum Investment: Rs. 5000/-
Name: Shri Killol Pandya
For all the plans and options
NAV as on May 31, 2013 Per Unit
Growth 18.4416
Dividend - Daily 10.0500
Dividend - Weekly 10.0555
Dividend - Monthly 10.0669
Direct Growth 18.4798
Direct Dividend - Daily 10.0500
Direct Dividend - Weekly 10.0559
Direct Dividend - Monthly 10.0683
0.75%
Average Maturity 21 days
Duration 0.05 yrs
Debt - Short Term
5
DISCRETE 12 MONTHS RETURNS
As on 28 March 2013
POINT TO POINT RETURNS
As on 28 March 2013
Lumpsum investment of 10,000 invested
Period Fund C Fund~LX 1 year T-bill
Last 1 Year
Last 2 Years 10,820 10,845 11,547
Last 3 Years 10,619 10,620 11,993
Since Inception 18,207 18,148 16,709
10,826 10,818 10,833
Since Inception6.30% 6.26% 5.87%
(CAGR)
Period Fund C Fund~LX 1 year T-bill
Mar 30, 2012 To Mar 28, 2013 8.26% 8.17% 8.33%
Mar 31, 2011 To Mar 30, 2012 8.20% 8.44% 6.59%
Mar 31, 2010 To Mar 31, 2011 6.19% 6.21% 3.86%
PORTFOLIO
Company Industry/Rating % to Nav
MONEY MARKET INSTRUMENTS
Certificate of Deposit
BANK OF INDIA CRISIL A1+ 10.93%
AXIS BANK LTD CRISIL A1+ 10.87%
ORIENTAL BANK OF COMMERCE CRISIL A1+ 6.47%
Certificate of Deposit Total 28.26%
Commercial Paper
PIRAMAL ENTERPRISES LTD ICRA A1+ 17.38%
ADITYA BIRLA NUVO LTD ICRA A1+ 10.92%
INFRASTRUCTURE DEVELOPMENT FINANCE COMPANY LTD ICRA A1+ 10.92%
RELIANCE CAPITAL LTD CRISIL A1+ 10.84%
ADITYA BIRLA FINANCE LTD CRISIL A1+ 4.35%
MARICO LTD CRISIL A1+ 2.15%
Commercial Paper Total 56.56%
MONEY MARKET INSTRUMENTS Total 84.82%
Cash & Other Receivables
CBLO / Repo 15.66%
Net Receivalbes/(Payables) -0.47%
Cash & Other Receivables 15.18%
Grand Total 100.00%
MATURITY PROFILE FOR THE PORTFOLIO RATING PROFILE FOR THE PORTFOLIO
ASSET ALLOCATION

LIC NOMURA MF FLOATING RATE FUND
* For Dividend History refer to page no. 26
INVESTMENT OBJECTIVE
The investment objective of the Scheme is to generate consistent return by investing mainly in a floating rate instruments / fixed rate instruments swapped for floating rate return so as to minimize the interest rate risk for the investor.
SCHEME FEATURES
FUND MANAGER
NAV
EXPENSE RATIO :
PORTFOLIO METRICS
Scheme Type:
Launch Date: March 15, 2004
AUM as on 31/05/2013: INR 35.24 Cr
Load Structure:
Entry Load: Nil
Exit Load: Nil
Benchmark: Crisil Liquid Fund Index
Minimum Investment: Rs. 5000/-
Name: Shri Killol Pandya
For all the plans and options
NAV as on May 31, 2013 Per Unit
Growth 18.9104
Dividend - Daily 10.0500
Dividend - Weekly 10.1540
Direct Growth 18.9281
Direct Dividend - Daily 10.0500
Direct Dividend - Weekly 10.1471
0.56%
Average Maturity 2 days
Duration 0.01 yrs
Debt - Floating
PORTFOLIO
6 MUTUAL INTEREST 2013June,
DISCRETE 12 MONTHS RETURNS
As on 28 March 2013
POINT TO POINT RETURNS
As on 28 March 2013
Lumpsum investment of 10,000 invested
Period Fund C Fund~LX 1 year T-bill
Last 1 Year
Last 2 Years 10,810 10,845 11,547
Last 3 Years 10,587 10,620 11,993
Since Inception 18,680 17,548 16,085
10,794 10,818 10,833
Since Inception7.21% 6.46% 5.42%
(CAGR)
Period Fund 1 year T-bill
Mar 30, 2012 To Mar 28, 2013 7.94% 8.17% 8.33%
Mar 31, 2011 To Mar 30, 2012 8.10% 8.44% 6.59%
Mar 31, 2010 To Mar 31, 2011 5.87% 6.21% 3.86%
C Fund~LX
Company Industry/Rating % to Nav
MUTUAL FUND
Mutual Fund Units
LICMF LIQUID FUND-GROWTH 29.61%
Mutual Fund Units Total 29.61%
MUTUAL FUND Total 29.61%
Cash & Other Receivables
CBLO / Repo 69.91%
Net Receivalbes/(Payables) 0.48%
Cash & Other Receivables 70.39%
Grand Total 100.00%
ASSET ALLOCATION
MATURITY PROFILE FOR THE PORTFOLIO RATING PROFILE FOR THE PORTFOLIO
Mutual Fund Units
Cash &Other Receivables

LIC NOMURA MF INCOME PLUS FUND
* For Dividend History refer to page no. 26
INVESTMENT OBJECTIVE
An open ended debt scheme which seeks to provide reasonable possible current income - consistent with preservation of capital and providing liquidity - from investing in a diversified portfolio of short-term money market and debt securities.
SCHEME FEATURES
FUND MANAGER
NAV
EXPENSE RATIO :
PORTFOLIO METRICS
Scheme Type:
Launch Date: May 28, 2007
AUM as on 31/05/2013: INR 184.05 Cr
Load Structure:
Entry Load: Nil
Exit Load: Nil
Benchmark: Crisil Liquid Fund Index
Minimum Investment: Rs. 500000/-
Name: Shri Killol Pandya
For all the plans and options
NAV as on May 31, 2013 Per Unit
Growth 15.6335
Dividend - Daily 10.0500
Dividend - Weekly 10.0554
Dividend - Monthly 10.0669
Direct Growth 15.6443
Direct Dividend - Daily 10.0500
Direct Dividend - Weekly 10.0557
Direct Dividend - Monthly 10.0676
0.53%
Average Maturity 21 days
Duration 0.05 yrs
Debt
7
DISCRETE 12 MONTHS RETURNS
As on 28 March 2013
POINT TO POINT RETURNS
As on 28 March 2013
Lumpsum investment of 10,000 invested
Period Fund C Fund~LX 1 year T-bill
Last 1 Year
Last 2 Years 10,863 10,845 11,547
Last 3 Years 10,611 10,620 11,993
Since Inception 15,445 14,823 13,967
10,837 10,818 10,833
Since Inception7.74% 6.98% 6.91%
(CAGR)
Period Fund 1 year T-bill
Mar 30, 2012 To Mar 28, 2013 8.37% 8.17% 8.33%
Mar 31, 2011 To Mar 30, 2012 8.63% 8.44% 6.59%
Mar 31, 2010 To Mar 31, 2011 6.11% 6.21% 3.86%
C Fund~LX
PORTFOLIO
Company Industry/Rating % to Nav
MONEY MARKET INSTRUMENTS
Certificate of Deposit
STATE BANK OF MYSORE ICRA A1+ 13.58%
PUNJAB NATIONAL BANK CARE A1+ 13.58%
ALLAHABAD BANK ICRA A1+ 13.54%
AXIS BANK LTD ICRA A1+ 9.11%
ICICI BANK LTD CARE A1+ 2.12%
Certificate of Deposit Total 51.92%
Commercial Paper
INDIAN OIL CORPORATION LTD ICRA A1+ 13.58%
TATA MOTORS LTD ICRA A1+ 8.02%
MARICO LTD CRISIL A1+ 2.67%
Commercial Paper Total 24.27%
MONEY MARKET INSTRUMENTS Total 76.19%
Cash & Other Receivables
CBLO / REPO 23.80%
NET RECEIVALBES/(PAYABLES) 0.02%
Cash & Other Receivables 23.81%
Grand Total 100.00%
ASSET ALLOCATION
MATURITY PROFILE FOR THE PORTFOLIO RATING PROFILE FOR THE PORTFOLIO
CARE A1+, CRISIL A1+,ICRA A1+
Cash &Other Receivables

LIC NOMURA MF BOND FUND
* For Dividend History refer to page no. 26
INVESTMENT OBJECTIVE
LIC Nomura MF Bond Fund an open-ended Debt Scheme, will endeavor to generate an attractive return for its investors by investing in a portfolio of quality debt securities and money market instruments.
SCHEME FEATURES
FUND MANAGER
NAV
EXPENSE RATIO :
PORTFOLIO METRICS
Scheme Type:
Launch Date: March 26, 1999
AUM as on 31/05/2013: INR 178.41 Cr
Load Structure:
Entry Load: Nil
Exit Load: 0.5% if exit within 6 months from the date of allotment of units
Benchmark: Crisil Composite Bond Fund Index
Minimum Investment: Rs. 5000/-
Name: Shri Y D Prasanna
For all the plans and options
NAV as on May 31, 2013 Per Unit
Growth 33.8145
Dividend 10.5288
Direct Growth 33.8715
Direct Dividend 10.5505
1.82%
Average Maturity 1,913 days
Duration 2.85 years
Debt
8 MUTUAL INTEREST 2013June,
DISCRETE 12 MONTHS RETURNS
As on 28 March 2013
POINT TO POINT RETURNS
As on 28 March 2013
Lumpsum investment of 10,000 invested
Period Fund C CompBex 10 Year GOI
Last 1 Year 11,125
Last 2 Years 10,966 10,767 11,396
Last 3 Years 10,545 10,506 11,922
Since Inception 32,776 NA NA
10,900 10,925
Since Inception8.91% NA NA
(CAGR)
Period Fund 10 year GOI
Mar 30, 2012 To Mar 28, 2013 9.00% 9.24% 11.25%
Mar 31, 2011 To Mar 30, 2012 9.66% 7.68% 2.43%
Mar 31, 2010 To Mar 31, 2011 5.45% 5.06% 4.61%
C CompBex
PORTFOLIO
Company Industry/Rating % to Nav
CORPORATE DEBT
Non-convertible Debentures
NATIONAL BANK FOR AGRICULTURE AND RURAL DEVELOPMENT CRISIL AAA 9.28%
RURAL ELECTRIFICATION CORPORATION LTD CRISIL AAA 6.30%
EXPORT IMPORT BANK OF INDIA CRISIL AAA 6.00%
INDIAN RAILWAY FINANCE CORP LTD CRISIL AAA 5.97%
POWER GRID CORPORATION OF INDIA LTD CRISIL AAA 5.82%
INFRASTRUCTURE DEVELOPMENT FINANCE COMPANY LTD ICRA AAA 5.70%
SUNDARAM FINANCE LTD ICRA AA+ 5.60%
MAHINDRA & MAHINDRA FINANCIAL SERVICES LTD CRISIL AA+ 5.59%
INDIAN OIL CORPORATION LTD CRISIL AAA 3.23%
POWER FINANCE CORPORATION LTD CRISIL AAA 2.85%
SHRIRAM TRANSPORT FINANCE COMPANY LTD FITCH AA 0.03%
NON-CONVERTIBLE DEBENTURES Total 56.38%
Zero Coupon Bond
DEWAN HOUSING FINANCE CORPORATION LTD CARE AA+ 4.69%
Zero Coupon Bond Total 4.69%
CORPORATE DEBT Total 61.07%
MONEY MARKET INSTRUMENTS
Certificate of Deposit
CENTRAL BANK OF INDIA ICRA A1+ 0.56%
Certificate of Deposit Total 0.56%
MONEY MARKET INSTRUMENTS Total 0.56%
GOVERNMENT BOND
9.15% GOI (MD 14/11/2024) SOV 9.46%
8.33% GOI 2026 (M/D 09/07/2026) SOV 9.04%
8.97% GOI (MD 05/12/2030) SOV 3.20%
GOVERNMENT BOND Total 21.70%
Cash & Other Receivables
CBLO / REPO 14.21%
NET RECEIVALBES/(PAYABLES) 2.46%
Cash & Other Receivables 16.67%
Grand Total 100.00%
ASSET ALLOCATION
MATURITY PROFILE FOR THE PORTFOLIO RATING PROFILE FOR THE PORTFOLIO
CARE A1+, CARE AA+,CRISIL A1+, CRISIL AA+,CRISIL AAA, ICRA AAA,ICRA A1+, ICRA AA+,FITCH AA, SOV
Cash &Other Receivables
Non-convertible Debentures
Zero Coupon Bond
Certificate of Deposit
Government Bond
Cash & Other Receivables

LIC NOMURA MF G-SEC FUND
INVESTMENT OBJECTIVE
The primary objective of the scheme is to generate credit risk free and reasonable returns for its investors through investments in sovereign securities issued by the central and /or state Government and /or any security unconditionally guaranteed by the central/ state government for repayment of Principal and interest and/or reverse repos in such securities as and when permitted by RBI.
SCHEME FEATURES
FUND MANAGER
NAV
EXPENSE RATIO :
PORTFOLIO METRICS
Scheme Type:
Launch Date: November 15, 1999
AUM as on 31/05/2013: INR 53.98 Cr
Load Structure:
Entry Load: Nil
Exit Load: 1% if exit within 1 year from the date of allotment of units
Benchmark: I-Sec Composite Gilt Index
Minimum Investment: Rs. 10000/-
Name: Shri Y D Prasanna
For all the plans and options
NAV as on May 31, 2013 Per Unit
PF Growth 15.7632
Regular Growth 27.3467
Direct Regular Growth 27.4033
PF Dividend 10.5042
Regular Dividend 10.5297
Direct Regular Dividend 10.5501
2.21%
Average Maturity 2,696 days
Duration 3.88 years
Debt - Gilt
PORTFOLIO
Company Industry/Rating % to Nav
CORPORATE DEBT
Non-convertible Debentures
National Housing Bank CRISIL AAA 25.90%
Indian Oil Corporation Ltd CRISIL AAA 7.62%
Non-convertible Debentures Total 33.51%
CORPORATE DEBT Total 33.51%
GOVERNMENT BOND
8.97% GOI (MD 05/12/2030) SOV 10.59%
9.15% GOI (MD 14/11/2024) SOV 10.42%
8.33% GOI 2026 (M/D 09/07/2026) SOV 9.96%
8.20% GOI (MD 24/09/2025) SOV 9.85%
8.08% GOI (MD 02/08/2022) SOV 9.63%
7.8% GOI (MD 11/04/2021) SOV 9.43%
GOVERNMENT BOND Total 59.88%
Cash & Other Receivables
CBLO / REPO 3.64%
NET RECEIVALBES/(PAYABLES) 2.97%
Cash & Other Receivables 6.61%
Grand Total 100.00%
9
DISCRETE 12 MONTHS RETURNS
As on 28 March 2013
POINT TO POINT RETURNS
As on 28 March 2013
Lumpsum investment of 10,000 invested
Period Fund 1O Year GOI
Last 1 Year
Last 2 Years 10,625 10,679 11,396
Last 3 Years 10,345 10,641 11,922
Since Inception 26,452 NA NA
10,909 11,164 11,125
Since Inception7.56% NA NA
(CAGR)
Period Fund 10 year GOI
Mar 30, 2012 To Mar 28, 2013 9.09% 11.64% 11.25%
Mar 31, 2011 To Mar 30, 2012 6.25% 6.79% 2.43%
Mar 31, 2010 To Mar 31, 2011 3.45% 6.41% 4.61%
I SecComposite Gilt
I SecComposite Gilt
ASSET ALLOCATION
MATURITY PROFILE FOR THE PORTFOLIO RATING PROFILE FOR THE PORTFOLIO
CRISIL AAA, SOV
Cash &Other Receivables
Non-convertible Debentures

Pharmaceuticals 5.62%
DR. REDDY'S LABORATORIES LTD 2.84%
RANBAXY LABORATORIES LTD 1.09%
SUN PHARMACEUTICALS INDUSTRIES LTD 1.06%
LUPIN LTD 0.33%
CIPLA LTD 0.29%
Power 1.65%
POWER GRID CORPORATION OF INDIA LTD 1.55%
PTC INDIA LTD 0.10%
Software 9.28%
INFOSYS LTD 5.00%
TATA CONSULTANCY SERVICES LTD 2.95%
TECH MAHINDRA LTD 1.20%
HCL TECHNOLOGIES LTD 0.14%
Telecom - Services 2.04%
BHARTI AIRTEL LTD 2.04%
Equity Holdings Total 68.41%
DISCRETE 12 MONTHS RETRUNS
As on 28 March 2013
POINT TO POINT RETURNS
As on 28 March 2013
Lumpsum investment of 10,000 invested
Period Fund C BalanceEx S&P CNXNifty
Last 1 Year 10,729
Last 2 Years 9,833 9,684 9,077
Last 3 Years 10,150 10,935 11,113
Since Inception 34,523 NA NA
10,176 10,818
Since Inception5.35% NA NA
(CAGR)
Period Fund S&P CNX Nifty
Mar 30, 2012 To Mar 28, 2013 1.76% 8.18% 7.31%
Mar 31, 2011 To Mar 30, 2012 -1.67% -3.17% -9.23%
Mar 31, 2010 To Mar 31, 2011 1.50% 9.37% 11.14%
C BalanceEx
LIC NOMURA MF UNIT LINKED INSURANCE SCHEME
INVESTMENT OBJECTIVE
An open ended scheme which seeks to generate long term capital appreciation and offer Tax benefits u/s 80C of the Income Tax Act as well as additional benefits of a life cover and free accident insurance cover.
SCHEME FEATURES
FUND MANAGER
NAV
EXPENSE RATIO :
ANNUAL PORTFOLIO TURNOVER RATIO :
PORTFOLIO METRICS
RISK MEASURES
Scheme Type: Insurance Linked Tax Saving
Launch Date: June 19,1989
AUM as on 31/05/2013: INR 137.54 Cr
Load Structure:
Entry Load: Nil
Exit Load: Nil
Benchmark: Crisil Balanced Fund Index
Minimum Investment:
Rs.10000/- under Single Premium Option
Rs.1000/- under Regular Premium - Yearly Option
Rs.100/- under Regular Premium - Monthly Option
Name: Mr. Surendra Jalani
For all the plans and options
NAV as on May 31, 2013 Per Unit
Dividend 10.4254
Direct Dividend 10.4344
2.25%
1.23 times
Quantitative Indicators - Debt Component
Average Maturity 33 days
Duration 0.08 years
Standard Deviation 1.10%
Sharpe Ratio 0.03
Portfolio Beta 1.04
R squared 0.11
10 MUTUAL INTEREST 2013June,
PORTFOLIO
Company % of Nav
EQUITY HOLDINGS
Auto 5.20%
TATA MOTORS LTD 1.96%
BAJAJ AUTO LTD 1.20%
MARUTI SUZUKI INDIA LTD 0.89%
HERO MOTOCORP LTD 0.70%
MAHINDRA & MAHINDRA LTD 0.44%
Banks 13.88%
ICICI BANK LTD 5.18%
HDFC BANK LTD 3.35%
KOTAK MAHINDRA BANK LTD 2.03%
STATE BANK OF INDIA 1.51%
AXIS BANK LTD 0.88%
YES BANK LTD 0.87%
BANK OF BARODA 0.05%
INDUSIND BANK LTD 0.01%
Cement 3.54%
GRASIM INDUSTRIES LTD 1.61%
ULTRATECH CEMENT LTD 0.78%
AMBUJA CEMENTS LTD 0.63%
ACC LTD 0.52%
Chemicals 0.92%
TATA CHEMICALS LTD 0.92%
CONSTRUCTION PROJECT 2.75%
LARSEN & TOUBRO LTD 2.75%
Consumer Non Durables 8.23%
HINDUSTAN UNILEVER LTD 4.34%
ITC LTD 3.45%
ASIAN PAINTS LTD 0.37%
TATA GLOBAL BEVERAGES LTD 0.08%
Finance 6.29%
HOUSING DEVELOPMENT FINANCE CORPORATION 4.07%
INFRASTRUCTURE DEVELOPMENT FINANCE 2.23%
Minerals/Mining 1.07%
COAL INDIA LTD 1.06%
NMDC LTD 0.01%
Non - Ferrous Metals 1.19%
HINDALCO INDUSTRIES LTD 1.19%
Oil 1.70%
OIL & NATURAL GAS CORPORATION LTD 1.07%
CAIRN INDIA LTD 0.64%
Petroleum Products 5.05%
RELIANCE INDUSTRIES LTD 5.04%
BHARAT PETROLEUM CORPORATION LTD 0.01%
Company Rating % of Nav
CORPORATE BOND SECURITY
Corporate Bond
DR. REDDY'S LABORATORIES LTD ICRA AA+ 0.01%
Corporate Bond Total 0.01%
Floating Rate Note
MAGMA FINCORP LTD CARE AA+ 13.28%
Floating Rate Note Total 13.28%
CORPORATE BOND SECURITY Total 13.29%
MUTUAL FUND
Mutual Fund Units
LIC NOMURA MF LIQUID FUND-DIRECT PLAN-GR OPTION 3.90%
Mutual Fund Units Total 3.90%
MUTUAL FUND Total 3.90%
MONEY MARKET INSTRUMENTS
Certificate of Deposit
ANDHRA BANK CARE A1+ 9.02%
ICICI BANK LTD CARE A1+ 7.10%
Certificate of Deposit Total 16.12%
MONEY MARKET INSTRUMENTS Total 16.12%
Cash & Other Receivables
CBLO / REPO 0.82%
NET RECEIVALBES/(PAYABLES) -2.55%
Cash & Other Receivables -1.73%
Grand Total 100.00%
PORTFOLIO ANALYSIS : SECTOR WISE
ASSET ALLOCATION MATURITY PROFILE FOR THE PORTFOLIO

LIC NOMURA MF BALANCED FUND
INVESTMENT OBJECTIVE
An open ended Income and Growth scheme which seeks to provide regular returns and capital appreciation according to the selection of plan by investing in equities and debt instruments.
SCHEME FEATURES
FUND MANAGER
NAV
EXPENSE RATIO :
ANNUAL PORTFOLIO TURNOVER RATIO :
PORTFOLIO METRICS
RISK MEASURES
Scheme Type:
Launch Date: January 1, 1991
AUM as on 31/05/2013: INR 18.22 Cr
Load Structure:
Entry Load: Nil
Exit Load: 1% if exit within 1 year from the date of allotment of units
Benchmark: Crisil Balanced Fund Index
Minimum Investment: Rs.1000/-
Name: Mr. Surendra Jalani
For all the plans and options
NAV as on May 31, 2013 Per Unit
Growth 61.4004
Dividend 11.6216
Direct Growth 61.4960
Direct Dividend 11.6469
2.33%
1.00 times
Quantitative Indicators - Debt Component
Average Maturity 9 days
Duration 0.02 years
Standard Deviation 1.16%
Sharpe Ratio 0.03
Portfolio Beta 1.00
R squared 0.10
Balanced
11
PORTFOLIO
Company % of Nav
EQUITY HOLDINGS
Auto 5.02%
TATA MOTORS LTD 2.23%
MAHINDRA & MAHINDRA LTD 1.86%
BAJAJ AUTO LTD 0.80%
MARUTI SUZUKI INDIA LTD 0.13%
Banks 14.69%
HDFC BANK LTD 6.54%
ICICI BANK LTD 4.12%
YES BANK LTD 1.64%
KOTAK MAHINDRA BANK LTD 1.63%
AXIS BANK LTD 0.63%
INDUSIND BANK LTD 0.07%
STATE BANK OF INDIA 0.06%
Cement 3.37%
AMBUJA CEMENTS LTD 2.00%
ULTRATECH CEMENT LTD 0.77%
GRASIM INDUSTRIES LTD 0.47%
ACC LTD 0.13%
Construction Project 3.82%
LARSEN & TOUBRO LTD 3.82%
Consumer Non Durables 10.47%
ITC LTD 5.41%
HINDUSTAN UNILEVER LTD 4.86%
ASIAN PAINTS LTD 0.20%
Finance 6.61%
HOUSING DEVELOPMENT FINANCE CORPORATION 4.15%
INFRASTRUCTURE DEVELOPMENT FINANCE 2.46%
Minerals/Mining 0.04%
NMDC LTD 0.04%
Oil 1.90%
OIL & NATURAL GAS CORPORATION LTD 1.79%
CAIRN INDIA LTD 0.11%
DISCRETE 12 MONTHS RETRUNS
As on 28 March 2013
POINT TO POINT RETURNS
As on 28 March 2013
Lumpsum investment of 10,000 invested
Period Fund C BalanceEx Nifty
Last 1 Year
Last 2 Years 9,790 9,684 9,077
Last 3 Years 10,223 10,935 11,113
Since Inception 58,419 NA NA
S&P CNX
10,802 10,818 10,729
Since Inception8.25% NA NA
(CAGR)
Period Fund C BalanceEx S&P CNX Nifty
Mar 30, 2012 To Mar 28, 2013 8.02% 8.18% 7.31%
Mar 31, 2011 To Mar 30, 2012 -2.10% -3.17% -9.23%
Mar 31, 2010 To Mar 31, 2011 2.23% 9.37% 11.14%
Petroleum Products 4.81%
RELIANCE INDUSTRIES LTD 4.75%
BHARAT PETROLEUM CORPORATION LTD 0.05%
Pharmaceuticals 6.34%
SUN PHARMACEUTICALS INDUSTRIES LTD 2.01%
DR. REDDY'S LABORATORIES LTD 1.38%
CIPLA LTD 1.12%
RANBAXY LABORATORIES LTD 1.03%
LUPIN LTD 0.81%
Power 0.31%
POWER GRID CORPORATION OF INDIA LTD 0.31%
Services 0.79%
ADITYA BIRLA NUVO LTD 0.79%
Software 8.57%
INFOSYS LTD 4.90%
TATA CONSULTANCY SERVICES LTD 2.47%
HCL TECHNOLOGIES LTD 1.10%
TECH MAHINDRA LTD 0.11%
Equity Holdings Total 66.74%
PORTFOLIO ANALYSIS : SECTOR WISE
Company Rating % of Nav
CORPORATE BOND SECURITY
Floating Rate Note
MAGMA FINCORP LTD CARE AA+ 18.72%
Floating Rate Note Total 18.72%
CORPORATE BOND SECURITY Total 18.72%
MUTUAL FUND
Mutual Fund Units
LIC NOMURA MF LIQUID FUND-DIR PLAN-GR OPT 12.46%
Mutual Fund Units Total 12.46%
MUTUAL FUND Total 12.46%
Cash & Other Receivables
CBLO / REPO 1.35%
NET RECEIVALBES/(PAYABLES) 0.74%
Cash & Other Receivables 2.09%
Grand Total 100.00%
ASSET ALLOCATION MATURITY PROFILE FOR THE PORTFOLIO

Pharmaceuticals 2.11%
RANBAXY LABORATORIES LTD 0.71%
CIPLA LTD 0.61%
LUPIN LTD 0.28%
SUN PHARMACEUTICALS INDUSTRIES LTD 0.28%
DR. REDDY'S LABORATORIES LTD 0.23%
Power 0.18%
POWER GRID CORPORATION OF INDIA LTD 0.18%
Software 3.67%
INFOSYS LTD 2.08%
TATA CONSULTANCY SERVICES LTD 1.59%
Equity Holdings Total 14.12%
LIC NOMURA MF MONTHLY INCOME PLAN
* For Dividend History refer to page no. 26
INVESTMENT OBJECTIVE
The investment objective of the Scheme is to generate regular income by investing mainly in a portfolio of quality debt securities and money market instruments. It also seeks to generate capital appreciation by investing some percentage in a mix of equity instruments.
PORTFOLIO
Company % Of Nav
EQUITY HOLDINGS
Auto 2.21%
MAHINDRA & MAHINDRA LTD 1.71%
BAJAJ AUTO LTD 0.24%
TATA MOTORS LTD 0.21%
MARUTI SUZUKI INDIA LTD 0.05%
Banks 1.78%
ICICI BANK LTD 1.33%
KOTAK MAHINDRA BANK LTD 0.23%
HDFC BANK LTD 0.17%
INDUSIND BANK LTD 0.03%
STATE BANK OF INDIA 0.02%
Cement 0.84%
ULTRATECH CEMENT LTD 0.42%
AMBUJA CEMENTS LTD 0.21%
GRASIM INDUSTRIES LTD 0.19%
ACC LTD 0.03%
Construction Project 0.02%
LARSEN & TOUBRO LTD 0.02%
Consumer Non Durables 2.25%
ITC LTD 1.43%
HINDUSTAN UNILEVER LTD 0.60%
ASIAN PAINTS LTD 0.22%
Finance 0.98%
HOUSING DEVELOPMENT FINANCE CORPORATION 0.94%
INFRASTRUCTURE DEVELOPMENT FINANCE 0.03%
Minerals/Mining 0.02%
NMDC LTD 0.02%
Oil 0.04%
CAIRN INDIA LTD 0.04%
Petroleum Products 0.02%
BHARAT PETROLEUM CORPORATION LTD 0.02%
Company Rating % of Nav
CORPORATE BOND SECURITY
Floating Rate Note
MAGMA FINCORP LTD CARE AA+ 28.40%
Floating Rate Note Total 28.40%
CORPORATE BOND SECURITY Total 28.40%
MUTUAL FUND
Mutual Fund Units
LIC NOMURA MF LIQUID FUND-DIR PLAN-GR OPT 1.84%
Mutual Fund Units Total 1.84%
MUTUAL FUND Total 1.84%
MONEY MARKET INSTRUMENTS
Certificate of Deposit
ICICI BANK LTD CARE A1+ 32.39%
BANK OF MAHARASHTRA CRISIL A1+ 10.79%
IDBI BANK LTD ICRA A1+ 5.51%
ANDHRA BANK CARE A1+ 4.22%
Certificate of Deposit Total 52.91%
MONEY MARKET INSTRUMENTS Total 52.91%
Cash & Other Receivables
CBLO / REPO 2.98%
NET RECEIVALBES/(PAYABLES) -0.25%
Cash & Other Receivables 2.74%
Grand Total 100.00%
SCHEME FEATURES
FUND MANAGER
NAV
EXPENSE RATIO :
ANNUAL PORTFOLIO TURNOVER RATIO :
PORTFOLIO METRICS
RISK MEASURES
Scheme Type:
Launch Date: June 1, 2003
AUM as on 31/05/2013: INR 46.66 Cr
Load Structure:
Entry Load: Nil
Exit Load: 1% if exit within 1 year from the date of allotment of units
Benchmark: Crisil MIP Blended Index
Minimum Investment: Rs.5000/-
Name: Mr. Surendra Jalani
For all the plans and options
NAV as on May 31, 2013 Per Unit
Growth 36.3264
Dividend - Monthly 10.3173
Dividend - Quarterly 10.5171
Dividend - Yearly 10.8299
Direct Growth 36.3984
Direct Dividend - Monthly 10.3395
Direct Dividend - Quarterly 10.5389
Direct Dividend - Yearly 10.8526
2.14%
1.70 times
Quantitative Indicators - Debt Component
Average Maturity 71 days
Duration 0.18 years
Standard Deviation 1.96%
Sharpe Ratio 0.02
Portfolio Beta 0.37
R squared 0.02
Hybrid
12 MUTUAL INTEREST 2013June,
DISCRETE 12 MONTHS RETRUNS
As on 28 March 2013
POINT TO POINT RETURNS
As on 28 March 2013
Lumpsum investment of 10,000 invested
Period Fund C MIPex 10 Years GOI
Last 1 Year
Last 2 Years 10,168 10,523 11,396
Last 3 Years 10,373 10,616 11,922
Since Inception 21,396 21,407 16,554
10,740 10,906 11,125
Since Inception8.04% 8.05% 5.76%
(CAGR)
Period Fund 10 Yrs GOI
Mar 30, 2012 To Mar 28, 2013 7.40% 9.06% 11.25%
Mar 31, 2011 To Mar 30, 2012 1.68% 5.24% 2.43%
Mar 31, 2010 To Mar 31, 2011 3.73% 6.17% 4.61%
C MIPex
PORTFOLIO ANALYSIS : SECTOR WISE
ASSET ALLOCATION MATURITY PROFILE FOR THE PORTFOLIO

PORTFOLIO
LIC NOMURA MF CHILDREN'S FUND
INVESTMENT OBJECTIVE
An open ended scheme which seeks to generate long term capital growth through a judicious mix of investment in quality debt securities and equities with relatively low risk levels through research based investments.
Company % of Nav
EQUITY HOLDINGS
Auto 8.46%
TATA MOTORS LTD 3.17%
MAHINDRA & MAHINDRA LTD 2.46%
MARUTI SUZUKI INDIA LTD 1.63%
BAJAJ AUTO LTD 1.03%
HERO MOTOCORP LTD 0.18%
Banks 16.84%
HDFC BANK LTD 7.11%
ICICI BANK LTD 4.21%
AXIS BANK LTD 2.90%
STATE BANK OF INDIA 1.14%
YES BANK LTD 0.99%
INDUSIND BANK LTD 0.26%
KOTAK MAHINDRA BANK LTD 0.24%
Cement 2.38%
AMBUJA CEMENTS LTD 1.48%
ULTRATECH CEMENT LTD 0.38%
GRASIM INDUSTRIES LTD 0.35%
ACC LTD 0.17%
Construction Project 2.56%
LARSEN & TOUBRO LTD 2.56%
Consumer Non Durables 9.83%
ITC LTD 5.92%
HINDUSTAN UNILEVER LTD 3.42%
ASIAN PAINTS LTD 0.49%
Ferrous Metals 0.65%
TATA STEEL LTD 0.65%
Finance 5.50%
HOUSING DEVELOPMENT FINANCE CORPORATION 4.60%
INFRASTRUCTURE DEVELOPMENT FINANCE 0.91%
Minerals/Mining 0.71%
NMDC LTD 0.71%
Oil 1.16%
CAIRN INDIA LTD 1.16%
Petroleum Products 4.92%
RELIANCE INDUSTRIES LTD 4.73%
BHARAT PETROLEUM CORPORATION LTD 0.19%
Company Rating % of Nav
CORPORATE BOND SECURITY
Corporate Bond
SHRIRAM TRANS FINAN COMPANY LTD FITCH AA 11.05%
Corporate Bond Total 11.05%
CORPORATE BOND SECURITY Total 11.05%
MUTUAL FUND
Mutual Fund Units
LIC NOMURA MF LIQUID FUND-DIR PLAN-GR OPT 9.58%
Mutual Fund Units Total 9.58%
MUTUAL FUND Total 9.58%
MONEY MARKET INSTRUMENTS
Certificate of Deposit
IDBI BANK LTD ICRA A1+ 10.10%
Certificate of Deposit Total 10.10%
MONEY MARKET INSTRUMENTS Total 10.10%
Cash & Other Receivables
CBLO / REPO 2.48%
NET RECEIVALBES/(PAYABLES) 0.08%
Cash & Other Receivables 2.56%
Grand Total 100.00%
SCHEME FEATURES
FUND MANAGER
NAV
EXPENSE RATIO :
ANNUAL PORTFOLIO TURNOVER RATIO :
PORTFOLIO METRICS
RISK MEASURES
Scheme Type:
Launch Date: September 26, 2001
AUM as on 31/05/2013: INR 4.94 Cr
Load Structure:
Entry Load: Nil
Exit Load: 1% if exit within 1 year from the date of allotment of units
Benchmark: Crisil Balanced Fund Index
Minimum Investment: Rs.5000/-
Name: Mr. Surendra Jalani
For all the plans and options
NAV as on May 31, 2013 Per Unit
Growth 10.5719
Direct Growth 10.5992
2.31%
0.90 times
Quantitative Indicators - Debt Component
Average Maturity 51 days
Duration 0.09 years
Standard Deviation 1.16%
Sharpe Ratio 0.00
Portfolio Beta 1.16
R squared 0.12
Balanced
13
* For Dividend History refer to page no. 26
DISCRETE 12 MONTHS RETRUNS
As on 28 March 2013
POINT TO POINT RETURNS
As on 28 March 2013
Lumpsum investment of 10,000 invested
Period Fund C BalanceEx S&P CNX Nifty
Last 1 Year
Last 2 Years 9,137 9,684 9,077
Last 3 Years 10,098 10,935 11,113
Since Inception 10,094 NA 56,213
10,489 10,818 10,729
Since Inception0.08% NA 16.99%
(CAGR)
Period Fund S&P CNX Nifty
Mar 30, 2012 To Mar 28, 2013 4.89% 8.18% 7.31%
Mar 31, 2011 To Mar 30, 2012 -8.63% -3.17% -9.23%
Mar 31, 2010 To Mar 31, 2011 0.98% 9.37% 11.14%
C BalanceEx
Pharmaceuticals 3.75%
DR. REDDY'S LABORATORIES LTD 1.48%
CIPLA LTD 0.98%
LUPIN LTD 0.75%
SUN PHARMACEUTICALS INDUSTRIES LTD 0.55%
Power 0.18%
POWER GRID CORPORATION OF INDIA LTD 0.18%
Software 8.84%
INFOSYS LTD 4.52%
TATA CONSULTANCY SERVICES LTD 3.87%
HCL TECHNOLOGIES LTD 0.45%
Telecom - Services 0.92%
BHARTI AIRTEL LTD 0.92%
Equity Holdings Total 66.71%
ASSET ALLOCATION MATURITY PROFILE FOR THE PORTFOLIO
PORTFOLIO ANALYSIS : SECTOR WISE

PORTFOLIO
LIC NOMURA MF FLOATER MIP
INVESTMENT OBJECTIVE
The investment objective of the scheme is to generate regular income by investing mainly in floating rate instruments / fixed rate instruments swapped for floating rate return so as to minimize the interest rate risk and at the same time aiming at generating capital appreciation in a long term investing in equity/equity related instruments.
Company % of Nav
EQUITY HOLDINGS
Auto 1.63%
MAHINDRA & MAHINDRA LTD 1.45%
TATA MOTORS LTD 0.10%
MARUTI SUZUKI INDIA LTD 0.05%
BAJAJ AUTO LTD 0.03%
Banks 1.54%
HDFC BANK LTD 1.32%
ICICI BANK LTD 0.20%
INDUSIND BANK LTD 0.02%
Cement 0.36%
AMBUJA CEMENTS LTD 0.18%
GRASIM INDUSTRIES LTD 0.16%
ACC LTD 0.02%
Construction Project 1.84%
LARSEN & TOUBRO LTD 1.84%
Consumer Non Durables 0.39%
ASIAN PAINTS LTD 0.18%
ITC LTD 0.11%
HINDUSTAN UNILEVER LTD 0.09%
Finance 2.03%
INFRASTRUCTURE DEVELOPMENT FINANCE 1.36%
HOUSING DEVELOPMENT FINANCE CORPORATION 0.67%
Minerals/Mining 0.01%
NMDC LTD 0.01%
Oil 0.04%
CAIRN INDIA LTD 0.04%
Petroleum Products 0.40%
RELIANCE INDUSTRIES LTD 0.38%
BHARAT PETROLEUM CORPORATION LTD 0.02%
Company Rating % of Nav
CORPORATE BOND SECURITY
Floating Rate Note
MAGMA FINCORP LTD CARE AA+ 29.41%
Floating Rate Note Total 29.41%
CORPORATE BOND SECURITY Total 29.41%
MUTUAL FUND
Mutual Fund Units
LIC NOMURA MF LIQUID FUND-DIR PLAN-GR OPT 1.70%
Mutual Fund Units Total 1.70%
MUTFUND Total 1.70%
Money Market Instruments
Certificate of Deposit
ICICI Bank Ltd CARE A1+ 29.36%
Bank of Maharashtra CRISIL A1+ 27.49%
Certificate of Deposit Total 56.85%
Money Market Instruments Total 56.85%
Cash & Other Receivables
CBLO / REPO 1.32%
NET RECEIVALBES/(PAYABLES) -0.63%
Cash & Other Receivables 0.69%
Grand Total 100.00%
SCHEME FEATURES
FUND MANAGER
NAV
EXPENSE RATIO :
ANNUAL PORTFOLIO TURNOVER RATIO :
PORTFOLIO METRICS
RISK MEASURES
Scheme Type:
Launch Date: September 21, 2004
AUM as on 31/05/2013: INR 53.23 Cr
Load Structure:
Entry Load: Nil
Exit Load: 1% if exit within 1 year from the date of allotment of units
Benchmark: Crisil MIP Blended Index
Minimum Investment: Rs.5000/-
Name: Mr. Surendra Jalani
For all the plans and options
NAV as on May 31, 2013 Per Unit
Growth 20.6497
Dividend - Monthly 10.1998
Dividend - Quarterly 10.4287
Dividend - Yearly 10.9368
Direct Growth 19.6626
Direct Dividend - Monthly
Direct Dividend - Quarterly 10.4271
Direct Dividend - Yearly 10.9355
1.69%
2.18 times
Quantitative Indicators - Debt Component
Average Maturity 77 days
Duration 0.19 years
Standard Deviation 0.34%
Sharpe Ratio 0.06
Portfolio Beta 0.54
R squared 0.16
Hybrid
14 MUTUAL INTEREST 2013June,
* For Dividend History refer to page no. 26
DISCRETE 12 MONTHS RETRUNS
As on 28 March 2013
POINT TO POINT RETURNS
As on 28 March 2013
Lumpsum investment of 10,000 invested
Period Fund C MIPex 10 Years GOI
Last 1 Year
Last 2 Years 10,354 10,523 11,396
Last 3 Years 10,643 10,616 11,922
Since Inception 20,295 19,058 15,786
10,708 10,906 11,125
Since Inception8.77% 7.96% 5.87%
(CAGR)
Period Fund 10 Yrs GOI
Mar 30, 2012 To Mar 28, 2013 7.08% 9.06% 11.25%
Mar 31, 2011 To Mar 30, 2012 3.54% 5.24% 2.43%
Mar 31, 2010 To Mar 31, 2011 6.43% 6.17% 4.61%
C MIPex
PORTFOLIO ANALYSIS : SECTOR WISE
ASSET ALLOCATION MATURITY PROFILE FOR THE PORTFOLIO
Pharmaceuticals 2.16%
CIPLA LTD 0.84%
BIOCON LTD 0.54%
RANBAXY LABORATORIES LTD 0.35%
SUN PHARMACEUTICALS INDUSTRIES LTD 0.24%
DR. REDDY'S LABORATORIES LTD 0.20%
Power 0.11%
POWER GRID CORPORATION OF INDIA LTD 0.11%
Software 0.86%
INFOSYS LTD 0.63%
TATA CONSULTANCY SERVICES LTD 0.23%
Equity Holdings Total 11.36%

DISCRETE 12 MONTHS RETRUNS
As on 28 March 2013
POINT TO POINT RETURNS
As on 28 March 2013
Lumpsum investment of 10,000 invested
Period Fund BSE Sensex Nifty
Last 1 Year
Last 2 Years 8,904 8,946 9,077
Last 3 Years 10,925 11,103 11,113
Since Inception 29,913 44,927 47,473
10,666 10,831 10,729
Since Inception7.60% 10.56% 10.94%
(CAGR)
Period Fund BSE Sensex Nifty
Mar 30, 2012 To Mar 28, 2013 6.68% 8.23% 7.31%
Mar 31, 2011 To Mar 30, 2012 -10.95% -10.50% -9.23%
Mar 31, 2010 To Mar 31, 2011 9.25% 10.94% 11.14%
SCHEME FEATURES
FUND MANAGER
NAV
EXPENSE RATIO :
ANNUAL PORTFOLIO TURNOVER RATIO :
RISK MEASURES
Scheme Type:
Launch Date: April 16, 1998
AUM as on 31/05/2013: INR 333.82 Cr
Load Structure:
Entry Load: Nil
Exit Load: 1% if exit within 1 year from the date of allotment of units
Benchmark: BSE Sensex
Minimum Investment: Rs. 2000/-
Name: Shri Nobutaka Kitajima
For all the plans and options
NAV As on May 31, 2013 Per Unit
Growth 26.6927
Dividend 10.5192
Direct Growth 26.7095
Direct Dividend 10.5323
2.19%
1.37 times
Standard Deviation 1.62
Sharpe Ratio 0.03
Portfolio Beta 0.90
Equity - Diversified
LIC NOMURA MF EQUITY FUND
An open ended pure Growth scheme seeking to provide capital growth by investing mainly in mix of equity instruments. The investment portfolio of the scheme will be constantly monitored and reviewed to optimize capital growth.
INVESTMENT OBJECTIVE
PORTFOLIO
Company % of Nav
EQUITY HOLDINGS
Auto 9.40%
TATA MOTORS LTD 4.30%
MAHINDRA & MAHINDRA LTD 2.97%
BAJAJ AUTO LTD 2.14%
Auto Ancillaries 1.85%
BOSCH LTD 1.85%
Banks 28.08%
ICICI BANK LTD 7.72%
HDFC BANK LTD 7.38%
STATE BANK OF INDIA 4.69%
AXIS BANK LTD 2.31%
KOTAK MAHINDRA BANK LTD 2.24%
CANARA BANK 2.00%
BANK OF INDIA 1.74%
Construction Project 6.26%
LARSEN & TOUBRO LTD 6.26%
Consumer Non Durables 10.76%
ITC LTD 8.07%
COLGATE PALMOLIVE (INDIA) LTD 2.04%
VST INDUSTRIES LTD 0.39%
NESTLE INDIA LTD 0.25%
Ferrous Metals 1.90%
TATA STEEL LTD 1.90%
Finance 1.49%
POWER FINANCE CORPORATION LTD 1.49%
Gas 2.11%
PETRONET LNG LTD 2.11%
Industrial Capital Goods 1.61%
CROMPTON GREAVES LTD 1.61%
Industrial Products 1.34%
SKF INDIA LTD 1.34%
Media & Entertainment 1.27%
ZEE ENTERTAINMENT ENTERPRISES LTD 1.27%
Minerals/Mining 0.93%
COAL INDIA LTD 0.93%
Non - Ferrous Metals 0.30%
HINDUSTAN ZINC LTD 0.30%
Oil 3.23%
OIL & NATURAL GAS CORPORATION LTD 2.26%
CAIRN INDIA LTD 0.97%
Petroleum Products 6.43%
RELIANCE INDUSTRIES LTD 6.43%
Pharmaceuticals 8.35%
SUN PHARMACEUTICALS INDUSTRIES LTD 2.13%
LUPIN LTD 2.07%
CIPLA LTD 1.94%
RANBAXY LABORATORIES LTD 1.73%
DR. REDDY'S LABORATORIES LTD 0.48%
Software 10.03%
INFOSYS LTD 7.28%
PERSISTENT SYSTEMS LTD 1.50%
WIPRO LTD 1.25%
Telecom - Services 2.98%
BHARTI AIRTEL LTD 2.33%
IDEA CELLULAR LTD 0.64%
Equity Holdings Total 98.29%
MUTUAL FUND
Mutual Fund Units
LIC NOMURA MF LIQUID FUND-DIR PLAN-GR OPT 0.85%
Mutual Fund Units Total 0.85%
MUTUAL FUND Total 0.85%
Cash & Other Receivables
CBLO / REPO 0.28%
NET RECEIVALBES/(PAYABLES) 0.58%
Cash & Other Receivables 0.86%
Grand Total 100.00%
15
PORTFOLIO ANALYSIS : SECTOR WISE ASSET ALLOCATION

SCHEME FEATURES
FUND MANAGER
NAV
EXPENSE RATIO :
ANNUAL PORTFOLIO TURNOVER RATIO:
RISK MEASURES
Scheme Type:
Launch Date: September 1, 1999
AUM as on 31/05/2013: INR 75.44 Cr
Load Structure:
Entry Load: Nil
Exit Load: 1% if exit within 1 year from the date of allotment of units
Benchmark: BSE Sensex
Minimum Investment: Rs. 2000/-
Name: Shri Nobutaka Kitajima
For all the plans and options
NAV As on May 31, 2013 Per Unit
Growth 13.1188
Dividend 11.6339
Direct Growth 13.1454
Direct Dividend 11.6191
2.25%
0.59 times
Standard Deviation 1.59
Sharpe Ratio 0.04
Portfolio Beta 0.86
Equity - Diversified
LIC NOMURA MF GROWTH FUND
An open ended pure Growth scheme seeking to provide capital growth by investing mainly in equity instruments and also in debt and other permitted instruments of capital and money markets. The investment portfolio of the scheme will be constantly monitored and reviewed to optimize capital growth.
INVESTMENT OBJECTIVE
16 MUTUAL INTEREST 2013June,
PORTFOLIO
Company % of Nav
EQUITY HOLDINGS
Auto 9.27%
TATA MOTORS LTD 4.54%
MAHINDRA & MAHINDRA LTD 2.52%
BAJAJ AUTO LTD 2.22%
Auto Ancillaries 2.04%
BOSCH LTD 2.04%
Banks 27.56%
ICICI BANK LTD 8.71%
HDFC BANK LTD 7.52%
STATE BANK OF INDIA 4.95%
KOTAK MAHINDRA BANK LTD 3.47%
AXIS BANK LTD 2.92%
Construction Project 6.48%
LARSEN & TOUBRO LTD 6.48%
Consumer Non Durables 14.34%
ITC LTD 8.51%
HINDUSTAN UNILEVER LTD 2.18%
COLGATE PALMOLIVE (INDIA) LTD 2.17%
NESTLE INDIA LTD 1.48%
Finance 2.09%
POWER FINANCE CORPORATION LTD 2.09%
Gas 2.51%
PETRONET LNG LTD 2.51%
Media & Entertainment 4.84%
ZEE ENTERTAINMENT ENTERPRISES LTD 3.03%
D.B.CORP LTD 1.29%
DISH TV INDIA LTD 0.51%
Minerals/Mining 0.81%
GUJARAT MINERAL DEVELOPMENT CORP LTD 0.81%
Oil 5.70%
OIL & NATURAL GAS CORPORATION LTD 3.67%
CAIRN INDIA LTD 2.03%
Pharmaceuticals 6.99%
LUPIN LTD 2.71%
SUN PHARMACEUTICALS INDUSTRIES LTD 2.36%
CIPLA LTD 1.93%
Software 12.19%
INFOSYS LTD 3.40%
HCL TECHNOLOGIES LTD 2.82%
TATA CONSULTANCY SERVICES LTD 2.27%
WIPRO LTD 1.95%
PERSISTENT SYSTEMS LTD 1.74%
Telecom - Services 3.18%
BHARTI AIRTEL LTD 3.18%
Equity Holdings Total 98.02%
MUTUAL FUND
Mutual Fund Units
LIC NOMURA MF LIQUID FUND-
DIRECT PLAN-GR OPTION 0.00%
Mutual Fund Units Total 0.00%
MUTUAL FUND Total 0.00%
Cash & Other Receivables
CBLO / REPO 4.30%
NET RECEIVALBES/(PAYABLES) -2.32%
Cash & Other Receivables 1.98%
Grand Total 100.00%
DISCRETE 12 MONTHS RETRUNS
As on 28 March 2013
POINT TO POINT RETURNS
As on 28 March 2013
Lumpsum investment of 10,000 invested
Period Fund BSE Sensex Nifty
Last 1 Year
Last 2 Years 8,981 8,946 9,077
Last 3 Years 10,922 11,103 11,113
Since Inception 27,040 39,042 40,302
10,552 10,831 10,729
Since Inception7.60% 10.55% 11.32%
(CAGR)
Period Fund BSE Sensex Nifty
Mar 30, 2012 To Mar 28, 2013 5.52% 8.23% 7.31%
Mar 31, 2011 To Mar 30, 2012 -10.21% -10.50% -9.23%
Mar 31, 2010 To Mar 31, 2011 9.22% 10.94% 11.14%
PORTFOLIO ANALYSIS : SECTOR WISE ASSET ALLOCATION
SCHEME FEATURES
FUND MANAGER
NAV
EXPENSE RATIO :
ANNUAL PORTFOLIO TURNOVER RATIO:
RISK MEASURES
Scheme Type:
Launch Date: April 17, 2000
AUM as on 31/05/2013: INR 29.81 Cr
Load Structure:
Entry Load: Nil
Exit Load: Nil
Benchmark: BSE Sensex
Minimum Investment: Rs. 500/-
Offered under ELSS - 3 years lock-in period
Name: Shri Nobutaka Kitajima
For all the plans and options
NAV as on May 31, 2013 Per Unit
Growth 29.6311
Dividend 10.6088
Direct Growth 29.7602
Direct Dividend 10.6505
2.31%
0.16 times
Standard Deviation 1.92%
Sharpe Ratio 0.03
Portfolio Beta 0.86
Equity Linked Savings Scheme
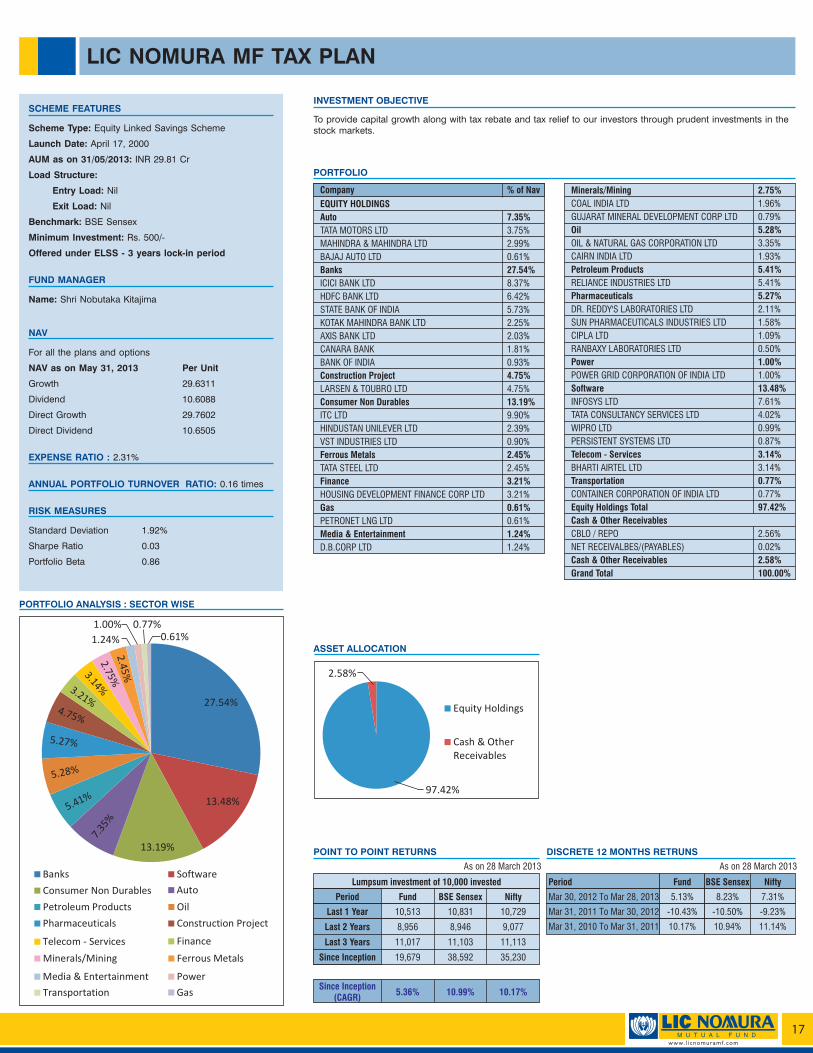
LIC NOMURA MF TAX PLAN
To provide capital growth along with tax rebate and tax relief to our investors through prudent investments in the stock markets.
INVESTMENT OBJECTIVE
PORTFOLIO
Company % of Nav
EQUITY HOLDINGS
Auto 7.35%
TATA MOTORS LTD 3.75%
MAHINDRA & MAHINDRA LTD 2.99%
BAJAJ AUTO LTD 0.61%
Banks 27.54%
ICICI BANK LTD 8.37%
HDFC BANK LTD 6.42%
STATE BANK OF INDIA 5.73%
KOTAK MAHINDRA BANK LTD 2.25%
AXIS BANK LTD 2.03%
CANARA BANK 1.81%
BANK OF INDIA 0.93%
Construction Project 4.75%
LARSEN & TOUBRO LTD 4.75%
Consumer Non Durables 13.19%
ITC LTD 9.90%
HINDUSTAN UNILEVER LTD 2.39%
VST INDUSTRIES LTD 0.90%
Ferrous Metals 2.45%
TATA STEEL LTD 2.45%
Finance 3.21%
HOUSING DEVELOPMENT FINANCE CORP LTD 3.21%
Gas 0.61%
PETRONET LNG LTD 0.61%
Media & Entertainment 1.24%
D.B.CORP LTD 1.24%
Minerals/Mining 2.75%
COAL INDIA LTD 1.96%
GUJARAT MINERAL DEVELOPMENT CORP LTD 0.79%
Oil 5.28%
OIL & NATURAL GAS CORPORATION LTD 3.35%
CAIRN INDIA LTD 1.93%
Petroleum Products 5.41%
RELIANCE INDUSTRIES LTD 5.41%
Pharmaceuticals 5.27%
DR. REDDY'S LABORATORIES LTD 2.11%
SUN PHARMACEUTICALS INDUSTRIES LTD 1.58%
CIPLA LTD 1.09%
RANBAXY LABORATORIES LTD 0.50%
Power 1.00%
POWER GRID CORPORATION OF INDIA LTD 1.00%
Software 13.48%
INFOSYS LTD 7.61%
TATA CONSULTANCY SERVICES LTD 4.02%
WIPRO LTD 0.99%
PERSISTENT SYSTEMS LTD 0.87%
Telecom - Services 3.14%
BHARTI AIRTEL LTD 3.14%
Transportation 0.77%
CONTAINER CORPORATION OF INDIA LTD 0.77%
Equity Holdings Total 97.42%
Cash & Other Receivables
CBLO / REPO 2.56%
NET RECEIVALBES/(PAYABLES) 0.02%
Cash & Other Receivables 2.58%
Grand Total 100.00%
17
DISCRETE 12 MONTHS RETRUNS
As on 28 March 2013
POINT TO POINT RETURNS
As on 28 March 2013
Lumpsum investment of 10,000 invested
Period Fund BSE Sensex Nifty
Last 1 Year
Last 2 Years 8,956 8,946 9,077
Last 3 Years 11,017 11,103 11,113
Since Inception 19,679 38,592 35,230
10,513 10,831 10,729
Since Inception5.36% 10.99% 10.17%
(CAGR)
Period Fund BSE Sensex Nifty
Mar 30, 2012 To Mar 28, 2013 5.13% 8.23% 7.31%
Mar 31, 2011 To Mar 30, 2012 -10.43% -10.50% -9.23%
Mar 31, 2010 To Mar 31, 2011 10.17% 10.94% 11.14%
PORTFOLIO ANALYSIS : SECTOR WISE
ASSET ALLOCATION

SCHEME FEATURES
FUND MANAGER
NAV
EXPENSE RATIO :
ANNUAL PORTFOLIO TURNOVER RATIO :
RISK MEASURES
Scheme Type:
Launch Date: November 15, 2002
AUM as on 31/05/2013: INR 15.76 Cr
Load Structure:
Entry Load: Nil
Exit Load: 1% if exit within 1 year from the date of allotment of units
Benchmark: BSE Sensex
Minimum Investment: Rs. 2000/-
Name: Shri Nobutaka Kitajima
For all the plans and options
NAV as on May 31, 2013 Per Unit
Growth 37.3220
Dividend 12.7921
Direct Growth 37.4003
Direct Dividend 12.5766
1.70%
0.03 times
Tracking error 0.40%
Standard Deviation 1.57%
Sharpe Ratio 0.03
Portfolio Beta 0.94
Equity - Index
LIC NOMURA MF INDEX FUND - SENSEX PLAN
The main investment objective of the fund is to generate returns commensurate with the performance of the index either Nifty / Sensex based on the plans by investing in the respective index stocks subject to tracking errors.
INVESTMENT OBJECTIVE
PORTFOLIO
Company % of Nav
EQUITY HOLDINGS
Auto 9.92%
TATA MOTORS LTD 3.50%
MAHINDRA & MAHINDRA LTD 2.62%
BAJAJ AUTO LTD 1.55%
MARUTI SUZUKI INDIA LTD 1.24%
HERO MOTOCORP LTD 1.01%
Banks 18.95%
HDFC BANK LTD 7.89%
ICICI BANK LTD 7.83%
STATE BANK OF INDIA 3.23%
Construction Project 4.57%
LARSEN & TOUBRO LTD 4.57%
Consumer Non Durables 14.82%
ITC LTD 11.03%
HINDUSTAN UNILEVER LTD 3.79%
Ferrous Metals 1.87%
TATA STEEL LTD 1.17%
JINDAL STEEL & POWER LTD 0.70%
Finance 8.08%
HOUSING DEVELOPMENT FINANCE CORP LTD 8.08%
Gas 0.91%
GAIL (INDIA) LTD 0.91%
Industrial Capital Goods 1.01%
BHARAT HEAVY ELECTRICALS LTD 1.01%
Minerals/Mining 1.21%
COAL INDIA LTD 1.21%
Non - Ferrous Metals 1.64%
STERLITE INDUSTRIES ( INDIA ) LTD 0.83%
HINDALCO INDUSTRIES LTD 0.80%
Oil 4.11%
OIL & NATURAL GAS CORPORATION LTD 4.11%
Petroleum Products 8.50%
RELIANCE INDUSTRIES LTD 8.50%
Pharmaceuticals 5.27%
SUN PHARMACEUTICALS INDUSTRIES LTD 2.56%
DR. REDDY'S LABORATORIES LTD 1.57%
CIPLA LTD 1.14%
Power 2.74%
NTPC LTD 1.88%
TATA POWER COMPANY LTD 0.87%
Software 13.26%
INFOSYS LTD 6.90%
TATA CONSULTANCY SERVICES LTD 5.17%
WIPRO LTD 1.18%
Telecom - Services 2.36%
BHARTI AIRTEL LTD 2.36%
Equity Holdings Total 99.22%
Cash & Other Receivables
CBLO / REPO 1.31%
NET RECEIVALBES/(PAYABLES) -0.53%
Cash & Other Receivables 0.78%
Grand Total 100.00%
18 MUTUAL INTEREST 2013June,
DISCRETE 12 MONTHS RETRUNS
As on 28 March 2013
POINT TO POINT RETURNS
As on 28 March 2013
Lumpsum investment of 10,000 invested
Period Fund BSE Sensex Nifty
Last 1 Year
Last 2 Years 8,973 8,946 9,077
Last 3 Years 11,135 11,103 11,113
Since Inception 36,717 58,320 54,329
10,881 10,831 10,729
Since Inception13.43% 18.63% 18.44%
(CAGR)
Period Fund BSE Sensex Nifty
Mar 30, 2012 To Mar 28, 2013 8.82% 8.23% 7.31%
Mar 31, 2011 To Mar 30, 2012 -10.26% -10.50% -9.23%
Mar 31, 2010 To Mar 31, 2011 11.35% 10.94% 11.14%
PORTFOLIO ANALYSIS : SECTOR WISE ASSET ALLOCATION

PORTFOLIO ANALYSIS : SECTOR WISE
SCHEME FEATURES
FUND MANAGER
NAV
EXPENSE RATIO :
ANNUAL PORTFOLIO TURNOVER RATIO :
RISK MEASURES
Scheme Type:
Launch Date: November 15, 2002
AUM as on 31/05/2013: INR 28.80 Cr
Load Structure:
Entry Load: Nil
Exit Load: 1% if exit within 1 year from the date of allotment of units
Benchmark: S&P CNX Nifty
Minimum Investment: Rs. 2000/-
Name: Shri Nobutaka Kitajima
For all the plans and options
NAV as on May 31, 2013 Per Unit
Growth 33.3680
Dividend 12.3085
Direct Growth 33.4364
Direct Dividend 12.3280
1.66%
0.28 times
Tracking error 0.69%
Standard Deviation 1.55%
Sharpe Ratio 0.03
Portfolio Beta 0.87
Equity - Index
LIC NOMURA MF INDEX FUND - NIFTY PLAN
The main investment objective of the fund is to generate returns commensurate with the performance of the index either Nifty / Sensex based on the plans by investing in the respective index stocks subject to tracking errors.
INVESTMENT OBJECTIVE
19
DISCRETE 12 MONTHS RETRUNS
As on 28 March 2013
POINT TO POINT RETURNS
As on 28 March 2013
Lumpsum investment of 10,000 invested
Period Fund Nifty Sensex
Last 1 Year
Last 2 Years 9,131 9,077 8,946
Last 3 Years 11,138 11,113 11,103
Since Inception 32,909 54,329 58,320
10,748 10,729 10,831
Since Inception12.23% 17.82% 18.63%
(CAGR)
Period Fund Nifty
Mar 30, 2012 To Mar 28, 2013 7.47% 7.31% 8.23%
Mar 31, 2011 To Mar 30, 2012 -8.68% -9.23% -10.50%
Mar 31, 2010 To Mar 31, 2011 11.38% 11.14% 10.94%
Sensex
PORTFOLIO ANALYSIS : SECTOR WISE
PORTFOLIO
Company % of Nav
EQUITY HOLDINGS
Auto 8.34%
TATA MOTORS LTD 2.86%
MAHINDRA & MAHINDRA LTD 2.29%
BAJAJ AUTO LTD 1.27%
MARUTI SUZUKI INDIA LTD 1.05%
HERO MOTOCORP LTD 0.87%
Banks 22.30%
ICICI BANK LTD 6.86%
HDFC BANK LTD 6.68%
STATE BANK OF INDIA 2.72%
AXIS BANK LTD 2.31%
KOTAK MAHINDRA BANK LTD 1.52%
INDUSIND BANK LTD 1.11%
BANK OF BARODA 0.58%
PUNJAB NATIONAL BANK 0.52%
Cement 3.24%
ULTRATECH CEMENT LTD 0.98%
GRASIM INDUSTRIES LTD 0.94%
AMBUJA CEMENTS LTD 0.72%
ACC LTD 0.59%
Construction 0.78%
JAIPRAKASH ASSOCIATES LTD 0.41%
DLF LTD 0.38%
Construction Project 3.90%
LARSEN & TOUBRO LTD 3.90%
Consumer Non Durables 13.94%
ITC LTD 9.62%
HINDUSTAN UNILEVER LTD 3.18%
ASIAN PAINTS LTD 1.15%
Ferrous Metals 1.59%
TATA STEEL LTD 1.02%
JINDAL STEEL & POWER LTD 0.57%
Finance 8.03%
HOUSING DEVELOPMENT FINANCE CORP LTD 7.11%
INFRASTRUCTURE DEVELOPMENT FINANCE 0.92%
Gas 0.72%
GAIL (INDIA) LTD 0.72%
Industrial Capital Goods 0.83%
BHARAT HEAVY ELECTRICALS LTD 0.83%
Minerals/Mining 1.88%
COAL INDIA LTD 1.07%
NMDC LTD 0.48%
SESA GOA LTD 0.33%
Non - Ferrous Metals 0.69%
HINDALCO INDUSTRIES LTD 0.69%
Oil 3.85%
OIL & NATURAL GAS CORPORATION LTD 2.99%
CAIRN INDIA LTD 0.86%
Petroleum Products 7.34%
RELIANCE INDUSTRIES LTD 6.84%
BHARAT PETROLEUM CORPORATION LTD 0.51%
Pharmaceuticals 5.62%
SUN PHARMACEUTICALS INDUSTRIES LTD 2.05%
DR. REDDY'S LABORATORIES LTD 1.38%
CIPLA LTD 0.98%
LUPIN LTD 0.91%
RANBAXY LABORATORIES LTD 0.31%
Power 3.49%
NTPC LTD 1.65%
POWER GRID CORPORATION OF INDIA LTD 0.84%
TATA POWER COMPANY LTD 0.75%
RELIANCE INFRASTRUCTURE LTD 0.26%
Software 10.94%
INFOSYS LTD 6.00%
TATA CONSULTANCY SERVICES LTD 3.93%
HCL TECHNOLOGIES LTD 1.01%
Telecom - Services 1.86%
BHARTI AIRTEL LTD 1.86%
Equity Holdings Total 99.34%
Cash & Other Receivables
CBLO / REPO 1.30%
NET RECEIVALBES/(PAYABLES) -0.64%
Cash & Other Receivables 0.66%
Grand Total 100.00%
ASSET ALLOCATION

SCHEME FEATURES
FUND MANAGER
NAV
EXPENSE RATIO :
ANNUAL PORTFOLIO TURNOVER RATIO :
RISK MEASURES
Scheme Type:
Launch Date: November 15, 2002
AUM as on 31/05/2013: INR 3.52 Cr
Load Structure:
Entry Load: Nil
Exit Load: 1% if exit within 1 year from the date of allotment of units
Benchmark: BSE Sensex
Minimum Investment: Rs. 2000/-
Name: Shri Nobutaka Kitajima
For all the plans and options
NAV as on May 31, 2013 Per Unit
Growth 34.9707
Dividend 12.3706
Direct Growth 34.9936
Direct Dividend 12.3986
1.70%
0.08 times
Tracking error 0.51%
Standard Deviation 1.45%
Sharpe Ratio 0.03
Portfolio Beta 0.85
Equity - Index
LIC NOMURA MF INDEX FUND - SENSEX ADVANTAGE PLAN
The main investment objective of the fund is to generate returns commensurate with the performance of the index either Nifty / Sensex based on the plans by investing in the respective index stocks subject to tracking errors.
INVESTMENT OBJECTIVE
PORTFOLIO
Company % of Nav
EQUITY HOLDINGS
Auto 8.34%
TATA MOTORS LTD 2.80%
MAHINDRA & MAHINDRA LTD 2.10%
BAJAJ AUTO LTD 1.36%
MARUTI SUZUKI INDIA LTD 1.19%
HERO MOTOCORP LTD 0.90%
Banks 21.35%
HDFC BANK LTD 6.42%
ICICI BANK LTD 6.28%
KOTAK MAHINDRA BANK LTD 3.20%
STATE BANK OF INDIA 2.54%
AXIS BANK LTD 1.55%
BANK OF BARODA 1.36%
Cement 1.49%
AMBUJA CEMENTS LTD 1.49%
Construction Project 4.66%
LARSEN & TOUBRO LTD 3.66%
SADBHAV ENGINEERING LTD 0.99%
Consumer Non Durables 12.01%
ITC LTD 8.97%
HINDUSTAN UNILEVER LTD 3.05%
Ferrous Metals 1.64%
TATA STEEL LTD 1.02%
JINDAL STEEL & POWER LTD 0.62%
Finance 6.55%
HOUSING DEVELOPMENT FINANCE CORP LTD 6.55%
Gas 2.27%
PETRONET LNG LTD 1.47%
GAIL (INDIA) LTD 0.80%
Industrial Capital Goods 0.77%
BHARAT HEAVY ELECTRICALS LTD 0.77%
Minerals/Mining 1.06%
COAL INDIA LTD 1.06%
Non - Ferrous Metals 1.44%
STERLITE INDUSTRIES ( INDIA ) LTD 0.73%
HINDALCO INDUSTRIES LTD 0.71%
Oil 4.09%
OIL & NATURAL GAS CORPORATION LTD 3.20%
CAIRN INDIA LTD 0.89%
Petroleum Products 6.73%
RELIANCE INDUSTRIES LTD 6.73%
Pharmaceuticals 6.30%
LUPIN LTD 2.21%
SUN PHARMACEUTICALS INDUSTRIES LTD 2.06%
DR. REDDY'S LABORATORIES LTD 1.03%
CIPLA LTD 1.00%
Power 2.06%
NTPC LTD 1.30%
TATA POWER COMPANY LTD 0.76%
Software 13.82%
INFOSYS LTD 5.54%
TATA CONSULTANCY SERVICES LTD 4.29%
HCL TECHNOLOGIES LTD 3.06%
WIPRO LTD 0.94%
Telecom - Services 1.81%
BHARTI AIRTEL LTD 1.81%
Equity Holdings Total 96.39%
Cash & Other Receivables
CBLO / REPO 4.02%
NET RECEIVALBES/(PAYABLES) -0.41%
Cash & Other Receivables 3.61%
Grand Total 100.00%
20 MUTUAL INTEREST June 2013,
DISCRETE 12 MONTHS RETRUNS
As on 28 March 2013
POINT TO POINT RETURNS
As on 28 March 2013
Lumpsum investment of 10,000 invested
Period Fund BSE Sensex Nifty
Last 1 Year
Last 2 Years 9,038 8,946 9,077
Last 3 Years 11,064 11,103 11,113
Since Inception 34,736 58,320 54,329
10,830 10,831 10,729
Since Inception12.82% 18.63% 18.44%
(CAGR)
Period Fund BSE Sensex Nifty
Mar 30, 2012 To Mar 28, 2013 8.28% 8.23% 7.31%
Mar 31, 2011 To Mar 30, 2012 -9.60% -10.50% -9.23%
Mar 31, 2010 To Mar 31, 2011 10.64% 10.94% 11.14%
PORTFOLIO ANALYSIS : SECTOR WISE
ASSET ALLOCATION
SCHEME FEATURES
FUND MANAGER
NAV
EXPENSE RATIO :
ANNUAL PORTFOLIO TURNOVER RATIO :
RISK MEASURES
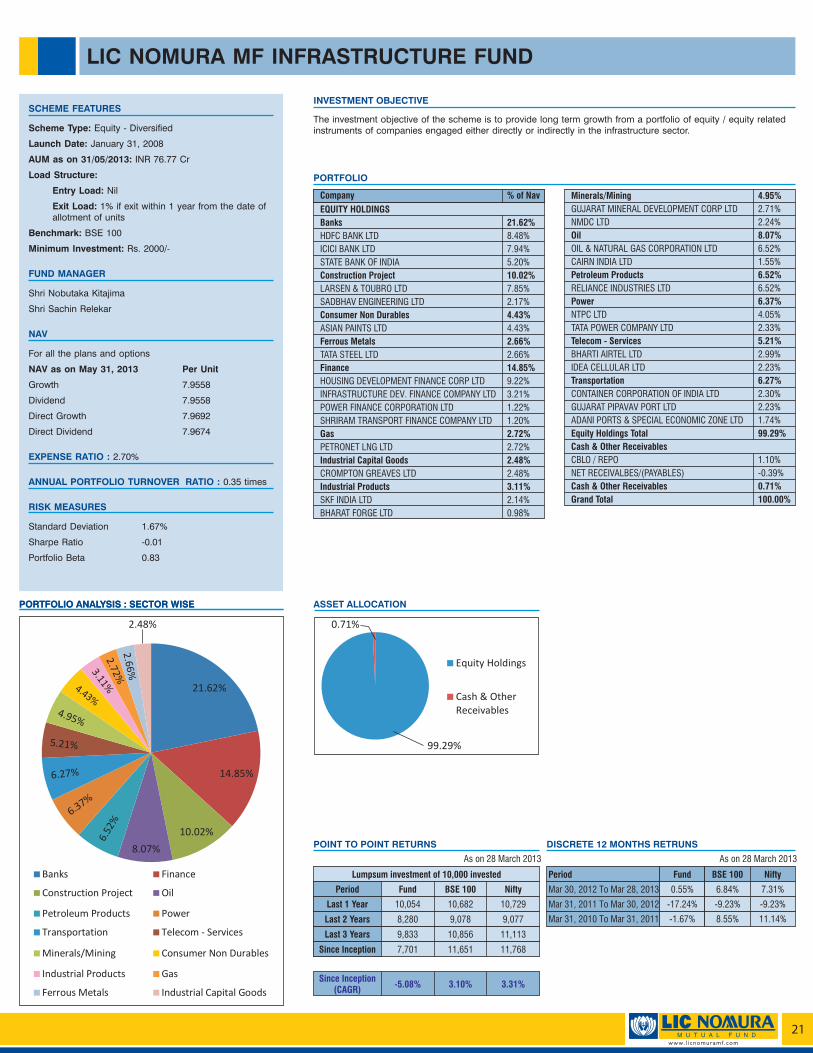
Scheme Type:
Launch Date: January 31, 2008
AUM as on 31/05/2013: INR 76.77 Cr
Load Structure:
Entry Load: Nil
Exit Load: 1% if exit within 1 year from the date of allotment of units
Benchmark: BSE 100
Minimum Investment: Rs. 2000/-
Shri Nobutaka Kitajima
Shri Sachin Relekar
For all the plans and options
NAV as on May 31, 2013 Per Unit
Growth 7.9558
Dividend 7.9558
Direct Growth 7.9692
Direct Dividend 7.9674
2.70%
0.35 times
Standard Deviation 1.67%
Sharpe Ratio -0.01
Portfolio Beta 0.83
Equity - Diversified
LIC NOMURA MF INFRASTRUCTURE FUND
PORTFOLIO ANALYSIS : SECTOR WISE
The investment objective of the scheme is to provide long term growth from a portfolio of equity / equity related instruments of companies engaged either directly or indirectly in the infrastructure sector.
INVESTMENT OBJECTIVE
PORTFOLIO
Company % of Nav
EQUITY HOLDINGS
Banks 21.62%
HDFC BANK LTD 8.48%
ICICI BANK LTD 7.94%
STATE BANK OF INDIA 5.20%
Construction Project 10.02%
LARSEN & TOUBRO LTD 7.85%
SADBHAV ENGINEERING LTD 2.17%
Consumer Non Durables 4.43%
ASIAN PAINTS LTD 4.43%
Ferrous Metals 2.66%
TATA STEEL LTD 2.66%
Finance 14.85%
HOUSING DEVELOPMENT FINANCE CORP LTD 9.22%
INFRASTRUCTURE DEV. FINANCE COMPANY LTD 3.21%
POWER FINANCE CORPORATION LTD 1.22%
SHRIRAM TRANSPORT FINANCE COMPANY LTD 1.20%
Gas 2.72%
PETRONET LNG LTD 2.72%
Industrial Capital Goods 2.48%
CROMPTON GREAVES LTD 2.48%
Industrial Products 3.11%
SKF INDIA LTD 2.14%
BHARAT FORGE LTD 0.98%
21
Minerals/Mining 4.95%
GUJARAT MINERAL DEVELOPMENT CORP LTD 2.71%
NMDC LTD 2.24%
Oil 8.07%
OIL & NATURAL GAS CORPORATION LTD 6.52%
CAIRN INDIA LTD 1.55%
Petroleum Products 6.52%
RELIANCE INDUSTRIES LTD 6.52%
Power 6.37%
NTPC LTD 4.05%
TATA POWER COMPANY LTD 2.33%
Telecom - Services 5.21%
BHARTI AIRTEL LTD 2.99%
IDEA CELLULAR LTD 2.23%
Transportation 6.27%
CONTAINER CORPORATION OF INDIA LTD 2.30%
GUJARAT PIPAVAV PORT LTD 2.23%
ADANI PORTS & SPECIAL ECONOMIC ZONE LTD 1.74%
Equity Holdings Total 99.29%
Cash & Other Receivables
CBLO / REPO 1.10%
NET RECEIVALBES/(PAYABLES) -0.39%
Cash & Other Receivables 0.71%
Grand Total 100.00%
DISCRETE 12 MONTHS RETRUNS
As on 28 March 2013
POINT TO POINT RETURNS
As on 28 March 2013
Lumpsum investment of 10,000 invested
Period Fund BSE 100 Nifty
Last 1 Year
Last 2 Years 8,280 9,078 9,077
Last 3 Years 9,833 10,856 11,113
Since Inception 7,701 11,651 11,768
10,054 10,682 10,729
Since Inception-5.08% 3.10% 3.31%
(CAGR)
Period Fund BSE 100 Nifty
Mar 30, 2012 To Mar 28, 2013 0.55% 6.84% 7.31%
Mar 31, 2011 To Mar 30, 2012 -17.24% -9.23% -9.23%
Mar 31, 2010 To Mar 31, 2011 -1.67% 8.55% 11.14%
PORTFOLIO ANALYSIS : SECTOR WISE ASSET ALLOCATION

DIVIDEND HISTORY
DIVIDEND HISTORY OF LIC NOMURA MF LIQUID FUND
Frequency Record Date Face Value NAV Gross Dividend
Daily April, 2013 7.6507
May, 2013 7.4137
Daily Direct April, 2013 7.6958
May, 2013 7.4725
(Rs.) (Rs.) (Rs.)/unit
DIVIDEND HISTORY OF LIC NOMURA MF G-SEC FUND PF PLAN
Frequency Record Date Face Value (Rs.) Nav (Rs.) Gross Dividend (Rs.)/unit
Quarterly
March 28, 2013 10.0000 1.00
December 27, 2012 10.0000 11.1882 0.25
DIVIDEND HISTORY OF LIC NOMURA MF BOND FUND
Frequency Record Date Face Value (Rs.) Nav (Rs.) Gross Dividend (Rs.)/unit
Quarterly December 03, 2012 10.0000 10.6873 0.20
March 28, 2013 10.0000 0.50
Qtrly Direct March 28, 2013 10.0000 0.50
DIVIDEND HISTORY OF LIC NOMURA MF G-SEC FUND REG. PLAN
Frequency Record Date Face Value (Rs.) Nav (Rs.) Gross Dividend (Rs.)/unit
Quarterly December 03, 2012 10.0000 10.6224 0.15
March 28, 2013 10.0000 0.50
Qtrly Dir March 28, 2013 10.0000 0.50
DIVIDEND HISTORY OF LIC NOMURA MF BALANCED FUND - DIVIDEND PLAN
Frequency Record Date Face Value (Rs.) Nav (Rs.) Gross Dividend (Rs.)/unit
Monthly ,
Monthly Dir March 28, 2013 10.0000 0.2500
March 28 2013 10.0000 0.2500
22 MUTUAL INTEREST 2013June,
DIVIDEND HISTORY OF LIC NOMURA MF FLOATER MIPFrequency Record Date Face Value (Rs.) Nav (Rs.) Gross Dividend (Rs.)/unit
Monthly March 26, 2013 10.0000 0.1000
April 25, 2013 10.0000 0.0700
May 22, 2013 10.0000 0.1000
Quarterly December 27, 2012 10.0000 10.6988 0.2000
March 28, 2013 10.0000 0.3000
Qtrly Direct March 28, 2013 10.0000 0.3000
Yearly March 27, 2012 10.0000 10.5661 0.3000
March 28, 2013 10.0000 0.3000
Yearly Direct March 28, 2013 10.0000 0.3000
Fund Manager’s PerformanceFund Manager - Mr. Killol Pandya
Scheme Name 1-year Return
LIC Nomura MF Qtly-Inv-2-Reg(G) 9.1942
LIC Nomura MF Qtly-Inv-1-Reg(G) 8.9570
LIC Nomura MF Mthly-Inv-1-Reg(G) 8.8536
Scheme Name 1-year Return
LIC Nomura MF Income Plus(G) 8.0550
LIC Nomura MF Savings Plus(G) 7.9966
LIC Nomura MF FRF-STP(G) 7.7104
Top 3
Bottom 3
Fund Manager - Mr. Y. D. Prasanna
Scheme Name 1-year Return
LIC Nomura MF Bond(G) 10.7670
LIC Nomura MF G-Sec-Reg(G) 10.4743
LIC Nomura MF Annual-Inv-1-Reg(G) 9.2889
Scheme Performance
Fund Manager - Mr. Nobutaka Kitajima
Scheme Name 1-year Return
LIC Nomura MF Index Fund-Sensex Plan(G) 22.5444
LIC Nomura MF Index Fund-Nifty Plan(G) 21.6469
LIC Nomura MF Index Fund-Sen Adv Plan(G) 21.4897
Scheme Name 1-year Return
LIC Nomura MF Equity Fund(G) 17.2919
LIC Nomura MF Tax Plan(G) 16.6643
LIC Nomura MF Infra Fund(G) 14.4407
Top 3
Bottom 3
Fund Manager - Mr. Surendra Jalani
Scheme Name 1-year Return
LIC Nomura MF Balanced Fund(G) 17.8664
LIC Nomura MF ULIS 16.9155
LIC Nomura MF Children(G) 14.7187
LIC Nomura MF MIP(G) 10.2648
LIC Nomura MF Floater MIP(G) 9.4650
Top 3
Bottom 2
DIVIDEND HISTORY OF LIC NOMURA MF SAVINGS PLUS FUND
Frequency Record Date Face Value (Rs.) Nav (Rs.) Gross Dividend (Rs.)/unit
Daily April, 2013 0.0679
May, 2013 0.0609
Daily Direct April, 2013 0.0741
May, 2013 0.0653
Weekly April, 2013 0.0721
May, 2013 0.0555
Weekly Direct April, 2013 0.0769
May, 2013 0.0594
Monthly April, 2013 10.0000 0.0625
May, 2013 10.0000 0.0539
Monthly Direct April, 2013 10.0000 0.0616
May, 2013 10.0000 0.0572
DIVIDEND HISTORY OF LIC NOMURA MF FLOATING RATE FUND - STP
Frequency Record Date Face Value (Rs.) Nav (Rs.) Gross Dividend (Rs.)/unit
Daily April, 2013 0.0667
May, 2013 0.0566
Daily Direct April, 2013 0.0713
May, 2013 0.0587
Weekly April, 2013 0.0726
May, 2013 0.0431
Weekly Direct April, 2013 0.0609
May, 2013 0.0624
DIVIDEND HISTORY OF LIC NOMURA MF MONTHLY INCOME PLAN
Frequency Record Date Face Value Nav Gross Dividend (Rs.)/unit
Monthly May 22, 2013 10.0000 0.1000
Monthly Dir. May 22, 2013 10.0000 0.1000
Quarterly March 28, 2013 10.0000 0.3000
Quarterly Dir. March 28, 2013 10.0000 0.3000
Yearly June 14, 2011 10.0000 10.5401 0.3500
March 28, 2013 10.0000 0.5000
Yearly Direct March 28, 2013 10.0000 0.5000
(Rs.) (Rs.)
DIVIDEND HISTORY OF LIC NOMURA MF INCOME PLUS FUND
Frequency Record Date Face Value (Rs.) Nav (Rs.) Gross Dividend (Rs.)/unit
Daily April, 2013 0.0631
May, 2013 0.0588
Daily Direct April, 2013 0.0655
May, 2013 0.0611
Weekly April, 2013 0.0534
Weekly Direct April, 2013 0.0699
May, 2013 0.0554
Monthly April, 2013 0.0579
May, 2013 0.0517
Monthly Direct April, 2013 0.0600
May, 2013 0.0536

GLOSSARY OF TERMS :
Sharpe Ratio: Sharpe Ratio is a measure of the excess return (or Risk Premium) per unit of risk in an investment asset. It is the average return minus the risk-free return divided by the standard deviation of return on an investment.
Tracking error: Tracking error is a measure of how closely a portfolio follows the index to which it is benchmarked. The most common measure is the root-mean-square of the difference between the portfolio and index returns.
Volatility: Volatility is a measure for variation of price of a financial instrument over time. It is a representation of the risk associated with price-fluctuations of a given asset or the risk of a portfolio of assets.
Portfolio Beta: Beta of a portfolio is a number describing the relation of its returns with those of the financial market as a whole. It is a measure of systematic risk.
R-Squared: It describes the fraction of investment risk in a portfolio that can be associated with market or systematic risk
Average maturity: The average maturity of a portfolio equals weighted average of maturities for all instruments in the portfolio.
Duration: Duration measures price sensitivity of the portfolio to changes in the yield.
Systematic Investment PlanBig happiness comes in small investments with
4th Floor, Industrial Assurance Bldg., Opp. Churchgate Station, Mumbai - 400 020. Tel.: 022 - 22851661
Mutual Fund investments are subject to market risks, read all scheme related documents carefully.

Investment Manager:
LIC NOMURA MUTUAL FUND ASSET MANAGEMENT COMPANY LIMITED
AREA OFFICES
BUSINESS CENTRE
Pri
nte
d a
t:
Pri
nta
nia
Offse
t P
vt.
Ltd
.
PLACE ADDRESS LANDLINE MOBILE
AHMEDABAD Jeevan Sadan, 3rd Flr, LIC Bldg, Opp. Capital Commercial Center, AHMEDABAD - 380006. 079-26588301 9375090006 / 9924403147 / 9328638838
BANGALORE No.4, Canara Mutual Building (Opp. Cash Pharmacy), 2nd Floor, Residency Rd, BANGALORE-560025. 080-22210180 / 22118478 9845172957 / 9972092957 / 9986500721 / 9880058223 /
9902088717 / 9844750711 / 9482081121
BHUBANESHWAR SCR-B/19, Indradhanu Market, IRC Village, BHUBANESHWAR-751015. 0674-2554094 9437569719
CHENNAI 15, Anna Salai, Next to V.G.P. Bldg., CHENNAI - 600002. 044-28411984 / 28555883 9382315850 / 9500038285 / 9361555562
DEHRADUN 110, Tagore Villa, Chakrata Road, DEHRADUN - 248 001 0135 - 2650749 9412965570 / 9410702598 / 8410010025 / 9897056231
ERNAKULAM 11th Floor, Jeevan Prakash, M.G. Road, Ernakulam, KOCHI - 682011 0484-2367643 9895036554 / 9745612888 / 9388755722
GOA T 9/10, 3rd floor, Alfran Plaza, Opp. Don Bosco High School, M. G. Road, Panaji, GOA-403001. 0832-2420561 8600107698 / 9890711551 / 9370643076 / 9763129289
GUWAHATI LIC of India, Jeevan Deep Building, M. L. Nehru Road, Panbazar, GUWAHATI -781 001 0361 - 2735323 9435769432
HUBLI 2nd Floor, LIC Bldg., Beside HPO, Lamington Road, HUBLI - 580020. 0836 - 4260523 / 4262092 980058223 / 9845205168
HYDERABAD House No. 5-9-57, 4th Floor, Jeevan Jyoti Building, Basheerbagh, HYDERABAD - 500029. 040-23244445 / 23210572 8897656665 / 9000444850 / 9000550850
INDORE U.V. House, 1st Floor, Snehil 9/1-A South Tukoganj, INDORE - 452001. 0731-2520262 / 4069162 9589050250 / 8827344195 / 9981511435
JAIPUR 327 - A, 3rd floor, Ganpati Plaza, M. I. Road, JAIPUR - 1. 0141-5112620 9461658875 / 9829098323 / 9929095005
KANPUR Jeevan Vikas, Ground Floor, 16/98, M.G. Road, KANPUR - 208001. 0512-2360240 / 3244949 7275430214 / 9451448305 / 9984006600 / 9838038440 /
9389052340 / 9889085736
KOLKATA Ground Floor, Hindustan Building Annexe, 4, Chittaranjan Avenue, KOLKATA - 700072. 033-22129455 / 22128680 9830690000 / 9932877925 / 9432391810 / 9339531895 /
9830689965 / 9903495703 / 9051068127
LUCKNOW 7th Floor, Jeevan Bhavan 2, Naval Kishore Road, Hazrat Ganj, LUCKNOW - 226 001 0522-2231186 / 4045203 9651534267 / 8858235350 / 9455060457
LUDHIANA Rm No. 102-103, 1st Fl, S.C.O. 18, Opp. Stock Exch., Feroze Gandhi Mkt, LUDHIANA-141 001. 0161 - 2405805 9888111190 / 9915099333 / 9914720500
MADURAI 2nd Floor, LIC Bldg., Door No. 3, West Marret Street, MADURAI - 625 001 0452 - 2345700 9094687733
MANGALORE No. 6, Gr. Floor, Popular Building, K S Rao Road, MANAGALORE - 575 001 0824 - 2411482 9845190466 / 9742726012
MUMBAI Gr. Floor, Industrial Assurance Bldg., Opp. Churchgate Station, MUMBAI - 400020. 022-22885971 / 22817162 / 63 9930718555 / 9325523480 / 9769028905 / 9820137844 /
9930957772 / 9820469996
NAGPUR Jeevan Seva Bldg., Mount Road, Sadar, NAGPUR - 440 001. 0712 - 2542497 9422113800 / 9021426397 / 9011412206 / 9373539939 /
9422104130 / 9423406727 / 9860207510
NASHIK Shop No.2, Ground Floor, Rajvee Enclave, New Pandit Colony, NASHIK - 422002. 0253-2579507 9922996155 / 9823366379 / 9595075700
NEW DELHI 7th Floor, Jeevan Prakash, 25 K.G. Marg, NEW DELHI - 110001. 011-64663650/ 9811464244 / 9818610867 / 9818630124 / 9811464244 /
23359190 / 23314396 9891736008 / 9971672830 / 9717765151 / 7838637303 /
9891785037 / 9818280698
PATNA Ground floor, Jeevan Jyothi Bldg. Exhibition Road, PATNA - 800001. 0612-2501157 9431447848 / 9431023274 / 9507151965
PUNE LIC of India, Pune D.O.-I,6/7, Shivaji Nagar,University Road, PUNE - 411 005 020 - 25537301 9423447604 / 9767868611
RAIPUR C-29/A, Sector 1, Besides City Centre Mall, Devendra Nagar, RAIPUR - 492001 C.G. 0771-2236780/4051137 9425026437 / 9329100009
RAJKOT 703, Star Chamber, Harihar Chowk, RAJKOT - 360 001. 0281 - 2230626 8690444022 / 9898733233
RANCHI Narsaria Tower, 2nd Floor, Opp. Lalpur Police Station, Post Lalpur, RANCHI -834001. 0651-2206372 8986771069 / 9835197681 / 9835708803
AGRA : 9927888854AHMEDNAGAR : 9422238925AJMER : 9829077674AKOLA : 9422862120ALAPUZHA : 9447367160ALLAHABAD : 9918971258AMRAVATI : 9923025535 /
8657045588AMRITSAR : 9814299747AURANGABAD : 9923797207BANKURA : 9378330300BEHRAMPORE : 9861546580BELGAUM : 9916140315BELLARY : 9900026952BILASPUR : 9302606248BHAGALPUR : 9431609765BHILAI : 9303808855BHILWARA : 9829287273BHOPAL : 9302441980BHUJ : 9377713665
Mobile No.Name of Place Mobile No.Name of Place Mobile No.Name of Place Mobile No.Name of PlaceMobile No.Name of Place
BIKANER : 9829791132BOKARO : 9955189443BURDWAN : 9831712244CHANDIGARH : 9316065681
9817232224CHANDRAPUR : 9422180081COIMBATORE : 0422-4393989DALTONGANJ : 9162780200DAVANGERE : 9900026952DEOGHAR : 9430155378DHANBAD : 9835334495FAIZABAD : 9935448800GAYA : 9470854005GONDIA : 9890435020GORAKHPUR : 9336833448GULBARGA : 9900144196GURGAON : 9654228220/
9555542768GWALIOR : 9406586454HALDWANI : 9839976747
HASSAN : 9986125091JABALPUR : 9407606313JAGDALPUR : 9303354452JALGAON : 9422211343JAMMU : 9419213201JAMSHEDPUR : 9234620669JHANSI : 9760016559JODHPUR : 9829947974KARIMNAGAR : 9000444853KARWAR : 9611111028KHARAGPUR : 9531509342KOLHAPUR : 9822851948KOTA : 9829905879KOTTAYAM : 9656010033KOZHIKODE : 9349739890MADIKERI : 9742707041MALDA : 9832635563MEERUT : 9319267811MEHSANA : 9979533536MORADABAD : 9454993170
MYSORE : 9986117183MUZAFFARPUR : 9431813155NANDED : 9822203503 /
9890691021NELLORE : 9000444854NOIDA : 0120-2544423PANIPAT : 0180-2648709PONDHICHERRY : 7708007363RAJAHMUNDRY : 9000171857SAHARANPUR : 9896455020SALEM : 9944744424SAMBALPUR : 9937040031SATARA : 9423192029SATNA : 9300757593SHAHDOL : 9303822916SHILLONG : 8575020727
8721942675SHIMLA : 9318960005SHIMOGA : 9902007686
08182-228386
SURAT : 99788626269925027406
SILIGURI : 98830967679641022228
THANE : 9702882224THRISSUR : 9388110220TIRUNELVELI : 9655505105TRICHY : 9842524130TRIVANDRUM : 9388088066UDAIPUR : 9784011432UDUPI : 9742726012VADODARA : 9327494916VAPI : 9377566652VARANASI : 9336501004VISHAKHAPATNAM : 9000444851VIJAYWADA : 9000444856WARANGAL : 9000171858YAVATAMAL : 9503736144
Mutual Fund investments are subject to market risks, read all scheme related documents carefully.
V i s i t u s a t w w w . l i c n o m u r a m f . c o m l T o l l F r e e N o . 1 8 0 0 2 5 8 5 6 7 8
4th Floor, Industrial Assurance Bldg., Opp. Churchgate Station, Mumbai 400 020. Tel. : 22851661Fax : 22880633 E-mail: [email protected]